Abstract
The spatial and temporal variabilities of the daily Sunshine Duration (SSD) time series from the Chinese Meteorological Administration during the 1954–2009 period are examined by the Detrended Fluctuation Analysis (DFA) method. As a whole, weak long-range correlations (LRCs) are found in the daily SSD anomaly records over China. LRCs are also verified by shuffling the SSD records. The proportion of the stations with LRCs accounts for about 97% of the total. Many factors affect the scaling properties of the daily SSD records such as sea-land difference and Tibetan Plateau landform and so on. We find land use and land cover as one of the important factors closely links to LRCs of the SSD. Strong LRCs of the SSD mainly happen in underlying surface of deserts and crops, while weak LRCs occur in forest and grassland. Further studies of scaling behaviors are still necessary to be performed due to the complex underlying surface and climate system.
1. Introduction
The Sunshine Duration (SSD) is the oldest way to measure radiation and is defined as the amount of time from a sunshine recorder not sheltered by natural weather phenomena such as clouds, haze and fog [1]. The SSD refers to the time when the sun shines directly onto the earth in a day. In summer, the SSD in the north of China is more than that in the south of China. In addition, the higher the latitude, the greater the variation of day and night length. There are more the SSDs in the Tibet Plateau characterized by high altitude, thin air and sunny weather than in the Sichuan basin, caused by much more water vapor and restricted topography. It is of great practical significance for the development of clean energy, the rational distribution of agricultural production and the treatment of environmental pollution by defining the spatial and temporal distribution of the SSD and the characteristics of climate change.
The main purpose of studying the daily SSD data records is to characterize the regional climate changes and describe the past weather conditions. It is of great significance to study the long-term changes of the SSD because the SSD plays a key role in the physical and chemical processes of the earth’s surface [2]. Meteorological stations of the SSD over China have been built since 1954, and records for most of them are available from 1954 to 2009. There are few studies on scaling behaviors of the SSD due to its high irregularity and sparse observation records. The research on long-range correlations (LRCs) of the SSD daily time series is conducive to understand climate and environmental changes.
Many studies focused on solar radiation estimation used the SSD. Benso et al. (1984) [1] estimated daily and monthly direct, diffuse and global solar radiation from the SSD. Gopinathan (1988) [3] used Ångström type correlations to estimate the regression coefficients in order to predict global solar radiation on a horizontal surface. He considered the regression coefficients expressed in terms of the latitude, elevation, and percent of possible sunshine were valid in any location around the world. Akpabio and Etuk (2003) [2] established a correlation equation to analyze the relationship between global solar radiation and the SSD for Onne, Nigeria. Almorox and Hontoria (2004) [4] used the SSD to estimate global solar radiation in Spain. Che et al. (2005) [5] applied the data records for daily surface solar radiation and the monthly SSD to evaluate trends in Chinese global radiation and so on. They came to the conclusion that there were significant decreases in global radiation, direct radiation, and the percentage of the possible SSD, but an increase in the diffuse fraction. Wang and Zhang (2010) [6] investigated the relationship between global solar radiation and the SSD for Northwest China.
Some other studies concentrated on the variations and trends of the SSD. Aksoy (1999) [7] found that decreases of the hourly SSD in Ankara, Turkey, seemed to be highest at sunrise and sunset and were related to changes in other meteorological variables. Kaiser and Qian (2002) [8] revealed significant decreasing trends in the SSD since about 1980 over most of China. Liu et al. (2002) [9] found a reduction in the SSD over Taiwan. Zheng et al. (2008) [10] indicated that the annual SSD decreased with the negative trends, mostly north of 24° N over the Yunnan-Guizhou Plateau and increased with the positive trends at the stations concentrated on the southwest Yunnan-Guizhou Plateau during the 1961–2005 period. Yang et al. (2009) [11] considered that the highest downward trend of the SSD occurred in summer and the lowest downward trend in winter over northern China. All these conclusions prove that the SSD is very important for climate and environmental change research.
Traditional analysis methods such as auto-correlation function and the power spectrum analysis may give rise to false detection of LRCs and lead to spurious results due to the non-stationarity of time series. The detrended fluctuation analysis (DFA) method can eliminate possible trends and misinterpretations in the data records. DFA is a well-established method in determining the scaling behaviors of the time series. Peng et al. (1994) [12] applied the DFA method to explore DNA sequences. The DFA method was further extended by Bunde et al. (2000) [13] and Kantelhardt et al. (2001) [14] The DFA method has been applied in many studies such as temperature records [15,16,17,18,19,20,21,22], precipitation process [23], relative humidity records [24], Sea Surface Temperature (SST) [25,26], among many others.
The aim of this study is to analyze spatio-temporal variations of LRCs from the daily SSD time series over China. We organize this paper as follows. In Section 2, we introduce the SSD and present the method. The results are analyzed by applying the DFA method in Section 3. Finally, conclusions and discussions are stated in Section 4.
2. Data Records and Method
2.1. Data Records
The SSD is one of the meteorological factors that describe strong or weak solar radiation. The SSD is the time when the irradiance of the sun is perpendicular to the plane of its rays above or equal to 120 W/m−2. The SSD is closely related to cloud cover and atmospheric transparency. The change of the SSD is closely related to human production and the growth and development of animals and plants, and is inseparable from the use of agricultural light resources. It is of great significance to understand the characteristics of climate change and the causes of changes in the SSD for rational development of light energy resources and understanding of its impact on agriculture.
The daily sunshine duration records are from the Chinese National Meteorological Information Center (CNMIC). Some observation stations are eliminated due to short time coverage or a lack of the valid values. In this study, 615 high quality meteorological observation stations are selected for analyzing the LRCs over China. The time span of the data sets is over 50 years (1954–2009). In fact, some other data sets such as air temperature, ground temperature and precipitation time series from CNMIC have been analyzed in related studies [27].
To detect long-term persistence of the daily SSD time series, we remove the seasonal trends in the raw time series. Given a raw SSD time series xi, we calculate the anomaly values from the raw data sets by the formula Δxi = xi − <xi>d, where < >d is the mean value of the raw time series xi on a given calendar day. The aim is to eliminate the annual cycle of the raw SSD time series xi and further overcome the non-stationary effects on long-term persistence of the daily sunshine duration anomaly (SSDA) time series. We also eliminate the missing values from the raw SSD time series because the scaling behaviors cannot be affected by cutting out segments and stitching together the remaining parts [28].
2.2. The DFA Method
The DFA method is mainly based on the following steps [14].
- In order to investigate the correlation characteristics in the SSD time series, xi, i = 1…N, N is the length of the time series. The SSD anomaly time series is integrated to obtain profile Y(i), and I = 1, …, N, is then obtained as follows.∆xk is the SSD anomaly time series from which the annual cycle is removed. The profile Y(i) is cut into Ns ≡ [N/s] non-overlapping segments with equal length s in order to carry out the fluctuation analysis. The part of a segment of length s will be left if N is not equal to an integer multiple of length s. The same procedure is recalculated starting from the end of the data records. Accordingly, the profile is performed twice in order to use all data records. We obtain 2Ns segments altogether [14,29].
- The local trend Pn(i) in each box of length s is calculated by a least-squares fit of the data records. Then, the integrated time series Yn(i) is detrended by subtracting the local trend.In the data sets of each segment, a least-square fit is used to calculate the local trend of each segment. K = 1,…, . In the nth order DFA (DFA1, DFA2,…, DFAn), the order n of the polynomials is used in the fitting procedure. Trends of nth order in the profile and (n − 1)th order in the original record are eliminated. By doing so, the trends of the profile are eliminated by subtracting the local polynomial fit. A comparison of the results for different orders of DFA allows us to estimate the strength of the trends in the time series.Yn(i) = Y(i) − Pn(i)
- The root-mean-square deviation of the profile from these local polynomial fits determines the deviation F(s) for a given n-size box.We obtain the fluctuation functions F(n)(s) by diverse detrending orders n.Finally, for long-range correlated data records, follows a power-law relationship and increases with time window s. The power-law relationship can be exhibited by a linear log-log plot, where α is the scaling exponent. In this method, the scaling exponent α taking values from 0 to 1 (0 < α < 1) allows the measure of LRCs for the time series as follows.
- If α = 0.5, Gaussian random walks.
- If 0.5 < α < 1, positive LRCs are indicated and the time series is persistent.
- If 0 < α < 0.5, the time series is anti-persistent.
3. Results
We select two observation stations well separated spatially to detect the scaling properties of the daily SSDA records. One station called Chuxiong is located in southwestern China. The other is Baoqing situated in northeastern China. The temporal variations before and after shuffling the daily SSDA records are shown in Figure 1. The irregular high frequency fluctuations occur in all four SSDA records. There exist more obvious periodical changes before shuffling the daily SSDA records in Figure 1b,d than those after shuffling the data sets in Figure 1a,c. The standard deviation σ = 3.79 at station Baoqing is larger than that σ = 3.29 at station Chuxiong, which implies the likelihood of a higher extreme event occurring at Baoqing.
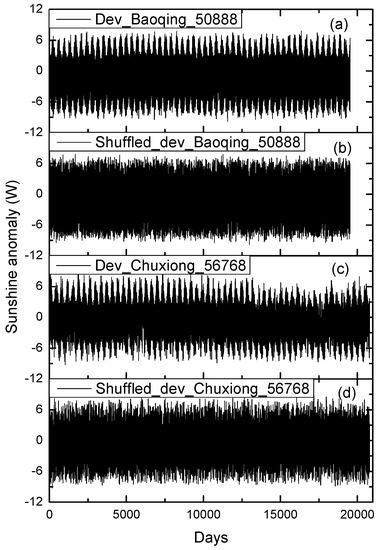
Figure 1.
Temporal evolutions of the SSDA during the time from 1954 to 2009 at station Baoqing and Chuxiong. (a) Station Baoqing before shuffling the SSDA. (b) Station Baoqing after shuffling the SSDA. (c) Station Chuxiong before shuffling the SSDA. (d) Station Chuxiong after shuffling the SSDA.
The profiles before and after shuffling the SSDA records are exhibited in Figure 2. It can be clearly seen that the profile before shuffling the SSDA records at Chuxiong presents a significant change of first a rise and then a decrease, similar to the shape “^”. This illustrates that there exist obvious negative linear trends and persistence characteristics for the profile. However, there are no obvious trend changes for the profile before shuffling the SSDA records at Baoqing, which indicates weak persistence. The profiles after shuffling the SSDA records show random changes just as expected.
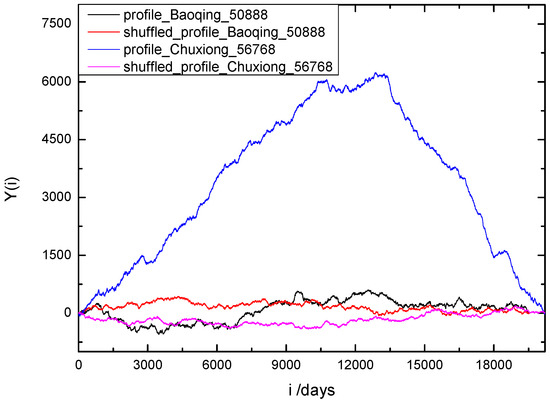
Figure 2.
Profiles before and after shuffling two SSDA records during the time from 1954 to 2009 for stations Baoqing and Chuxiong.
Next, we compare the slopes using the different orders of the DFA method in order to estimate trend intensity at stations Baoqing and Chuxiong for all time scales. There exist similar slopes for both the SSDA time series by DFA1-3. The slope α = 0.57 is lower at Baoqing than that (α = 0.67) at Chuxiong. The results show that there exists strong long-term memory of the daily SSDA time series at Chuxiong. Considering the similar slopes using DFA1-3, we analyze the scaling behaviors by DFA2. The SSDA records are shuffled to verify persistent features at stations Baoqing and Chuxiong. The value of the slope is about 0.51 as shown in the blue line of Figure 3, which implies there are long-range correlations for the daily SSDA time series at Baoqing and Chuxiong. Positive long-range correlations seem to exceed one decade.
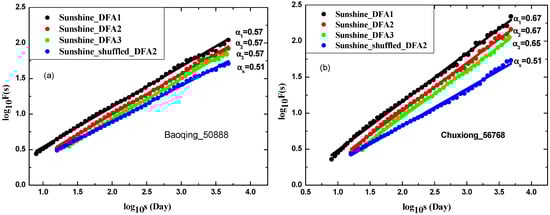
Figure 3.
The log-log plots between the detrended variability F(s) and the time scale s before and after shuffling two SSDA records at (a) station Baoqing. (b) staion Chuxiong. Solid lines are a linear fit.
To detect the long-term persistence of the SSD anomaly time series over China, the trends and correlations can be eliminated by shuffling the SSD records. The effect of the correlation represented by alpha will disappear if it is a long temporal trend in the SSD data records, but it will remain if it corresponds to the presence in the tail of the distribution after the SSD is shuffled. A significance test at the 95% confidence level is performed to verify long-term persistence of the daily SSDA records for stations Baoqing and Chuxiong. The values in DFA-exponents are obtained by shuffling the SSDA records 10,000 times. The specific process of shuffling is as follows. Firstly, the total time length of the data records that is going to be shuffled is N. The N/2 pairs (m, n) (m, n ≤ N) that do not repeat each other are randomly generated based on an integer less than N. Secondly, two values m and n are interchanged. Finally, repeat the above two steps 20N times and cause the order to be completely disrupted. In order to avoid systematic errors in the random seed generator, each random seed in the shuffling process uses a different value. By doing this, the values of the raw time series remain constant, but there is random shuffling of the order between each data record. Therefore, the probability density distribution of the raw time series is maintained, but its original correlation and trend are eliminated.
Figure 4 shows the gauss fit of scaling exponents after shuffling the SSDA records 10,000 times using DFA2. The values in DFA-exponents range from 0.42 to 0.58, and the interval threshold at the 95% confidence level is from 0.47 to 0.53 for two observation stations. The slopes, α = 0.57 for station Baoqing and α = 0.67 for station Chuxiong, are higher than the upper range value of α = 0.53 of the significance test at the 95% confidence level, which verifies that there exists long-term persistence of the daily SSDA records at station Baoqing and station Chuxiong. The probability density distributions of scaling exponents for the two stations are almost the same and exhibit a similar normal distribution.
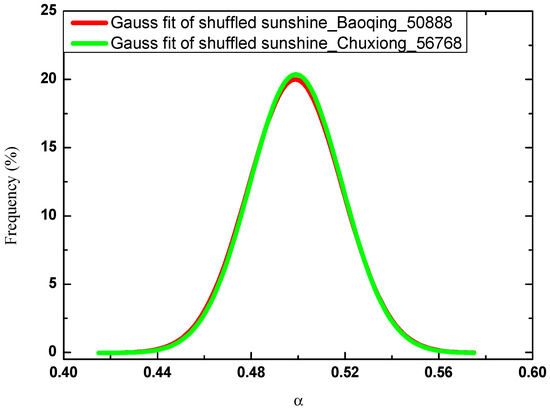
Figure 4.
The Gaussian fit of frequency in DFA-exponents after shuffling the SSDA records 10,000 times at stations Baoqing and Chuxiong.
Due to the existence of trends such as the seasonal cycle and crossover effects, the trends from the raw data need to be removed in order to obtain intrinsic natural variability of the time series. To test the long-term persistence over China, we remove the trends by shuffling the daily SSDA time series for all meteorological observation stations. See Figure 5a; the Gaussian fit of frequency distributions for DFA-exponents for 615 meteorological observation stations was investigated before and after shuffling the SSDA records. The average value for DFA-exponents is 0.59 before shuffling the SSDA records for all stations and 0.5 after that. The maximum distributions of relative frequency of the DFA-exponents before and after shuffling the SSDA records reach about 29% and 25% of the total, respectively. The distribution of relative frequency is more concentrated after shuffling the SSDA records than that before. Moreover, the Gaussian fit of DFA-exponents shifts toward large values before shuffling the SSDA records. In addition, the variations of the scaling exponents before and after shuffling the SSDA records for all stations are shown in Figure 5b. The values of DFA-exponents for all stations are higher before shuffling the SSDA records compared with those after shuffling the SSDA records. The results show that there exist long range power-law correlations for all the SSDA records at different time scales over China.
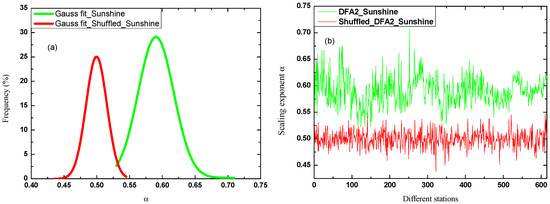
Figure 5.
(a) Gaussian fit of the scaling exponents before and after shuffling the SSDA records for 615 stations across China. (b) The variations of the scaling exponents.
The range of the uncertainty estimation at the 95% confidence level is from 0.47 to 0.53 for the daily SSDA records across China. We select the interval threshold 0.06 as a basis for segmentation of scaling exponents. See Figure 6; the values of the DFA-exponents are separated into four non-overlapped intervals ranges: 0.522–0.53, 0.5301–0.59 and 0.5901–0.65, and 0.6501–0.71. The values below 0.53 and above 0.65 are rather limited. The number of the observation stations, for which the values are less than 0.53, accounts for about 1% of the total, while those larger than 0.65 account for about 2% of the total. The values of the DFA-exponents between 0.53 and 0.65 account for about 97% of the total, which imply positive long-range power-law correlations of the daily SSDA records in almost all cases across China.
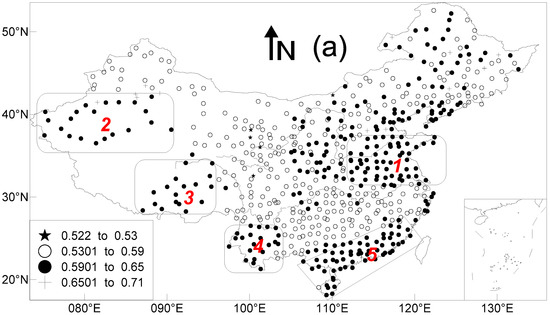
Figure 6.
(a) The spatial distributions of scaling exponents for the daily SSDA time series over China; (b) The spatial distributions of land use category for the daily SSDA time series over China.
Although there is a mixing of exponent values according to their spatial distribution, there are dominant values at specific areas. The high values for DFA-exponents larger than 0.59 are mainly located in area 1–5 in Figure 6a, where there exists strong long-term persistence for the daily SSDA records. The values of the DFA-exponents between 0.53 and 0.65 account for about 97% of the total. These results imply that there are positive long-range power-law correlations of the daily SSDA records at all examined cases, over China. Such different spatial distributions of DFA-exponents show the irregular and nonlinear characteristics of the daily SSDA records over China.
According to the map of land cover in Figure 6b, we find there exists a good match between the spatial distributions in DFA-exponents and different underlying surface types. Strong LRCs of the SSDA mainly occur in land use categories of desert and crop located in area 1 and area 2 over China. Without a doubt, there are many other possible factors contributing to the spatial diversities of long-term persistence such as the Tibetan Plateau landform (area 3 in Figure 6b), southwestern monsoon (area 4), sea-land-air interaction (area 5) and so on. The specific mechanism of temporal and spatial variations of DFA-exponents needs to be investigated further.
4. Discussion and Conclusions
Spatio-temporal diversities of long-term persistence of the daily SSDA time series are analyzed by the DFA method from 615 weather stations across China in this paper. The average value of the scaling exponent is 0.59 for all weather stations. On the whole, there exist weak long-range power-law correlated characteristics as a result of a low value for the daily SSDA records. These results on the long-term persistence of the SSD have important significance for research on climate variability. The positive persistence in the past 50 years of the SSD records may imply a long-lasting persistence in the future. Long-term persistence characteristics of the SSD over China are of great use for agriculture, the surface heat balance and climate change.
The long-term persistence is verified by shuffling the daily SSDA records over China. Among all 615 weather stations, the values of the DFA-exponents lower than 0.53 show random behavior only at five weather stations according to the upper bound of interval threshold at the 95% confidence level. Positive long-range power-law correlations are found in different time scales for almost all of stations, where the proportion accounts for about 97% of the total.
The scaling behaviors of the daily SSDA records can be affected by many factors such as the Asian monsoon system, sea-land difference and Tibetan Plateau landform. Furthermore, land use and land cover seems to be important factors influencing the spatial distributions of long-term persistence for the daily SSDA records over China. The results show that there is a good correspondence between the spatial distributions of scaling exponents and different underlying surface features. Strong long-term persistence characteristics of the daily SSDA time series occur mainly in southern China, parts of northern China and eastern China, Tibetan Plateau, Yunnan province, and south Xinjiang, which correspond to desert and crop in terms of land use categories. However, the DFA-exponents with relative low values are in the underlying surface areas of forest and grassland, where the results indicate weak long-term persistence characteristics for the daily SSDA time series over China.
Author Contributions
Formal analysis, L.J.; Investigation, L.J.; Methodology, Y.F.; Validation, J.Z.; Writing—Original Draft, L.J.; Writing—Review & Editing, Y.F.
Funding
This research was funded by the National Key Research and Development Program of China (2016YFC0209000), the National Natural Science Foundation Committee of China (41875181; 21805135), the Natural Science Foundation of Jiangsu Province (BK20180712), Opening Foundation of the key laboratory of synthetic and biological colloids (JDSJ2018-11), the Startup Foundation for Introducing Talent of NUIST (2014r18) and Top-notch Academic Programs Project of Jiangsu Higher Education Institutions PPZY2015B155, TAPP. The authors also express their great appreciation to the editor and the anonymous referees for their valuable suggestions.
Conflicts of Interest
The authors declare no conflict of interest.
References
- Benson, R.B.; Paris, M.V.; Sherry, J.E.; Justus, C.G. Estimation of daily and monthly direct, diffuse and global solar radiation from sunshine duration measurements. Sol. Energy 1984, 32, 523–535. [Google Scholar] [CrossRef]
- Akpabio, L.E.; Etuk, S.E. Relationship between global solar radiation and sunshine duration for Onne, Nigeria. Turk. J. Phys. 2003, 27, 161–167. [Google Scholar]
- Gopinathan, K.K. A general formula for computing the coefficients of the correlation connecting global solar radiation to sunshine duration. Sol. Energy 1988, 41, 499–502. [Google Scholar] [CrossRef]
- Almorox, J.Y.; Hontoria, C. Global solar radiation estimation using sunshine duration in Spain. Energy Convers. Manag. 2004, 45, 1529–1535. [Google Scholar] [CrossRef]
- Che, H.Z.; Shi, G.Y.; Zhang, X.Y.; Arimoto, R.; Zhao, J.Q.; Xu, L.; Wang, B.; Chen, Z.H. Analysis of 40 years of solar radiation data from China, 1961–2000. Geophys. Res. Lett. 2005, 32. [Google Scholar] [CrossRef]
- Wang, Y.; Zhang, L. Relationship between global solar radiation and sunshine duration for Northwest China. Int. J Phys. Sci. 2010, 5, 1023–1033. [Google Scholar]
- Aksoy, B. Analysis of changes in sunshine duration data for Ankara, Turkey. Theor. Appl. Climatol. 1999, 64, 229–237. [Google Scholar] [CrossRef]
- Kaiser, D.P.; Qian, Y. Decreasing trends in sunshine duration over China for 1954–1998: Indication of increased haze pollution? Geophys. Res. Lett. 2002, 29, 38-1–38-4. [Google Scholar] [CrossRef]
- Liu, S.C.; Wang, C.H.; Shiu, C.J.; Chang, H.W.; Hsiao, C.K.; Liaw, S.H. Reduction in sunshine duration over Taiwan: Causes and implications. Terr. Atmos. Ocean. Sci. 2002, 13, 523–546. [Google Scholar] [CrossRef]
- Zheng, X.; Kang, W.; Zhao, T.; Luo, Y.; Duan, C.; Chen, J. Long-term trends in sunshine duration over Yunnan-Guizhou Plateau in Southwest China for 1961–2005. Geophys. Res. Lett. 2008, 35. [Google Scholar] [CrossRef]
- Yang, Y.H.; Zhao, N.; Hao, X.H.; Li, C.Q. Decreasing trend of sunshine hours and related driving forces in North China. Theor. Appl. Climatol. 2009, 97, 91–98. [Google Scholar] [CrossRef]
- Peng, C.K.; Buldyrev, S.V.; Havlin, S.; Simons, M.; Stanley, H.E.; Goldberger, A.L. Mosaic organization of DNA nucleotides. Phys. Rev. E 1994, 49, 1685–1689. [Google Scholar] [CrossRef]
- Bunde, A.; Havlin, S.; Kantelhardt, J.W.; Penzel, T.; Peter, J.H.; Voigt, K. Correlated and uncorrelated regions in heart-rate fluctuations during sleep. Phys. Rev. Lett. 2000, 85, 3736–3739. [Google Scholar] [CrossRef]
- Kantelhardt, J.W.; Koscielny-Bunde, E.; Rego, H.H.; Havlin, S.; Bunde, A. Detecting long-range correlations with detrended fluctuation analysis. Physica A 2001, 295, 441–454. [Google Scholar] [CrossRef]
- Weber, R.O.; Talkner, P. Spectra and correlations of climate data from days to decades. J. Geophys. Res. 2001, 106, 20131–20144. [Google Scholar] [CrossRef]
- Eichner, J.F.; Koscielny-Bunde, E.; Bunde, A.; Havlin, S.; Schellnhuber, H.J. Power-law persistence and trends in the atmosphere: A detailed study of long temperature records. Phys. Rev. E 2003, 68, 046133. [Google Scholar] [CrossRef] [PubMed]
- Blender, R.; Fraedrich, K. Long time memory in global warming simulations. Geophys. Res. Lett. 2003, 30. [Google Scholar] [CrossRef]
- Lin, G.; Fu, Z. A universal model to characterize different multi-fractal behaviors of daily temperature records over China. Physica A 2008, 387, 573–579. [Google Scholar] [CrossRef]
- Yuan, N.; Fu, Z.; Mao, J. Different scaling behaviors in daily temperature records over China. Physica A 2010, 389, 4087–4095. [Google Scholar] [CrossRef]
- Varotsos, C.A.; Efstathiou, M.N.; Cracknell, A.P. On the scaling effect in global surface air temperature anomalies. Atmos. Chem. Phys. 2013, 13, 5243–5253. [Google Scholar] [CrossRef]
- Jiang, L.; Yuan, N.; Fu, Z.; Wang, D.; Zhao, X.; Zhu, X. Subarea characteristics of the long-range correlations, the index χ for daily temperature records over China. Theor. Appl. Climatol. 2012, 109, 261–270. [Google Scholar] [CrossRef]
- Jiang, L.; Li, N.; Fu, Z.; Zhang, J. Long-range correlation behaviors for the 0-cm average ground surface temperature and average air temperature over China. Theor. Appl. Climatol. 2015, 119, 25–31. [Google Scholar] [CrossRef]
- Jiang, L.; Li, N.; Zhao, X. Scaling behaviors of precipitation over China. Theor. Appl. Climatol. 2017, 128, 63–70. [Google Scholar] [CrossRef]
- Chen, X.; Lin, G.; Fu, Z. Long-range correlations in daily relative humidity fluctuations: A new index to characterize the climate regions over China. Geophys. Res. Lett. 2007, 34. [Google Scholar] [CrossRef]
- Monetti, R.A.; Havlin, S.; Bunde, A. Long-term persistence in the sea surface temperature fluctuations. Physica A 2003, 320, 581–589. [Google Scholar] [CrossRef]
- Luo, M.; Leung, Y.; Zhou, Y.; Zhang, W. Scaling behaviors of global sea surface temperature. J. Clim. 2015, 28, 3122–3132. [Google Scholar] [CrossRef]
- Jiang, L.; Zhang, J.; Liu, X.; Li, F. Multi-fractal scaling comparison of the Air Temperature and the Surface Temperature over China. Physica A 2016, 462, 783–792. [Google Scholar] [CrossRef]
- Chen, Z.; Ivanov, P.C.; Hu, K.; Stanley, H.E. Effect of nonstationarities on detrended fluctuation analysis. Phys. Rev. E 2002, 65, 041107. [Google Scholar] [CrossRef]
- Koscielny-Bunde, E.; Bunde, A.; Havlin, S.; Goldreich, Y. Analysis of daily temperature fluctuations. Physica A 1986, 231, 393–396. [Google Scholar] [CrossRef]


© 2019 by the authors. Licensee MDPI, Basel, Switzerland. This article is an open access article distributed under the terms and conditions of the Creative Commons Attribution (CC BY) license (http://creativecommons.org/licenses/by/4.0/).