Article

Features of Urban Heat Island in Mountainous Chongqing from a Dense Surface Monitoring Network

1
Chongqing Climate Center, Chongqing 401147, China
2
Center for Monsoon and Environment Research, School of Atmospheric Sciences, Sun Yat-sen University, Guangzhou 510275, China
*
Author to whom correspondence should be addressed.
Atmosphere 2019, 10(2), 67; https://doi.org/10.3390/atmos10020067
Submission received: 24 January 2019 / Revised: 31 January 2019 / Accepted: 2 February 2019 / Published: 3 February 2019
(This article belongs to the Section Biometeorology and Bioclimatology)

Abstract

:
The spatial and temporal features of urban heat island (UHI) intensity in complex urban terrain are barely investigated. This study examines the UHI intensity variations in mountainous Chongqing using a dense surface monitoring network. The results show that the UHI intensity is closely related to underlying surfaces, and the strongest UHI intensity is confined around the central urban areas. The UHI intensity is most prominent at night and in warm season, and the magnitude could reach ~4.5 °C on summer night. Our quantitative analysis shows a profound contribution of urbanization level to UHI intensity both at night and in summer, with regression coefficient b = 4.31 and 6.65, respectively. At night, the urban extra heat such as reflections of longwave radiation by buildings and release of daytime-stored heat from artificial materials, is added into the boundary layer, which compensates part of urban heat loss and thus leads to stronger UHI intensity. In summer, the urban areas are frequently controlled by oppressively hot weather. Due to increased usage of air conditioning, more anthropogenic heat is released. As a result, the urban temperatures are higher at night. The near-surface wind speed can serve as an indicator predicting UHI intensity variations only in the diurnal cycle. The rural cooling rate during early evening transition, however, is an appropriate factor to estimate the magnitude of UHI intensity both at night and in summer.

1. Introduction

The urban heat island (UHI) is a well-known phenomenon where temperatures over urban areas are typically higher than over their rural surroundings [1,2,3,4,5]. Because of rapid urbanization in the last decades, the UHI phenomenon has been extensively studied around the world [6,7,8,9]. The UHI intensity is mostly quantified as the difference in near-surface air temperature between representative urban and rural stations. This definition is easily measured by either one pair of urban–rural sites or temperature mean of urban and rural sites (e.g., [10]).
The UHI intensity is hypothesized to be controlled by anthropogenic modifications in surface energy balance (e.g., [11]). These changes include urban geometry, reduction of evaporative cooling, release of anthropogenic heat, thermal properties of buildings and other artificial materials, and the efficiency of convection between urban surface and the atmospheric boundary layer [3,4]. In different regimes, the main cause varies. For example, Yang et al. [12] analyzed the surface air temperature (SAT) of automatic weather stations (AWSs) in Beijing and proposed that stronger evapotranspiration (latent heat flux exchange) in rural areas and larger anthropogenic heat emission in urban areas both result in a prominent UHI effect. Hu et al. [5] used a dense surface observing network to investigate Oklahoma City UHI at a subcity spatial scale and highlighted the critical role of physical processes during early evening transition in determining the nocturnal UHI intensity. Besides of city-intrinsic characteristics, external meteorological factors can also modulate UHI features. Bassett et al. [13] found that horizontal winds would warm the downwind areas of Birmingham in a process named Urban Heat Advection. Hu and Xue [14] conducted a both observational and modeling study over Dallas–Fort Worth and found that sea breeze passage was ultimately responsible for the collapses of the nocturnal UHI.
It is well documented that UHI intensity shows prominent temporal characteristics, and because of the release of daytime-stored heat in building materials, the UHI intensity reaches its maximum at night in most cities, such as London [15], Seoul [16], Beijing [12], and Oklahoma City [5]. As for seasonal cycle, the UHI intensity is reported to be strongest in winter (cold season) in some cities (e.g., Beijing [12], Ulaanbaatar [17], and Fairbanks [18]), while it is most prominent in summer (warm season) in other cities (e.g., Athens [19] and Berlin [20]). Despite numerous studies on temporal variations of UHI, its spatial features are much less discussed. The UHI intensity at a city scale is difficult to examine because of sparse distribution of in situ weather stations [21]. Some researchers use land surface temperature derived from remote sense image to compensate (e.g., [22]). However, due to the inherent issues of remote sensing, the derived UHI intensity is sometimes verified to be distinct from that of in situ SAT in certain aspects (such as diurnal cycle) [4,23]. Thus, intensive, consistent and reliable observations of SAT are required to further investigate UHI spatiotemporal features [5].
Chongqing is one of China’s four direct-controlled municipalities, containing over 30 million people. It is located in southwest China and at the transitional area between the Qinghai-Tibet Plateau and the plain on the middle and lower reaches of the Yangtze River (Figure 1a). The central urban area of Chongqing, i.e., Chongqing City, is built right on a big syncline of a huge folding area, and is known as a “mountain city” (Figure 1b,c). During the past few decades, Chongqing City has experienced rapid urbanization. The UHI effect becomes more and more prominent and impacts regional climate significantly [24]. In recent summers, frequent heat waves with extremes of 40 °C are recorded at urban areas. The UHI effect tends to worsen the adverse condition and has a profound impact on the health of urban residents. Unfortunately, investigations on UHI phenomenon in mountainous Chongqing are limited due to difficulties in handling the complex topography.
In this study, datasets from a consistent, high-quality, and dense surface monitoring network are applied to investigate the UHI features, and a sounding-based method is utilized to deal with the data observed over complex terrain. The aim of this study is to reveal the spatiotemporal characteristics of UHI intensity in mountainous city that are barely examined before, rather than explain all the possible causes of UHI effect. The remainder of this paper is organized as follows. Dataset and methods are presented in Section 2. The diurnal and seasonal variations of UHI intensity in mountainous Chongqing are examined in Section 3 and Section 4, respectively. Finally, a summary with conclusions and discussions is presented.

2. Data and Methods

The central urban area of Chongqing Municipality (Figure 1b,c) is selected as the area of interest, embedded in which is a dense surface monitoring network of AWSs issued by China Meteorological Administration. In the domain, over 330 AWSs are deployed with hourly observations of SAT and rainfall, and approximately half of the stations are equipped with wind sensors at 10-m level. Only AWSs with observations of all these three meteorological factors are used in this study. Before analyzing, quality control is carried out for all data records. The possible erroneous data are selected by a set of evaluation indexes as in Yang et al. [25]. They are then eliminated and replaced by the missing values. Those AWSs with too many missing values, i.e., over a quarter of all the samples are missing in a calendar year, are ruled out. To ensure enough samples for statistical analysis, the calendar year of 2017 that possesses the most validated stations in recent years, is chosen as the research period. Fifty-five sites were reserved in 2017. Their information is detailed in Table 1.
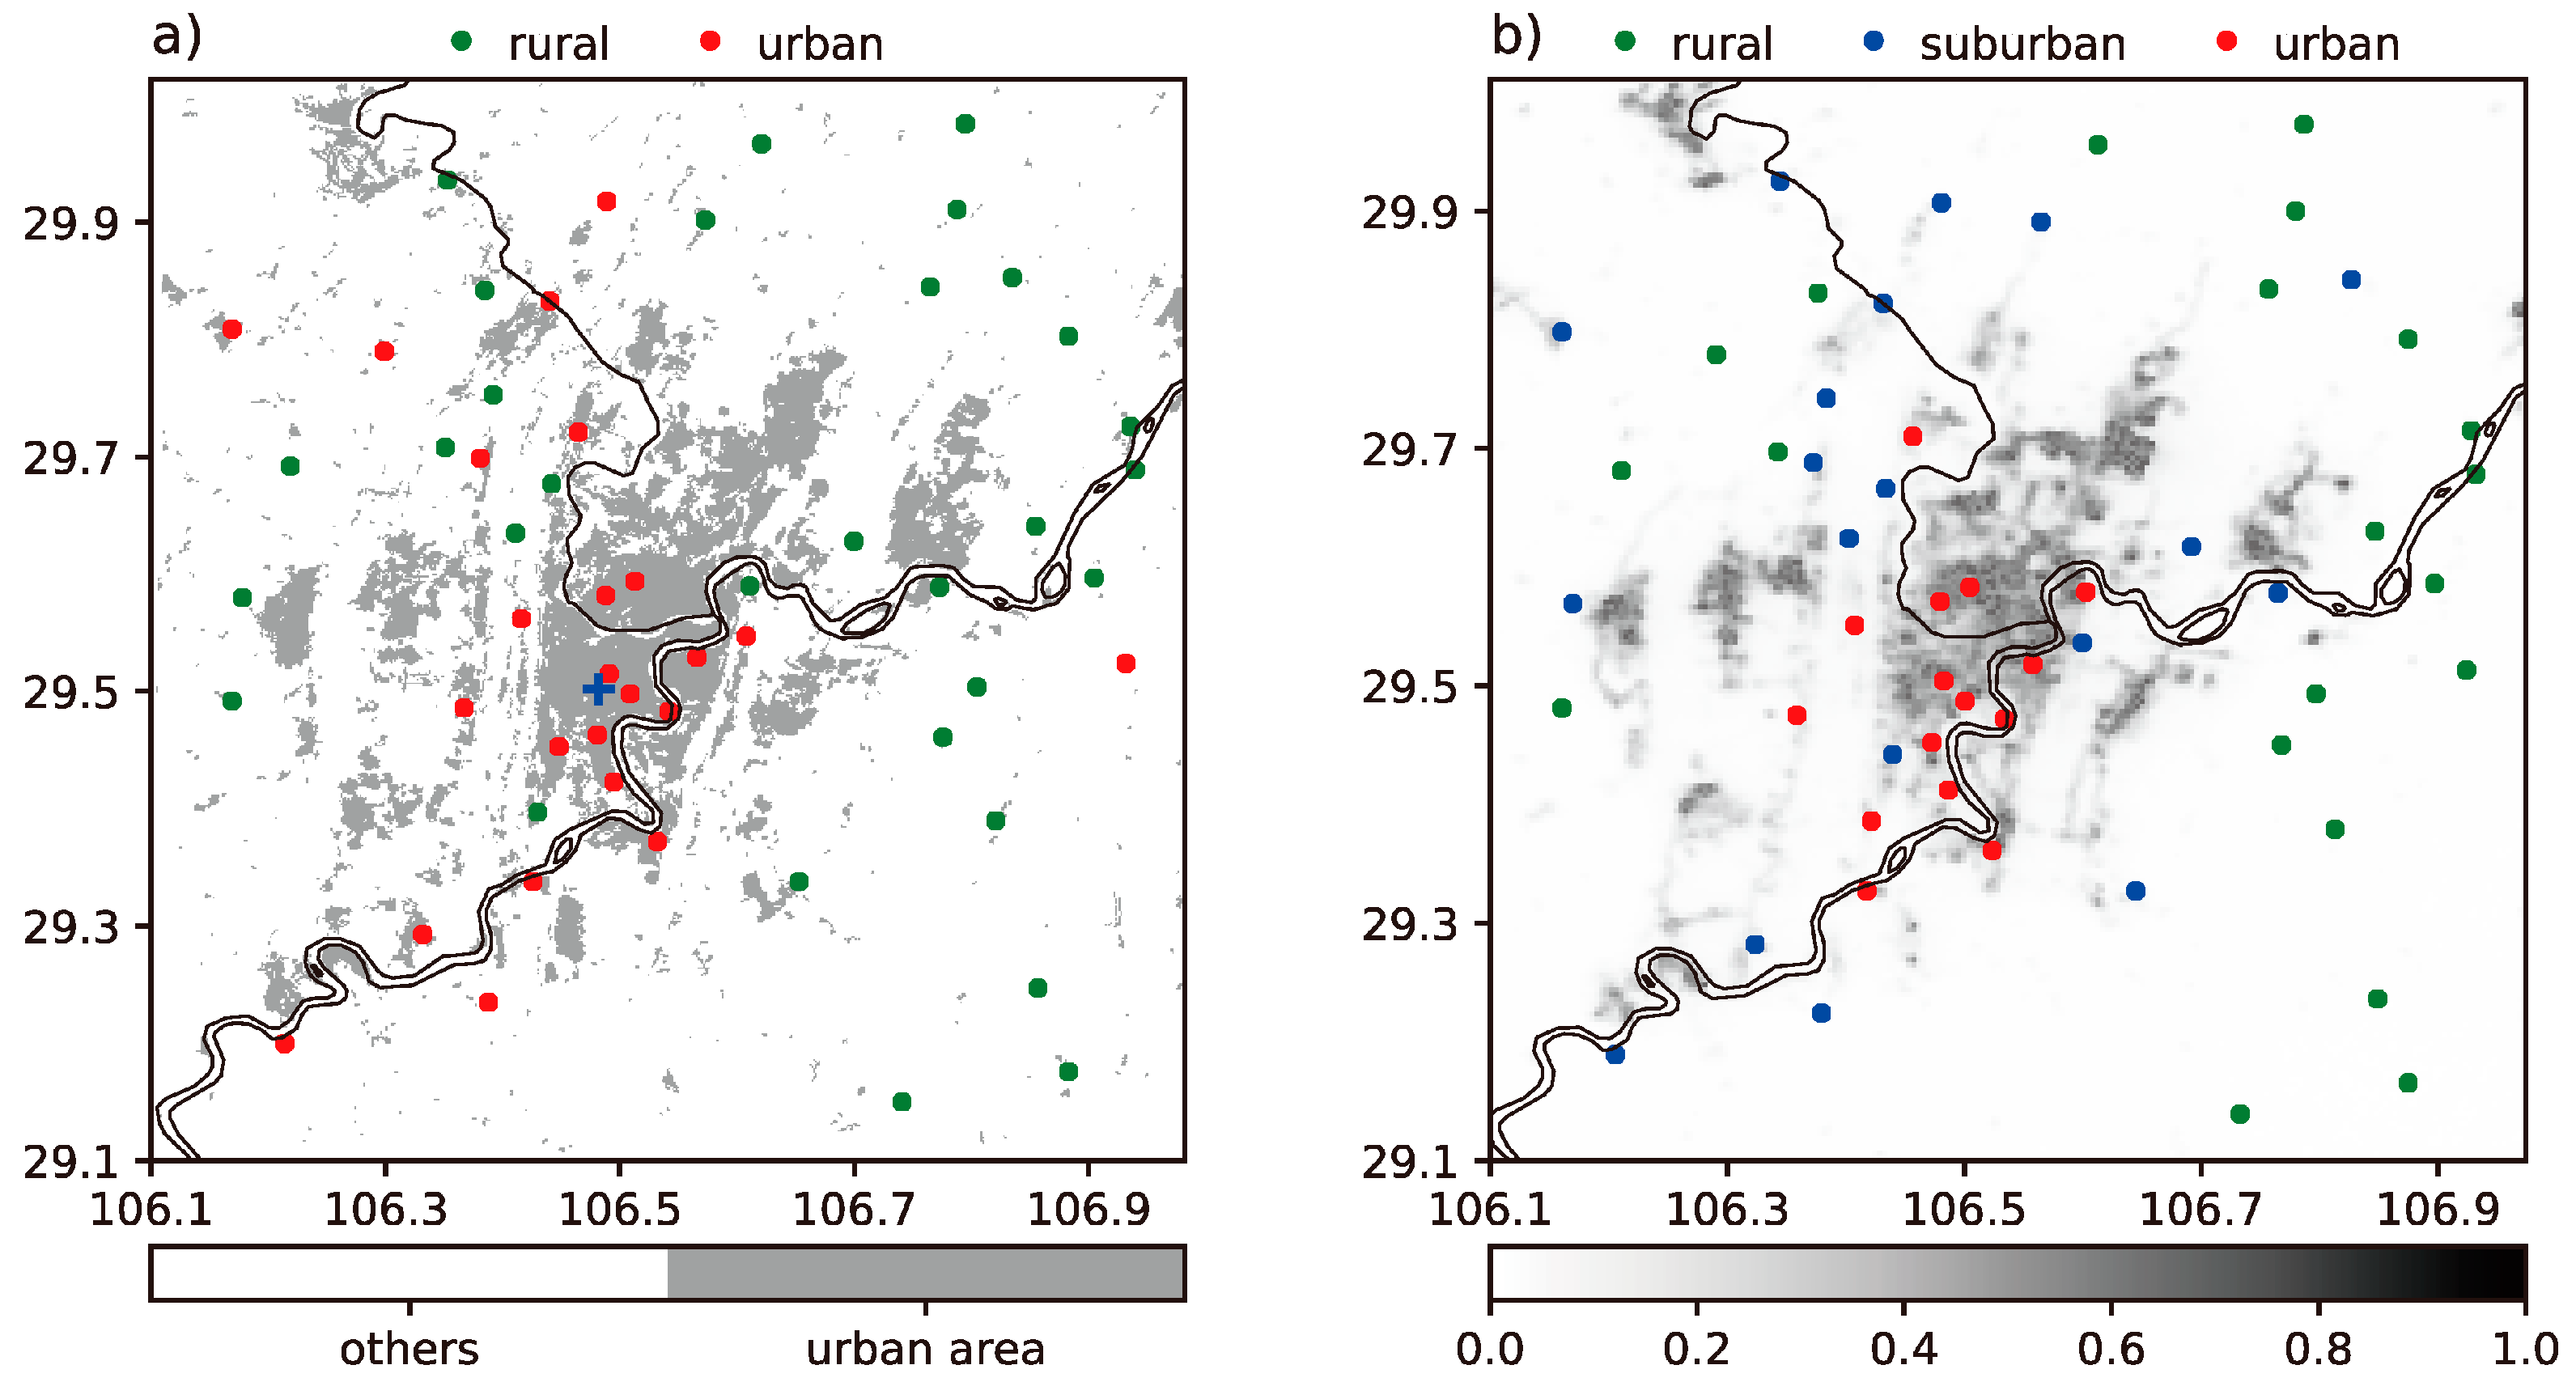
The observational stations are almost evenly distributed in the study area (Figure 2). To investigate UHI features, the sites are often grouped into different categories (i.e., urban, suburban, rural, etc.) by either land cover characteristics or climate-based criteria [12,26]. For example, using the latest 30-m-land use data from Institute of Geographic Sciences and Natural Resources Research in Chinese Academy of Sciences, the AWSs fall into two kinds (Figure 2a). The question is, these definitions can only give a qualitatively evaluation of degree to which the vicinity around certain stations has urbanized, rather than quantitatively. It is well documented that remote-sensed nighttime light is significantly related to socioeconomic variables (including the urbanization level) (e.g., [27,28,29]). Thus, the nighttime light data offers a good opportunity to quantify the urban development. In this paper, the annual cloud-free composite nighttime light data from the Visible Infrared Imaging Radiometer Suite day/night band (VIIRS DNB) at 15 arc-seconds in 2017, provided by NOAA’s National Centers for Environmental Information, is used for estimating Chongqing urbanization level. The nighttime light is firstly normalized by its maximum value, which refers to normalized nighttime light index (NNLI). The AWSs are then sorted by the nearest pixel values of NNLI. As an instance, three groups (urban, suburban, and rural) are classified by NNLI of 0.03 and 0.20 (Table 1 and Figure 2b) [29].
UHI intensity is often calculated as the difference between mean urban and rural temperatures when a number of observational sites are present [30]. In order to investigate the spatial patterns of UHI intensity, this study estimates the UHI intensity at each site. The UHI intensity at a certain site is defined as
U H I i = Δ T i = T i T r u r a l
where i = 1, 2, 3, …, denoting the ith station in surface monitoring network. Ti is the corresponding SAT at ith station. Trural denotes the average SAT of the rural sites, defined as
T r u r a l = 1 n j = 1 n T j
where j = 1, 2, 3, …, n, and n is the number of rural sites. Note that the temperature difference cannot be calculated directly as the sites are located in mountainous region with various altitudes ranging from 191.1 m to 701.0 m (Table 1). A proper way is to compare the potential temperature of each station at a same level, but it is infeasible because of lack of surface pressure observations. Here, a simple method based on sounding data is implemented [31]. The near-surface lapse rate at a certain day is firstly calculated, i.e.,
Γ = T 925 T s u r f H 925 H s u r f
where T925 (Tsurf) and H925 (Hsurf) denote the temperature and altitude observed at 925 hPa (surface) at the Shapingba Sounding Station (NO. 57516; indicated by blue cross in Figure 2a) in the study area, respectively. The temperature samples at each site are then extrapolated to a 100-m level using the lapse rate at each day. Two assumptions are made when applying the method. The first one is that the lapse rate at near surface (in the boundary layer) is vertically constant, so that the temperatures at different altitudes can be adjusted to a same level (e.g., [32]). The second one is that the sounding data represents the spatially mean state of atmosphere in the study area, so that the temperatures at different sites can utilize the same lapse rate.
The diurnal and seasonal cycle of UHI intensity is processed by time average. To mitigate the impacts of distinct external meteorological factors, the days in which any AWS observes rainfall with a magnitude larger than 1.0 mm/day, are excluded for calculating. For UHI intensity spatial distribution, the kriging interpolation method is used to interpolate the variables using weighted averages from surrounding sites (e.g., [13]).

3. Mean Diurnal Cycle of UHI Intensity in Chongqing City

3.1. UHI Intensity General Features and Relationship with Urbanization

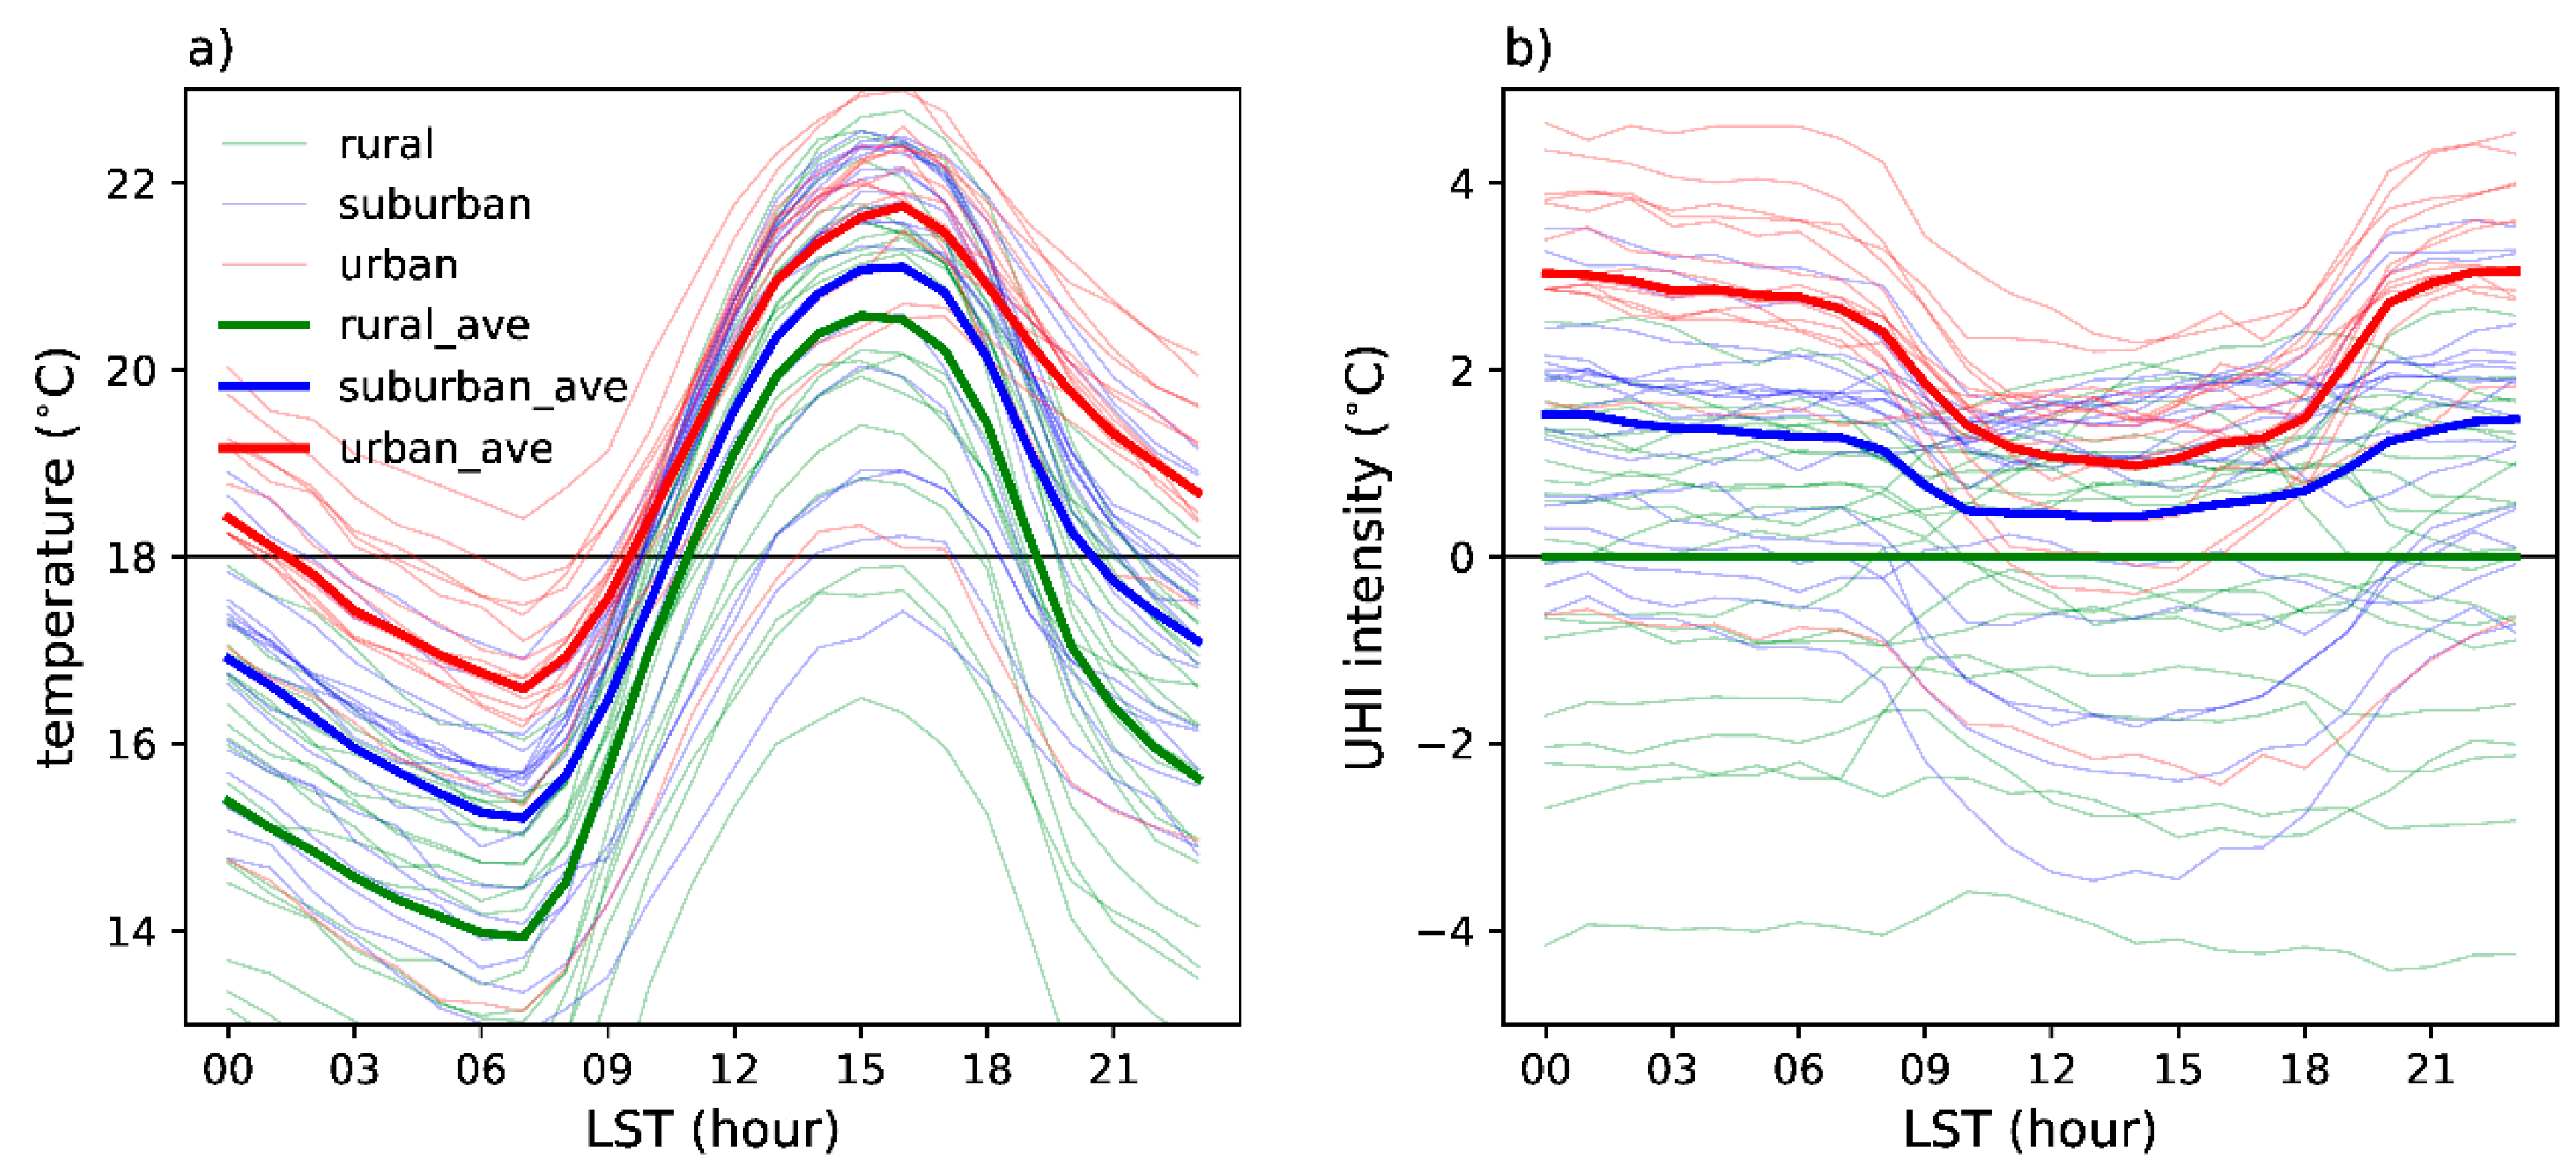
The mean diurnal variations of SAT are shown in Figure 3a. All the sites depict classic diurnal cycle as the cycle of input solar radiation. The urban SAT is generally higher than rural, thus UHI effect appears. As argued by Karl et al. [33], urban development together with other local effects would result in the decrease of diurnal temperature range (DTR) due to faster rising rate of minimum temperature. Thus, UHI intensity shows a prominent diurnal variation (Figure 3b). The UHI intensity at urban and suburban sites increases rapidly at mean early evening transition (EET), i.e., 19–20 in local standard time (LST), then keeps a relatively constant strength (~2.8 °C in urban sites and ~1.4 °C in suburban sites) until a fast decrease around early morning. This indicates that UHI intensity in the study area has a higher value at nighttime than daytime, which is consistent with previous studies of various cities [34]. Contradictory results are presented when UHI intensity is quantified by land surface temperature in remote sensing [35]. Though remotely sensed UHI intensity is found to be ambiguous, e.g., underestimating the effect at vertical surfaces and areas below tree crowns, it would supply a space-consistent perspective at a city scale [4]. Thus, further studies to combine the advantages of these two different quantifications of UHI intensity are greatly needed [36].
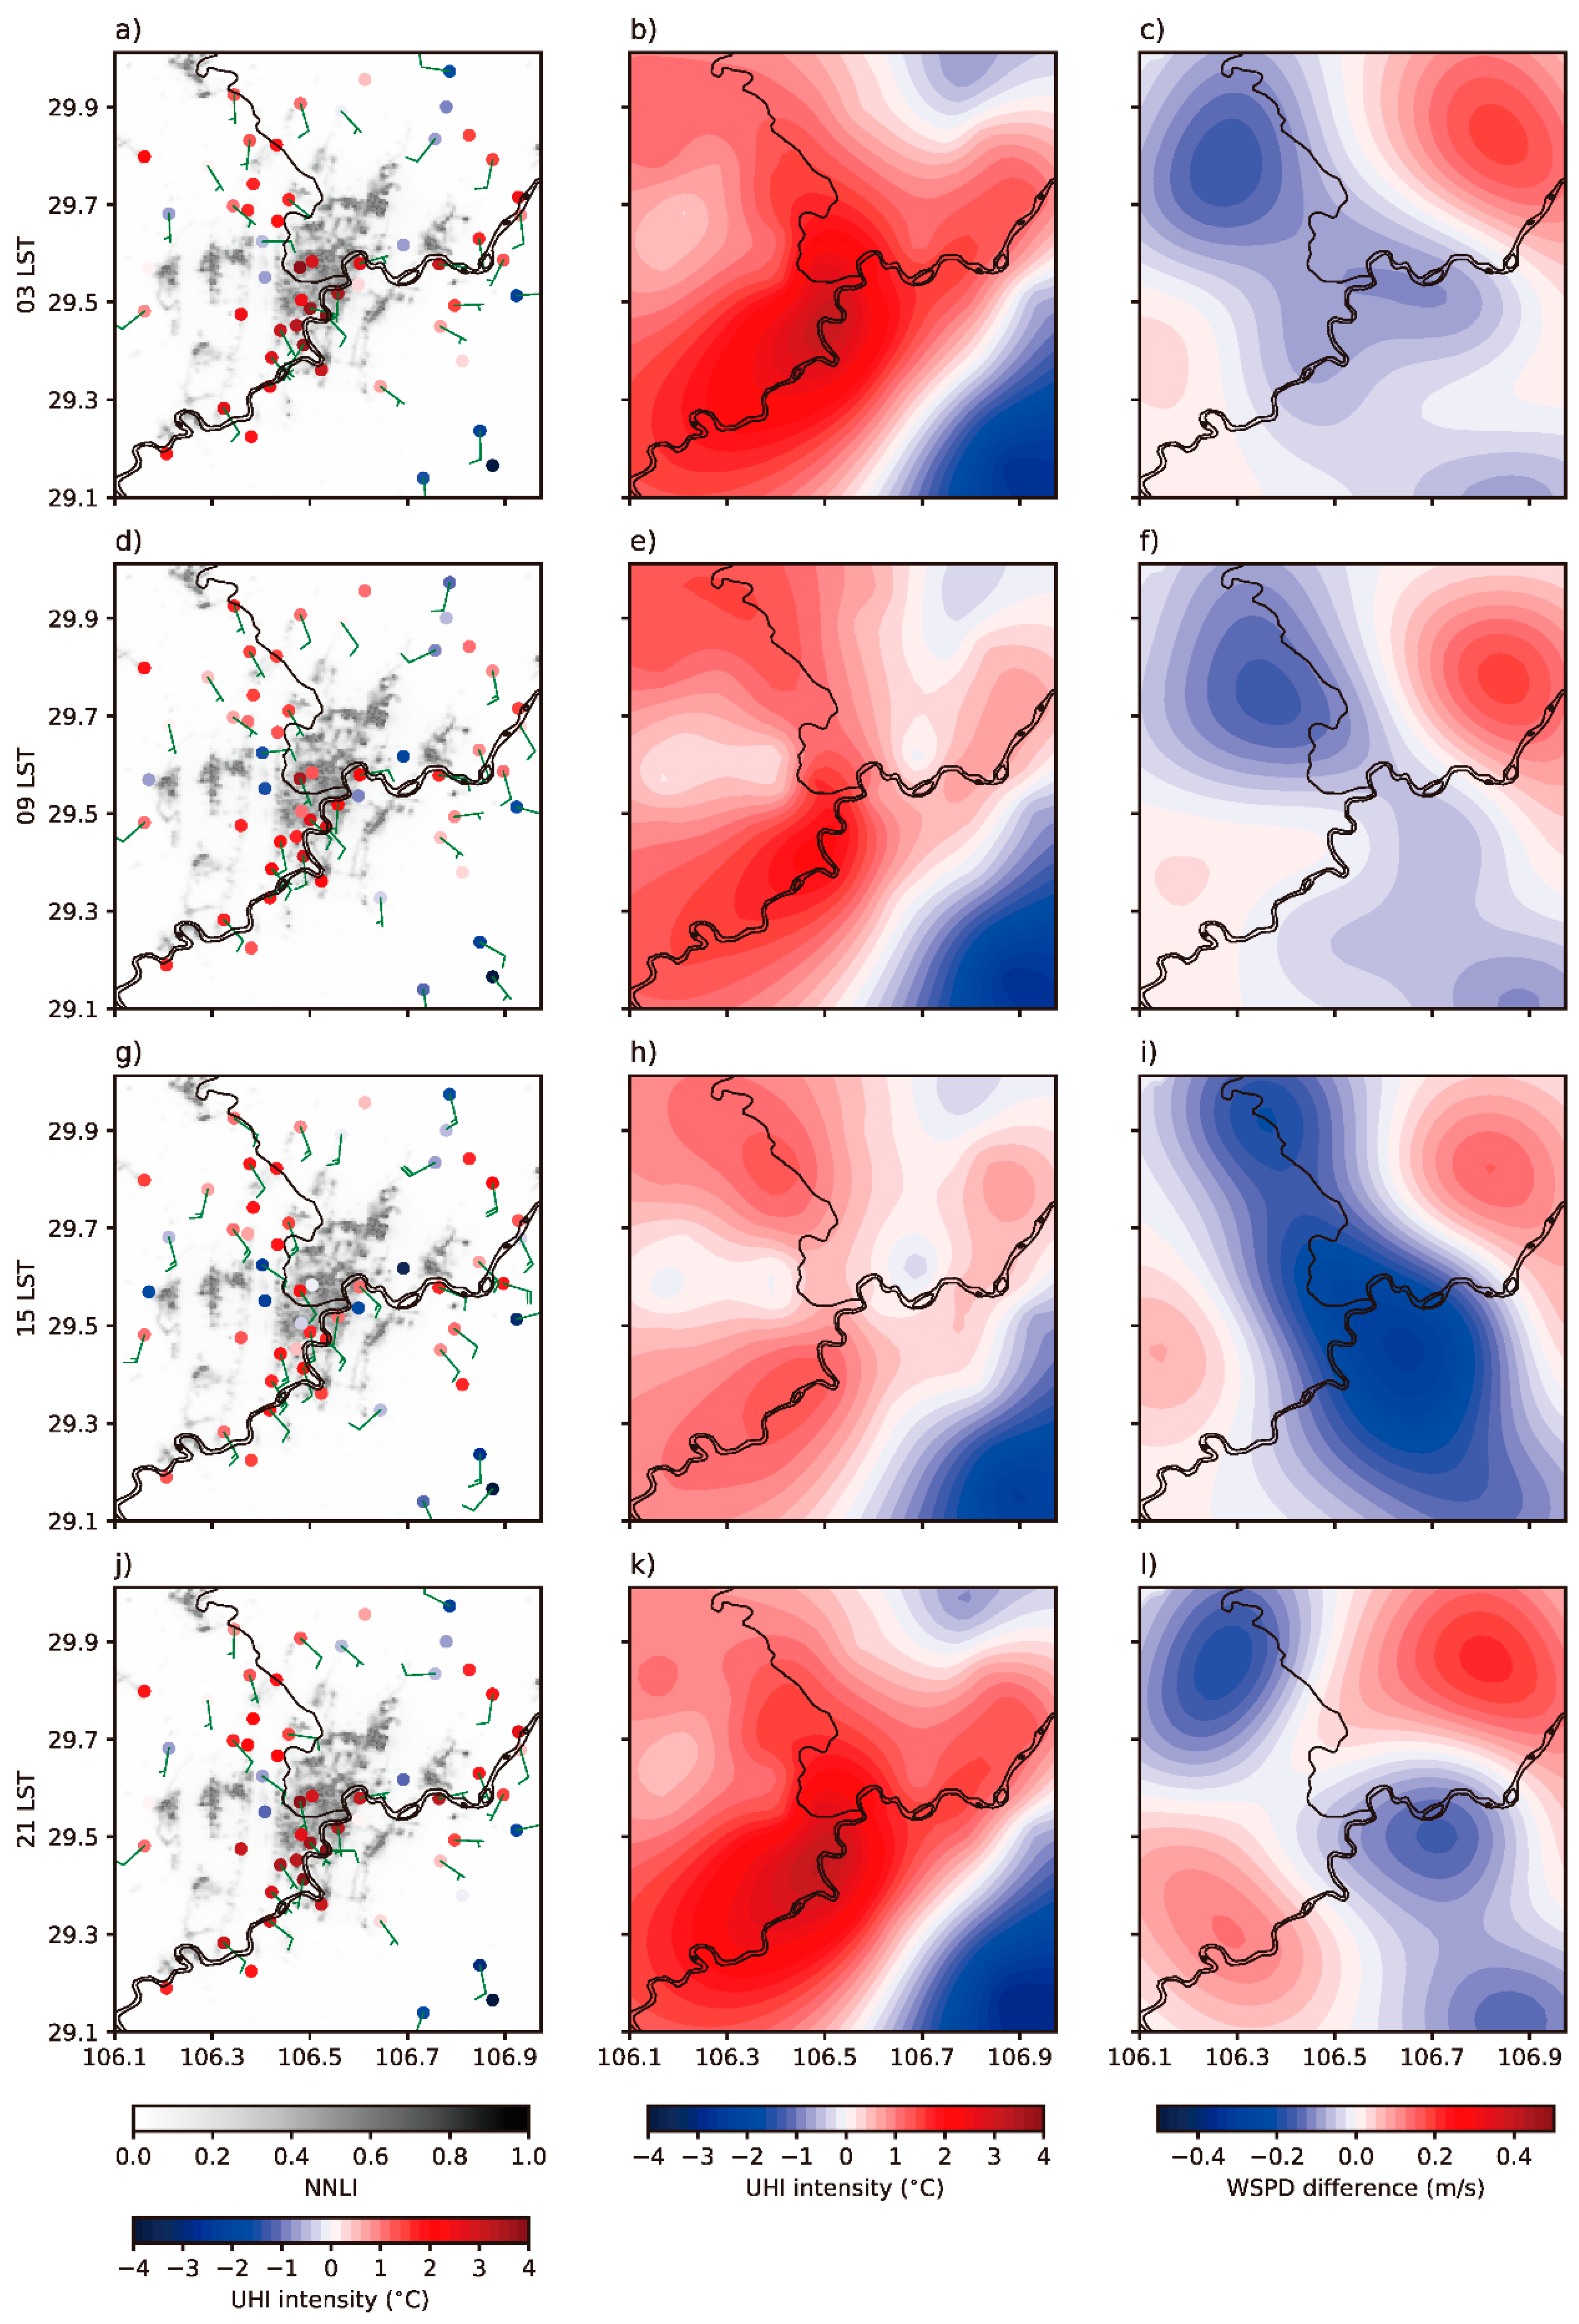
The UHI intensity spatial patterns at mountainous Chongqing remain an open question. As shown in left column of Figure 4, the UHI intensity exhibits a nearly concentric feature. That is, strong UHI intensity is mostly confined at highly urbanized areas (i.e., high NNLI). The spatially interpolated distribution (middle column of Figure 4) illustrates a southwest–northeast elongated axis with the maximum UHI intensity lying along the banks of Yangtze River in Yuzhong District (~106.52° E, ~29.48° N). At the southeast part, UHI intensity is low because of the undeveloped surface and flourishing vegetation in Jinfo Mountain. The UHI intensity is also weak at the west region (~106.38° E, ~29.59° N): this is because the in situ weather stations are located in rural areas, although most of underlying surface is well developed. The UHI is in a roughly stable pattern during a full day, but the intensity shows a clear day–night contrast. The maximum UHI intensity could reach 3.5 °C at central business district at midnight (03 LST) but is less than 1.0 °C in the afternoon (15 LST).
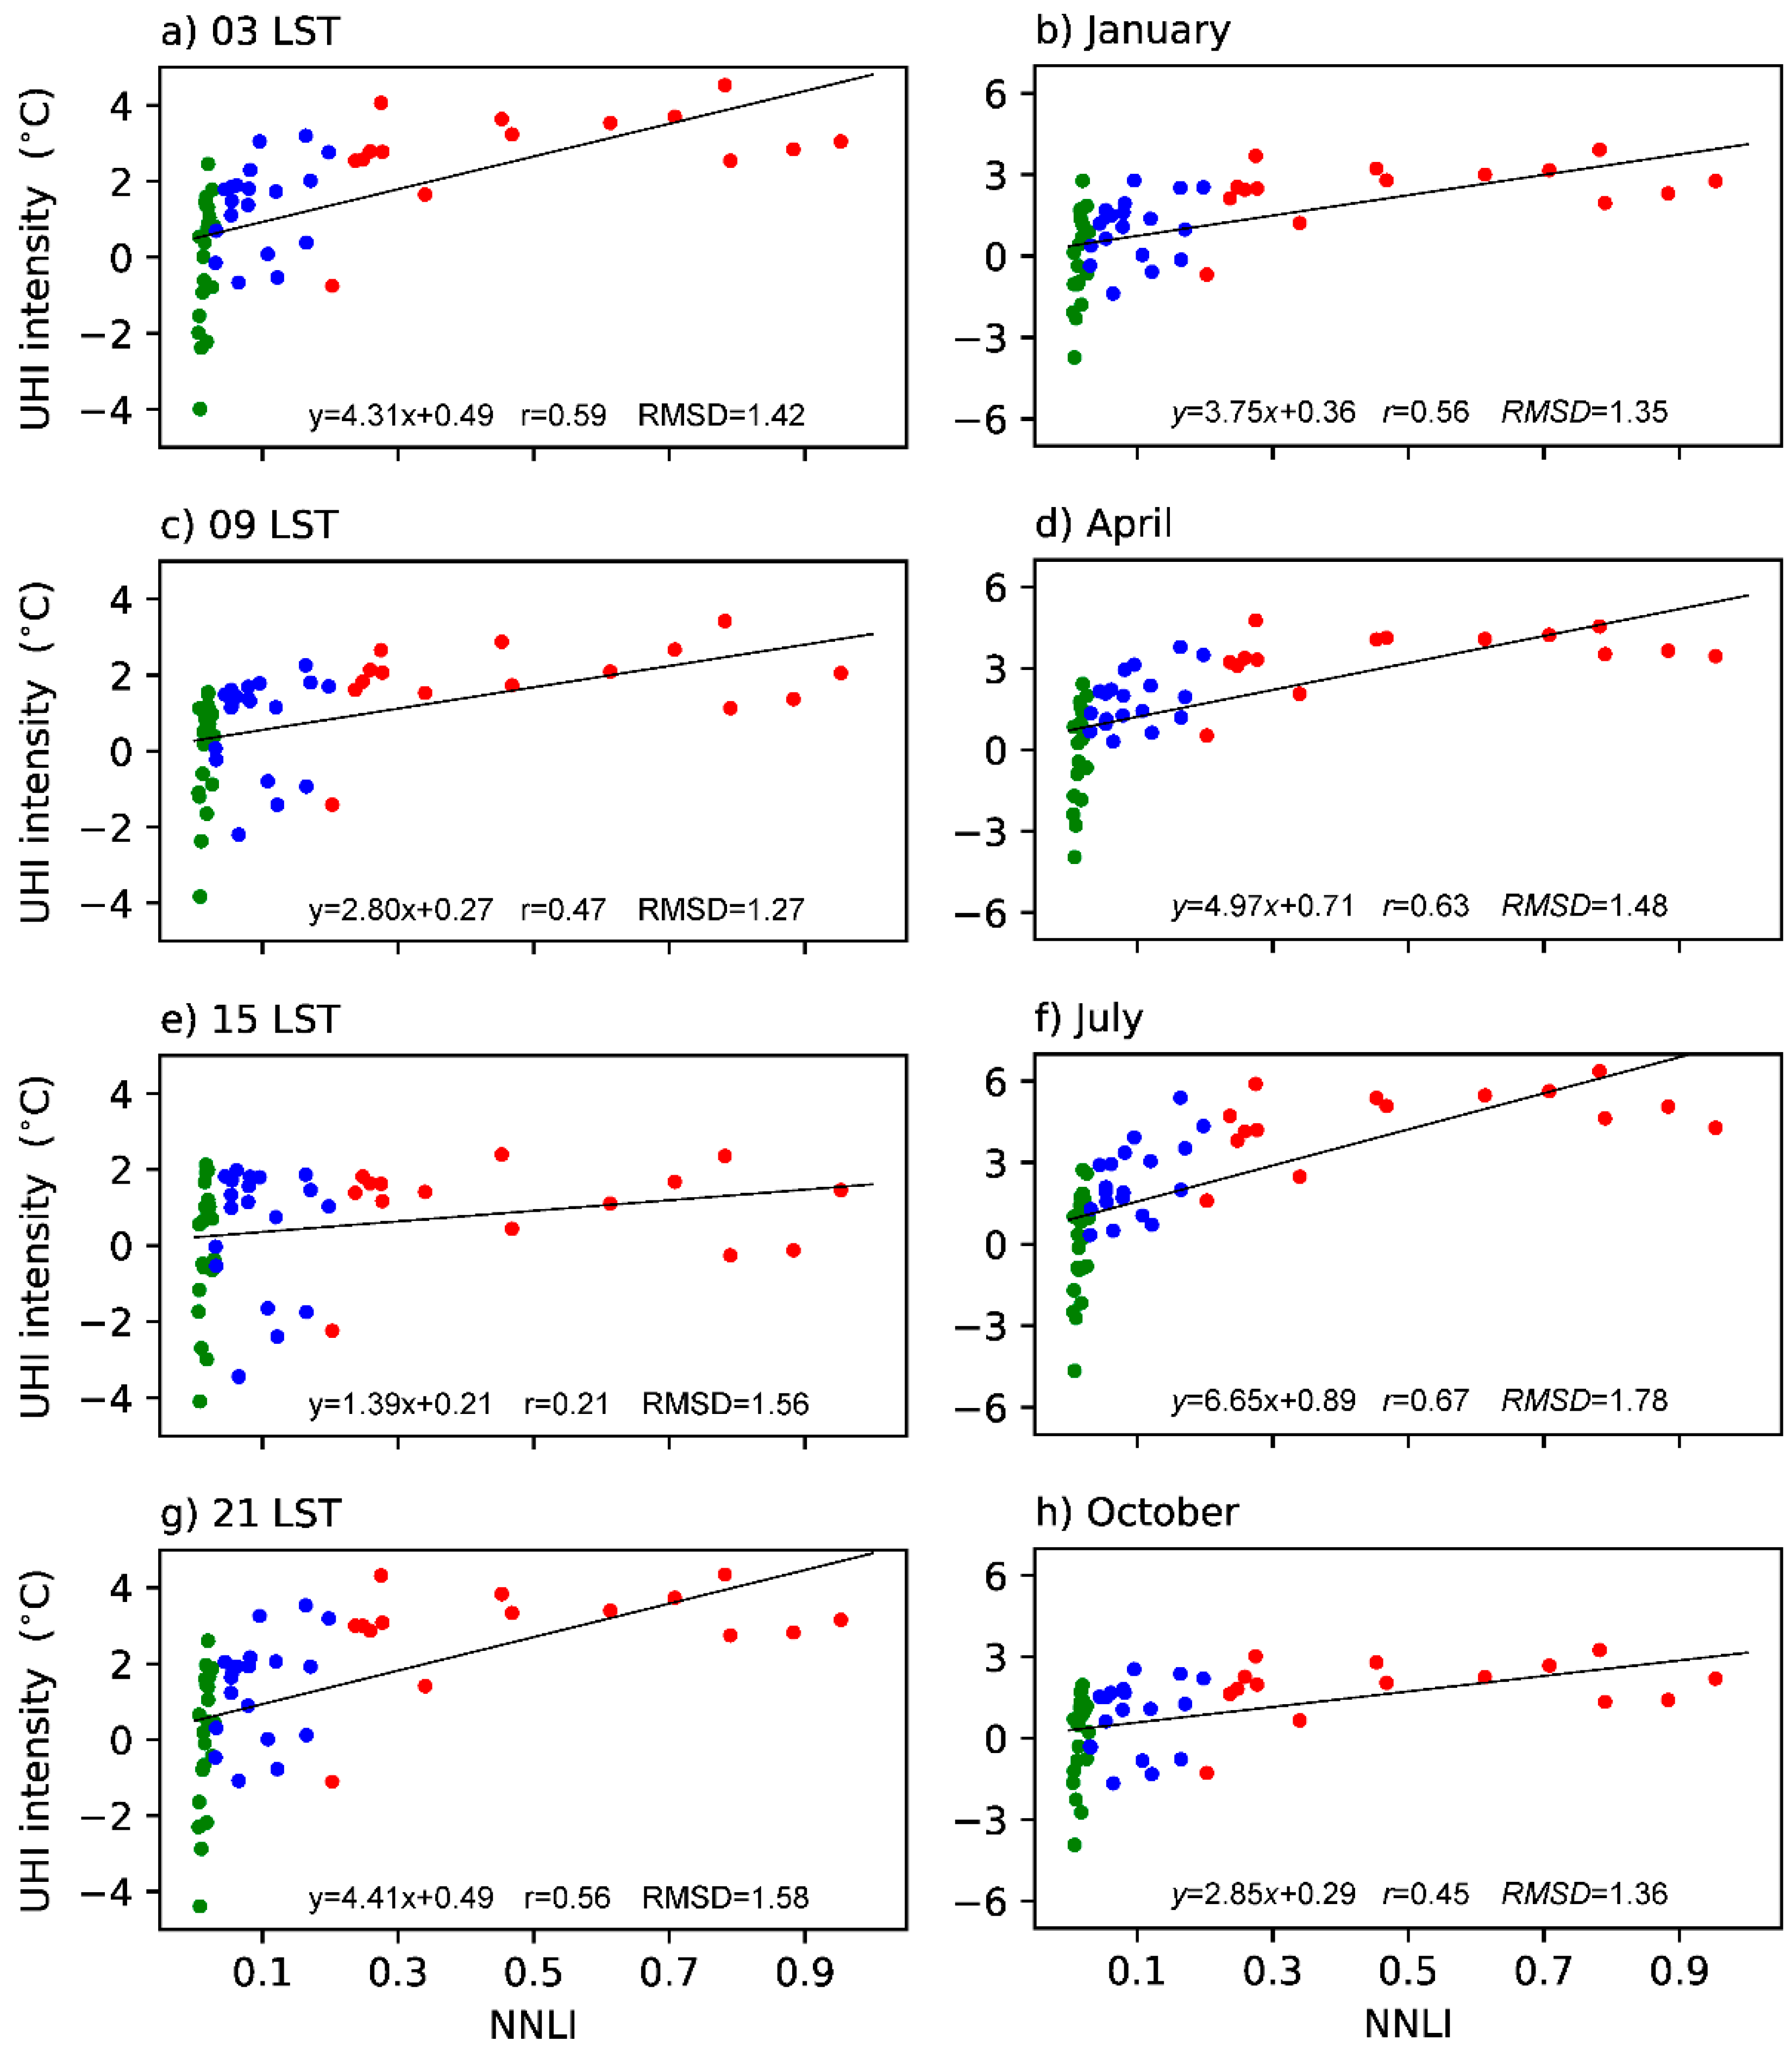
While urban effects on temperature are qualitatively discussed in a wide range of literature, a quantitative analysis is insufficient [37]. The urbanization level is explicitly estimated by NNLI, and its relationship with UHI intensity is shown in Figure 5. It is clear the more the regions are urbanized, the stronger the UHI intensity appears. Urbanization exerts a comprehensive impact on surface energy balance, which therefore results in higher temperature in urban areas [4]. These modifications include increased input solar radiation due to decreased albedo, reduced outgoing longwave radiation due to reflection, and extra heat release due to artificial materials and vehicles (e.g., [38]). Besides, sensible and latent heat transfer by changes of land cover can also influence the urban–rural temperature contrast. The detailed analysis of these causes is beyond the range of this study.
As shown by the left column of Figure 5, the correlation between UHI intensity and urbanization varies from hour to hour in a day. It seems that UHI intensity relates to the NNLI more closely at night (correlation coefficient r = 0.59 at 03 LST and 0.21 at 15 LST, and root mean square deviation RMSD = 1.42 at 03 LST and 1.56 at 15 LST). The regression coefficient is also bigger at night (b = 4.31 at 00 LST and 1.39 at 15 LST), which indicates a more prominent impact of urbanization on nocturnal temperatures. At night, the solar radiation vanishes, but the longwave radiative cooling sustains. Thus, the atmospheric boundary layer (ABL) becomes quite stable. The corresponding turbulent activities are suppressed at the upper part of ABL (e.g., [39]). At the same time, the near-surface wind speed is small because of decoupling from high-horizontal-momentum layers [5]. This process happens at both rural and urban areas. However, extra heat, such as reflections of longwave radiation by buildings and daytime-stored heat release from artificial materials, is added into ABL over urban areas, which compensates part of urban heat loss and leads to a relatively higher temperature [2]. This modification of urban areas is more obvious at night than in the day. Thus, the impacts of urbanization is noble and results in a prominent UHI intensity at night.

3.2. Possible Indicators of UHI Intensity

As implicated by the thermodynamic energy equation, winds play an important role in changing SAT through advection and diabatic heating terms [40]. Omitting the advection and radiation terms, the SAT tendency is proportional to sensible and latent heat fluxes, i.e.,
T t F S H + F L H
where T is SAT, and FSH and FLH are sensible and latent heat fluxes, respectively. According to the aerodynamic bulk formulae [41], the heat fluxes are defined as
F S H = ρ c C H U Δ T
and
F L H = ρ L C E U Δ q
Here, ρ , c , C H , C E , and L are constant parameters (refer to [41] for detail meanings), thus sensible and latent heat fluxes depend on U (wind speed at 10 m), Δ T (air–land temperature difference), and Δ q (air–land specific humidity difference). As Δ T and Δ q are always negative, therefore,
T t U
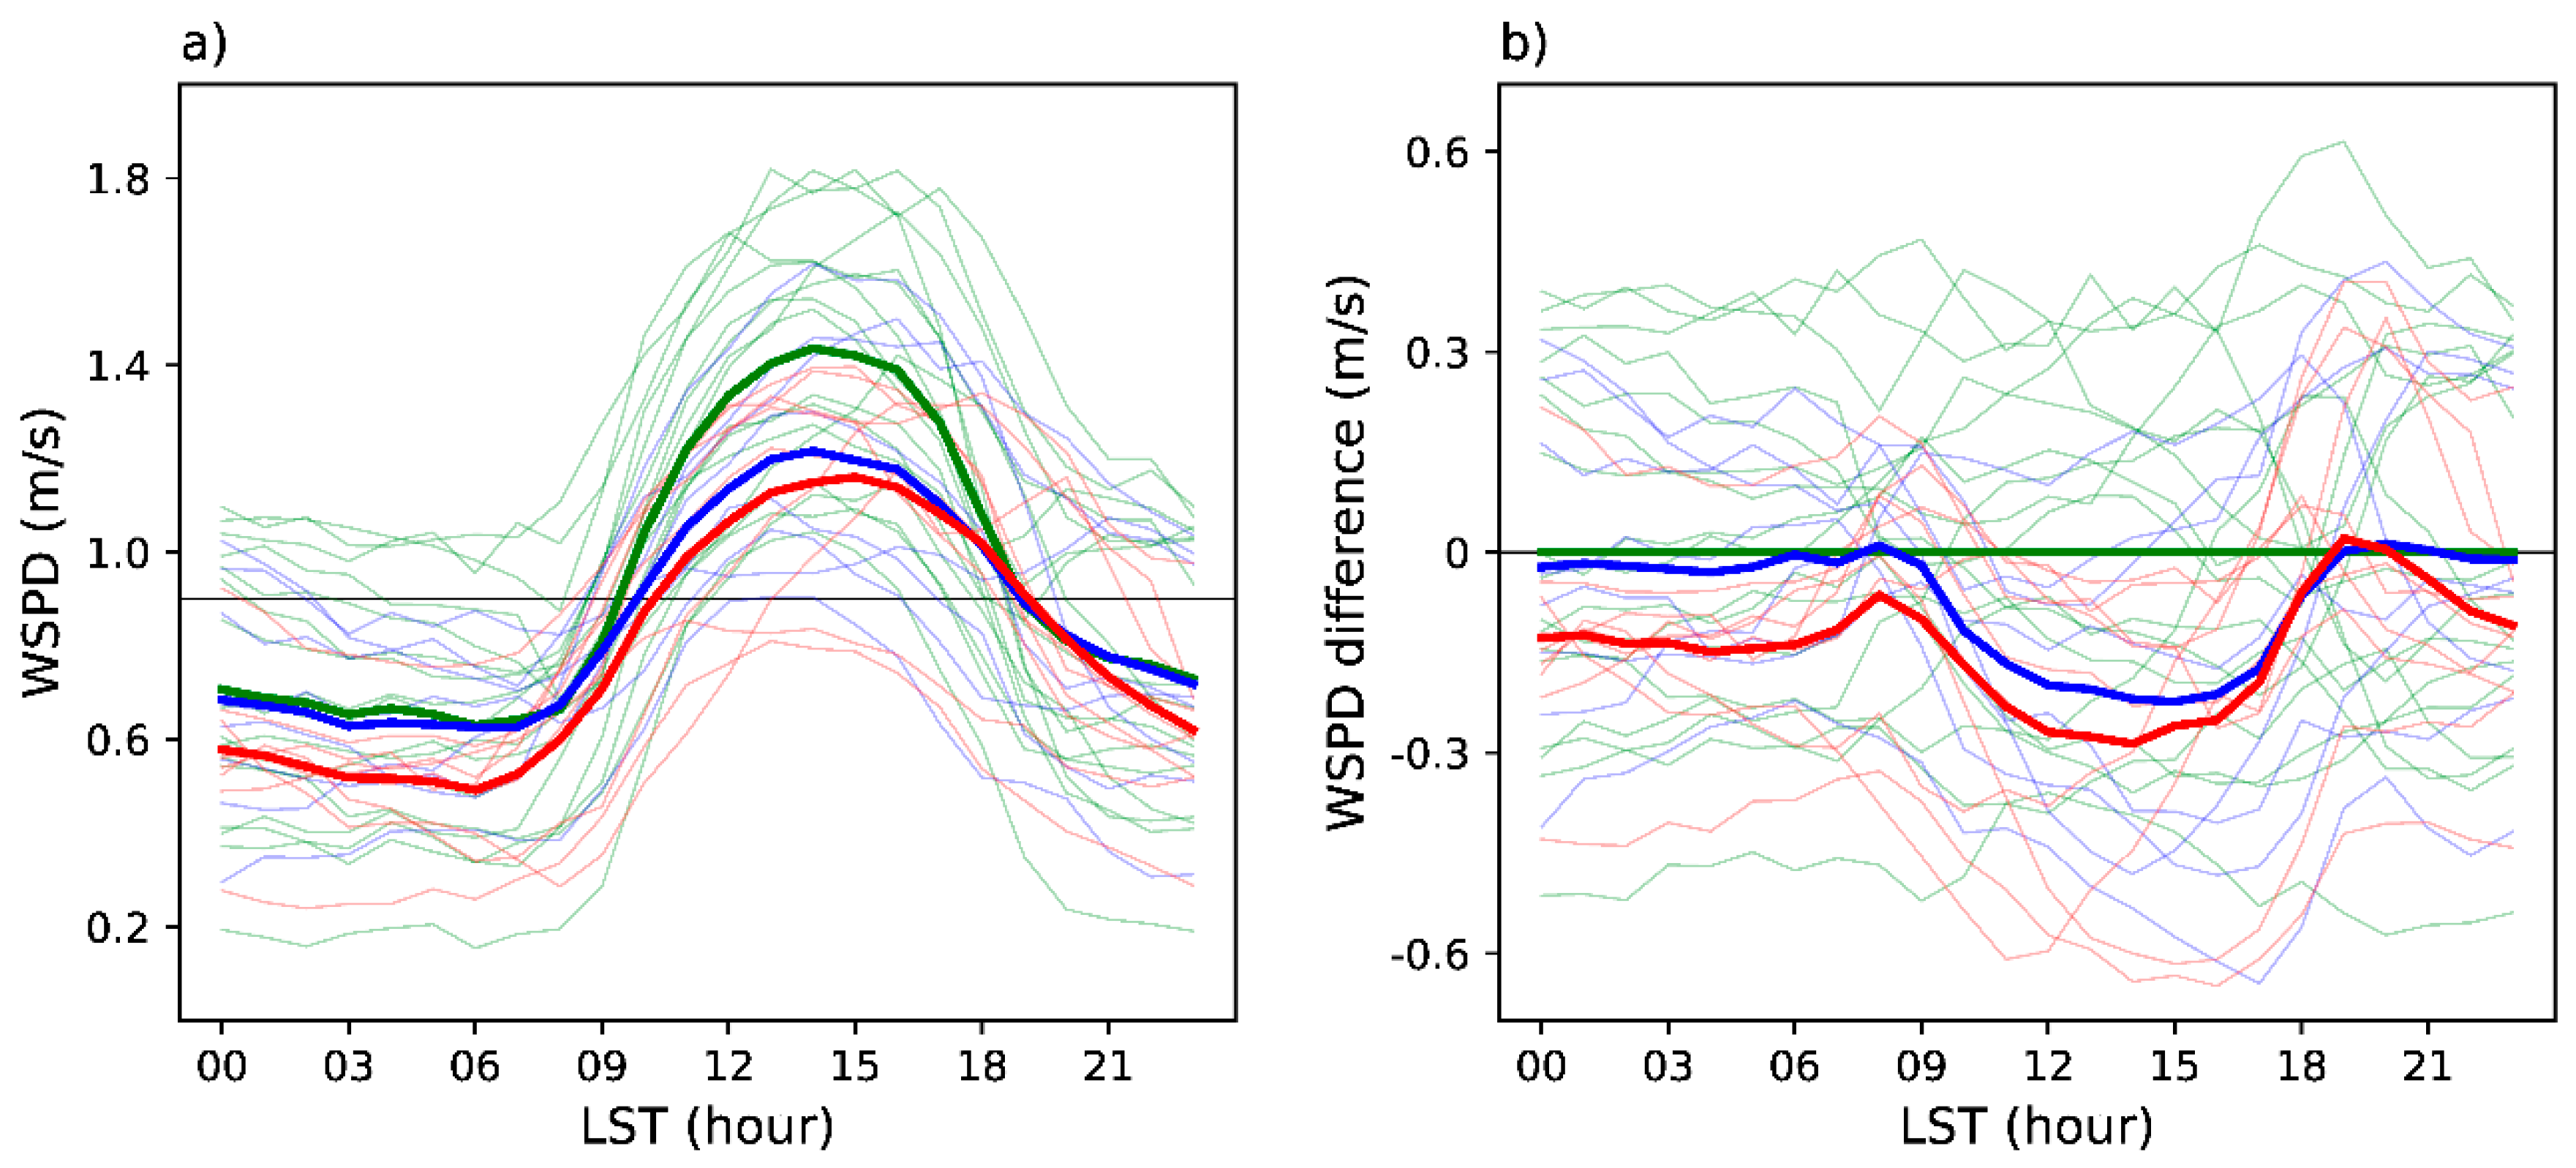
This indicates that SAT decreases with wind speed. Thus, the near-surface winds could serve as an indicator how the UHI intensity varies. As shown in Figure 6a, surface wind speed exhibits a diurnal cycle with a maximum in the day and a minimum at night. This can be explained by the diurnal variation of boundary layer vertical mixing because stronger downward transport of high momentum leads to stronger near-surface winds in the day than at night. The diurnal variations of wind speed closely correlated to the UHI intensity with r = −0.92 (−0.91) in urban (suburban) areas (both significant at the 0.01 level) (cf. Figure 3b and Figure 6a).
The wind field at a specific site is not only determined by background circulations (e.g., mesoscale inflow), but also modulated by the regional environment (e.g., urban roughness) [42,43]. As a local factor, the urbanization is elucidated to impact near-surface winds in two ways. The first is to increase surface roughness and reduce the wind speed through drag effect, and the second is to enhance the downward transport of momentum and strength the near-surface winds through vertical mixing [31]. The observed mean wind speed at urban sites is generally lower than the rural throughout the day (Figure 6a). This indicates the drag effect of rougher urban surface is dominant. The wind speed difference with respect to rural average, however, is smaller at night than in the day (Figure 6b). This testifies a considerable effect of momentum vertical mixing on nocturnal winds over urban areas as well. At night, the ABL over rural surface is stable, and the near-surface decouples with upper layers and becomes small. The winds over urban areas are further reduced by surface roughness. However, extra heat together with other factors in urban region results in a relatively neutral boundary layer, which therefore induces stronger turbulent vertical mixing and enhances near-surface winds [44]. This effect of wind increase by momentum transport offsets part of wind decrease by roughness. Consequently, the wind speed difference between urban and rural surfaces is relatively small at night. This feature is also detected in the kriging-interpolated spatial pattern (right column in Figure 4).
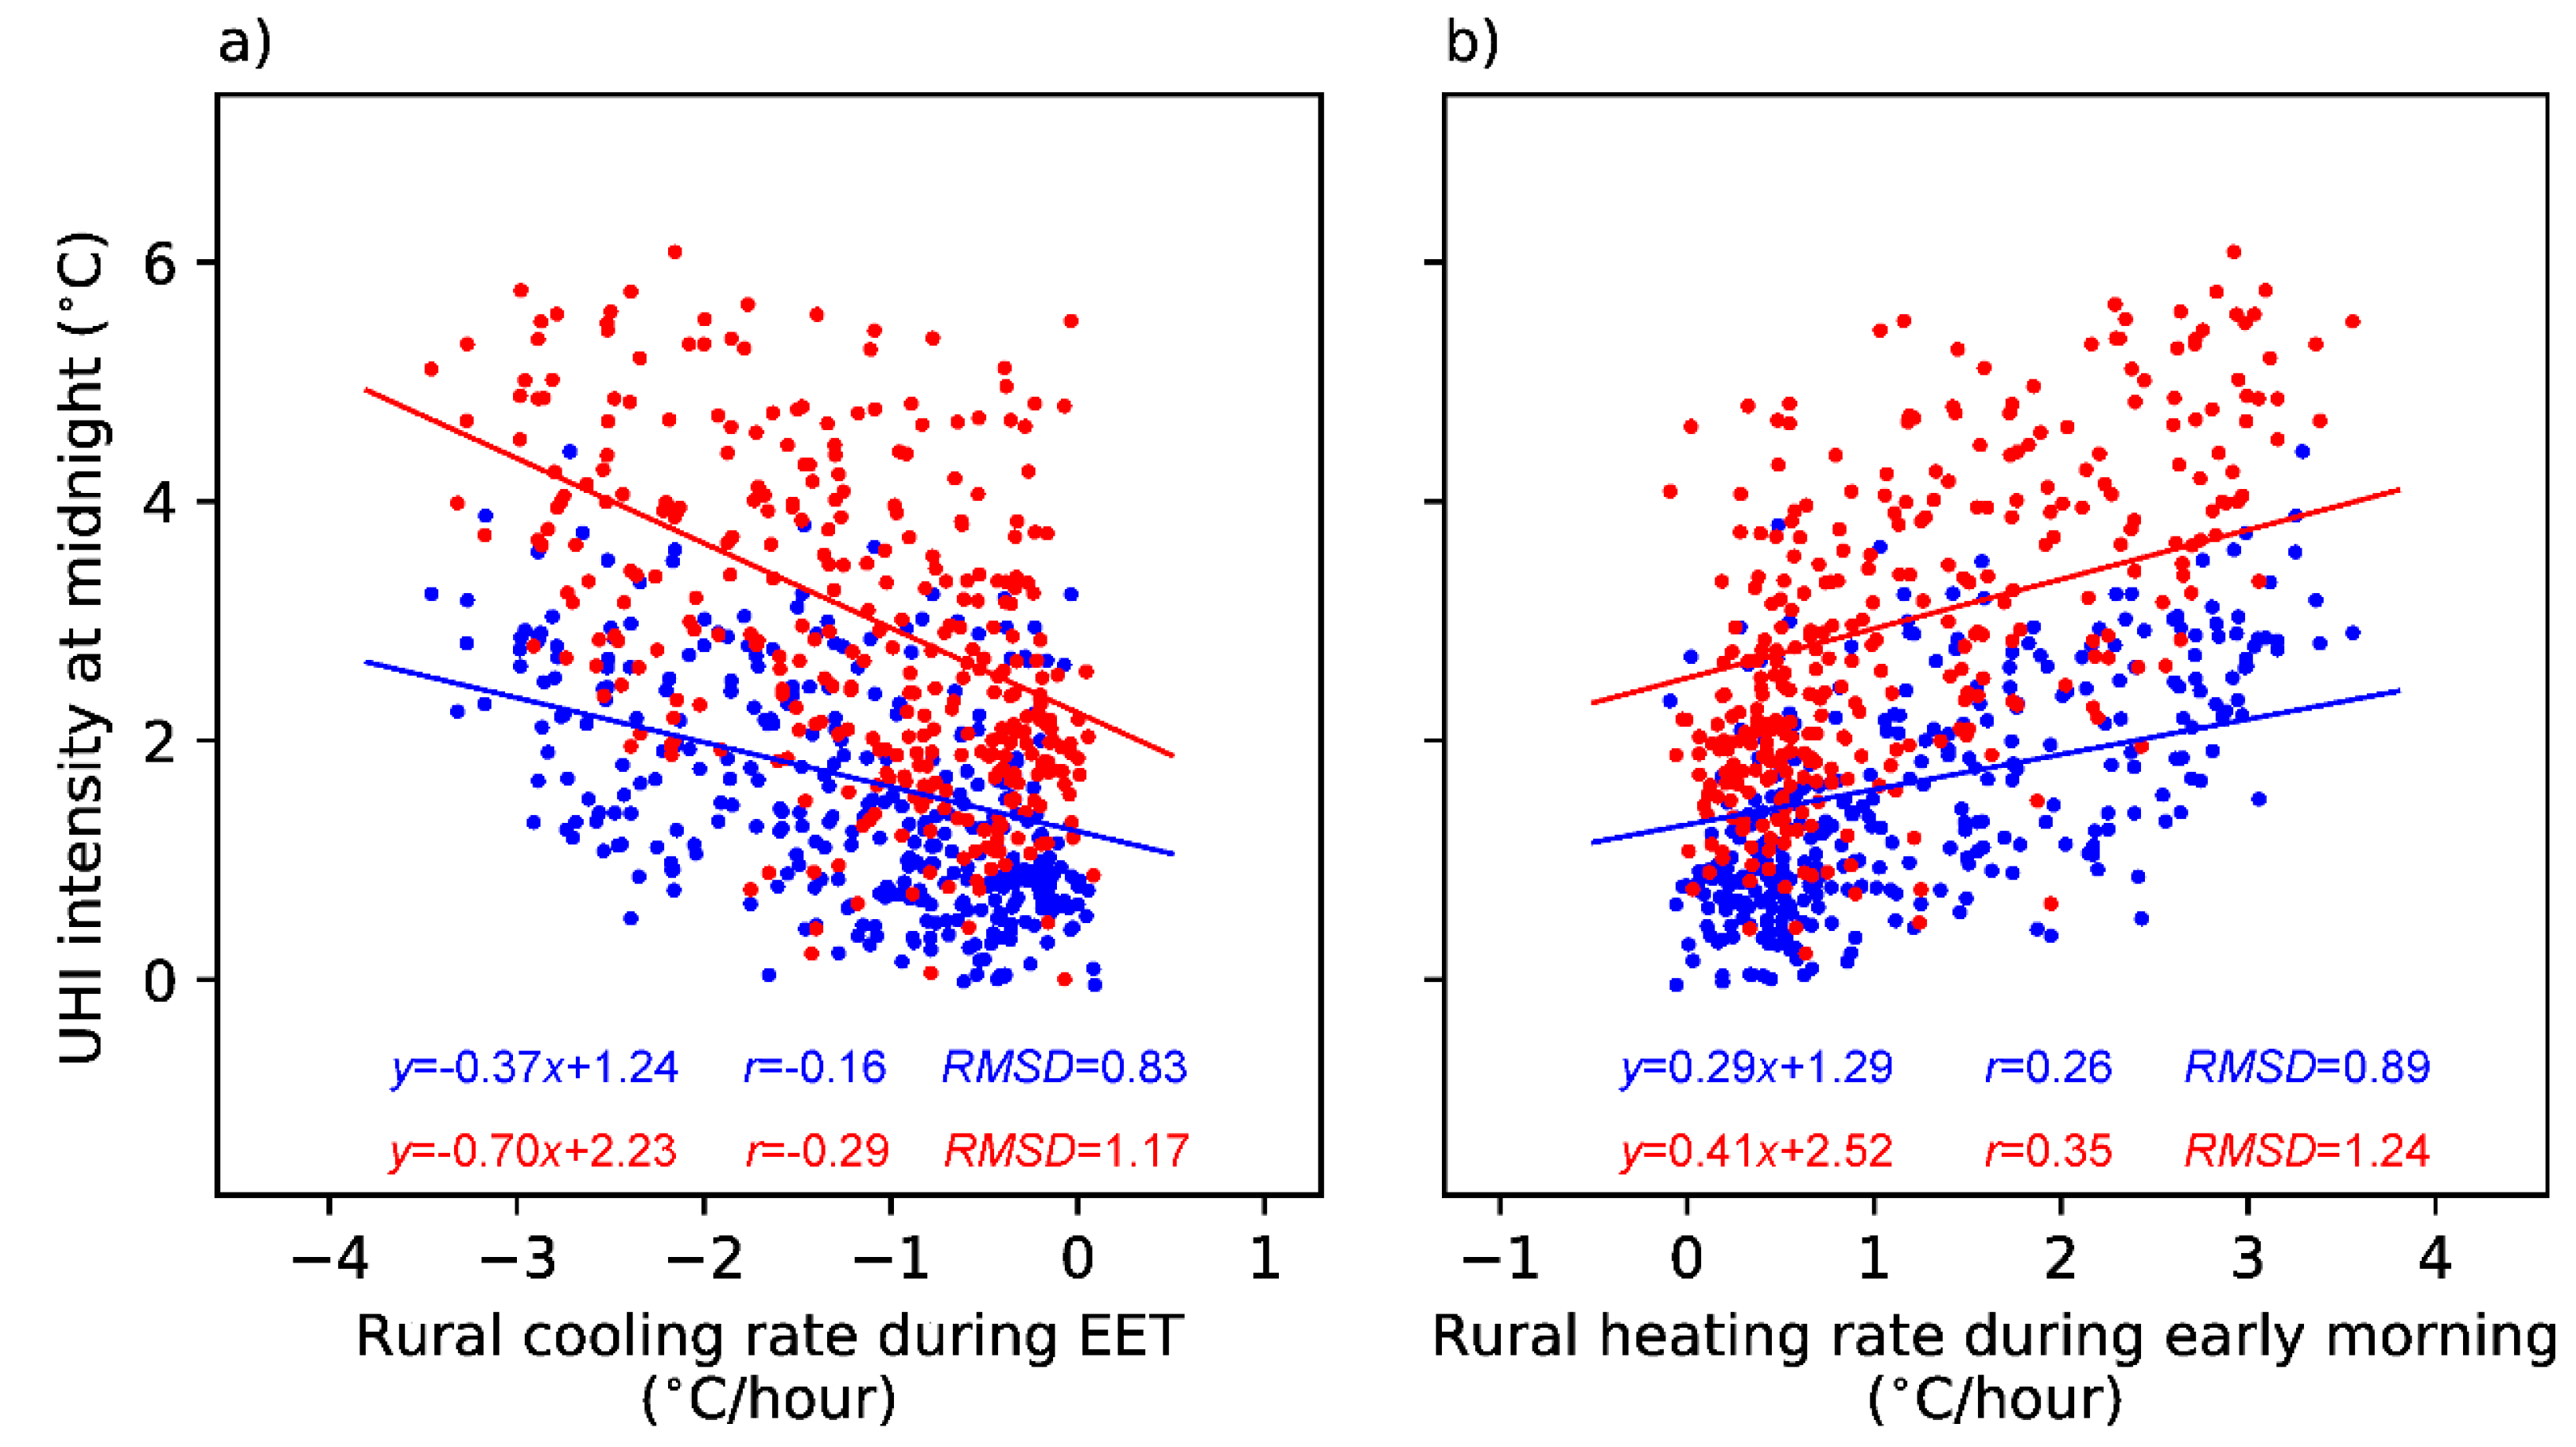
As shown in Figure 3b, the UHI intensity increases dramatically during EET and then stays a relatively constant magnitude. This indicates that EET processes (e.g., the change of background flow) are likely responsible for the nocturnal strength of UHI [5]. Previous studies suggested an important role of EET cooling rate of rural sites in determining the UHI intensity [4,45]. The relationships between UHI intensity in urban/suburban sites and mean rural cooling rate during EET in each month are given in Figure 7a. It is found that these two factors are negatively correlated with r = −0.29 (−0.16) and b = 0.70 (0.37) at urban (suburban) sites (both significant at the 0.01 level). This different correlation manifests different rates of temperature decrease in urban and suburban sites during EET (Figure 3a). This can be also elucidated by discrepancies in decreasing trends of diurnal temperature range (DTR) in different urbanization-level sites (e.g., [46]). Like the cooling rate during EET, the heating rate of rural sites during early morning is also well correlated to nocturnal UHI intensity with r = 0.35 (0.26) at urban (suburban) sites (Figure 7b). Thus, the temperature changing rate in rural areas may be an indicator for estimating the magnitude of UHI effect in urban areas.

4. Seasonal Variations of UHI Intensity

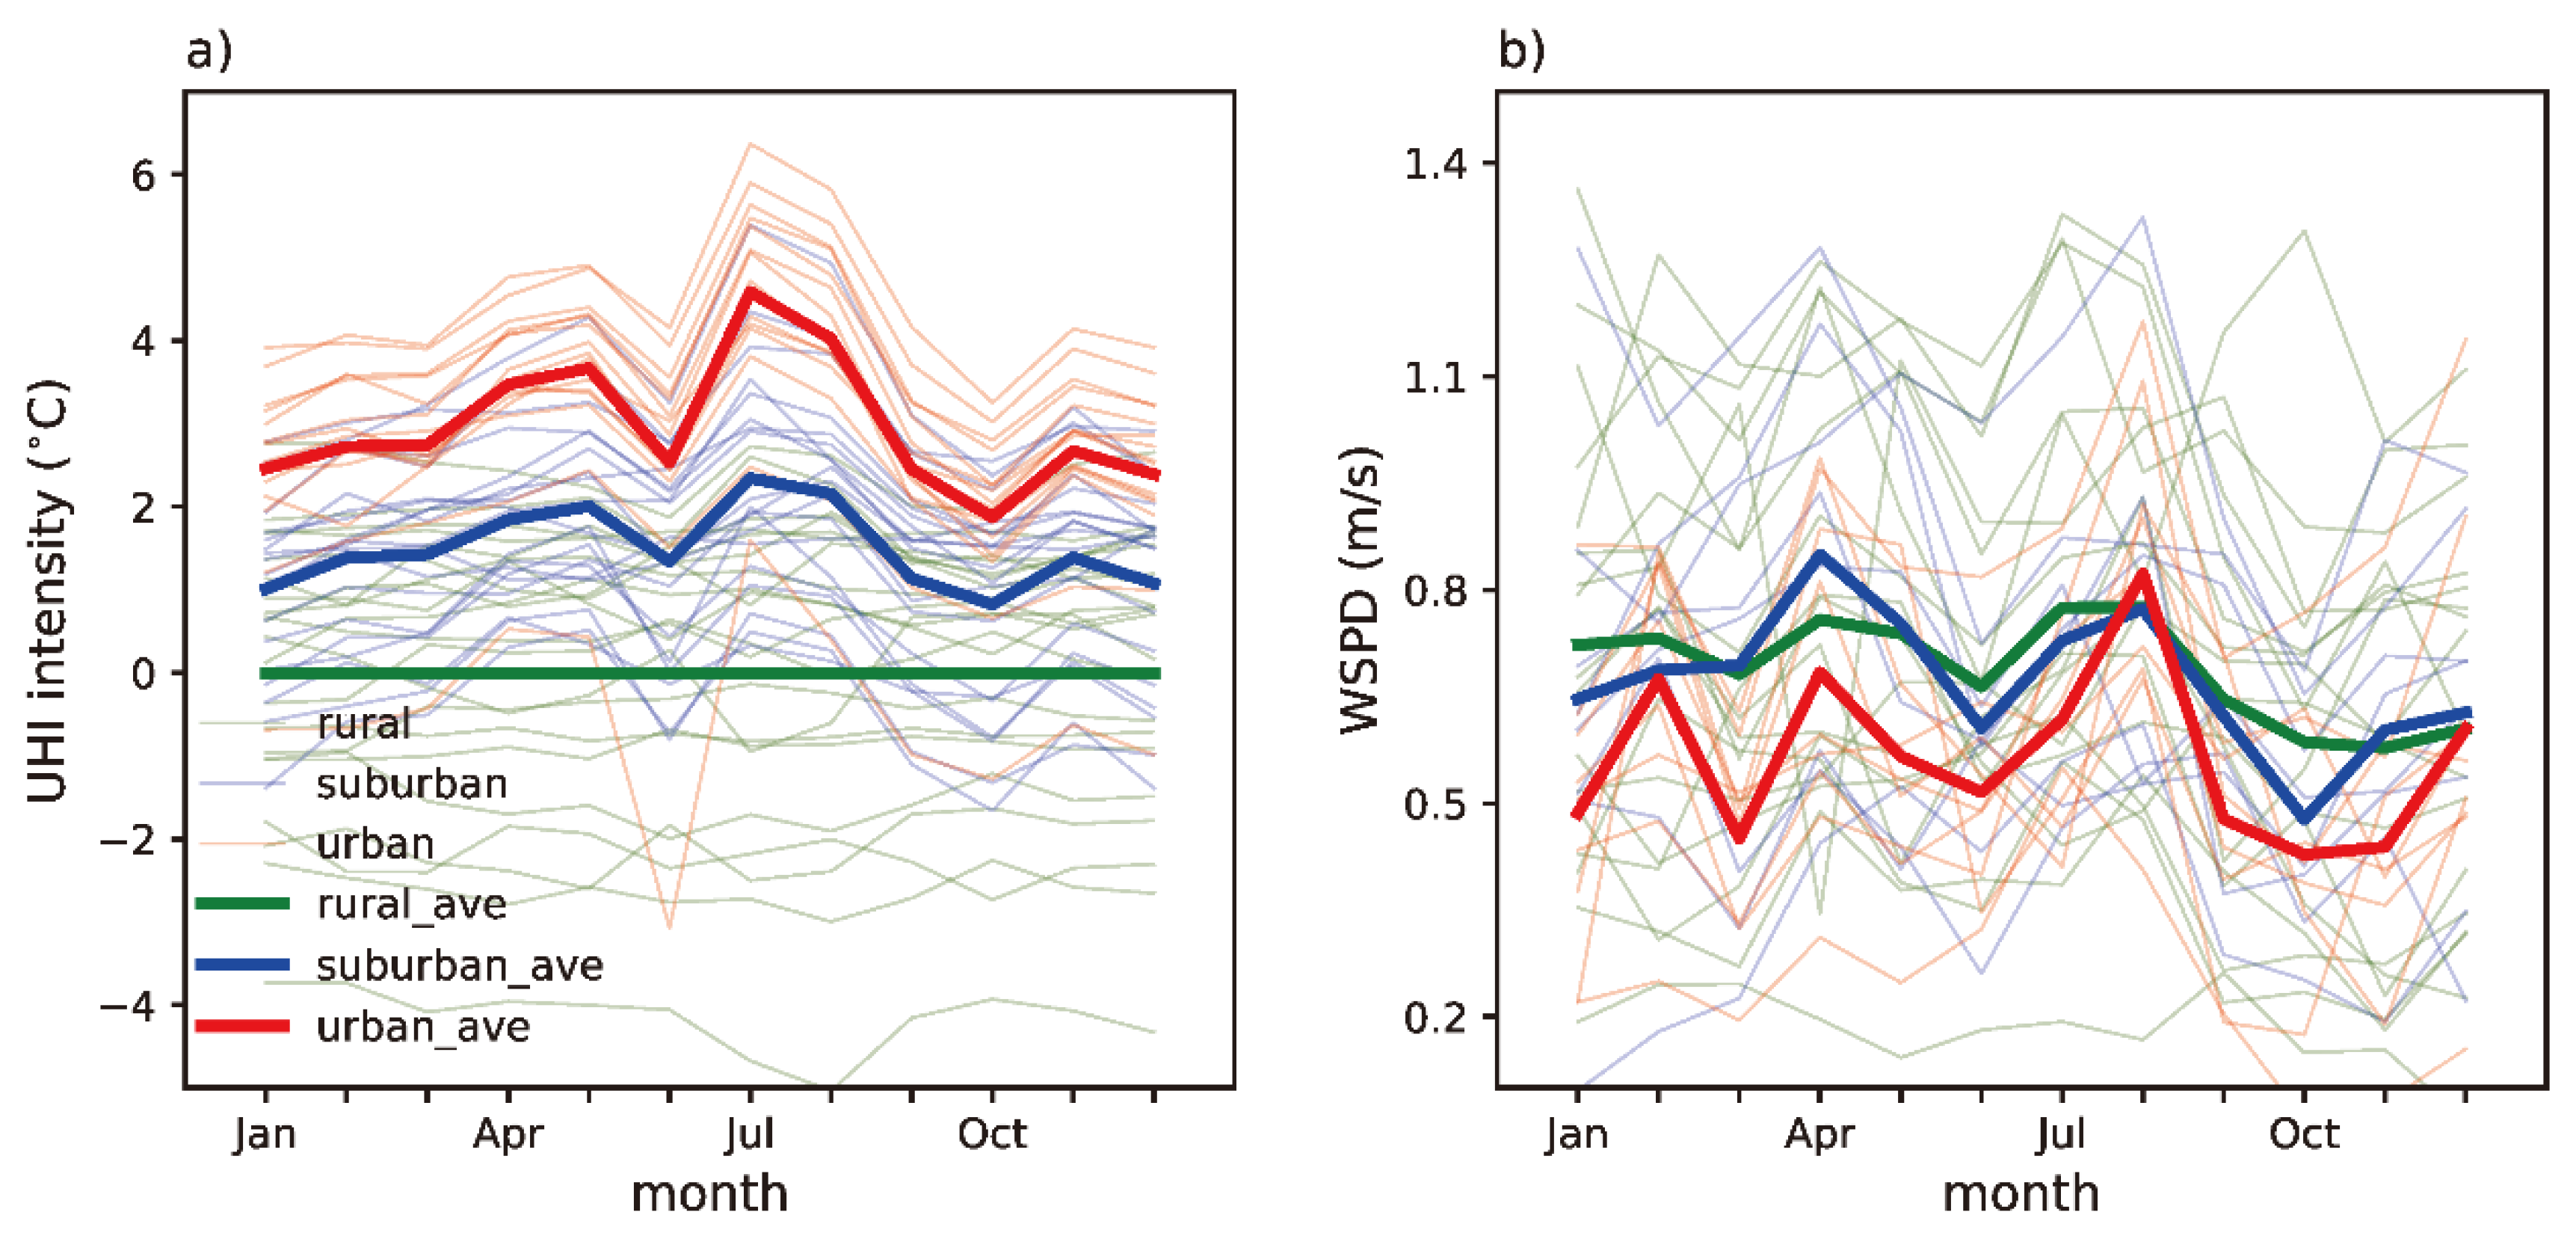
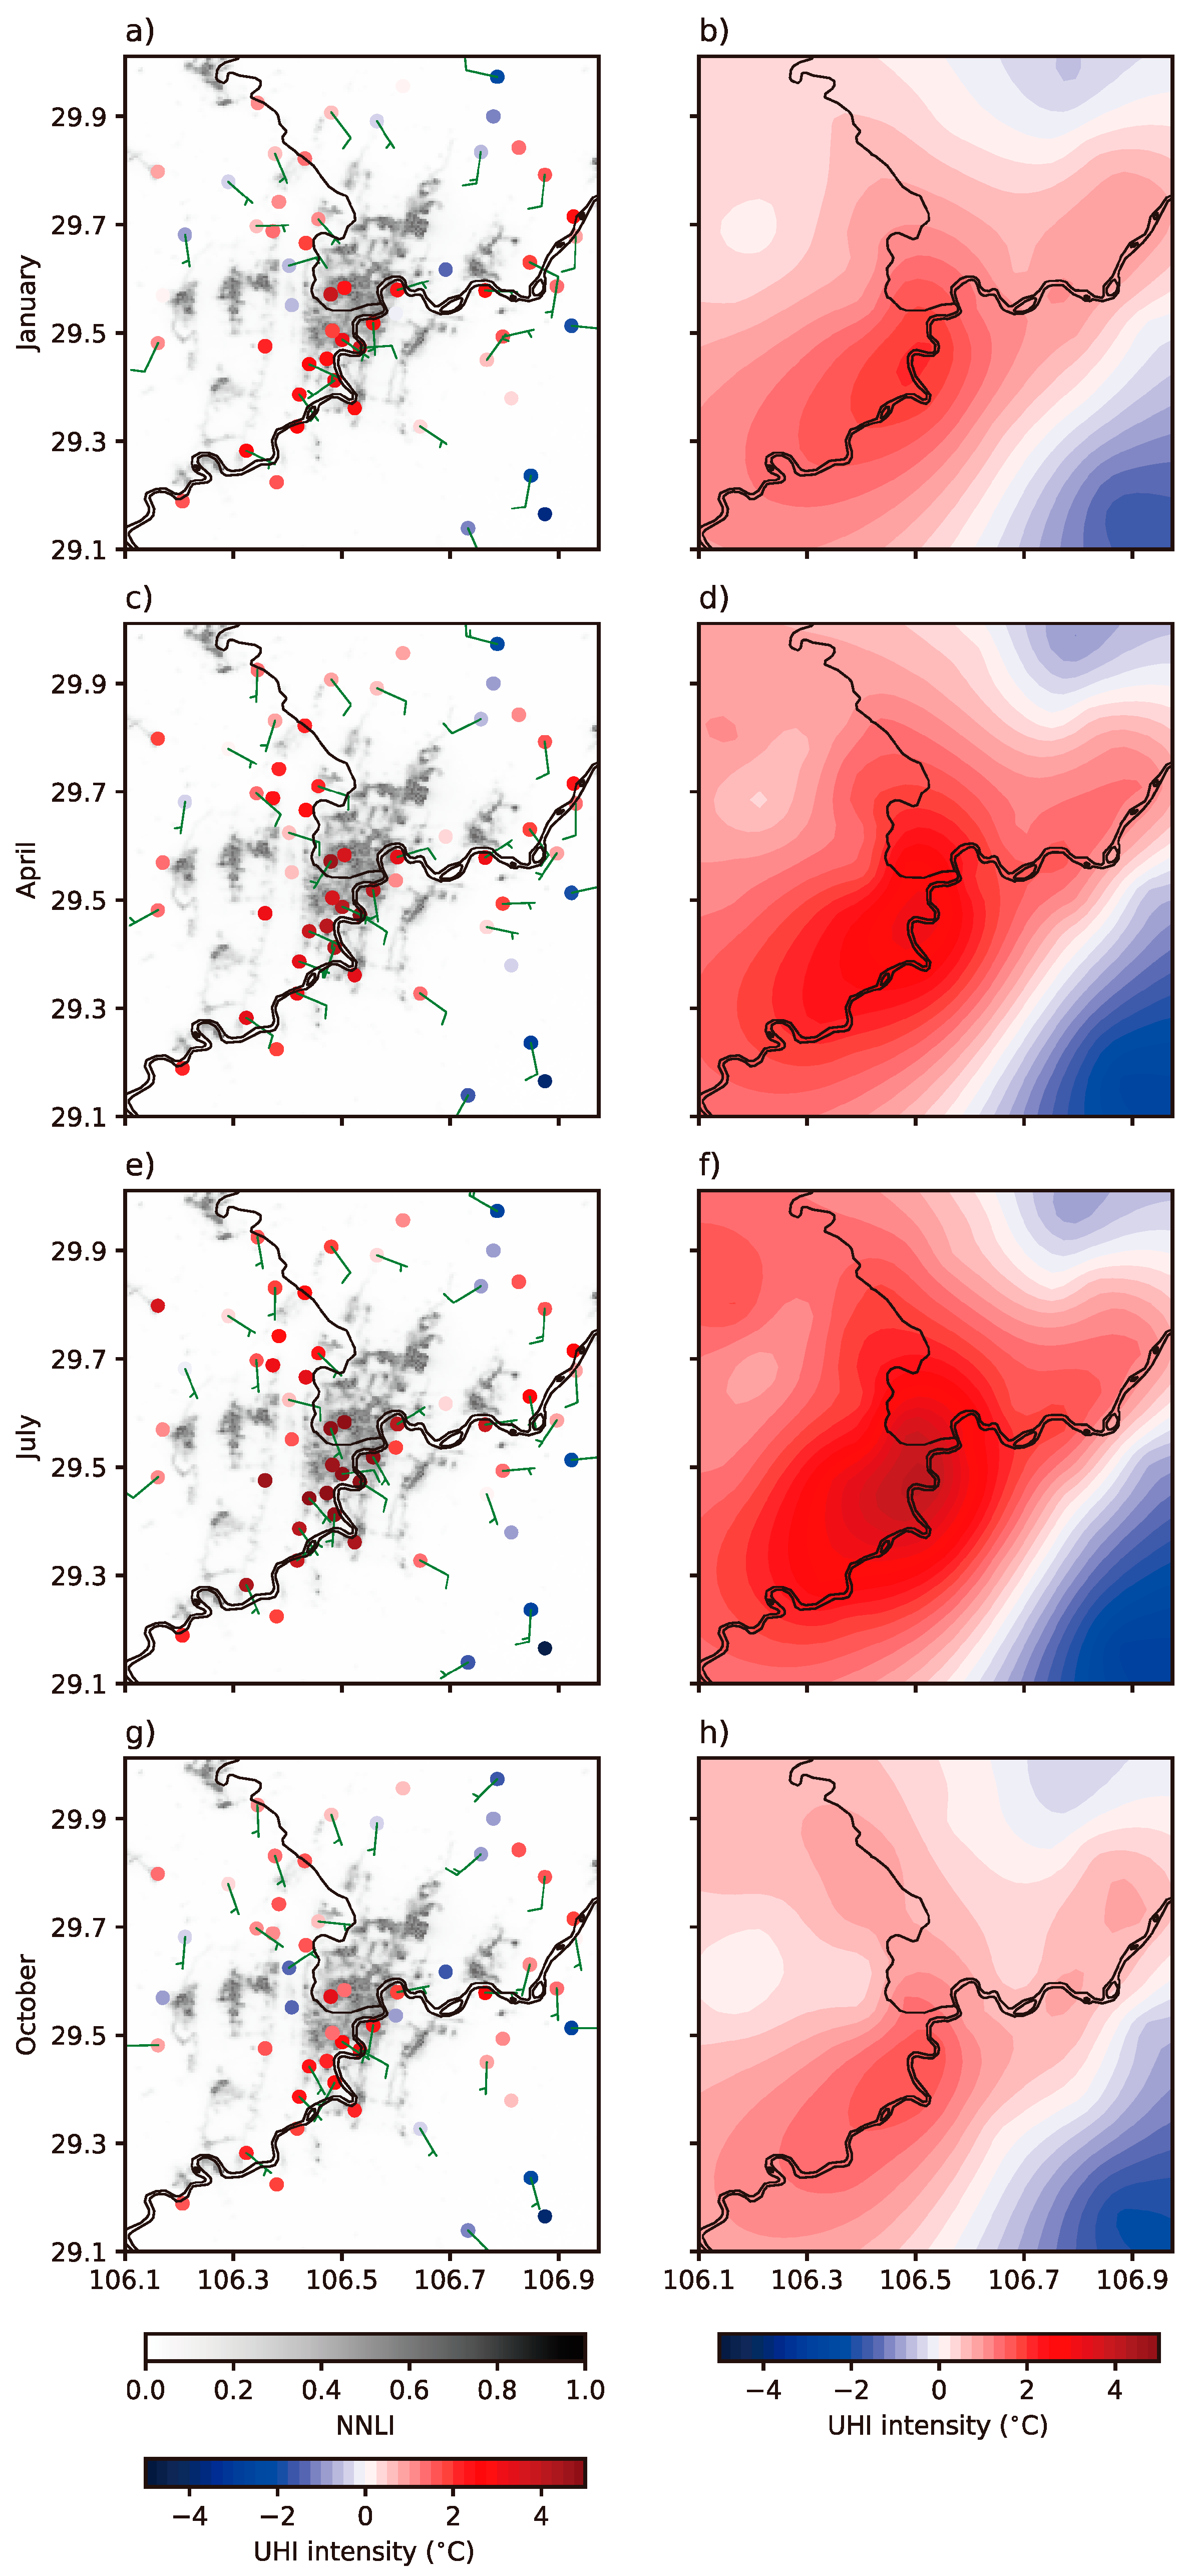
Figure 8 shows the mean UHI intensity at urban and suburban sites as a function of month and time of the day. It is found that at a certain time of the day, the UHI intensity shows a notable warm–cold season contrast at both urban and suburban areas. However, throughout the year, the timing of the strongest UHI intensity always occurs at around midnight (00 LST). Thus, for a better illustration on seasonal variations, the UHI intensity at midnight is analyzed. The results are shown in Figure 9a. A prominent warm–cold contrast of UHI intensity is detected, which is similar to other cities (e.g., [30]). The UHI intensity is most strong (weak) in July (October), and the mean UHI intensity of urban sites could reach ~4.5 (~2.1) °C. This kind of seasonal cycle is also seen in UHI intensity spatial scatters and kriging-interpolated spatial pattern (Figure 10). Note that the UHI intensity shows a sudden decrease in June, this might be attributed to abundant precipitation and few temperature samples in the month.
On a seasonal scale, the urbanization effect on surface air temperature can also be implied by different UHI intensities over urban and suburban areas (Figure 9a). The rural (urban) areas collocated with the sites with weak (strong) UHI intensity (left column in Figure 10). A quantitative analysis is carried out by correlating the urbanization level (NNLI) to UHI intensity for four months (right column in Figure 5). The results show that in a whole year, urbanization has a positive effect on increasing SAT. However, its influence degree varies from month to month. The urbanization impacts SAT most in July (b = 6.65) and least in October (b = 2.85). This might be attributed to the increase of anthropogenic heat release to mitigate the effects of oppressive weather in Sichuan Basin during summer time [46].
Even though the warm–cold season contrast is prominent in UHI intensity, a clear seasonal variation of near-surface wind speed is not discerned (Figure 9b). As discussed above, the wind speed difference between urban and rural surfaces is reduced at night due to stronger momentum vertical mixing. Thus, the winds at midnight exhibits a relatively homogeneous spatial distribution in a certain month, and the wind patterns vary little from month to month (left column of Figure 10). The correlation between the wind speed and UHI intensity is only significant at the 0.05 level (r = 0.69 (0.65) in urban (suburban) areas). This indicates that wind speed might not be an appropriate indicator explaining the variations of SAT on a seasonal scale. Some other factors, such as extra heat emission, have played more important roles in determining the UHI intensities in Chongqing City [12].
Like the diurnal cycle, the impacts of EET cooling rate at rural sites on UHI seasonal features are examined (Figure 11). It shows that their relationships are seasonally dependent. More events of intense UHI with strong rural cooling rate during EET occurs in summer than other seasons (Figure 11c). In summer, the nights are often controlled by clam and cloudless conditions. Thus, the rural SAT decreases more quickly because of faster radiative cooling. However, the daytime-stored heat in urban areas is harder to dissipate because of more windless circulations induced by large-scale topography (the Sichuan Basin) [13,47]. Meanwhile, more anthropogenic heat is likely released to relieve the hot weather. As a result, the urban SAT decreases little and even becomes higher than the day. Thus, the nocturnal UHI is most intense in summer. As an indicator, the rural cooling rate during EET contributes to UHI intensity most in summer as the summer regression coefficient is largest (b = −1.04 in urban sites and –0.63 in suburban sites). Note that the rural cooling rate is also correlated to UHI intensity most closely in summer with r = −0.53 in both urban and suburban areas, though the RMSD is relatively big (RMSD = 1.15 at urban sites).

5. Discussions and Conclusions

The spatial and temporal features of UHI intensity in mountainous Chongqing are investigated using a dense surface monitoring network. The AWSs are classified into detailed categories based on the quantitative urbanization level estimated by NNLI from VIIRS DNB. The temperature data observed at various altitudes is corrected to a same level utilizing the lapse rate derived from the nearest sounding data. The results of kriging interpolation show that UHI intensity exhibits a clear spatial pattern over Chongqing City. The UHI intensity is closely related to underlying surfaces, and the strongest UHI intensity is confined around the most urbanized areas.
The UHI intensity in Chongqing City has a notable temporal (both diurnal and seasonal) variation. The UHI intensity is found to be strongest at night and in warm season, and the magnitude could reach ~4.5 °C on summer night. The urbanization effect plays a critical role in determining the UHI intensity. The quantitative analysis shows a profound contribution of urbanization level (NNLI) to UHI intensity both at night (b = 4.31) and in summer (b = 6.65). At night, the urban extra heat such as reflections of longwave radiation by buildings and daytime-stored heat release from artificial materials, is added into the boundary layer, which therefore compensates part of urban heat loss and leads to stronger UHI intensity. In summer, the urban areas are frequently controlled by oppressively hot weather. To relieve the adverse condition, more anthropogenic heat is released. As a result, the temperatures are higher in urban areas.
The near-surface wind speed and rural cooling rate during EET are analyzed to serve as indicators estimating the UHI intensity. The wind exhibits a clear diurnal cycle with a maximum in the day and a minimum at night. This variation corresponds to that of UHI intensity. On a seasonal scale, however, the wind speed remains nearly unchanged, and is quite different from the UHI intensity. This discrepancy indicates that when considering the role of winds, the temporal variation of UHI intensity should be interpreted with caution. The rural cooling rate during EET is elucidated to regulate nocturnal UHI intensity with a regression coefficient of −0.70 (−0.37) in urban (suburban) sites. Because of more windless and cloudless background circulations during summer time, the rural cooling rate contributes to UHI intensity more in summer (b = −1.04) than other seasons.
This paper mainly investigates the spatial and temporal features of UHI intensity in mountainous city that are barely revealed before. The causative factors of UHI intensity variations are not discussed. There needs more intense, extensive, and diverse observations (such as radiations and heat fluxes) to elaborate how the SAT varies based on the analysis of each term in surface energy balance equation (e.g., [35]). Though the temperatures sampled over complex topography are corrected using an empirical method, the 10-m winds are not. This would lead to contradictory results on the relationship between winds and UHI intensity as the winds (both direction and speed) could vary dramatically at different heights in boundary layer, especially in mountainous region. Downscaling of prognostic mesoscale model (e.g., WRF) with high-resolution model (e.g., CALMET) provides a feasible way to produce surface wind fields in complex terrain [48,49].

Author Contributions

Conceptualization, P.J., X.L., H.Z., and Y.L.; Data curation, P.J., X.L., and H.Z.; Formal Analysis, P.J., X.L., and H.Z.; Funding Acquisition, Y.L.; Investigation, Y.L.; Methodology, P.J. and H.Z.; Resources, Y.L.; Software, P.J., X.L. and H.Z.; Supervision, X.L. and Y.L.; Validation, P.J., X.L., H.Z., and Y.L.; Visualization, P.J. and H.Z.; Writing—Original Draft, P.J. and H.Z.; Writing—Review & Editing, Ping Jiang, X.L. and H.Z.

Funding

This research was jointly supported by the National Natural Science Foundation of China, Grant Number 41875111, the Youth Foundation of Chongqing Meteorological Bureau, Grant Number QNJJ-201907, and the Planning Project of Chongqing Construction Science and Technology, Grant Number CKZ-2015-2-10.

Acknowledgments

The authors thank three anonymous reviewers for their kindly suggestions and comments.

Conflicts of Interest

The authors declare no conflicts of interest.

References

  1. Oke, T.R. The distinction between canopy and boundary layer urban heat islands. Atmosphere 1976, 14, 268–277. [Google Scholar] [CrossRef]
  2. Oke, T.R. Canyon geometry and the nocturnal urban heat island: Comparison of scale model and field observations. Int. J. Climatol. 1981, 1, 237–254. [Google Scholar] [CrossRef]
  3. Oke, T.R. The energetic basis of the urban heat island. Q. J. R. Meteorol. Soc. 1982, 108, 1–24. [Google Scholar] [CrossRef]
  4. Arnfield, A.J. Two decades of urban climate research: A review of turbulence, exchanges of energy and water, and the urban heat island. Int. J. Climatol. 2003, 23, 1–26. [Google Scholar] [CrossRef]
  5. Hu, X.M.; Xue, M.; Klein, P.M.; Illston, B.G.; Chen, S. Analysis of urban effects in Oklahoma City using a dense surface observing network. J. Appl. Meteorol. Climatol. 2016, 55, 723–741. [Google Scholar] [CrossRef]
  6. Morini, E.; Castellani, B.; Presciutti, A.; Filipponi, M.; Nicolini, A.; Rossi, F. Optic-energy performance improvement of exterior paints for buildings. Energy Build. 2017, 139, 690–701. [Google Scholar] [CrossRef]
  7. Nouri, A.S.; Costa, J.P.; Santamouris, M.; Matzarakis, A. Approaches to outdoor thermal comfort thresholds through public xpace design: A Review. Atmosphere 2018, 9, 108. [Google Scholar] [CrossRef]
  8. Castaldo, V.L.; Coccia, V.; Cotana, F.; Pignatta, G.; Pisello, A.L.; Rossi, F. Thermal-energy analysis of natural “cool” stone aggregates as passive cooling and global warming mitigation technique. Urban Clim. 2015, 14, 301–314. [Google Scholar] [CrossRef]
  9. Yang, J.; Kumar, D.I.M.; Pyrgou, A.; Chong, A.; Santamouris, M.; Kolokotsa, D.; Eang, L.S. Green and cool roofs’ urban heat island mitigation potential in tropical climate. Sol. Energy 2018, 173, 597–609. [Google Scholar] [CrossRef]
  10. Miao, S.G.; Chen, F.; Lemone, M.A.; Tewari, M.; Li, Q.C.; Wang, Y.C. An observational and modeling study of characteristics of urban heat island and boundary layer structures in Beijing. J. Appl. Meteorol. Climatol. 2009, 48, 484–501. [Google Scholar] [CrossRef]
  11. Morini, E.; Touchaei, A.G.; Rossi, F.; Cotana, F.; Akbari, H. Evaluation of albedo enhancement to mitigate impacts of urban heat island in Rome (Italy) using WRF meteorological model. Urban Clim. 2018, 24, 551–566. [Google Scholar] [CrossRef]
  12. Yang, P.; Ren, G.; Liu, W. Spatial and temporal characteristics of Beijing urban heat island intensity. J. Appl. Meteorol. Climatol. 2013, 52, 1803–1816. [Google Scholar] [CrossRef]
  13. Bassett, R.; Cai, X.; Chapman, L.; Heaviside, C.; Thornes, J.E.; Muller, C.L.; Young, D.T.; Warren, E.L. Observations of urban heat island advection from a high-density monitoring network. Q. J. R. Meteorol. Soc. 2016, 142, 2434–2441. [Google Scholar] [CrossRef]
  14. Hu, X.-M.; Xue, M. Influence of synoptic sea-breeze fronts on the urban heat island intensity in Dallas–Fort Worth, Texas. Mon. Weather Rev. 2016, 144, 1487–1507. [Google Scholar] [CrossRef]
  15. Lee, D.O. Urban warming? An analysis of recent trends in London’s heat island. Weather 1992, 47, 50–56. [Google Scholar] [CrossRef]
  16. Kim, Y.-H.; Baik, J.-J. Maximum urban heat island intensity in Seoul. J. Appl. Meteorol. 2002, 41, 651–659. [Google Scholar] [CrossRef]
  17. Ganbat, G.; Han, J.-Y.; Ryu, Y.-H.; Baik, J.-J. Characteristics of the urban heat island in a high-altitude metropolitan city, Ulaanbaatar, Mongolia. Asia-Pac. J. Atmos. Sci. 2013, 49, 535–541. [Google Scholar] [CrossRef]
  18. Magee, N.; Curtis, J.; Wendler, G. The urban heat island effect at Fairbanks, Alaska. Theor. Appl. Climatol. 1999, 64, 39–47. [Google Scholar] [CrossRef]
  19. Philandras, C.M.; Metaxas, D.A.; Nastos, P.T. Climate variability and urbanization in Athens. Theor. Appl. Climatol. 1999, 63, 65–72. [Google Scholar] [CrossRef]
  20. Fenner, D.; Meier, F.; Scherer, D.; Polze, A. Spatial and temporal air temperature variability in Berlin, Germany, during the years 2001–2010. Urban Clim. 2014, 10, 308–331. [Google Scholar] [CrossRef]
  21. Basara, J.B.; Basara, H.G.; Illston, B.G.; Crawford, K.C. The impact of the urban heat island during an intense heat wave in Oklahoma City. Adv. Meteorol. 2010, 7, 185–194. [Google Scholar] [CrossRef]
  22. Peng, S.S.; Piao, S.L.; Ciais, P.; Friedlingstein, P.; Ottle, C.; Breon, F.-M.; Nan, H.; Zhou, L.; Myneni, R.B. Surface urban heat island across 419 global big cities. Environ. Sci. Technol. 2011, 46, 696–703. [Google Scholar] [CrossRef] [PubMed]
  23. Cui, Y.; de Foy, B. Seasonal variations of the urban heat island at the surface and the near-surface and reductions due to urban vegetation in Mexico City. J. Appl. Meteorol. Climatol. 2012, 51, 855–868. [Google Scholar] [CrossRef]
  24. Zeng, M. Study on Spatial-Temporal Distribution and Causes of Urban Heat Island in Chongqing. Master’s Thesis, Southwest University, Chongqing, China, 2014. (In Chinese). [Google Scholar]
  25. Yang, P.; Liu, W.; Zhong, J.; Yang, J. Evaluating the Quality of Temperature Measured at Automatic Weather Stations in Beijing. J. Appl. Meteorol. Sci. 2011, 22, 706–715. (In Chinese) [Google Scholar]
  26. Basara, J.B.; Hall, P.K.; Schroeder, A.J.; Illston, B.G.; Nemunaitis, K.L. Diurnal cycle of the Oklahoma City urban heat island. J. Geophys. Res. Atmos. 2008, 113, 1–16. [Google Scholar] [CrossRef]
  27. Small, C.; Pozzi, F.; Elvidge, C.D. Spatial analysis of global urban extent from DMSP-OLS night lights. Remote Sens. Environ. 2005, 96, 277–291. [Google Scholar] [CrossRef]
  28. Zhang, Q.; Seto, K.C. Mapping urbanization dynamics at regional and global scales using multi-temporal DMSP/OLS nighttime light data. Remote Sens. Environ. 2011, 115, 2320–2329. [Google Scholar] [CrossRef]
  29. Li, Q.; Lu, L.; Weng, Q.; Xie, Y.; Guo, H. Monitoring urban dynamics in the Southeast U.S.A. using time-series DMSP/OLS nightlight imagery. Remote Sens. 2016, 8, 578. [Google Scholar] [CrossRef]
  30. Kim, Y.-H.; Baik, J.-J. Spatial and temporal structure of the urban heat island in Seoul. J. Appl. Meteorol. Climatol. 2005, 44, 591–605. [Google Scholar] [CrossRef]
  31. Clark, M.R.; Parker, D.J. On the Mesoscale Structure of Surface Wind and Pressure Fields near Tornadic and Nontornadic Cold Fronts. Mon. Weather Rev. 2014, 142, 3560–3585. [Google Scholar] [CrossRef]
  32. Miao, S.; Li, P.; Wang, X. Building morphological characteristics and their effect on the wind in Beijing. Adv. Atmos. Sci. 2009, 26, 1115–1124. [Google Scholar] [CrossRef]
  33. Karl, T.R.; Jones, P.D.; Knight, R.W.; Kukla, G.; Plummer, N.; Razuvayev, V.; Gallo, K.P.; Lindseay, J.; Charlson, R.J.; Peterson, T. A new perspective on cecent global warming: Asymmetric trends of daily maximum and minimum temperature. Bull. Am. Meteorol. Soc. 1993, 74, 1007–1024. [Google Scholar] [CrossRef]
  34. Gedzelman, S.D.; Austin, S.; Cermak, R.; Stefano, N.; Partridge, S.; Quesenberry, S.; Robinson, D.A. Mesoscale aspects of the urban heat island around New York City. Theor. Appl. Climatol. 2003, 75, 29–42. [Google Scholar]
  35. Zhao, L.; Lee, X.; Smith, R.B.; Oleson, K. Strong contributions of local background climate to urban heat islands. Nature 2014, 511, 216–219. [Google Scholar] [CrossRef]
  36. Schwarz, N.; Lautenbach, S.; Seppelt, R. Exploring indicators for quantifying surface urban heat islands of European cities with MODIS land surface temperatures. Remote Sens. Environ. 2011, 115, 3175–3186. [Google Scholar] [CrossRef]
  37. Hu, Y.; Jia, G. Influence of land use change on urban heat island derived from multi-sensor data. Int. J. Climatol. 2010, 30, 1382–1395. [Google Scholar] [CrossRef]
  38. Yang, X.; Li, Y. The impact of building density and building height heterogeneity on average urban albedo and street surface temperature. Build. Environ. 2015, 90, 146–156. [Google Scholar] [CrossRef]
  39. Park, S.-B.; Baik, J.-J. Large-eddy simulations of convective boundary layers over flat and urbanlike surfaces. J. Atmos. Sci. 2014, 71, 1880–1892. [Google Scholar] [CrossRef]
  40. Yoo, C.; Lee, S.; Feldstein, S.B. Mechanisms of arctic surface air temperature change in response to the Madden-Julian oscillation. J. Clim. 2012, 25, 5777–5790. [Google Scholar] [CrossRef]
  41. Liu, W.T.; Katsaros, K.B.; Businger, J.A. Bulk parameterization of air-sea exchanges of heat and water vapor including the molecular constraints at the interface. J. Atmos. Sci. 1979, 36, 1722–1735. [Google Scholar] [CrossRef]
  42. Kamal, S.; Huang, H.P.; Myint, S.W. The influence of urbanization on the climate of the Las Vegas metropolitan area: A numerical study. J. Appl. Meteorol. Climatol. 2015, 54, 2157–2177. [Google Scholar] [CrossRef]
  43. Hu, X.-M.; Klein, P.M.; Xue, M.; Lundquist, J.K.; Zhang, F.; Qi, Y. Impact of low-level jets on the nocturnal urban heat island intensity in Oklahoma City. J. Appl. Meteorol. Climatol. 2013, 52, 1779–1802. [Google Scholar] [CrossRef]
  44. Nelson, M.; Pardyjak, E.R.; Klein, P.M. Momentum and turbulent kinetic energy budgets within the Park Avenue street canyon during the Joint Urban 2003 Field Campaign. Bound.-Lay. Meteorol. 2011, 140, 143–162. [Google Scholar] [CrossRef]
  45. Yow, D.M.; Carbone, G.J. The urban heat island and local temperature variations in Orlando, Florida. Southeast. Geogr. 2006, 46, 297–321. [Google Scholar] [CrossRef]
  46. Sala, J.Q.; Olcina, A.G.; Cuevas, A.P.; Cantos, J.O.; Amoros, A.R.; Chiva, E.M. Climatic warming in the Spanish Mediterranean: Natural trend or urban effect. Clim. Chang. 2000, 46, 473–483. [Google Scholar] [CrossRef]
  47. Shao, J.; Li, Y.; Ni, J. The characteristics of temperature variability with terrain, latitude and longitude in Sichuan-Chongqing Region. J. Geogr. Sci. 2012, 22, 223–244. [Google Scholar] [CrossRef]
  48. Yim, S.H.L.; Fung, J.C.H.; Lau, A.K.H.; Kot, S.C. Developing a high-resolution wind map for a complex terrain with a coupled MM5/CALMET system. J. Geophys. Res. Atmos. 2007, 112. [Google Scholar] [CrossRef]
  49. Wagenbrenner, N.S.; Forthofer, J.M.; Lamb, B.K.; Shannon, K.S.; Butler, B.W. Downscaling surface wind predictions from numerical weather prediction models in complex terrain with WindNinja. Atmos. Chem. Phys. 2016, 16, 5229–5241. [Google Scholar] [CrossRef]
Figure 1. Locations of (a) Chongqing Municipality (red curve) and (b) central urban area of Chongqing City. Shades in (a) and (b) are topography (m). (c) The corresponding satellite image of (b). Gray patches and dark green belt-like shapes in (c) denote urban areas and folding mountains, respectively.
Atmosphere 10 00067 g001
Figure 2. (a) Locations of urban (red dots) and rural (green dots) sites classified by 30-m land use (gray patches) from Institute of Geographic Sciences and Natural Resources Research in Chinese Academy of Sciences. Blue cross indicates the location of Shapingba sounding station. (b) Locations of urban (red dots), suburban (blue dots), and rural (green dots) sites sorted by normalized nighttime light index (NNLI) from the Visible Infrared Imaging Radiometer Suite day/night band (VIIRS-DNB) (shades; see the text).
Atmosphere 10 00067 g002
Figure 3. Mean diurnal cycle of (a) temperature (°C) and (b) urban heat island (UHI) intensity (°C) at each AWS in 2017. The red, blue and green lines indicate urban, suburban, and rural sites, respectively. Thin lines are variations of individual sites and thick lines are the averages of sites in certain categories.
Atmosphere 10 00067 g003
Figure 4. Spatial distribution of mean UHI intensity (°C) and winds (m/s) at (ac) 03, (df) 09, (gi) 15, and (jl) 21 local standard time (LST). Left column is scatter plot of UHI intensity (dots) and winds (barbs). A half (full) barb is 0.5 (1.0) m/s; only the winds ≥0.5 m/s are shown. Shades are NNLI. Middle (Right) column is the spatial pattern of UHI intensity (wind speed difference) using the kriging interpolation method.
Atmosphere 10 00067 g004
Figure 5. Correlations between UHI intensity (°C) and NNLI. (a), (c), (e) and (g) denote diurnal cycle, and are for 03, 09, 15 and 21 LST, respectively. (b), (d), (f) and (h) denote seasonal cycle, and are for January, April, July and October, respectively. Red, blue, and green dots indicate urban, suburban and rural sites, respectively.
Atmosphere 10 00067 g005
Figure 6. Same as Figure 3, but for mean diurnal cycle of (a) wind speed (m/s) and (b) wind speed difference (m/s; with respect to the average of rural sites).
Atmosphere 10 00067 g006
Figure 7. (a) Correlations between UHI intensity (°C) and mean rural cooling rate during early evening transition (EET) (°C /hour). Red and blue dots indicate urban and suburban sites, respectively. (b) Correlations between UHI intensity and mean rural heating rate during early morning.
Atmosphere 10 00067 g007
Figure 8. Mean UHI intensity (°C) at (a) suburban and (b) urban sites as a function of month and local standard time of the day.
Atmosphere 10 00067 g008
Figure 9. Mean seasonal cycle of (a) UHI intensity (°C) and (b) wind speed (m/s) at 00 LST of the day. The red, blue, and green lines indicate urban, suburban, and rural sites, respectively. Thin lines are variations of individual sites and thick lines are the averages of sites in certain categories.
Atmosphere 10 00067 g009
Figure 10. Spatial distribution of mean UHI intensity (°C) and winds (m/s) at (ab) January, (cd) April, (ef) July, and (gh) October at 00 LST of the day. Left column: scatter plot of UHI intensity (dots) and winds (barbs). A half (full) barb is 0.5 (1.0) m/s, and only the winds ≥0.5 m/s are shown. Shades are NNLI. Right column: spatial pattern of UHI intensity using the kriging interpolation method.
Atmosphere 10 00067 g010
Figure 11. Same as Figure 7, but for (a) January, (b) April, (c) July, and (d) October.
Atmosphere 10 00067 g011
Table 1. Detailed information of automatic weather stations (AWSs) in the research area.
RuralSuburbanUrban
IDLongitude °ELatitude °NElevation mNNLIIDLongitude °ELatitude °NElevation mNNLIIDLongitude °ELatitude °NElevation mNNLI
A7296106.79329.992455.30.006A7481106.93829.697203.00.030A8038106.41429.570517.90.203
A7302106.61929.975300.00.007A7074106.57129.910394.00.031A8034106.36529.494312.00.237
A7490106.73929.158650.00.007A7470106.65129.346286.50.032A7452106.42429.346220.00.248
A7473106.88129.184701.00.008A7317106.39029.761244.80.045A8048106.42829.405241.00.259
A7322106.85529.255569.90.010A7378106.48729.926271.10.054A8035106.54029.491250.00.275
A7301106.78629.919401.20.012A7465106.21229.208224.00.054A8043106.60929.598224.00.277
A7345106.29729.798295.00.013A7023106.83329.861220.00.055A7021106.46329.729336.00.340
A7033106.21729.700415.00.014A7316106.43829.841228.00.062A8047106.49329.431215.00.453
A7482106.81929.398242.00.015A8010106.69829.636560.00.065A8007106.47929.471310.00.468
A7483106.80329.512200.50.016A7390106.35129.944233.80.079A8009106.56429.537315.00.613
A7474106.90329.605220.70.017A7467106.38629.243219.00.080A8045106.50729.506256.00.708
A7305106.88129.811191.10.017A7136106.44029.685227.00.082A6100106.48629.590266.00.782
A7471106.93029.532558.00.018A8032106.77129.597202.00.096A8002106.48929.523377.10.790
A7472106.77429.469258.00.019A7348106.17629.588445.60.108A8000106.51129.602342.00.883
A7032106.16729.500275.00.020A8005106.37929.707267.80.120A7001106.53029.380242.60.953
A7135106.38329.850213.30.020A8003106.40929.643511.50.122
A7076106.93429.734193.00.020A8036106.44629.461277.00.164
A9015106.34929.716261.40.022A8011106.60629.555510.00.165
A7133106.76329.853460.00.026A7362106.16729.817260.00.171
A8037106.85329.649278.00.029A8046106.33029.301299.00.198