Article

Summertime Aerosol over the West of Ireland Dominated by Secondary Aerosol during Long-Range Transport

by
Chunshui Lin
1,2,3,
Darius Ceburnis
1,
Ru-Jin Huang
1,2,3,*,
Francesco Canonaco
4,
André Stephan Henry Prévôt
4,
Colin O'Dowd
1,* and
Jurgita Ovadnevaite
1
1
School of Physics, Ryan Institute’s Centre for Climate and & Pollution Studies, and Marine Renewable Energy Ireland, National University of Ireland Galway, University Road, Galway H91 CF50, Ireland
2
State Key Laboratory of Loess and Quaternary Geology and Key Laboratory of Aerosol Chemistry and Physics, Institute of Earth Environment, Chinese Academy of Sciences, Xi’an 710061, China
3
Center for Excellence in Quaternary Science and Global Change, Institute of Earth Environment, Chinese Academy of Sciences, Xi’an 710061, China
4
Laboratory of Atmospheric Chemistry, Paul Scherrer Institute (PSI), 5232 Villigen, Switzerland
*
Authors to whom correspondence should be addressed.
Atmosphere 2019, 10(2), 59; https://doi.org/10.3390/atmos10020059
Submission received: 18 January 2019 / Revised: 27 January 2019 / Accepted: 28 January 2019 / Published: 1 February 2019
(This article belongs to the Special Issue Aerosol Mass Spectrometry)

Abstract

:
The chemical composition and sources of non-refractory submicron aerosol (NR-PM1) on Galway, a west coast city of Ireland, were characterized using an aerosol chemical speciation monitor during summertime in June 2016. Organic aerosol (OA) was found to be the major part of NR-PM1 (54%), followed by secondary inorganic sulfate (25%), ammonium (11%), and nitrate (10%). Factor analysis revealed that oxygenated OA (OOA) was the dominant OA factor, on average accounting for 84% of the total OA. The remaining 16% of OA was attributed to primary peat burning associated with domestic heating activities. As a result, secondary organic and inorganic aerosol together accounted for 91% of the total NR-PM1, pointing to an aged aerosol population originating from secondary formation during long-range transport. Concentration-weighted trajectory analysis indicated that these secondary aerosols were mainly associated with easterly long-range transport from the UK and/or France.

1. Introduction

Atmospheric aerosol has a significant impact on visibility and air quality both locally and regionally, and plays an important role in climate by scattering and absorbing solar radiation, or by acting as a nucleus for cloud condensation [1,2,3,4]. It also has a serious impact on human health, increasing the risk of respiratory and cardiovascular diseases and even decreasing life expectancy [5,6,7,8]. Aerosol particles can be directly emitted from primary sources (e.g., traffic, domestic heating, wild fires, and volcano emissions) or be formed via gas-to-particle formation. These are known as primary and secondary aerosols, respectively. In order to design effective mitigation strategies for improving the air quality, knowledge of emission sources affecting the urban aerosol population has to be expanded.
With the advent of aerosol mass spectrometry (AMS) [9,10,11,12,13], chemical characterization and source apportionment of submicron aerosol has significantly improved [14,15,16]. AMS can provide near real-time measurements of non-refractory submicron aerosol species (NR-PM1): Organic aerosol (OA), sulfate, nitrate, ammonium, and chloride [17,18,19,20,21,22]. In addition, the application of positive matrix factorization (PMF) on the AMS OA matrix has demonstrated its source apportionment potential which could result in different sets of OA factors depending on the site [23,24,25,26,27,28,29]. These OA factors include primary OA (POA) and secondary OA (SOA) corresponding to specific sources and processes [30]. For example, hydrocarbon-like OA (HOA) factor is primary and is usually associated with traffic emission [31]. Oxygenated OA (OOA) is more related to secondary processes or aging primary and could be associated with both regional transport and local secondary production [32].
Galway city, located on the west coast of Ireland, with a population of ~80,000, has been designated as the 2020 European Capital of Culture. However, the knowledge of particulate matter (PM) components in Galway is very limited [33]. Our winter campaign has indicated that pollution events, with peak NR-PM1 concentration >20 μg m−3, were mainly caused by local domestic heating sources [33]. However, sources dominating PM concentrations during summer remain unknown.
In this study, the chemical composition of NR-PM1 in June 2016 was characterized using an aerosol chemical speciation monitor (ACSM) and OA source apportionment was performed using both PMF and multi-linear engine (ME-2). Finally, the possible geographic origins of the NR-PM1 components were analyzed through examination of the influence of air mass trajectories.

2. Methods

2.1. Aerosol Measurements

Non-refractory submicron (NR-PM1) aerosol species including organics, sulfate, nitrate, and ammonium were measured in situ at the same location as Lin et al. [33] (i.e., at the National University of Ireland, Galway (53.28° N and 9.06° W)) from 1 to 22 June 2016. The measurement site is representative of the regional background conditions over the region of Galway, on the west coast of Ireland. The aerosol sampling setup and the ACSM operation in this study were also the same as those in Lin et al. [33]. Briefly, the ambient air was drawn from a height of around 6 m above the ground at a flow rate of 3 L/min with a sub-stream of 85 mL/min being drawn into the ACSM. In the ACSM, the NR-PM1 was vaporized at 600 °C with a standard vaporizer and subsequently ionized by electron impact. The resulting ions were analyzed by quadrupole mass analyzer. The time resolution of ACSM in this study was set to 30 min.
ACSM standard data analysis software (v 1.6.0.3) was used to process the mass concentrations of organics, sulfate, nitrate, and ammonium. Chloride accounted for a minor fraction (<1%) of the total NR-PM1 and was not included in the discussion. A collection efficiency (CE) of 1 was applied for all species, which provides a lower limit for ACSM-measured mass concentration. This CE was validated against a collocated scanning mobility particle sizer (SMPS) in our previous study with the same instrument [29]. The sum of the calculated ACSM volume and black carbon (BC) volume correlated well with the PM1 volume from the SMPS, with a slope close to unity and correlation coefficient r = 0.96 [29]. It is worthy to note that changes in CE will not affect the relative contribution of chemical species, since the same CE was applied to all measured species. OA mass spectra matrix and error matrix were also extracted using this software for subsequent PMF analysis.

2.2. OA Source Apportionment

A PMF model was used to analyze the ACSM organic mass spectra to separate OA into different factors in terms of their mass spectra and time series. The PMF model is defined as
X i j = k = 1 p G i k F k j + E i j ,
where X represents the ACSM OA matrix, F represents the profile (or mass spectra) of this factor, G represents the time series of this factor, and E represents the residue. Column i corresponds to time, and j to m/z. p is the number of factors of the chosen solution. PMF requires non-negative entries for G and F to be physically meaningful. PMF uses a least squares algorithm that iteratively minimizes the objective function Q, defined as
Q m = i = 1 m j = 1 n ( e i j σ i j ) ,
where σij represents measurement uncertainty. The preparation of organic and uncertainty matrix followed the recommendation of Ulbrich et al. [34]. Data points with a low signal-to-noise ratio (SNR; < 0.2) were removed, whereas data with SNR in the range of 0.2–2 were down-weighted by a factor of 2. PMF was run with a robust mode. In this study, organic fragments with m/z ≤ 100 were analyzed. Higher m/z values were not included because of the low SNR.
PMF does not require any prior information but may have a substantial degree of rotational ambiguity [35]. The rotational ambiguity may result in fewer factors or inaccurate factor attributions when some factors have similar temporal variation. To reduce rotational ambiguity, a priori information, such as factor profile, can be used to constrain the PMF model.
Multi-linear engine (ME-2) is a solver of PMF. ME-2 can partly constrain the factors based on a priori information such as factor profiles (used in this study) and time series. The so-called a value approach within ME-2 was used, where a value represents the extent to which the reference profiles are allowed to vary (e.g., an a value of 0.05 allows a variability of 5%). The interface of Source Finder (SoFi) [27] was used to run both PMF and ME-2.

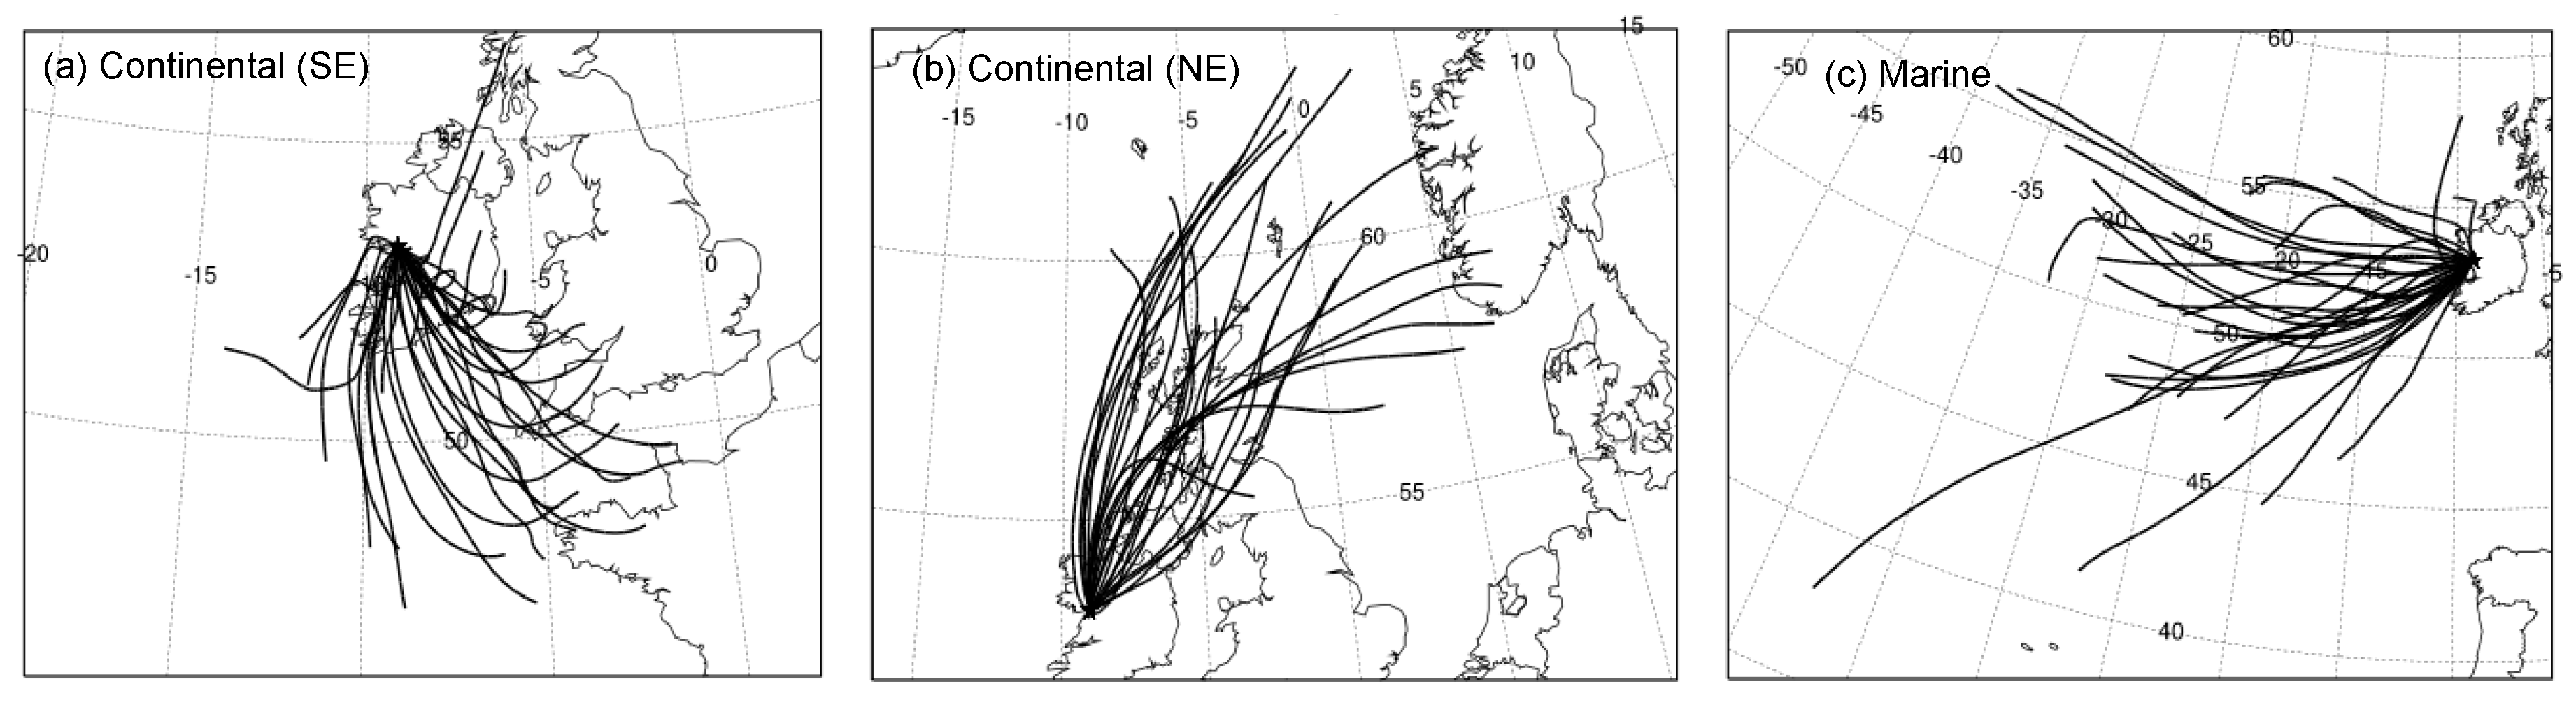
2.3. Back Trajectory Analysis

Air mass back trajectories were calculated using the Hybrid Single-Particle Lagrangian Integrated Trajectory (HYSPLIT), a transport and dispersion model developed by the NOAA Air Resources Laboratory [36]. The back trajectories were calculated every 6 h for an arrival height of 500 m and length of 72 h.
The concentration-weighted trajectory (CWT) approach was used to investigate the potential transport of pollution [37] on the interface of ZeFir [38]. CWT couples concentration data with air mass history to identify potential source regions that may be responsible for high concentrations observed at the receptor site. A weighing function was added to the CWT calculation to down-weight cells associated with a low count of trajectory endpoints. The setup of the different weights is empirical, and our setup followed the recommendation of Petit et al., [37]. The weighing function was based on the trajectory density; the weighing coefficients were relative to the maximum of this density.

3. Results

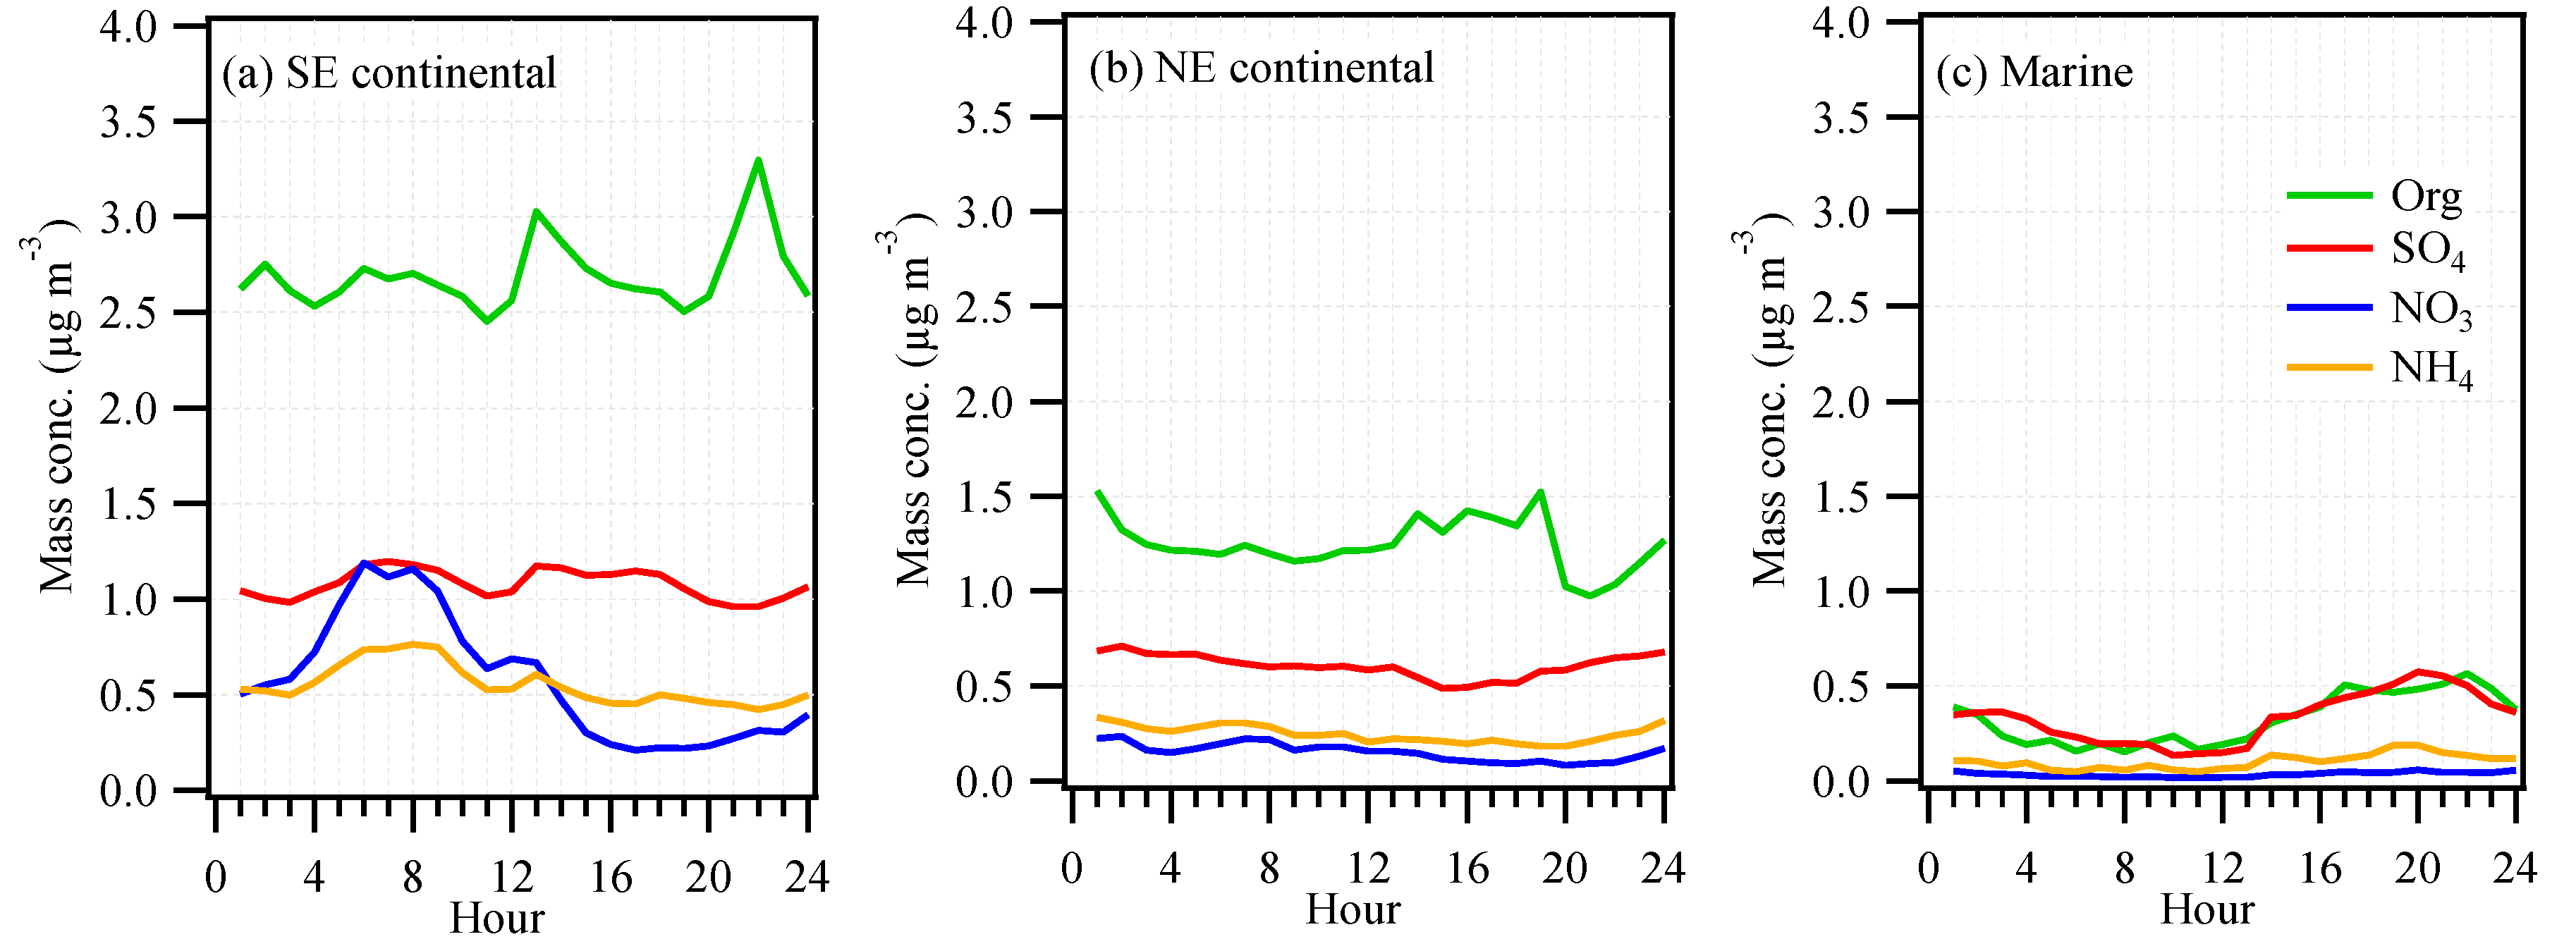
3.1. Mass Concentration and Chemical Composition

Time series of the OA, sulfate, nitrate, and ammonium, as well as meteorological parameters (temperature, wind speed, wind direction, relative humidity, pressure, and precipitation), are presented in Figure 1. Over the measurement period, the average temperature was 15.4 ± 3.4 °C (± standard deviation) varying from 4.5 to 23.3 °C. The ambient relative humidity had a mean value of 79 ± 14%, ranging from 39% to 97%. Westerly and easterly winds alternated during the measurement period, with a mean wind velocity of 2.2 ± 1.6 m/s ranging from 0.5 to 8.0 m/s. The median and mean value of total NR-PM1 mass were 2.3 and 2.7 ± 2.3 μg m−3 (ranging from <0.5 to 14.4 μg m−3), respectively. These values were much lower than the ones reported for summer in Paris (with a mean NR-PM1 of ~4.0 μg m−3) [15] and London (with a mean NR-PM1 of ~9.0 μg m−3) [39]. The mean value was also lower than that measured at the same site in winter (winter mean NR-PM1 = 3.4 μg m−3) [33]. Overall, NR-PM1 was dominated by OA, which accounted for 54% of the total mass, followed by sulfate (25%), ammonium (11%), and nitrate (10%). The absolute NR-PM1 concentration was dependent on specific meteorological parameters. For example, high NR-PM1 concentrations (4–9 June) were mainly associated with easterly winds and relatively low wind speed. In contrast, low NR-PM1 concentrations (12–14 June) were mainly associated with westerly winds and relatively high wind speed.
Average diurnal cycles of OA, sulfate, nitrate, and ammonium over the three periods in different air masses are shown in Figure 2. OA was flat throughout the day, with a slight increase in the midday and in the evening in southeast (SE) continental air masses (Figure 2a), indicating that the measurement site was not influenced by any strong local emission. OA remained at the level of around 2.7 μg m−3, more than 2 times higher than other species. Sulfate and ammonium showed a similar pattern, with no obvious trend. However, nitrate presented in relatively higher concentrations during the night (with a maximum at 5:00 am, local time) and lower concentrations during the day (with a minimum at 16:00), suggesting strong influences from evaporative loss and gas–aerosol partitioning. As discussed in Section 3.4, the major source of nitrate was from regional transport. Therefore, the diurnal variation of nitrate was driven solely by evaporative loss and gas-to-particle partitioning. In northeast (NE) continental air masses, none of the NR-PM1 species showed any obvious trend and all were relatively flat except for OA, which showed a slight drop in the evening (Figure 2b). The concentrations of NR-PM1 species were 1.6–3.6 times lower in NE continental air masses than in SE continental air masses. In marine air masses, all the NR-PM1 concentrations were the lowest among the three studied periods (Figure 2c). OA and sulfate showed a similar trend, with an increase from ~13:00 until 20:00, indicating a similar source or an aging process.

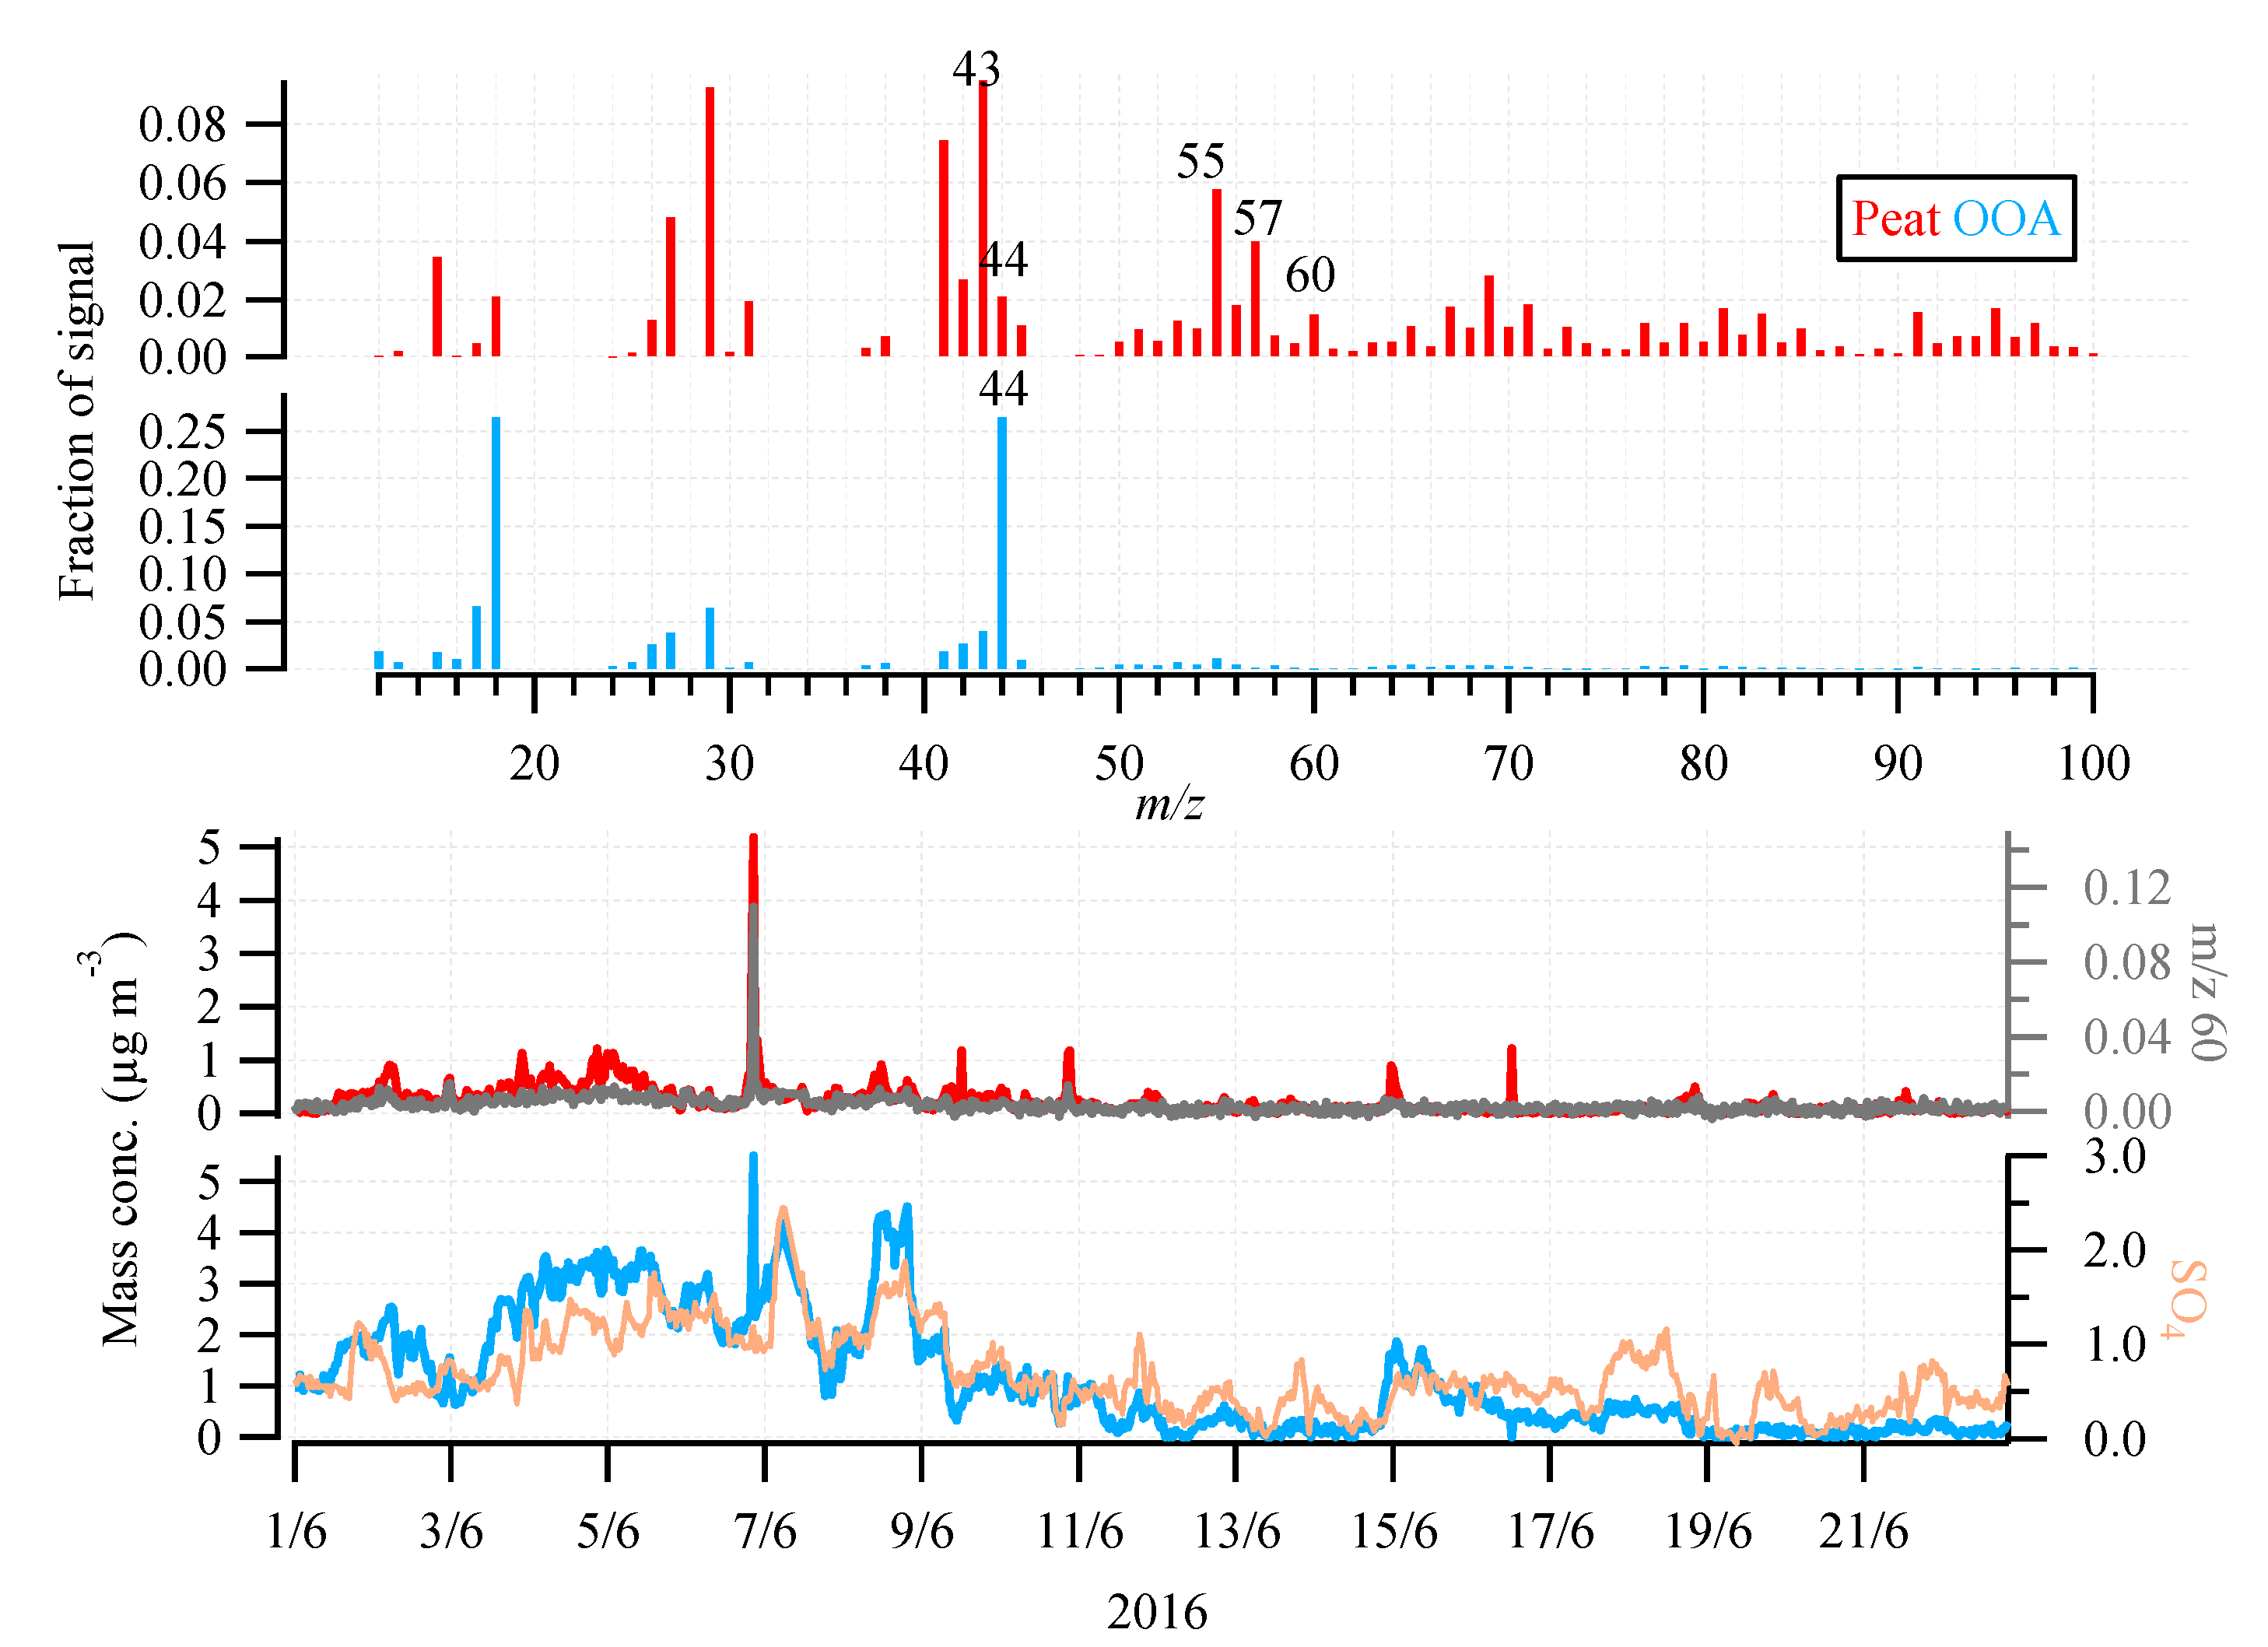
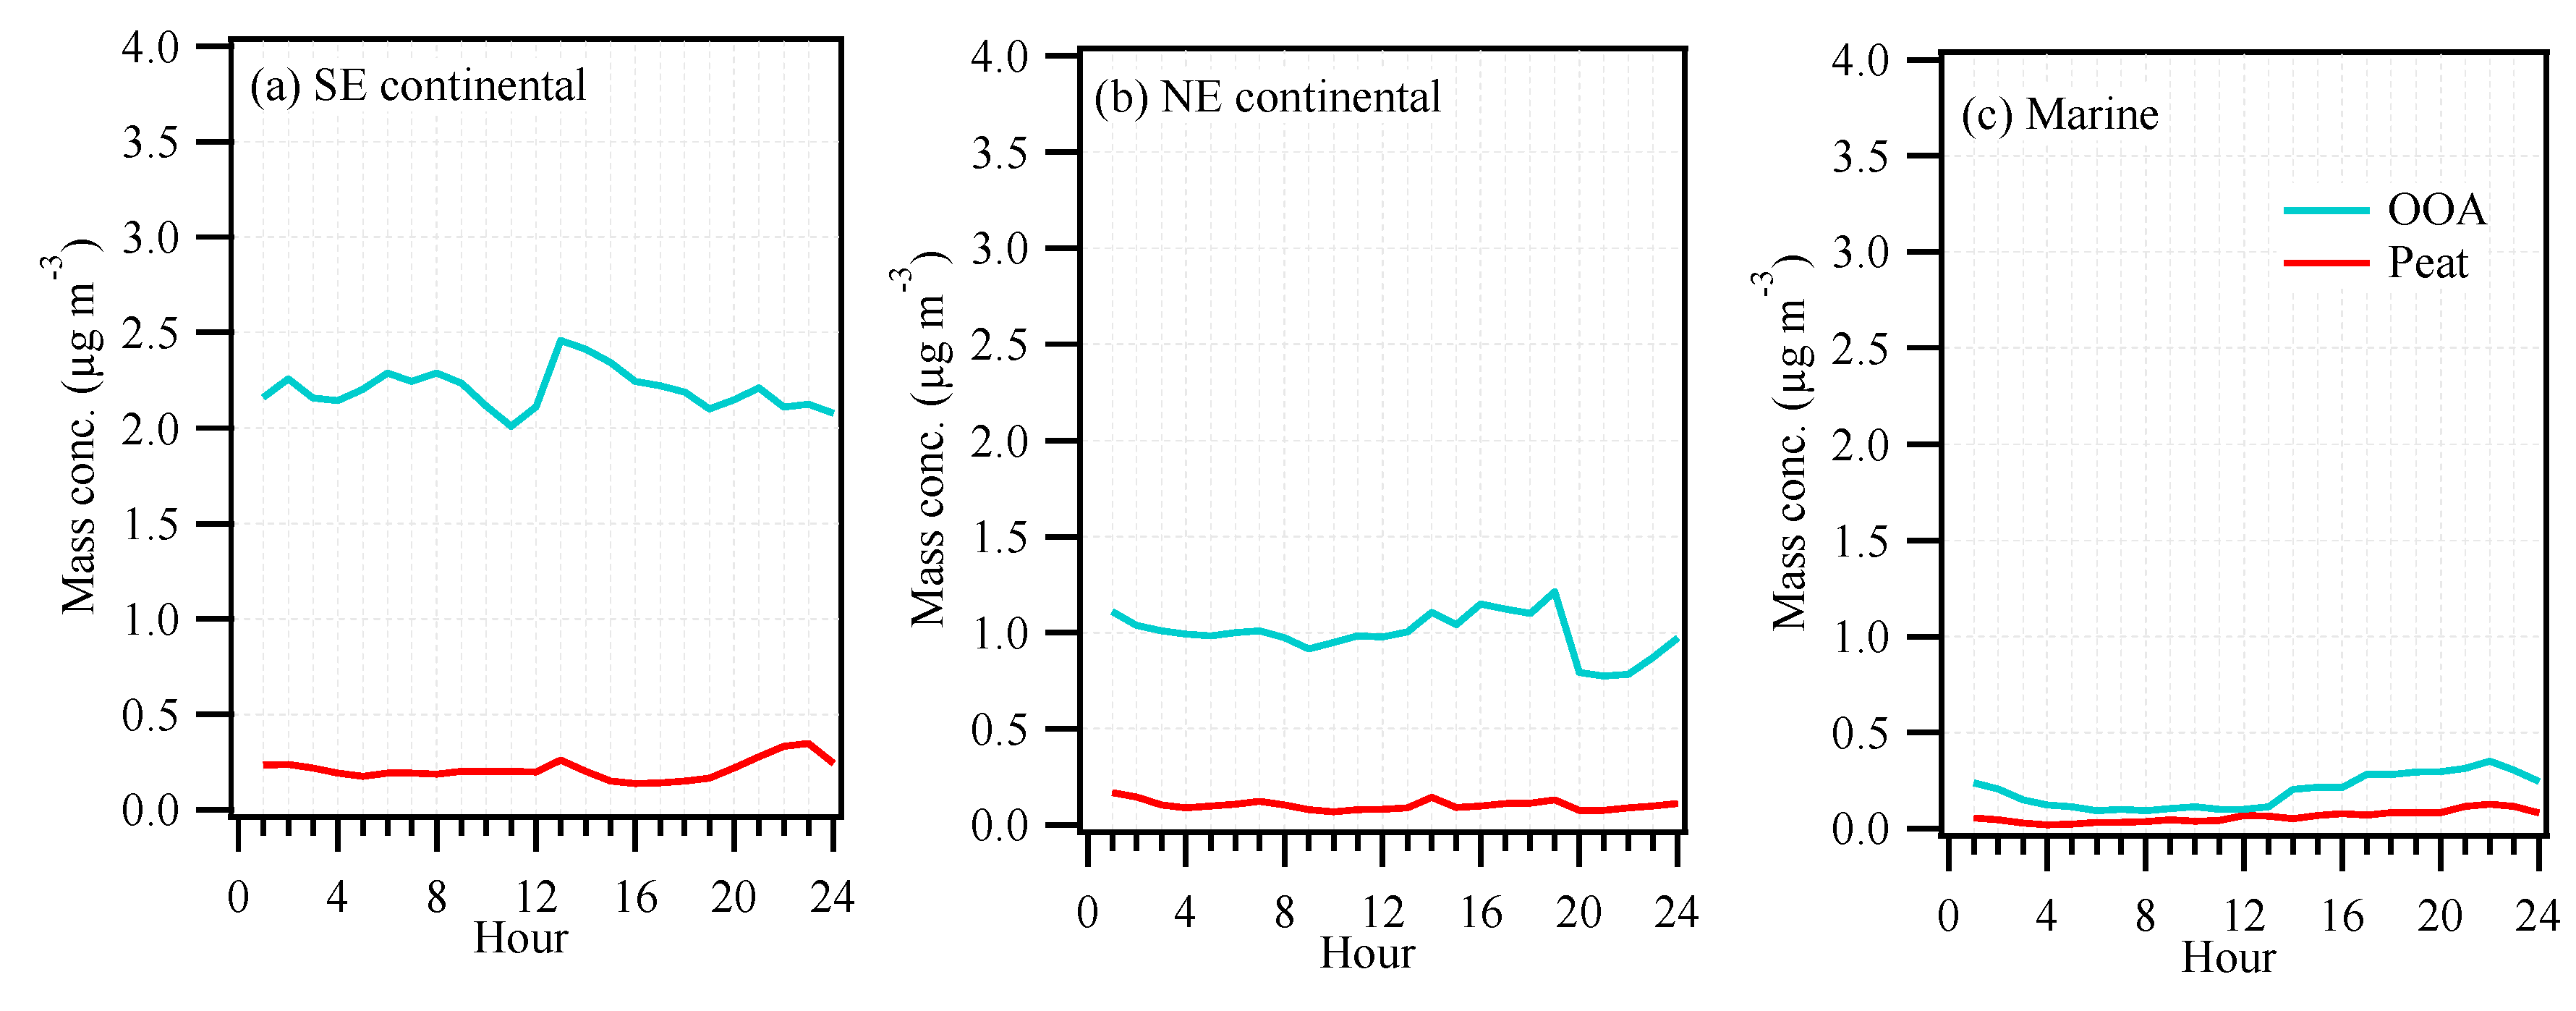
3.2. OA Source Apportionment

Unconstrained PMF (or free PMF) identified two factors: peat-like factors and OOA factors (Figures S1–S4 and Table S1). No other physically meaningful factors could be identified even by increasing the number of factors. However, the profile of peat-like factor contained no mass to charge ratio (m/z) 44 fraction (f44) and higher than expected f29 when compared to a reference peat profile [33], compromising its attribution. Therefore, multilinear engine (ME-2) was utilized by constraining the reference peat profile with the a value approach [27,33]. Sensitivity analysis by varying the a value showed that the relative contribution did not vary significantly (only by a few percent) within the considered a value (Figure S5). Having analyzed the residual, the ME-2 solution was mathematically acceptable and represented the dataset well (Figure S6).
Figure 3 shows the mass spectra and temporal variations of peat and oxygenated OA (OOA) at an a value of 0.1. Peat was classified as primary OA and was associated with peat burning activities. The peat profile shows prominent peaks at mass to charge ratios (m/z) 41, 43, 55, and 57, characteristic of aliphatic hydrocarbons. It was also characterized by higher contribution at m/z 60 compared to traffic-related hydrocarbon-like OA factor (known as HOA). m/z 60 was associated with fragments of sugars, such as levoglucosan, which is produced by cellulose pyrolysis [40]. The time series of peat correlates well with that m/z 60 (R = 0.81). Most of the time, peat factor shows low concentrations (< 0.2 μg m−3) but with few pollution spikes (> 1 μg m−3) observed during the evening. As shown in Figure 1c, the temperature during summer in Galway could drop below 10 °C during the evening, so it is likely that some peat burning could occur during these cold summer evenings. On the other hand, the profile of OOA shows a high f44, arising mainly from CO2+, which is associated with aerosol aging or secondary formation. The time series of OOA shows a good correlation with sulfate (R = 0.83), pointing to secondary and/or regional sources.
The average diurnal cycles of peat and OOA factors over the three periods in different air masses are presented in Figure 4. In the three studied periods, OOA showed a dominant contribution over peat factor, on average accounting for ~84% (or 1.0–2.2 μg m−3) of the total OA in the continental air masses (Table 1) and 72% (or 0.2 μg m−3) in the marine air masses, suggesting the strong influence of secondary formation. The strong influence of secondary formation on urban PM levels have also been reported in summer in Paris [41] and London [39], where ~50% of the total OA was found to be OOA in both cities. As will be discussed in Section 3.4, France and the UK were potential geographic origins of the secondary aerosol observed in Galway. The higher OOA fraction in Galway than in London or Paris suggests an aging process during long-range transport. In addition, peat burning accounted for a minor fraction of the total OA (16–28%, or 0.09–0.4 μg m−3) of the total OA, suggesting a relatively low influence from local sources. As shown in Figure 1a, peat had an increased concentration during the evening (at ~22:00, local time) which was mainly associated with emissions from domestic heating activities coupled with the shallower planetary boundary layer in the evening. In addition, a slight peak at noon (at ~13:00) was also observed, which might be due to emission from peat burning for barbecues.
It is important to note that traffic-related factor, HOA, was not identified, probably due to its low contribution and/or mixing with peat-like factor. To evaluate the upper limit of the contribution from traffic emission, a reference HOA profile [25] was forced to be constrained in ME-2, along with a reference peat profile (Figures S7–S8). As expected, HOA comprised a small fraction of total OA (~4%). Furthermore, the diurnal cycle of HOA was relatively flat, and no morning or evening rush hour peaks could be observed, indicating very little influence from local traffic (Figure S9). The low contribution of HOA was consistent with low concentration of NOx, with an average morning rush hour (8:00, local time) peak concentration of ~3 ppb (Figure S10). Nevertheless, OOA was still the dominant factor, accounting for 85% of OA, followed by peat (11%). What’s more, the resulting peat and OOA time series were well correlated with the 2-factor ME-2 solution, with R = 0.91–1 and slope = 0.9–0.97 (Figure S11). Thus, constraining HOA and peat in the ME-2 analysis did not affect the attribution of peat and OOA significantly, and only by 3–10%. In conclusion, the upper limit of the contribution of traffic emission to OA at the urban background site was small (only 4%).

3.3. Continental versus Marine Air Masses Impacts

Continental and marine air masses alternatively arrived at the measurement site, featuring different NR-PM1 chemical compositions and OA factors. Figure 5 presents the back trajectory (BT) clusters of air mass at an arrival height of 500 m above the ground at intervals of 6 h (00:00, 06:00, 12:00, etc.) using the HYSPLIT model [36]. Using a nonhierarchical clustering algorithm [36], the BTs were classified into three clusters of air masses based on their spatial distribution during the measurement period. The three clusters included southeasterly (SE) continental BTs, northeasterly (NE) continental BTs, and marine BTs. Continental (SE) air masses originated over mainland Europe (e.g., France), the UK, and southeast Ireland (Figure 5a), while continental (NE) air masses advected over Scotland and Northern Ireland (Figure 5b). Finally, marine air masses had nearly 3 days of no contact with land but advected over the rural area on the west coast of Ireland before arriving at the measurement site (Figure 5c). It is worth noting that the total number of the calculated BTs were nearly evenly distributed into the three clusters (Figure S12): 37% for continental (SE), 32% for continental (NE), and 31% for marine, providing unbiased results for the subsequent analysis of chemical composition and OA factor contribution in each air mass cluster (Table 1).
Speciated aerosol mass concentration, fractional contribution, and OA factors associated with different air mass clusters are presented in Table 1. The NR-PM1 concentrations were higher during continental events, especially with SE air mass origins. The average NR-PM1 concentration was 4.9 μg m−3 for continental (SE) air masses, which was 2.1 times higher than that for continental (NE) air masses (2.3 μg m−3) and 6.1 times higher than that for marine air masses (0.8 μg m−3). Also, the NR-PM1 chemical composition was affected by air mass origins. Continental air masses featured higher nitrate contribution (7–12%, or 0.2–0.6 μg m−3) whereas marine air masses contained a very low contribution of nitrate to the total NR-PM1 (4%, or 0.03 μg m−3). Low nitrate contribution during marine events was due to the absence of marine sources of particulate nitrate [21,41]. For OA factors, continental OOA concentration was 5–11 times higher for continental air masses (1.0–2.2 μg m−3) than for marine air masses (0.2 μg m−3). However, fractional contributions of OOA during continental (86% of OA) and marine (72%) events were similarly high, indicating the aerosols were highly aged in both cases. Note that although peat had a higher contribution in marine air masses (28%) than in continental air masses (~14%), its absolute concentration was lower in marine air masses (0.09 μg m−3) than in continental air masses (0.1–0.4 μg m−3).

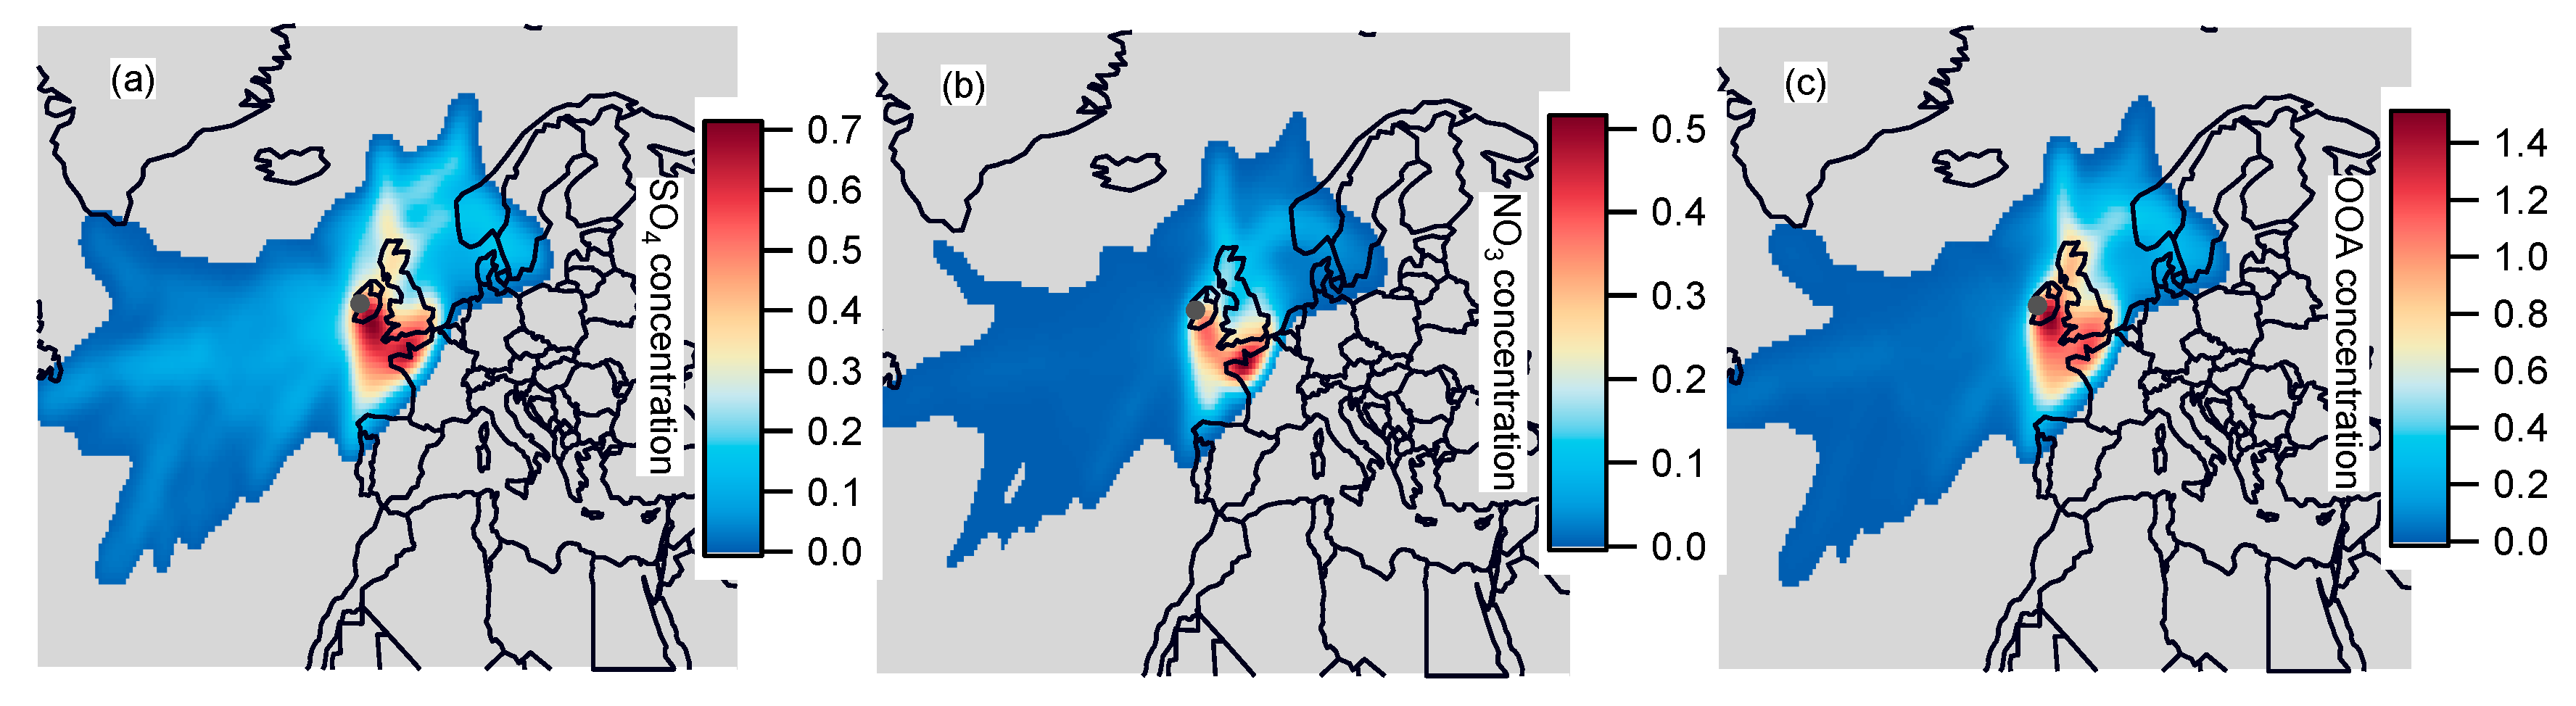
3.4. Geographic Origins of Major NR-PM1 Components

The potential geographic origins (Figure 6) of the sulfate, nitrate, and OOA were investigated by coupling the concentration data with back trajectories using the CWT approach [38]. The CWT results for sulfate, nitrate, and OOA show that long-range transport from the UK and France were responsible for the high NR-PM1 concentrations (>0.8 μg m−3 for OOA) observed in Galway. Only very low concentrations of sulfate (<0.3 μg m−3) and OOA (<0.2 μg m−3) could be associated with marine regions. CWT uses residence time information to geographically identify air parcels that may be responsible for high concentrations observed at the receptor site. Secondary aerosol (i.e., OOA, nitrate, and sulfate) concentrations were relatively high in the southeast continental air masses (Table 1). The cluster of SE continental air masses had originated over France and the UK but advected over southeast Ireland before reaching the measurement site. Therefore, the CWT result shows that southeast Ireland was also a potential geographic source of secondary aerosols, in addition to France and the UK. The formation of secondary aerosols involves the photochemical reactions of their precursors (e.g., VOC, NOx, and SO2). As shown in Figure S10, the local nitrate precursor concentration of NOx was very low even during the morning rush hour peak (~3 ppb on average). Some small cities are located in southeast Ireland and, similarly, low levels of precursor emissions are expected. Therefore, we believe most of the precursors of secondary aerosol were from other countries, and their photochemical reactions formed the secondary aerosol during transport, which was subsequently observed at the measurement site. Peat is a primary OA factor, and its diurnal cycle shows peaks in the evening, indicating a local source emission from nearby households. One of the disadvantages of CWT and other wind analysis tools are their inability to analyse local sources. This is because the wind speed cannot be directly related to a distance, leading to a risk of misinterpreting plotted results on top of a map [38]. Therefore, Peat–OA was not included in the CWT plot.
Galway city is located on the west coast of Ireland, facing the northern Atlantic Ocean. The sampling site in Galway provides a good opportunity to study arriving aerosol from both the ocean and other European countries as marine air masses and continental air masses alternatively arrive at the sampling site. Our measurement is representative of the cases in western European countries, especially in similarly sized cities in the UK and western France, with similar air mass back trajectories in summer.

4. Conclusions

An aerosol chemical speciation monitor (ACSM) was used to measure non-refractory submicron particles at the urban background site of Galway city, on the west coast of Ireland, during summer 2016. PMF was conducted on OA mass spectra to investigate the OA sources. The results show that the summertime average NR-PM1 concentration of 2.7 ± 2.3 μg m−3 in Galway is lower than that observed in other European cities (e.g., London and Paris), and lower than that observed in winter at the same location. On average, 54% of the NR-PM1 was comprised of organic aerosol, 84% of which was attributed to secondary production (OOA factor), which shows a good time series correlation with sulfate (R = 0.83), and only 16% of which was coming from primary peat burning. Together with secondary inorganic species (sulfate (25%), nitrate (10%), and ammonium (11%)), 91% of NR-PM1 was of secondary origin and only 9% was coming from primary sources. Concentration-weighted trajectory analysis points to long-range transport from the UK and France being the major source of the secondary organic and inorganic species. Paris and London are much larger than Galway; however, the comparison of the factor contribution shows that higher a OOA fraction (84% of total OA) was found in Galway than in London or Paris (50%), suggesting aerosol aging during long-range transport.

Supplementary Materials

The following are available online at https://www.mdpi.com/2073-4433/10/2/59/s1, Figure S1: Q/Qexp as a function of number of factors, Figure S2: The mass spectra of the free PMF solutions, Figure S3: The time series of OOA-like and peat-like factor from the free PMF solution. Figure S4: The diurnal cycle and the relative contribution of the peat and OOA to the total OA, Figure S5: Relative contribution of the resolved peat and OOA as a function of a values from 0 to 0.9 with ME-2, Figure S6: Residual of the ME-2 solution, Figure S7: Relative contribution of HOA, peat, and OOA as a function of a value from 0 to 0.2, Figure S8: Profile (at a value of 0.1) and time series of hydrocarbon-like OA (HOA), Peat, and OOA (oxygenated organic aerosol), Figure S9: The diurnal cycle and the relative contribution of the HOA, peat, and OOA to the total OA at a value of 0.1, Figure S10: Diurnal cycle of NOx, Figure S11: Linear correlation between the time series of ME-2 solution and free PMF solution, Table S1: The correlation coefficient between the 2-factor solution factor profiles in free PMF and the reference factor profile from literature.

Author Contributions

J.O., D.C., and C.O. conceived and designed the experiments; C.L., J.O., and D.C. performed the experiments; C.L., R.-J.H., J.O., F.C., and A.S.H.P. helped analyze the data; C.L. and J.O. wrote the paper.

Acknowledgments

This work was supported by the EPA-Ireland (AEROSOURCE, 2016-CCRP-MS-31), the National Natural Science Foundation of China (NSFC) under grant No. 91644219, and Chinese Scholarship Council (CSC, No. 201506310020). The authors would also like to acknowledge the contribution of the COST Action CA16109 (COLOSSAL) and MaREI (Center for Marine and Renewable Energy).

Conflicts of Interest

The authors declare no conflict of interest.

References

  1. Albrecht, B.A. Aerosols, cloud microphysics, and fractional cloudiness. Science 1989, 245, 1227–1231. [Google Scholar] [CrossRef] [PubMed]
  2. Tegen, I.; Lacis, A.A.; Fung, I. The influence on climate forcing of mineral aerosols from disturbed soils. Nature 1996, 380, 419–422. [Google Scholar] [CrossRef]
  3. Huang, R.-J.; Zhang, Y.; Bozzetti, C.; Ho, K.-F.; Cao, J.-J.; Han, Y.; Daellenbach, K.R.; Slowik, J.G.; Platt, S.M.; Canonaco, F.; et al. High secondary aerosol contribution to particulate pollution during haze events in China. Nature 2014, 514, 218. [Google Scholar] [CrossRef] [PubMed]
  4. Deng, X.; Tie, X.; Wu, D.; Zhou, X.; Bi, X.; Tan, H.; Li, F.; Jiang, C. Long-term trend of visibility and its characterizations in the Pearl River Delta (PRD) region, China. Atmos. Environ. 2008, 42, 1424–1435. [Google Scholar] [CrossRef]
  5. Pope, C.A., III; Burnett, R.T.; Thun, M.J.; Calle, E.E.; Krewski, D.; Ito, K.; Thurston, G.D. Lung cancer, cardiopulmonary mortality, and long-term exposure to fine particulate air pollution. JAMA 2002, 287, 1132–1141. [Google Scholar] [CrossRef] [PubMed]
  6. Clancy, L.; Goodman, P.; Sinclair, H.; Dockery, D.W. Effect of air-pollution control on death rates in Dublin, Ireland: An intervention study. Lancet 2002, 360, 1210–1214. [Google Scholar] [CrossRef]
  7. Pope, C.A.; Ezzati, M.; Dockery, D.W. Fine-Particulate Air Pollution and Life Expectancy in the United States. N. Engl. J. Med. 2009, 360, 376–386. [Google Scholar] [CrossRef] [PubMed] [Green Version]
  8. Lelieveld, J.; Evans, J.S.; Fnais, M.; Giannadaki, D.; Pozzer, A. The contribution of outdoor air pollution sources to premature mortality on a global scale. Nature 2015, 525, 367–371. [Google Scholar] [CrossRef] [PubMed]
  9. DeCarlo, P.F.; Kimmel, J.R.; Trimborn, A.; Northway, M.J.; Jayne, J.T.; Aiken, A.C.; Gonin, M.; Fuhrer, K.; Horvath, T.; Docherty, K.S.; et al. Field-Deployable, High-Resolution, Time-of-Flight Aerosol Mass Spectrometer. Anal. Chem. 2006, 78, 8281–8289. [Google Scholar] [CrossRef] [PubMed]
  10. Drewnick, F.; Hings, S.S.; DeCarlo, P.; Jayne, J.T.; Gonin, M.; Fuhrer, K.; Weimer, S.; Jimenez, J.L.; Demerjian, K.L.; Borrmann, S.; et al. A new time-of-flight aerosol mass spectrometer (TOF-AMS)—Instrument description and first field deployment. Aerosol Sci. Technol. 2005, 39, 637–658. [Google Scholar] [CrossRef]
  11. Canagaratna, M.R.; Jayne, J.T.; Jimenez, J.L.; Allan, J.D.; Alfarra, M.R.; Zhang, Q.; Onasch, T.B.; Drewnick, F.; Coe, H.; Middlebrook, A.; et al. Chemical and microphysical characterization of ambient aerosols with the Aerodyne aerosol mass spectrometer. Mass Spectrom. Rev. 2007, 26, 185–222. [Google Scholar] [CrossRef] [PubMed]
  12. Ng, N.L.; Herndon, S.C.; Trimborn, A.; Canagaratna, M.R.; Croteau, P.L.; Onasch, T.B.; Sueper, D.; Worsnop, D.R.; Zhang, Q.; Sun, Y.L.; et al. An Aerosol Chemical Speciation Monitor (ACSM) for routine monitoring of the composition and mass concentrations of ambient aerosol. Aerosol Sci. Technol. 2011, 45, 780–794. [Google Scholar] [CrossRef]
  13. Fröhlich, R.; Cubison, M.J.; Slowik, J.G.; Bukowiecki, N.; Prévôt, A.S.H.; Baltensperger, U.; Schneider, J.; Kimmel, J.R.; Gonin, M.; Rohner, U.; et al. The ToF-ACSM: A portable aerosol chemical speciation monitor with TOFMS detection. Atmos. Meas. Tech. 2013, 6, 3225–3241. [Google Scholar] [CrossRef]
  14. Sun, Y.; Wang, Z.; Dong, H.; Yang, T.; Li, J.; Pan, X.; Chen, P.; Jayne, J.T. Characterization of summer organic and inorganic aerosols in Beijing, China with an Aerosol Chemical Speciation Monitor. Atmos. Environ. 2012, 51, 250–259. [Google Scholar] [CrossRef]
  15. Petit, J.E.; Favez, O.; Sciare, J.; Crenn, V.; Sarda-Estève, R.; Bonnaire, N.; Močnik, G.; Dupont, J.C.; Haeffelin, M.; Leoz-Garziandia, E. Two years of near real-time chemical composition of submicron aerosols in the region of Paris using an Aerosol Chemical Speciation Monitor (ACSM) and a multi-wavelength Aethalometer. Atmos. Chem. Phys. 2015, 15, 2985–3005. [Google Scholar] [CrossRef] [Green Version]
  16. Zhang, Y.J.; Tang, L.L.; Wang, Z.; Yu, H.X.; Sun, Y.L.; Liu, D.; Qin, W.; Canonaco, F.; Prévôt, A.S.H.; Zhang, H.L.; et al. Insights into characteristics, sources, and evolution of submicron aerosols during harvest seasons in the Yangtze River Delta region, China. Atmos. Chem. Phys. 2015, 15, 1331–1349. [Google Scholar] [CrossRef]
  17. Elser, M.; Huang, R.J.; Wolf, R.; Slowik, J.G.; Wang, Q.; Canonaco, F.; Li, G.; Bozzetti, C.; Daellenbach, K.R.; Huang, Y.; et al. New insights into PM2.5 chemical composition and sources in two major cities in China during extreme haze events using aerosol mass spectrometry. Atmos. Chem. Phys. 2016, 16, 3207–3225. [Google Scholar] [CrossRef]
  18. Li, Y.J.; Sun, Y.; Zhang, Q.; Li, X.; Li, M.; Zhou, Z.; Chan, C.K. Real-time chemical characterization of atmospheric particulate matter in China: A review. Atmos. Environ. 2017, 158, 270–304. [Google Scholar] [CrossRef]
  19. Minguillón, M.C.; Ripoll, A.; Pérez, N.; Prévôt, A.S.H.; Canonaco, F.; Querol, X.; Alastuey, A. Chemical characterization of submicron regional background aerosols in the western Mediterranean using an Aerosol Chemical Speciation Monitor. Atmos. Chem. Phys. 2015, 15, 6379–6391. [Google Scholar] [CrossRef]
  20. Ovadnevaite, J.; O’Dowd, C.; Dall’Osto, M.; Ceburnis, D.; Worsnop, D.R.; Berresheim, H. Detecting high contributions of primary organic matter to marine aerosol: A case study. Geophys. Res. Lett. 2011, 38. [Google Scholar] [CrossRef] [Green Version]
  21. Ovadnevaite, J.; Ceburnis, D.; Leinert, S.; Dall’Osto, M.; Canagaratna, M.; O’Doherty, S.; Berresheim, H.; O’Dowd, C. Submicron NE Atlantic marine aerosol chemical composition and abundance: Seasonal trends and air mass categorization. J. Geophys. Res. Atmos. 2014, 119, 11850–11863. [Google Scholar] [CrossRef]
  22. Crenn, V.; Sciare, J.; Croteau, P.L.; Verlhac, S.; Fröhlich, R.; Belis, C.A.; Aas, W.; Äijälä, M.; Alastuey, A.; Artiñano, B.; et al. ACTRIS ACSM intercomparison—Part 1: Reproducibility of concentration and fragment results from 13 individual Quadrupole Aerosol Chemical Speciation Monitors (Q-ACSM) and consistency with co-located instruments. Atmos. Meas. Tech. 2015, 8, 5063–5087. [Google Scholar] [CrossRef]
  23. Fröhlich, R.; Crenn, V.; Setyan, A.; Belis, C.A.; Canonaco, F.; Favez, O.; Riffault, V.; Slowik, J.G.; Aas, W.; Aijälä, M.; et al. ACTRIS ACSM intercomparison—Part 2: Intercomparison of ME-2 organic source apportionment results from 15 individual, co-located aerosol mass spectrometers. Atmos. Meas. Tech. 2015, 8, 2555–2576. [Google Scholar] [CrossRef]
  24. Crippa, M.; Canonaco, F.; Lanz, V.A.; Äijälä, M.; Allan, J.D.; Carbone, S.; Capes, G.; Ceburnis, D.; Dall’Osto, M.; Day, D.A.; et al. Organic aerosol components derived from 25 AMS data sets across Europe using a consistent ME-2 based source apportionment approach. Atmos. Chem. Phys. 2014, 14, 6159–6176. [Google Scholar] [CrossRef] [Green Version]
  25. Crippa, M.; Decarlo, P.F.; Slowik, J.G.; Mohr, C.; Heringa, M.F.; Chirico, R.; Poulain, L.; Freutel, F.; Sciare, J.; Cozic, J.; et al. Wintertime aerosol chemical composition and source apportionment of the organic fraction in the metropolitan area of Paris. Atmos. Chem. Phys. 2013, 13, 961–981. [Google Scholar] [CrossRef] [Green Version]
  26. Paatero, P. Least squares formulation of robust non-negative factor analysis. Chemom. Intell. Lab. Syst. 1997, 37, 23–35. [Google Scholar] [CrossRef]
  27. Canonaco, F.; Crippa, M.; Slowik, J.G.; Baltensperger, U.; Prévôt, A.S.H. SoFi, an IGOR-based interface for the efficient use of the generalized multilinear engine (ME-2) for the source apportionment: ME-2 application to aerosol mass spectrometer data. Atmos. Meas. Tech. 2013, 6, 3649–3661. [Google Scholar] [CrossRef] [Green Version]
  28. Canonaco, F.; Slowik, J.G.; Baltensperger, U.; Prévôt, A.S.H. Seasonal differences in oxygenated organic aerosol composition: Implications for emissions sources and factor analysis. Atmos. Chem. Phys. 2015, 15, 6993–7002. [Google Scholar] [CrossRef]
  29. Lin, C.; Huang, R.-J.; Ceburnis, D.; Buckley, P.; Preissler, J.; Wenger, J.; Rinaldi, M.; Facchini, M.C.; O’Dowd, C.; Ovadnevaite, J. Extreme air pollution from residential solid fuel burning. Nat. Sustain. 2018, 1, 512–517. [Google Scholar] [CrossRef]
  30. Jimenez, J.L.; Canagaratna, M.R.; Donahue, N.M.; Prevot, A.S.H.; Zhang, Q.; Kroll, J.H.; DeCarlo, P.F.; Allan, J.D.; Coe, H.; Ng, N.L.; et al. Evolution of Organic Aerosols in the Atmosphere. Science 2009, 326, 1525–1529. [Google Scholar] [CrossRef]
  31. Canagaratna, M.R.; Jayne, J.T.; Ghertner, D.A.; Herndon, S.; Shi, Q.; Jimenez, J.L.; Silva, P.J.; Williams, P.; Lanni, T.; Drewnick, F.; et al. Chase Studies of Particulate Emissions from in-use New York City Vehicles. Aerosol Sci. Technol. 2004, 38, 555–573. [Google Scholar] [CrossRef] [Green Version]
  32. Zhang, Q.; Jimenez, J.L.; Canagaratna, M.R.; Ulbrich, I.M.; Ng, N.L.; Worsnop, D.R.; Sun, Y. Understanding atmospheric organic aerosols via factor analysis of aerosol mass spectrometry: A review. Anal. Bioanal. Chem. 2011, 401, 3045–3067. [Google Scholar] [CrossRef] [PubMed]
  33. Lin, C.; Ceburnis, D.; Hellebust, S.; Buckley, P.; Wenger, J.; Canonaco, F.; Prévôt, A.S.H.; Huang, R.-J.; O’Dowd, C.; Ovadnevaite, J. Characterization of primary organic aerosol from domestic wood, peat, and coal burning in Ireland. Environ. Sci. Technol. 2017, 51, 10624–10632. [Google Scholar] [CrossRef] [PubMed]
  34. Ulbrich, I.M.; Canagaratna, M.R.; Zhang, Q.; Worsnop, D.R.; Jimenez, J.L. Interpretation of organic components from Positive Matrix Factorization of aerosol mass spectrometric data. Atmos. Chem. Phys. 2009, 9, 2891–2918. [Google Scholar] [CrossRef] [Green Version]
  35. Paatero, P. The multilinear engine-a table-driven, least squares program for solving multilinear problems, including the n-way parallel factor analysis model. J. Comput. Graph. Stat. 1999, 8, 854–888. [Google Scholar]
  36. Stein, A.F.; Draxler, R.R.; Rolph, G.D.; Stunder, B.J.B.; Cohen, M.D.; Ngan, F. NOAA’s HYSPLIT Atmospheric Transport and Dispersion Modeling System. Bull. Am. Meteorol. Soc. 2015, 96, 2059–2077. [Google Scholar] [CrossRef]
  37. Fleming, Z.L.; Monks, P.S.; Manning, A.J. Review: Untangling the influence of air-mass history in interpreting observed atmospheric composition. Atmos. Res. 2012, 104–105, 1–39. [Google Scholar] [CrossRef]
  38. Petit, J.E.; Favez, O.; Albinet, A.; Canonaco, F. A user-friendly tool for comprehensive evaluation of the geographical origins of atmospheric pollution: Wind and trajectory analyses. Environ. Model. Softw. 2017, 88, 183–187. [Google Scholar] [CrossRef] [Green Version]
  39. Young, D.E.; Allan, J.D.; Williams, P.I.; Green, D.C.; Flynn, M.J.; Harrison, R.M.; Yin, J.; Gallagher, M.W.; Coe, H. Investigating the annual behaviour of submicron secondary inorganic and organic aerosols in London. Atmos. Chem. Phys. 2015, 15, 6351–6366. [Google Scholar] [CrossRef]
  40. Alfarra, M.R.; Prevot, A.S.H.; Szidat, S.; Sandradewi, J.; Weimer, S.; Lanz, V.A.; Schreiber, D.; Mohr, M.; Baltensperger, U. Identification of the mass spectral signature of organic aerosols from wood burning emissions. Environ. Sci. Technol. 2007, 41, 5770–5777. [Google Scholar] [CrossRef]
  41. Crippa, M.; El Haddad, I.; Slowik, J.G.; Decarlo, P.F.; Mohr, C.; Heringa, M.F.; Chirico, R.; Marchand, N.; Sciare, J.; Baltensperger, U.; et al. Identification of marine and continental aerosol sources in Paris using high resolution aerosol mass spectrometry. J. Geophys. Res. Atmos. 2013, 118, 1950–1963. [Google Scholar] [CrossRef] [Green Version]
Figure 1. Time series of (a) wind speed (ws) and wind direction (wd); (b) relative humidity (RH) and pressure; (c) temperature; and (d) organics (OA), sulfate (SO4), ammonium (NH4), and nitrate (NO3) during 1–22 June 2016. Inset pie chart shows the relative contribution over the whole period. The value above the pie chart is the mean NR-PM1 concentration ± 1 standard deviation. Meteorology data were obtained from the Irish National Meteorological Service (Met Éireann) with 1 h resolution. OA, sulfate, ammonium, and nitrate were measured by an aerosol chemical speciation monitor (ACSM) with 30 min resolution. The bars above the figure highlight the different periods under the influence of different air masses for further discussion. The three periods include northeast (NE) continental (light gray), southeast (SE) continental (dark gray), and marine (light blue) air masses. See Section 3.3 for the classification of air masses.
Atmosphere 10 00059 g001
Figure 2. The diurnal variation of NR-PM1 species (OA, sulfate, nitrate, and ammonium) over the period influenced by (a) SE continental; (b) NE continental; and (c) marine air masses.
Atmosphere 10 00059 g002
Figure 3. Profile (at a value of 0.1) and time series of peat and OOA (oxygenated organic aerosol). Also shown are the time series of m/z 60 and sulfate.
Atmosphere 10 00059 g003
Figure 4. The average diurnal cycle of OOA and peat over the period influenced by (a) SE continental; (b) NE continental; and (c) marine air masses.
Atmosphere 10 00059 g004
Figure 5. Classification of air mass back trajectories (BTs): (a) Southeasterly (SE) continental BTs; (b) northeasterly (NE) continental BTs; (c) marine BTs. The BTs (black lines) were calculated every 6 h, and the length is 72 h.
Atmosphere 10 00059 g005
Figure 6. CWT results of hourly averaged (a) sulfate (SO4), (b) nitrate (NO3), and (c) OOA; color-coded based on the concentration of each species in μg m−3. The CWT were plotted using ZeFir [38].
Atmosphere 10 00059 g006
Table 1. NR-PM1 chemical compositions in different air masses (μg m−3).
Continental (SE)Continental (NE)Marine
NMeanMedianSD%NMeanMedianSD%NMeanMedianSD%
OA1842.72.61.3551591.31.10.8551560.30.30.241
SO4 1.11.10.422 0.60.60.227 0.30.30.242
NO3 0.60.40.612 0.20.10.27 0.030.030.034
NH4 0.60.50.311 0.20.20.111 0.10.10.113
Total 4.9 2.3 0.8
OA factors
Peat 0.40.30.414 0.10.080.214 0.090.060.0828
OOA 2.22.31.186 1.00.90.686 0.200.20.272
N stands for number of data points. One data point corresponds to one-hourly-averaged data. % is calculated from the means. SD stands for one standard deviation.

