Article

Influence of Boreal Winter Intraseasonal Variation of Aleutian Low on Water Vapor Transport and Atmospheric Rivers

CMA-NJU Joint Laboratory for Climate Prediction Studies, Institute for Climate and Global Change Research, School of Atmospheric Sciences, Nanjing University, Nanjing 210023, China
*
Author to whom correspondence should be addressed.
Atmosphere 2019, 10(2), 49; https://doi.org/10.3390/atmos10020049
Submission received: 17 January 2019 / Revised: 24 January 2019 / Accepted: 25 January 2019 / Published: 28 January 2019
(This article belongs to the Special Issue Atmospheric Rivers)

Abstract

:
The Aleutian Low (AL) operates multiple time scales. The intraseasonal variation of AL is responsible for the subseasonal variability over the pan-North Pacific region. Atmospheric water vapor transport and atmospheric rivers (ARs) changes associated with the intraseasonal variation of AL are investigated over the North Pacific region for the winters of 1979–2014 in this study. The AL’s intraseasonal variation with a peak period of 40 days is identified. A total of 43 events that demonstrate the AL’s feature of strengthening and then weakening is picked and used for composition analysis. During the AL’s strengthening stage, eastward water vapor transport is dominant to the west of 150° W over the mid-basin. Meanwhile, poleward transport is dominant between 150–125° W. During the AL’s weakening stage, the eastward transport is weakened, and the poleward transport is concentrated over the center basin. Accompanied by the AL’s intraseasonal intensity oscillation, the frequency of ARs firstly increases, and then decreases over the ARs’ climatological mean body region over the North Pacific. The moisture source over the western North Pacific is hoarded during non-AR days, while the moisture sinks over the northeastern North Pacific during the AL’s strengthening stage, and the moisture sources over the center basin during the AL’s weakening stage converge during AR days. Hydroclimate effects on anomalies in precipitation over the west coast of North America are also analyzed.

1. Introduction

The Aleutian low (AL) is a large-scale cyclonic circulation in the lower troposphere, with its main body located over the midlatitude North Pacific during winter. The natural variability of AL operates multiple time scales. The changes of AL can directly influence the atmospheric condition over the pan-North Pacific region [1,2,3]. For example, the intraseasonal variation of AL can cause pressure, wind, and moisture fluctuations over the North Pacific region within a subseasonal time scale [4,5]. Thus, the intraseasonal variation of AL is responsible for subseasonal variability over the pan-North Pacific region.
The AL influences the weather and hydroclimate through dynamical and hydrologic cycle processes [1,5]. Regarding the hydrologic cycle aspect, atmospheric water vapor transport has drawn attention in the literature [5,6,7,8] because it embraces both atmospheric circulation process and moisture conditions in the mid and lower levels. The atmospheric circulation drives the water vapor to transport across a long distance, and creates a convergence or divergence of moisture [6]. The convergence of water vapor transport suggests an enhancement of local atmospheric moisture, and is helpful to precipitation. However, our understanding of the atmospheric water vapor transport that is accompanied by the intraseasonal variation of AL is incomplete. We investigate this issue in the present study.
Over the North Pacific, the water vapor transport feature shows diversity. The time-mean circulation moves moisture zonally within ocean basins. The direction of water vapor transport on a subseasonal time scale is both from ocean to land and toward the poles [7]. The storm track-related water vapor transport dominates poleward transport [7,8]. Especially, Newell et al. (1992) [9] ascertained from the twice-daily data that the water vapor transport was centralized into filaments in the midlatitudes, which Zhu and Newell (1994; 1998) later named atmospheric rivers (ARs) [10,11]. The moisture transport flux in a typical AR is about 1.6 × 10 8 kg⋅m−1⋅s−1, which is similar to the flux in the Amazon [9]. Due to its large magnitude of moisture fluxes, ARs have a crucial role in forming precipitation over East Asia, the North Pacific, and North America [12,13,14,15,16]. In particular, extreme precipitation along the United States (U.S.) West Coast is largely fueled by ARs [17,18,19].
Usually, ARs develop over synoptic time scales. They are characterized by a narrow and strong moisture belt that is associated with storms over the midlatitude oceanic region. The location and frequency of AR events vary with background large-scale atmospheric circulation [20,21]. Previous studies have shown that the decadal variations of ARs over the North Pacific region are connected with two decadal modes of sea surface temperature: the Pacific Decadal Oscillation (PDO) and the North Pacific Gyre Oscillation (NPGO) [8]. The year-to-year changes in AR frequency, intensity, and landing location are closely related with ENSO diversity [22] and atmospheric internal variability [19]. However, the causes of intraseasonal variations of ARs are not clear. We speculate that the intraseasonal variation of AL can modulate the behavior of ARs, leading to the intraseasonal variations of ARs. The present study also addresses this problem.
The rest of the paper is organized as follows. Section 2 describes the data and methods. Section 3 is the results section; it presents the intraseasonal variation of AL, ARs, and moisture transport changes associated with the intraseasonal variation of AL, as well as precipitation anomalies. Section 4 contains the discussion and conclusions.

2. Data and Methods

2.1. Data

Atmospheric elements, including specific humidity, horizontal wind fields, and mean sea level pressure (MSLP) are from the European Centre for Medium-Range Weather Forecasts (ECMWF) interim reanalysis (ERA-Interim; [23]) daily analysis from 1 January 1979 to 1 December 2015 with resolution of 0.75° × 0.75°. The Climate Prediction Center (CPC) developed gridded observations of daily precipitation covering global land areas, and the time period 1979 to the present is used in this study with 0.5° × 0.5° (hereafter the CPC precipitation). This gridded precipitation product came from rain gauge observations over global land areas [24]. This study was conducted for the winter season of December 1979 through February 2015. The winter of 1979 includes December 1979, January 1980, and February 1980, and so on. There are total 90 days in every winter.

2.2. Calculation of Integrated Water Vapor Transport and AR Frequency

The integrated water vapor transport (IVT) is computed according to the formula:
IVT = 1 g P t P s q · V d p
In this equation, g is the acceleration due to gravity, and P s is the surface air pressure (1000 hPa). q is the specific humidity, V is the horizontal wind, and P t is the upper limit of the integral (300 hPa). A convergent field of moisture transport (∇·IVT < 0) means an area of moisture sink, while a divergent one (∇·IVT > 0) builds up the moisture source.
Zhu and Newell (1998) [11] proposed an algorithm for judging AR days and non-AR days:
Q r Q z o n a l m e a n + 0.3 × ( Q max Q z o n a l m e a n )
where Q r is the magnitude of IVT at a grid point. Q z o n a l m e a n is the zonal mean value of Q r along a given latitude. Q max indicates the magnitude of the maximum flux along a given latitude. A grid point is classified as an AR grid when the magnitude of IVT at this grid ( Q r ) obeys the above criteria. Meanwhile, the corresponding date for this AR grid is recorded as an AR day. Otherwise, it is a non-AR day. The AR frequency at a grid point for every winter is calculated according to the ratio of the number of AR days at this grid point to the number of days in a whole winter (90-day).
The method for judging ARs shows the diversity in the literature [20,21,25]. Shields et al. (2018) [25] summarized different algorithms for the detection of ARs (including landfalling ARs) in their Table 1. We use Formula (2) in the present study because it can represent the filamentary structure of AR with strong moisture transport over the midlatitude North Pacific, which meets our study demands. Meanwhile, it is also easy to calculate.

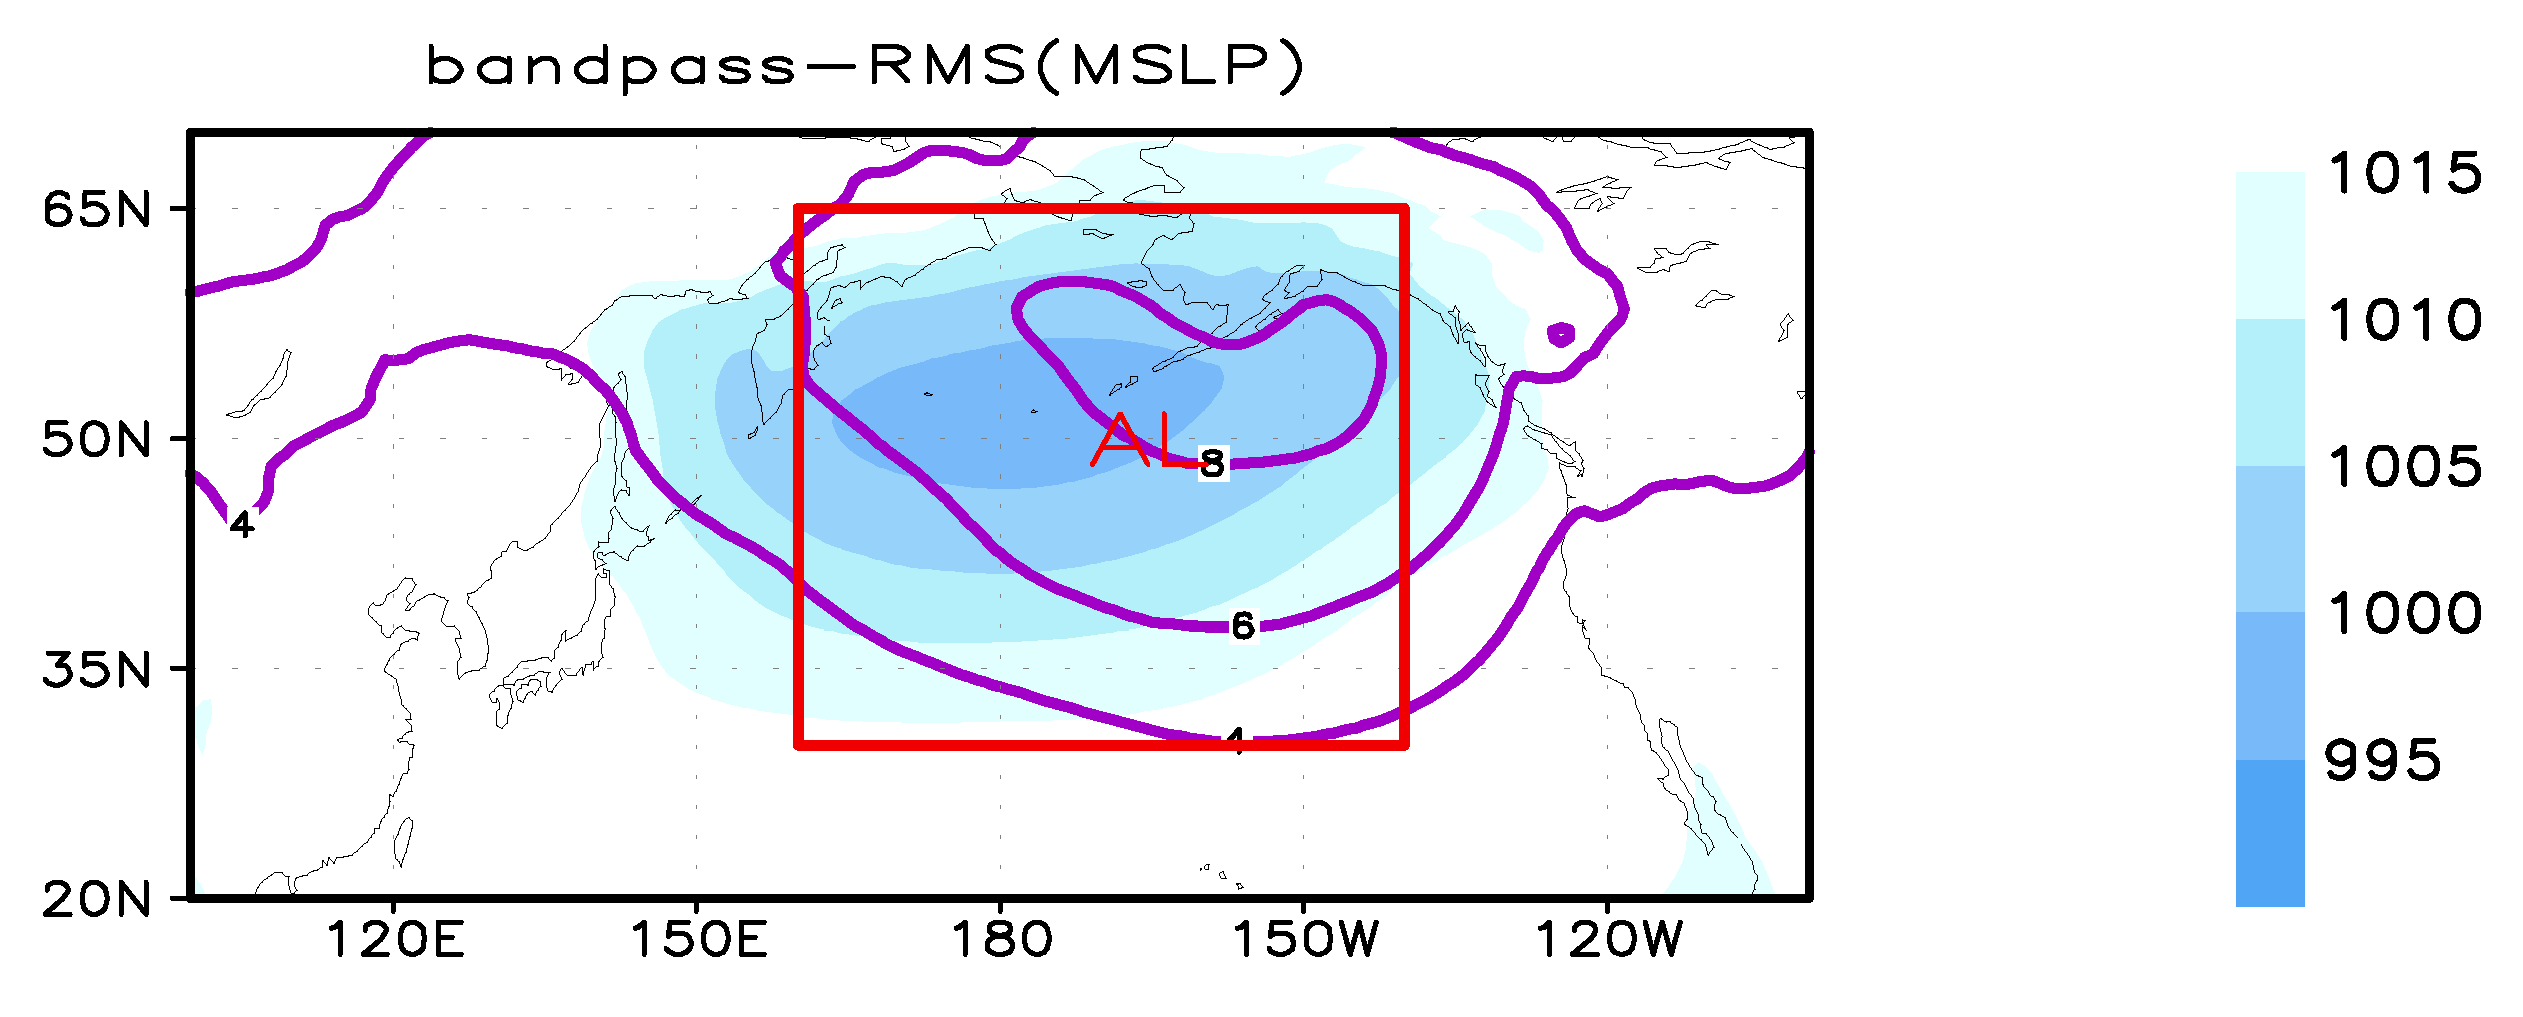
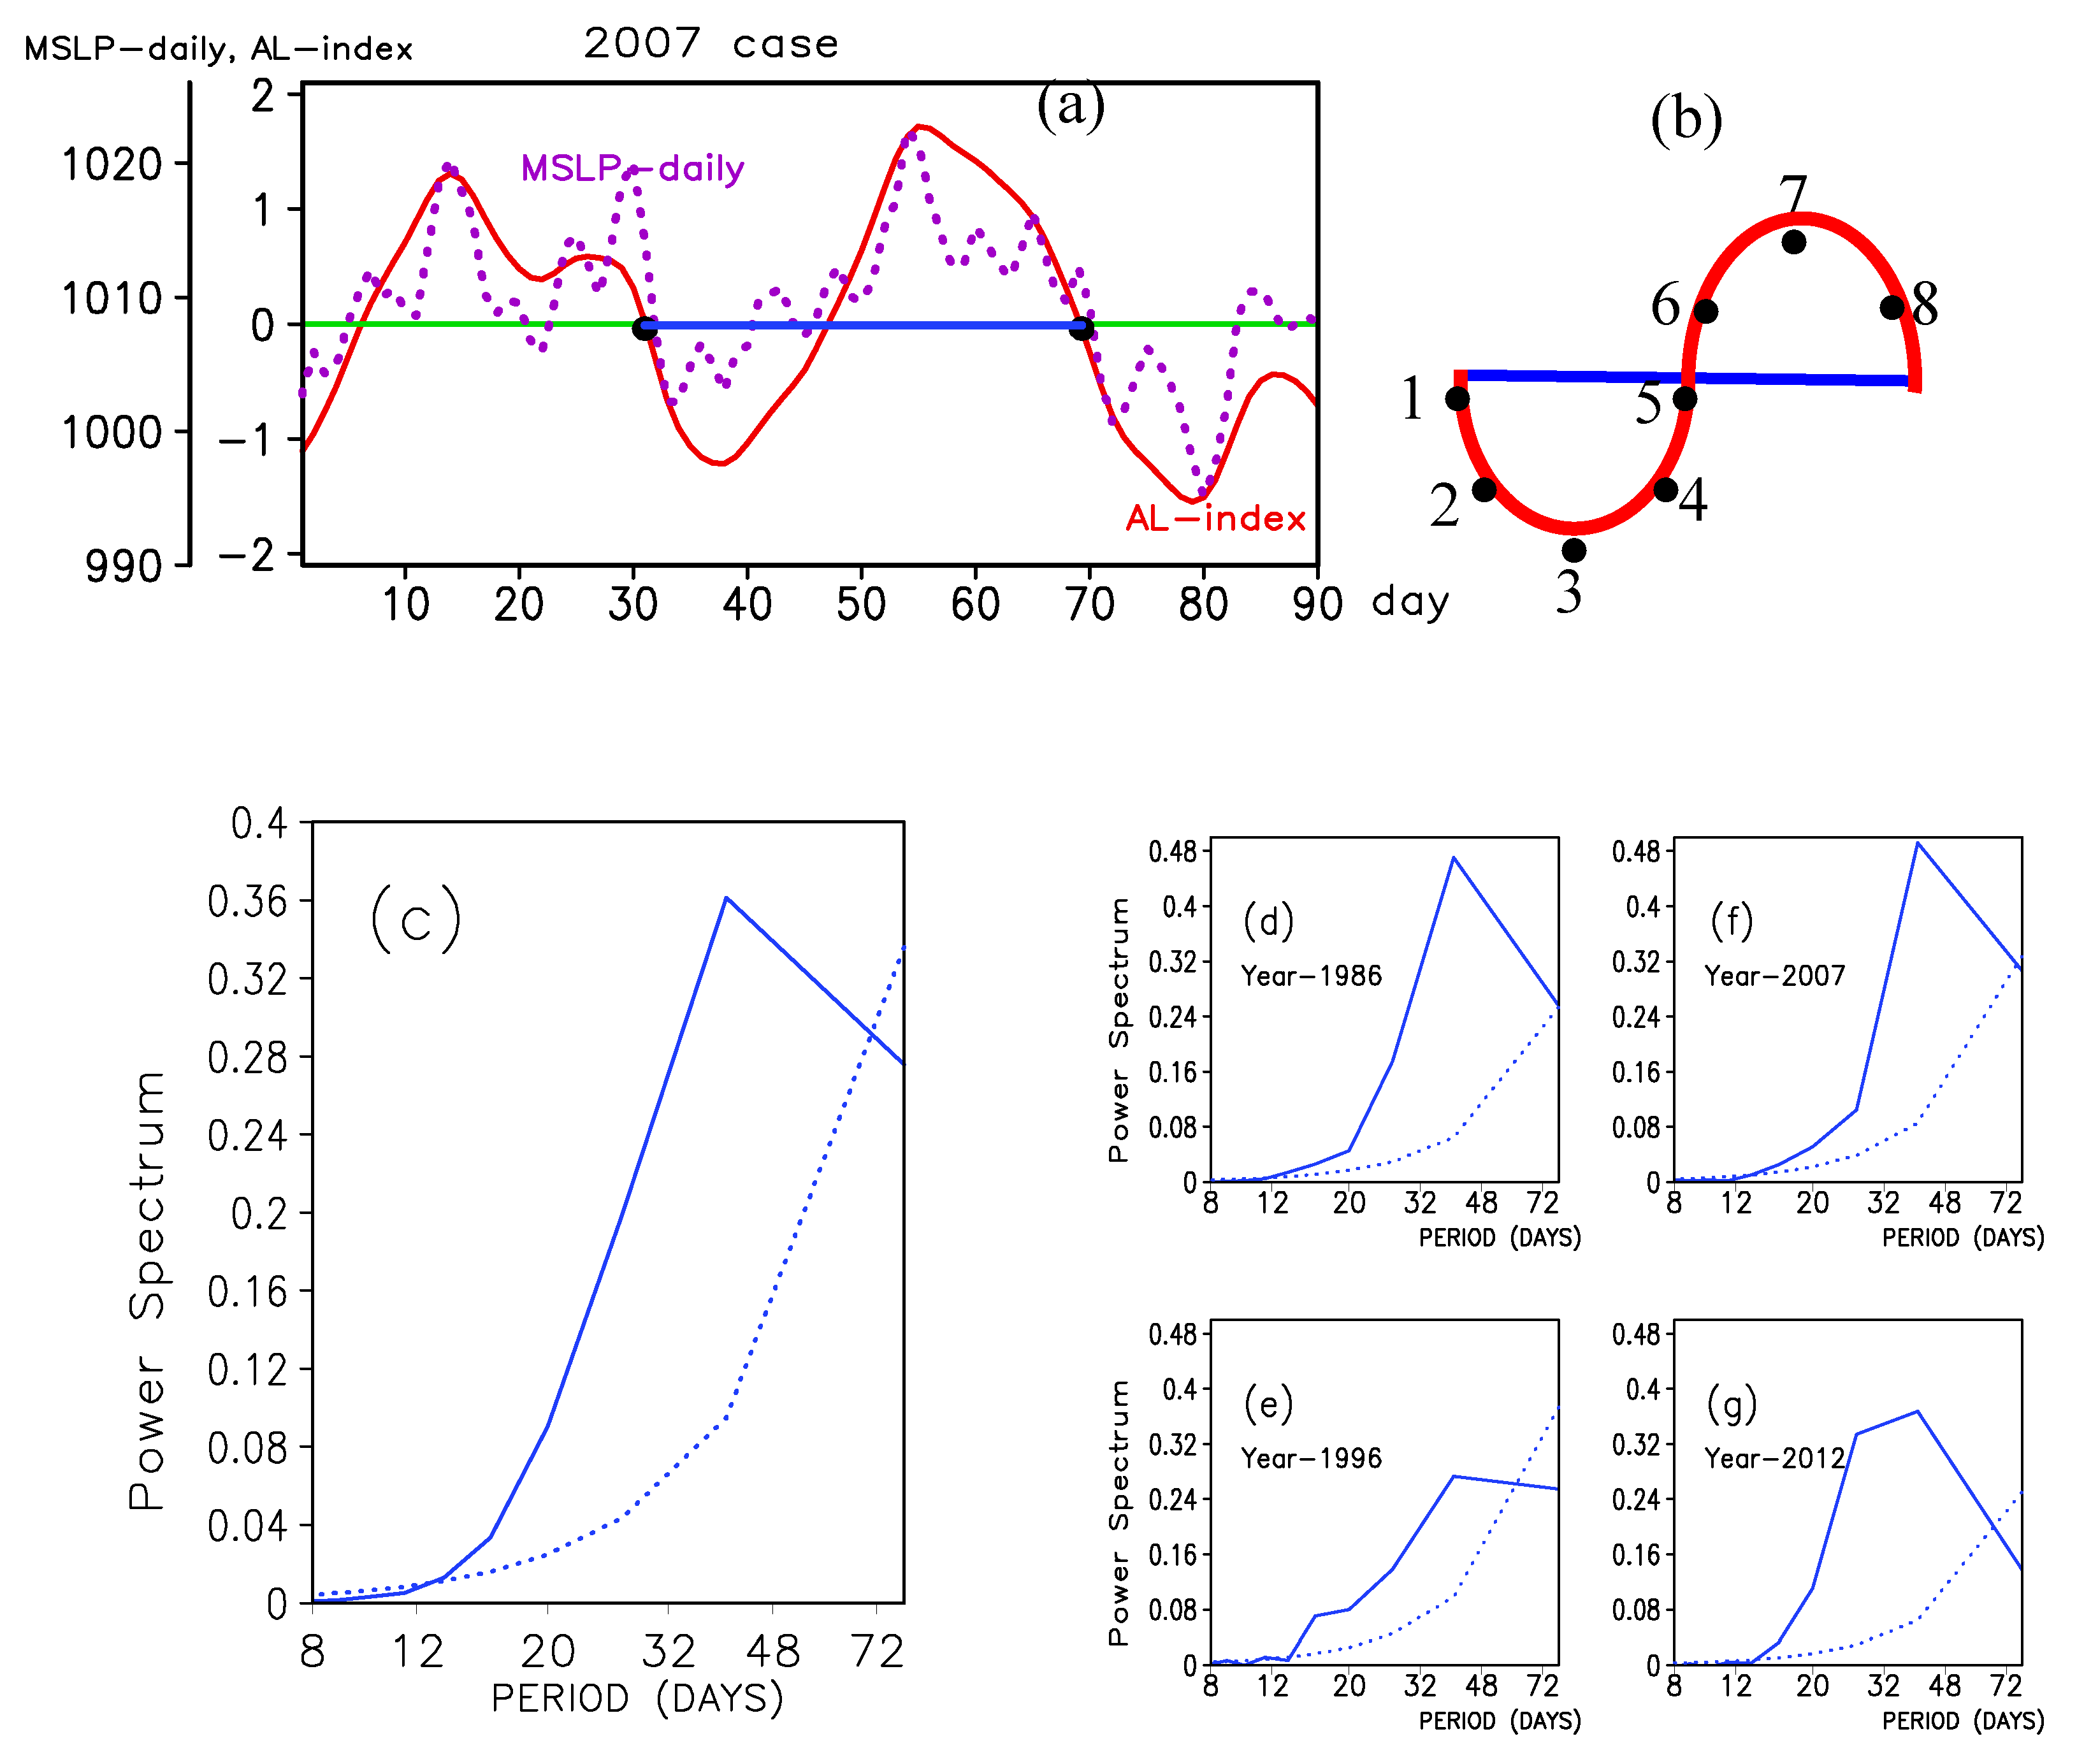
2.3. Definition of AL Index on Intraseasonal Time-Scale (ALI)

The daily data for the whole years 1979–2015 were filtered using a 20 to 80-day band-pass filter to obtain the intraseasonal signal. The filter that was used is the Butterworth filter [26]. The wintertime AL index on intraseasonal time-scale (ALI) is defined by the domain average of the filtered MSLP anomaly over the region of (160° E–140° W, 30° N–65° N, red box in Figure 1) for the winters of 1979–2014 [27]. Therefore, the ALI has a total sample of 36 (year) × 90 (day) = 3240 days. AL oscillation events are picked according to the ALI time series. As an example, Figure 2a shows the ALI on a 20 to 80-day time-scale for the winter of 2007 and one picked event. We picked a total of 43 events according to ALI. There are one or two AL oscillation events in a winter because the ALI has a peak periodicity of about 40 days in most winters, and 20 to 40 days in several other winters.

3. Results

3.1. Intraseasonal Variation of AL

Figure 1 shows the climatological field of MSLP and 20 to 80-day standard deviations of MSLP during the winters of 1979–2014. The large value of MSLP’s intraseasonal variance is located over the mid-North Pacific basin. Its center is slightly on the eastern part of the climatological AL. Thus, it is reasonable to use the red box domain to define the ALI. We obtained the daily ALI for winters of 1979–2014 according to Section 2.3. Figure 2a displays the time series of the daily ALI, as well as an identified AL intraseasonal oscillation event for the winter of 2007. The averaged power spectrum of ALI in winters 1979–2014 is shown in Figure 2c. The peak periodicity is about 40 days, according to Figure 2c. Meanwhile, a periodicity shorter than 40 days is also seen in Figure 2c. As examples, the power spectra of ALI in four individual winters (1986, 1996, 2007, and 2012) are plotted in Figure 2d–g. Figure 2d,f show a similar peak periodicity as Figure 2c, while Figure 2e,g show a periodicity that is robustly shorter than 40 days.
Each AL oscillation event is divided into eight phases. Figure 2b shows the eight phases. Phase three represents the strongest stage of AL with the minimum value of ALI. Phase seven is corresponding to the weakest stage of AL with the maximum value of ALI. Phase five denotes the transition from the strong AL to the weak AL period. Phases two, four, six, and eight are defined at the time when the oscillation reaches half of its minimum or maximum amplitude. According to above eight phases, the structure and evolution of AL on an intraseasonal time-scale can be examined by a phase composition. For the composition of phase n , we use the average of three days: one day leading into phase n , the day of phase n , and one day after phase n . The life cycle of an oscillation that is shown above is commonly used for examining the atmospheric intraseasonal oscillation, similar to the Madden–Julian Oscillation (MJO) [28,29] and the boreal summer intraseasonal oscillation over the Asian summer monsoon region [30].
Figure 3 plots the life cycle composite of MSLP anomaly based on the ALI in eight phases for 43 AL intraseasonal oscillation events. The signals are concentrated over the pan-North Pacific region, especially over the North Pacific basin region. From phases one to three, the continuous enhancement in the AL’s intensity is seen (Figure 3a–c). The AL’s circulation gets its strongest in phase three. From phases four to five, the cyclonic circulation anomaly over the North Pacific basin fades away, and an anticyclonic circulation occupies over the basin region. In phase seven, the AL is in its weakest stage.

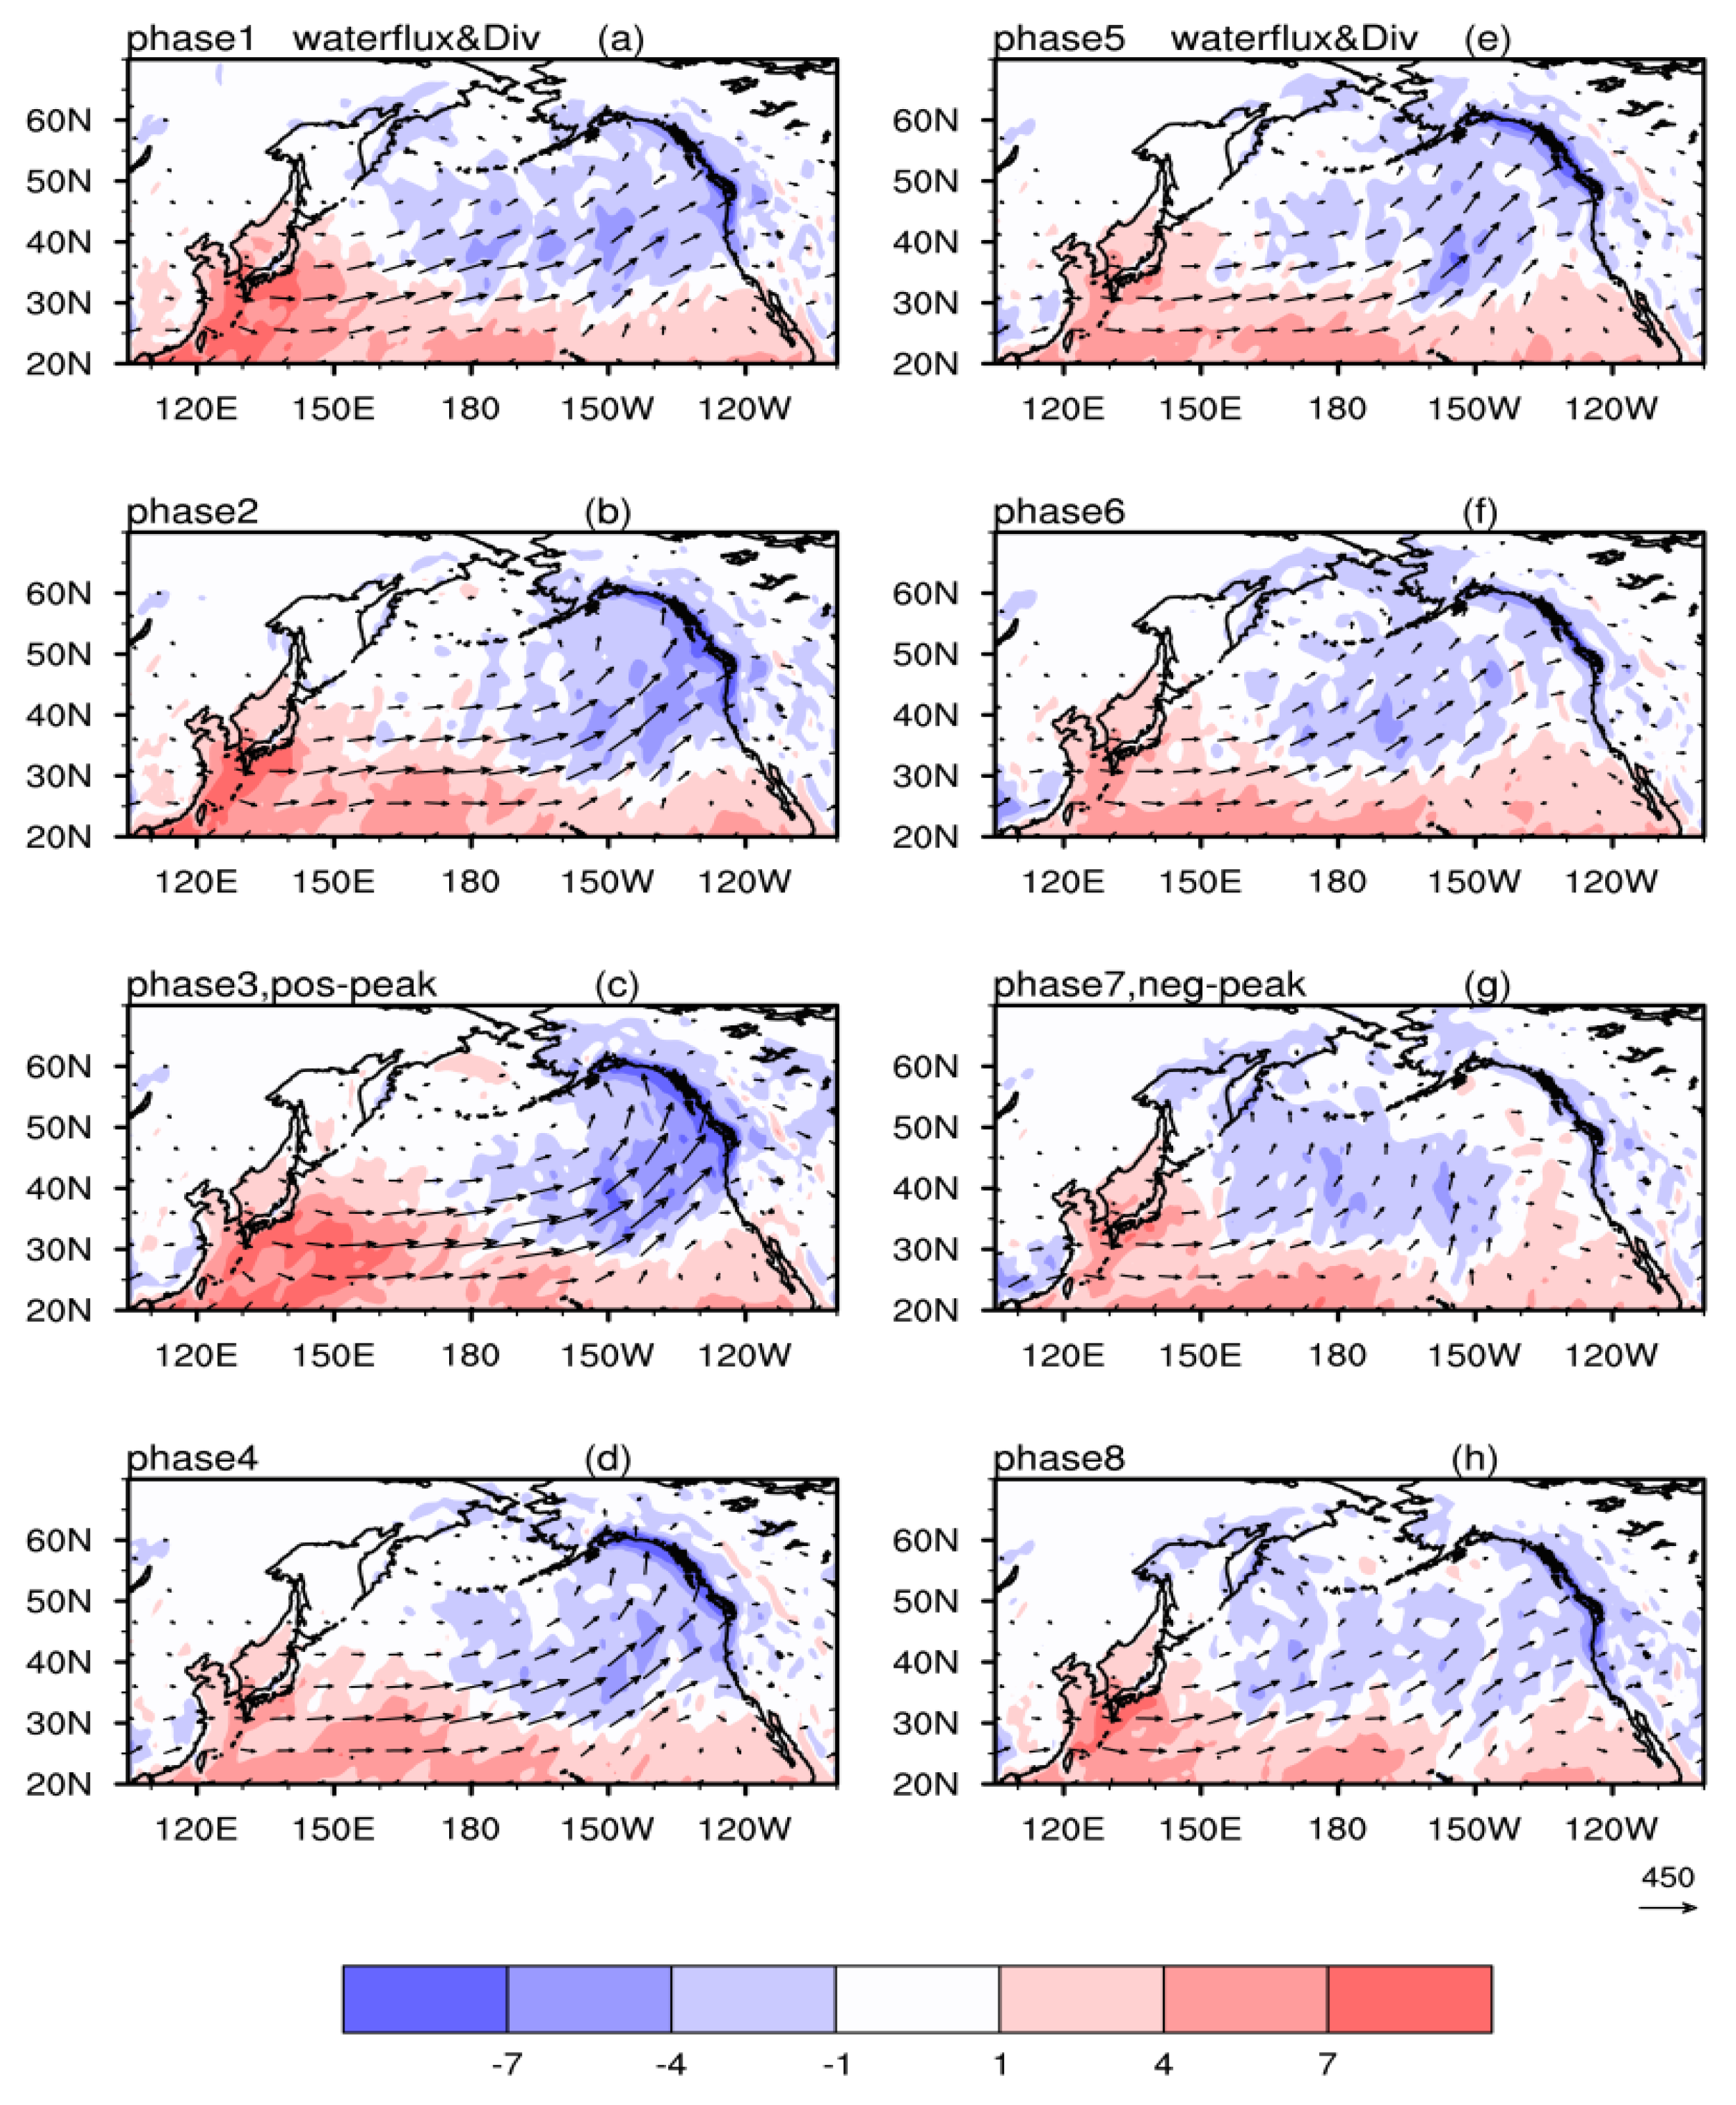
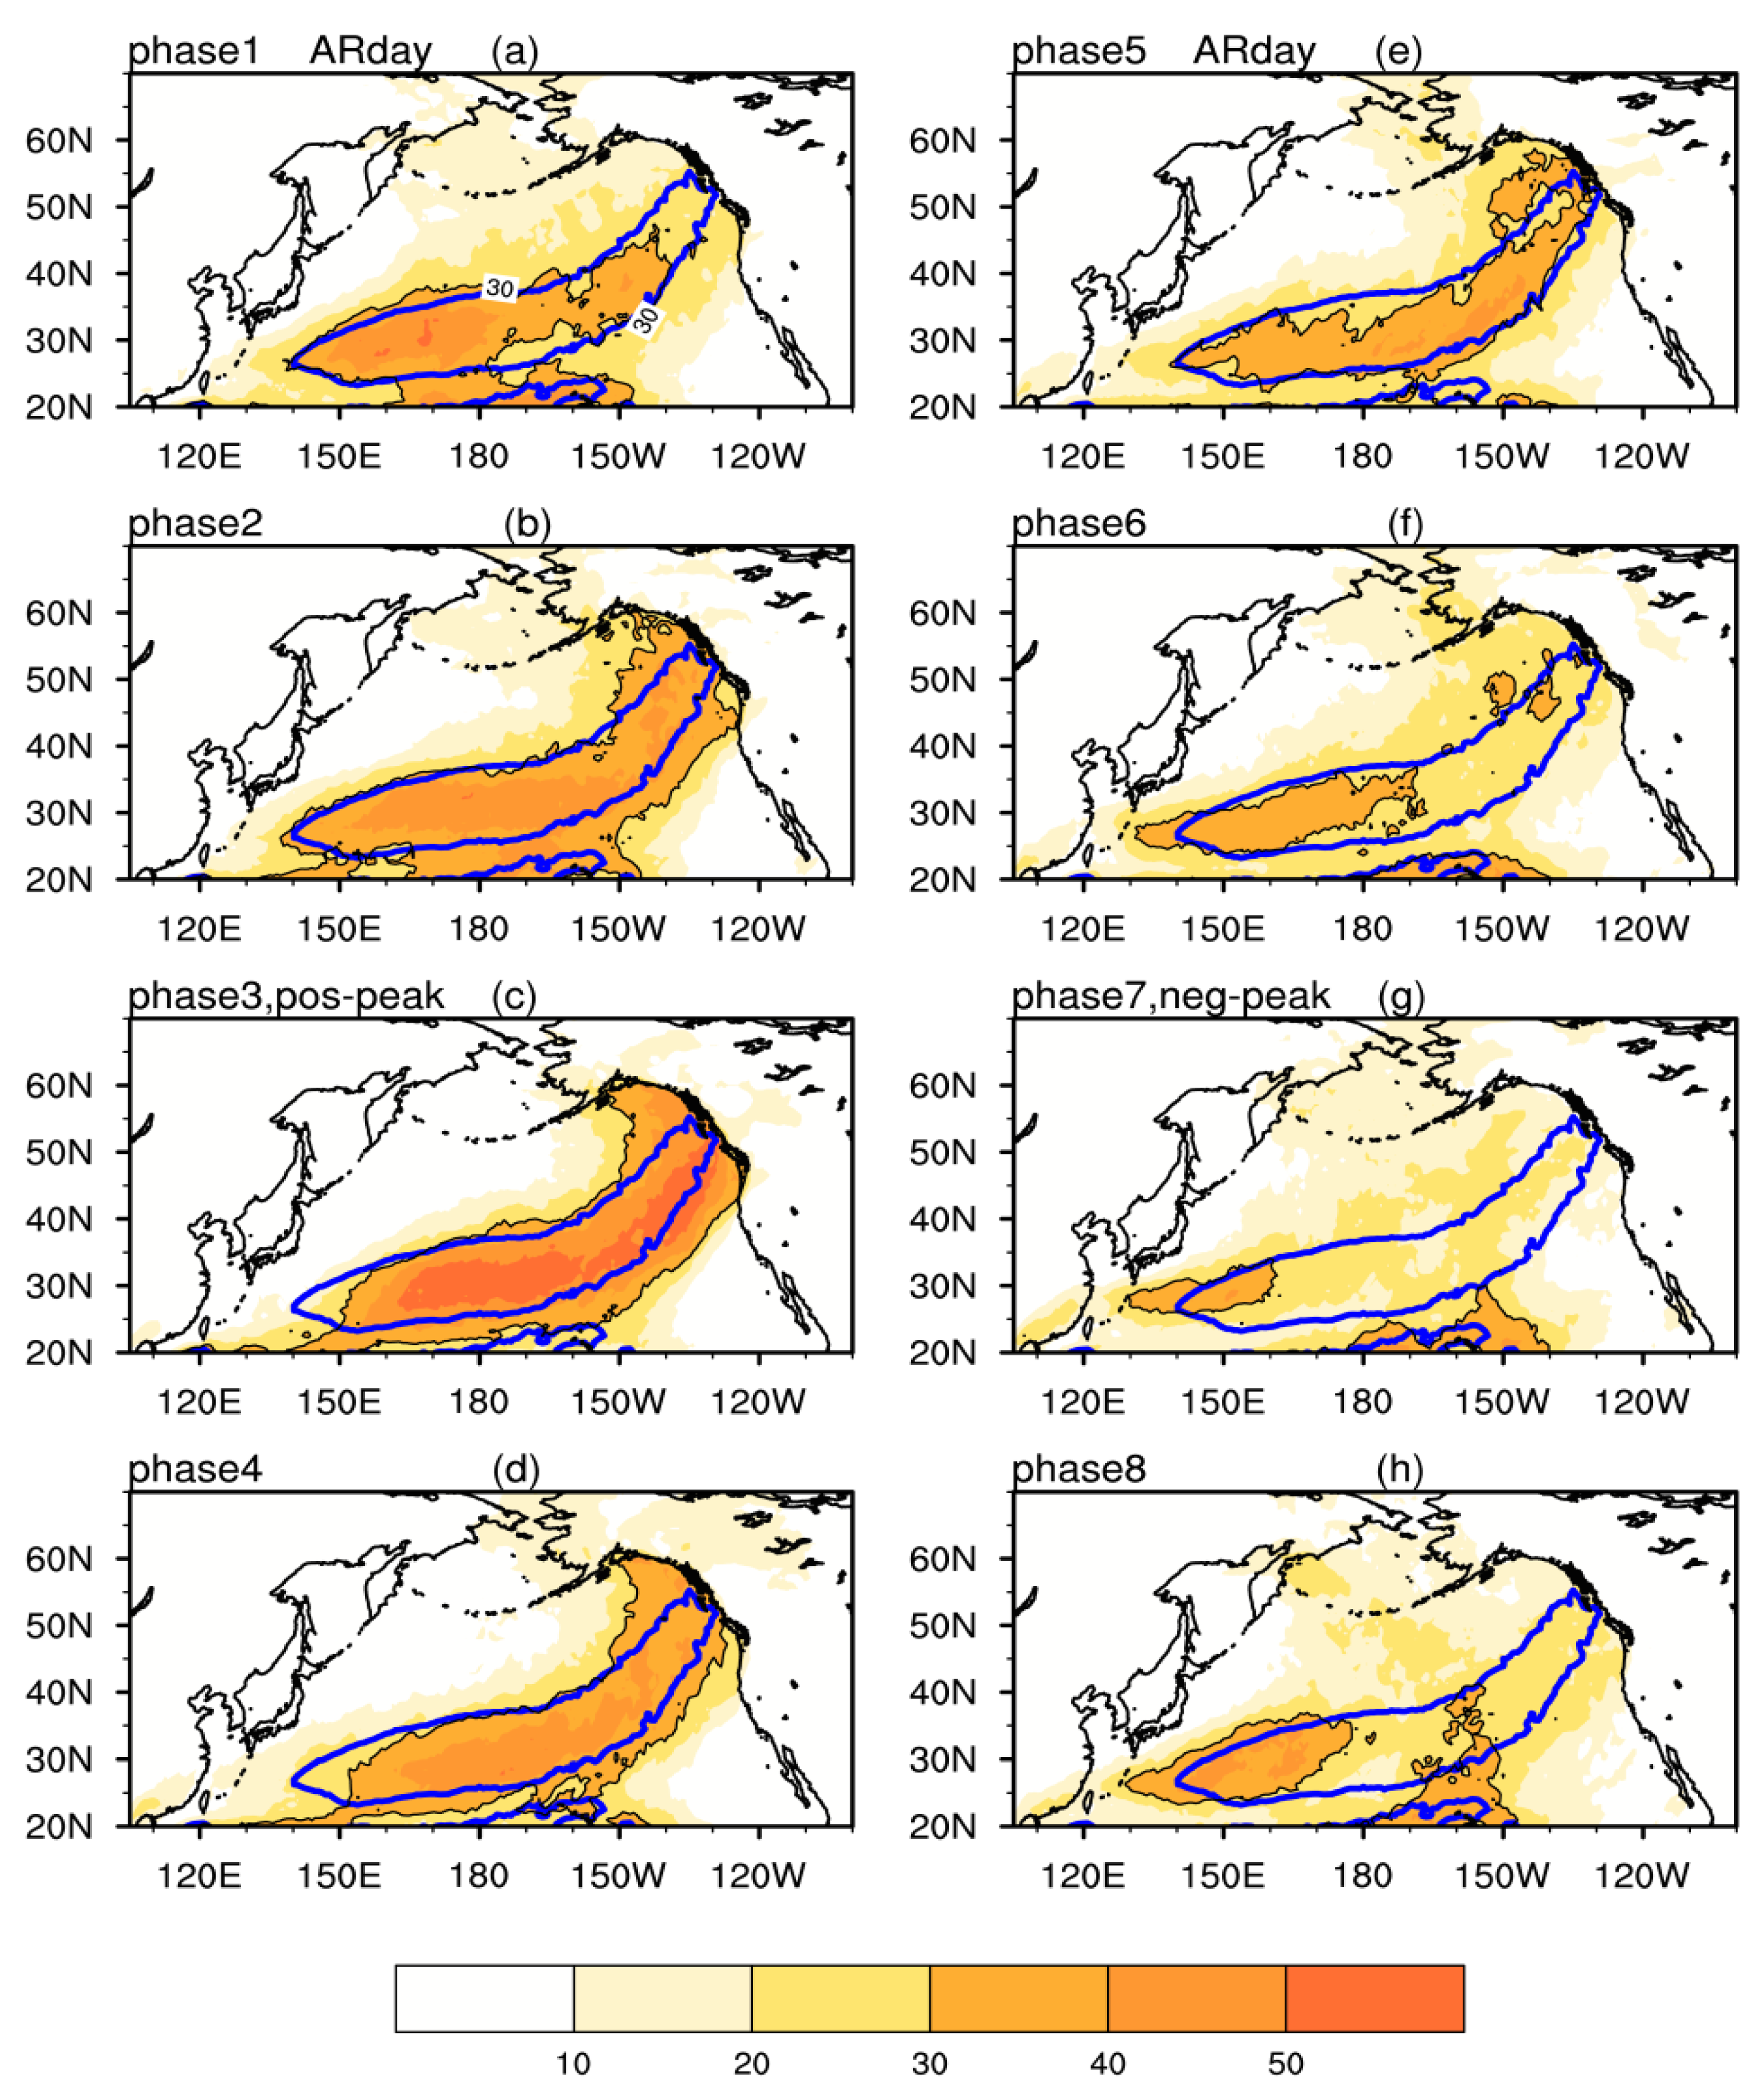
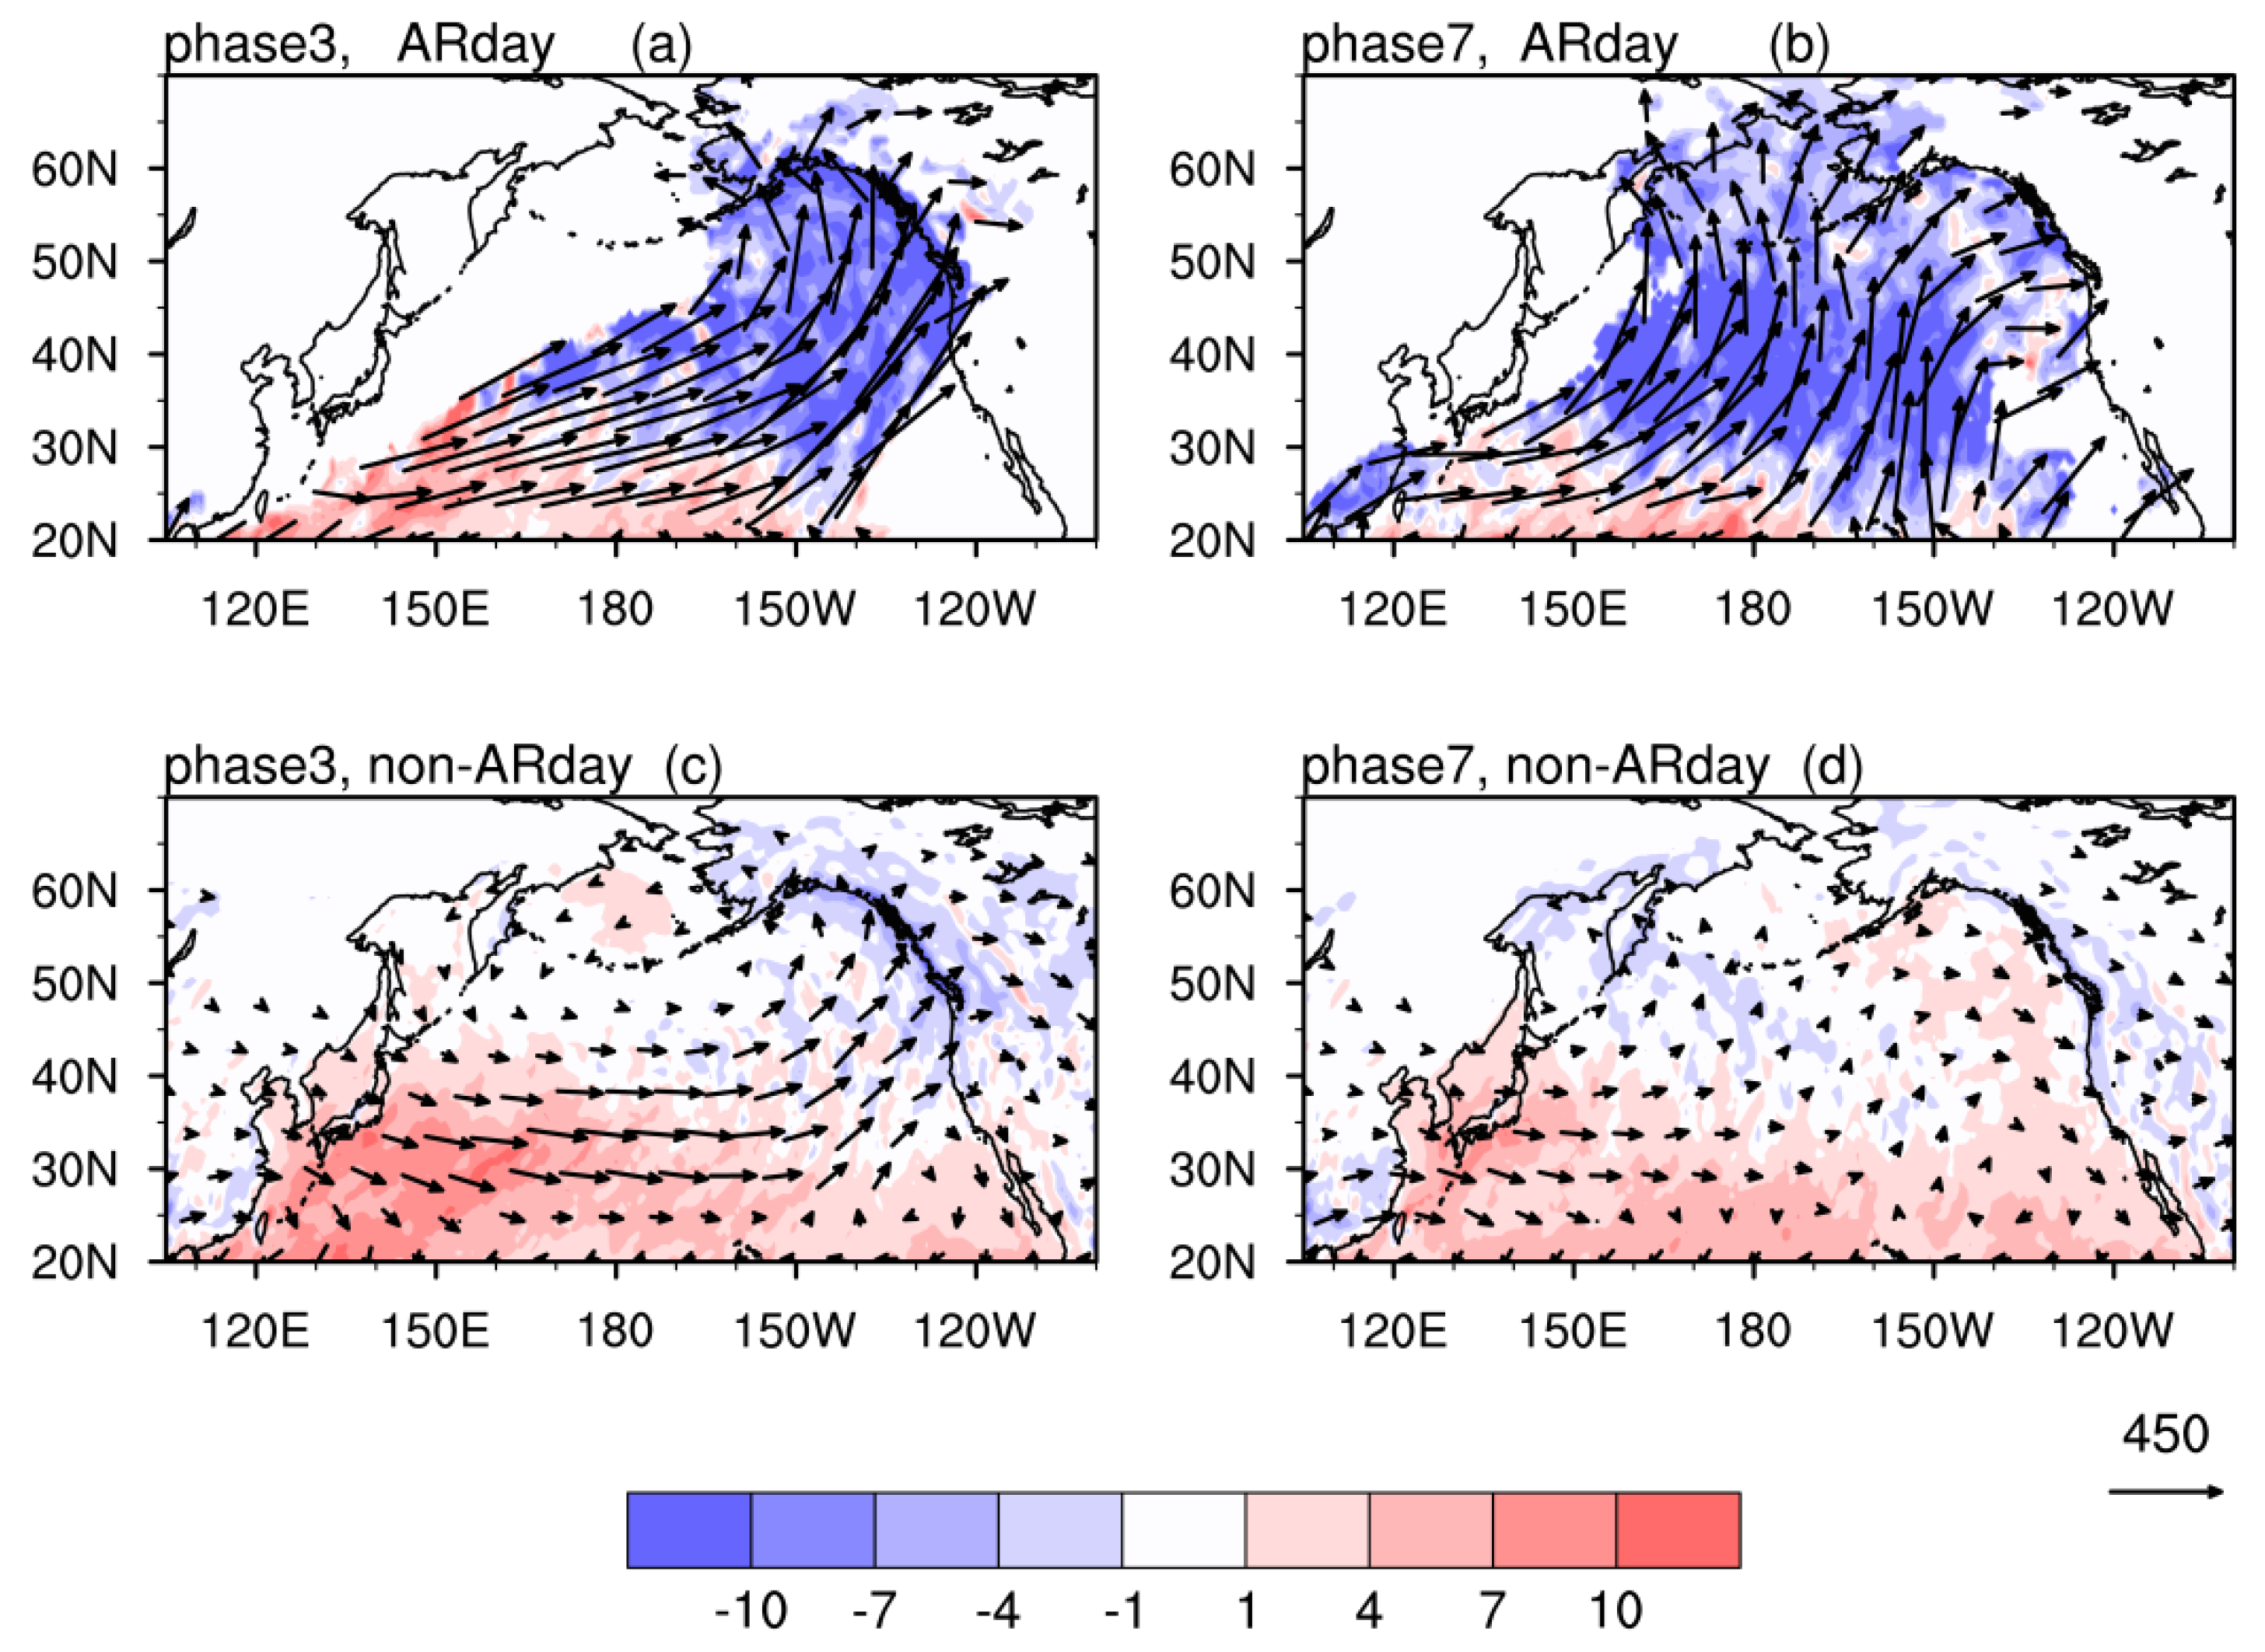
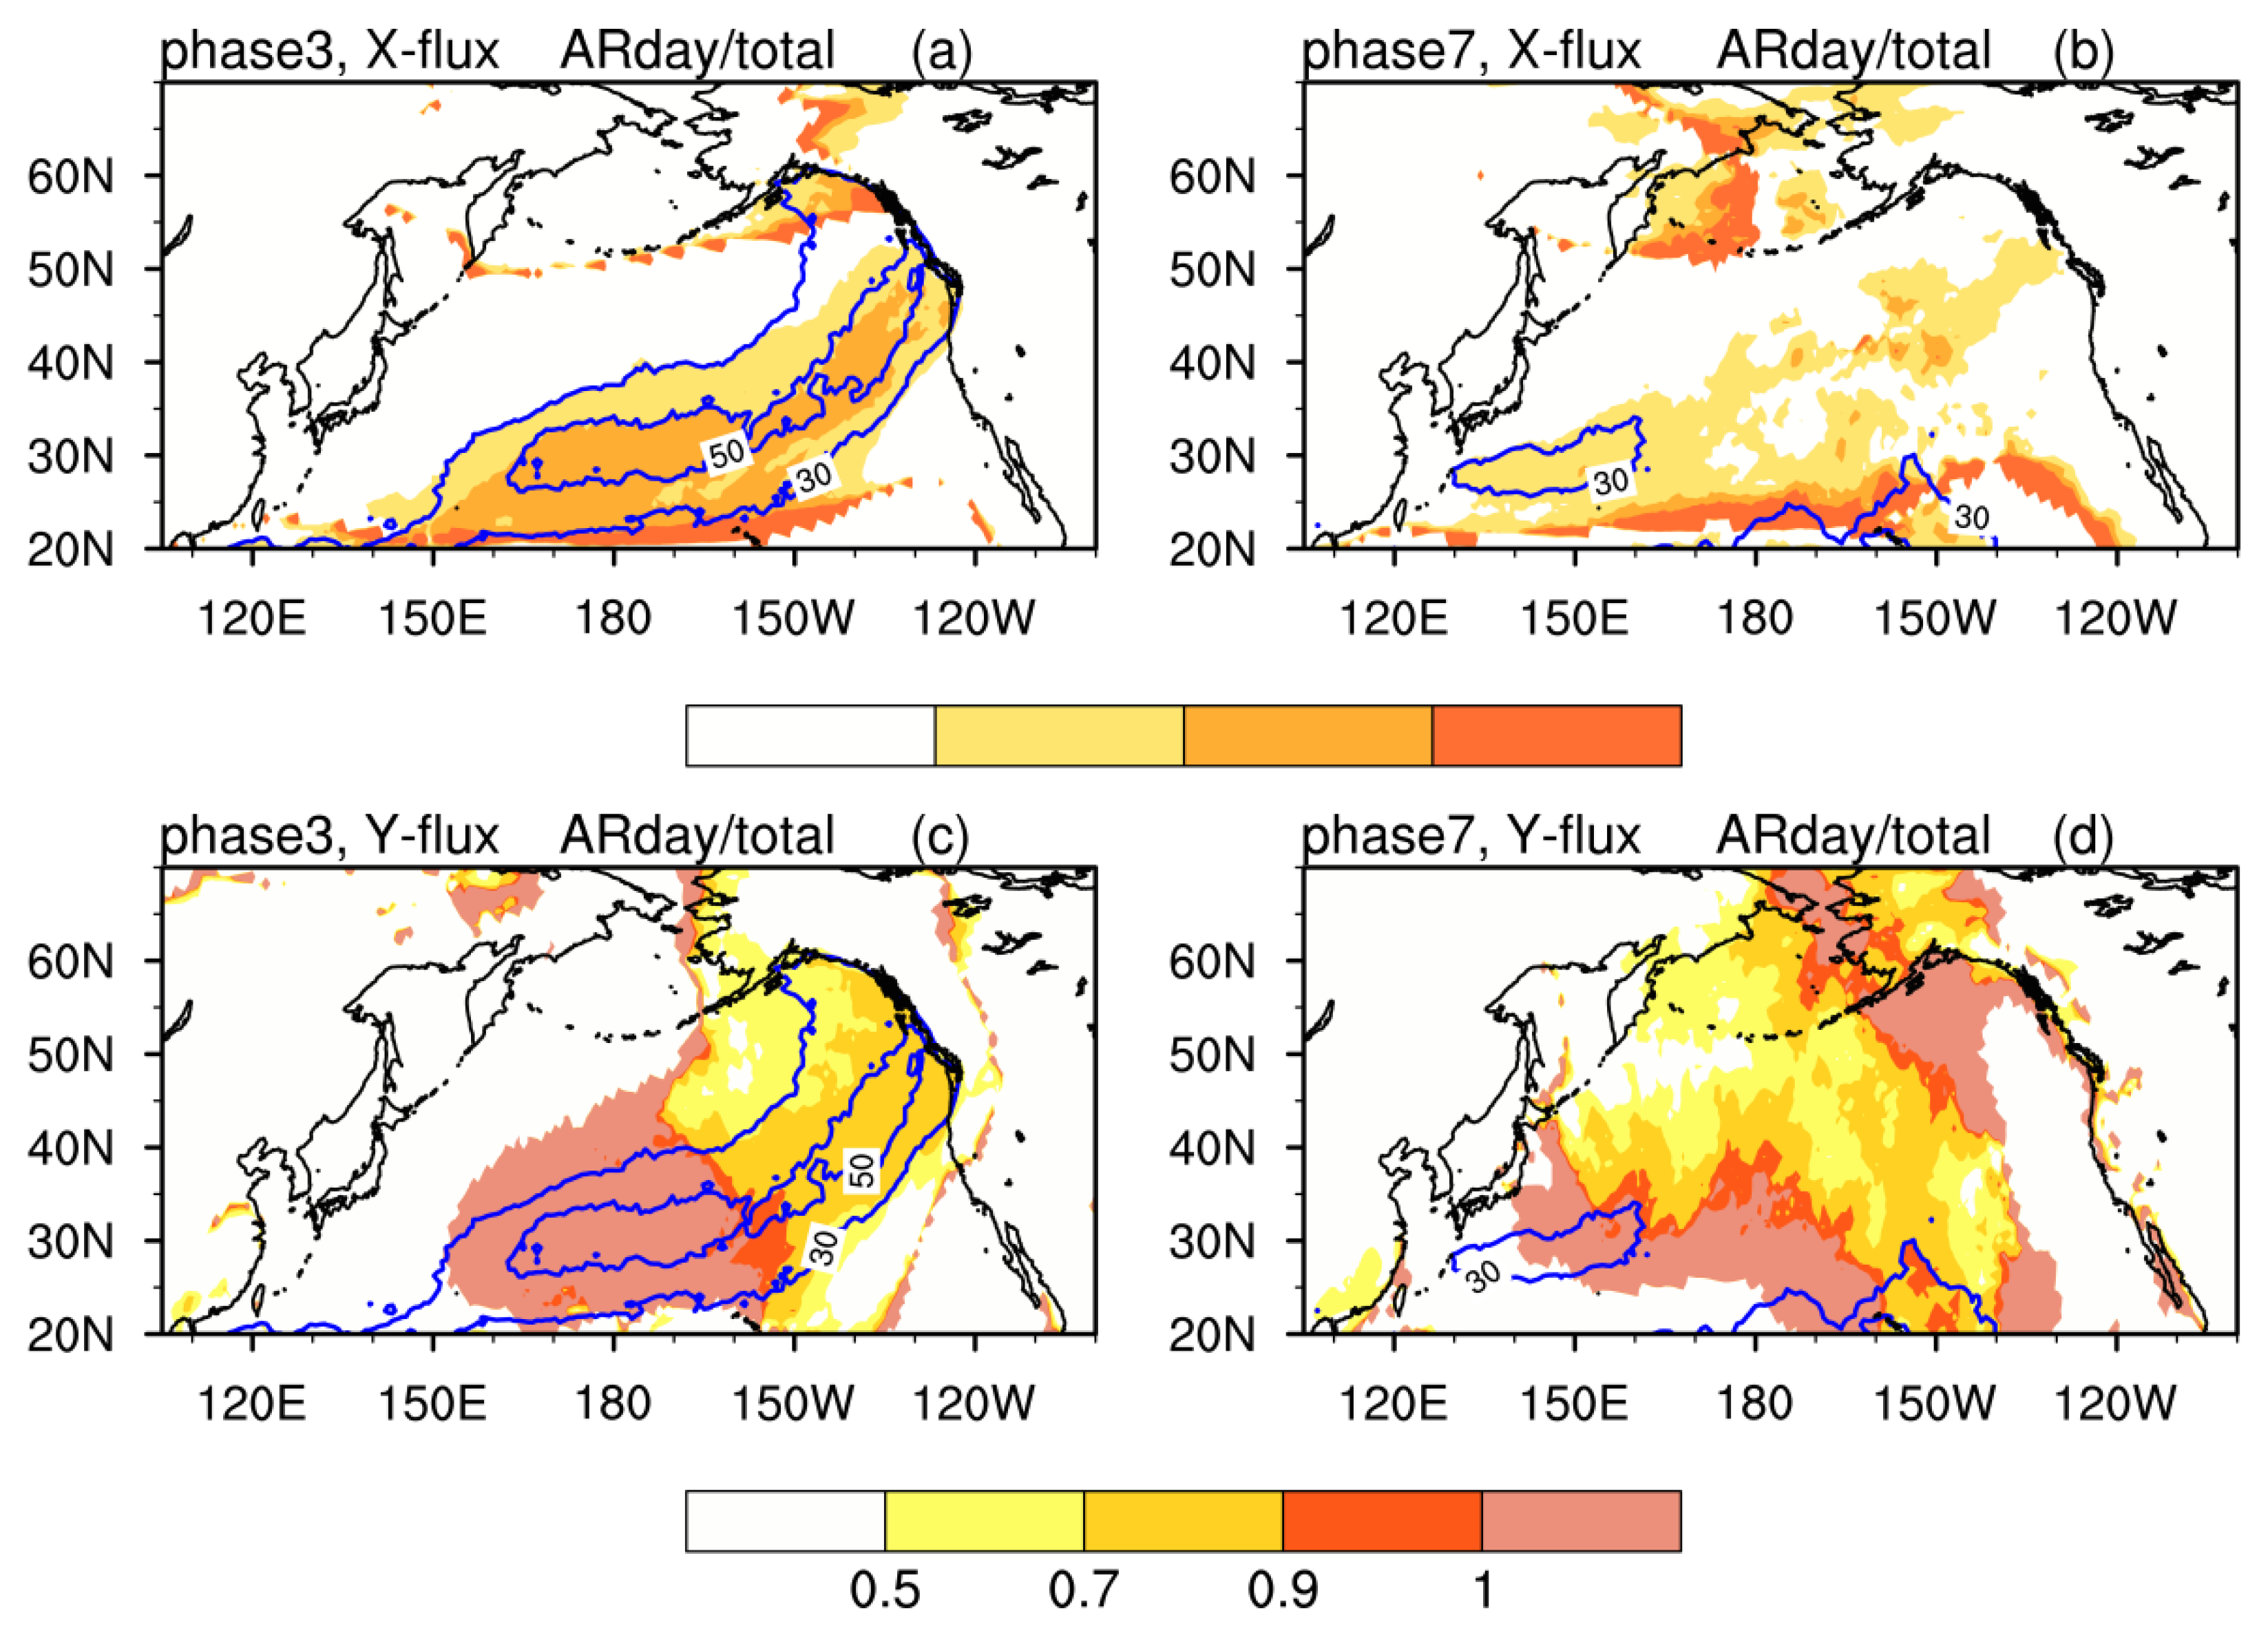
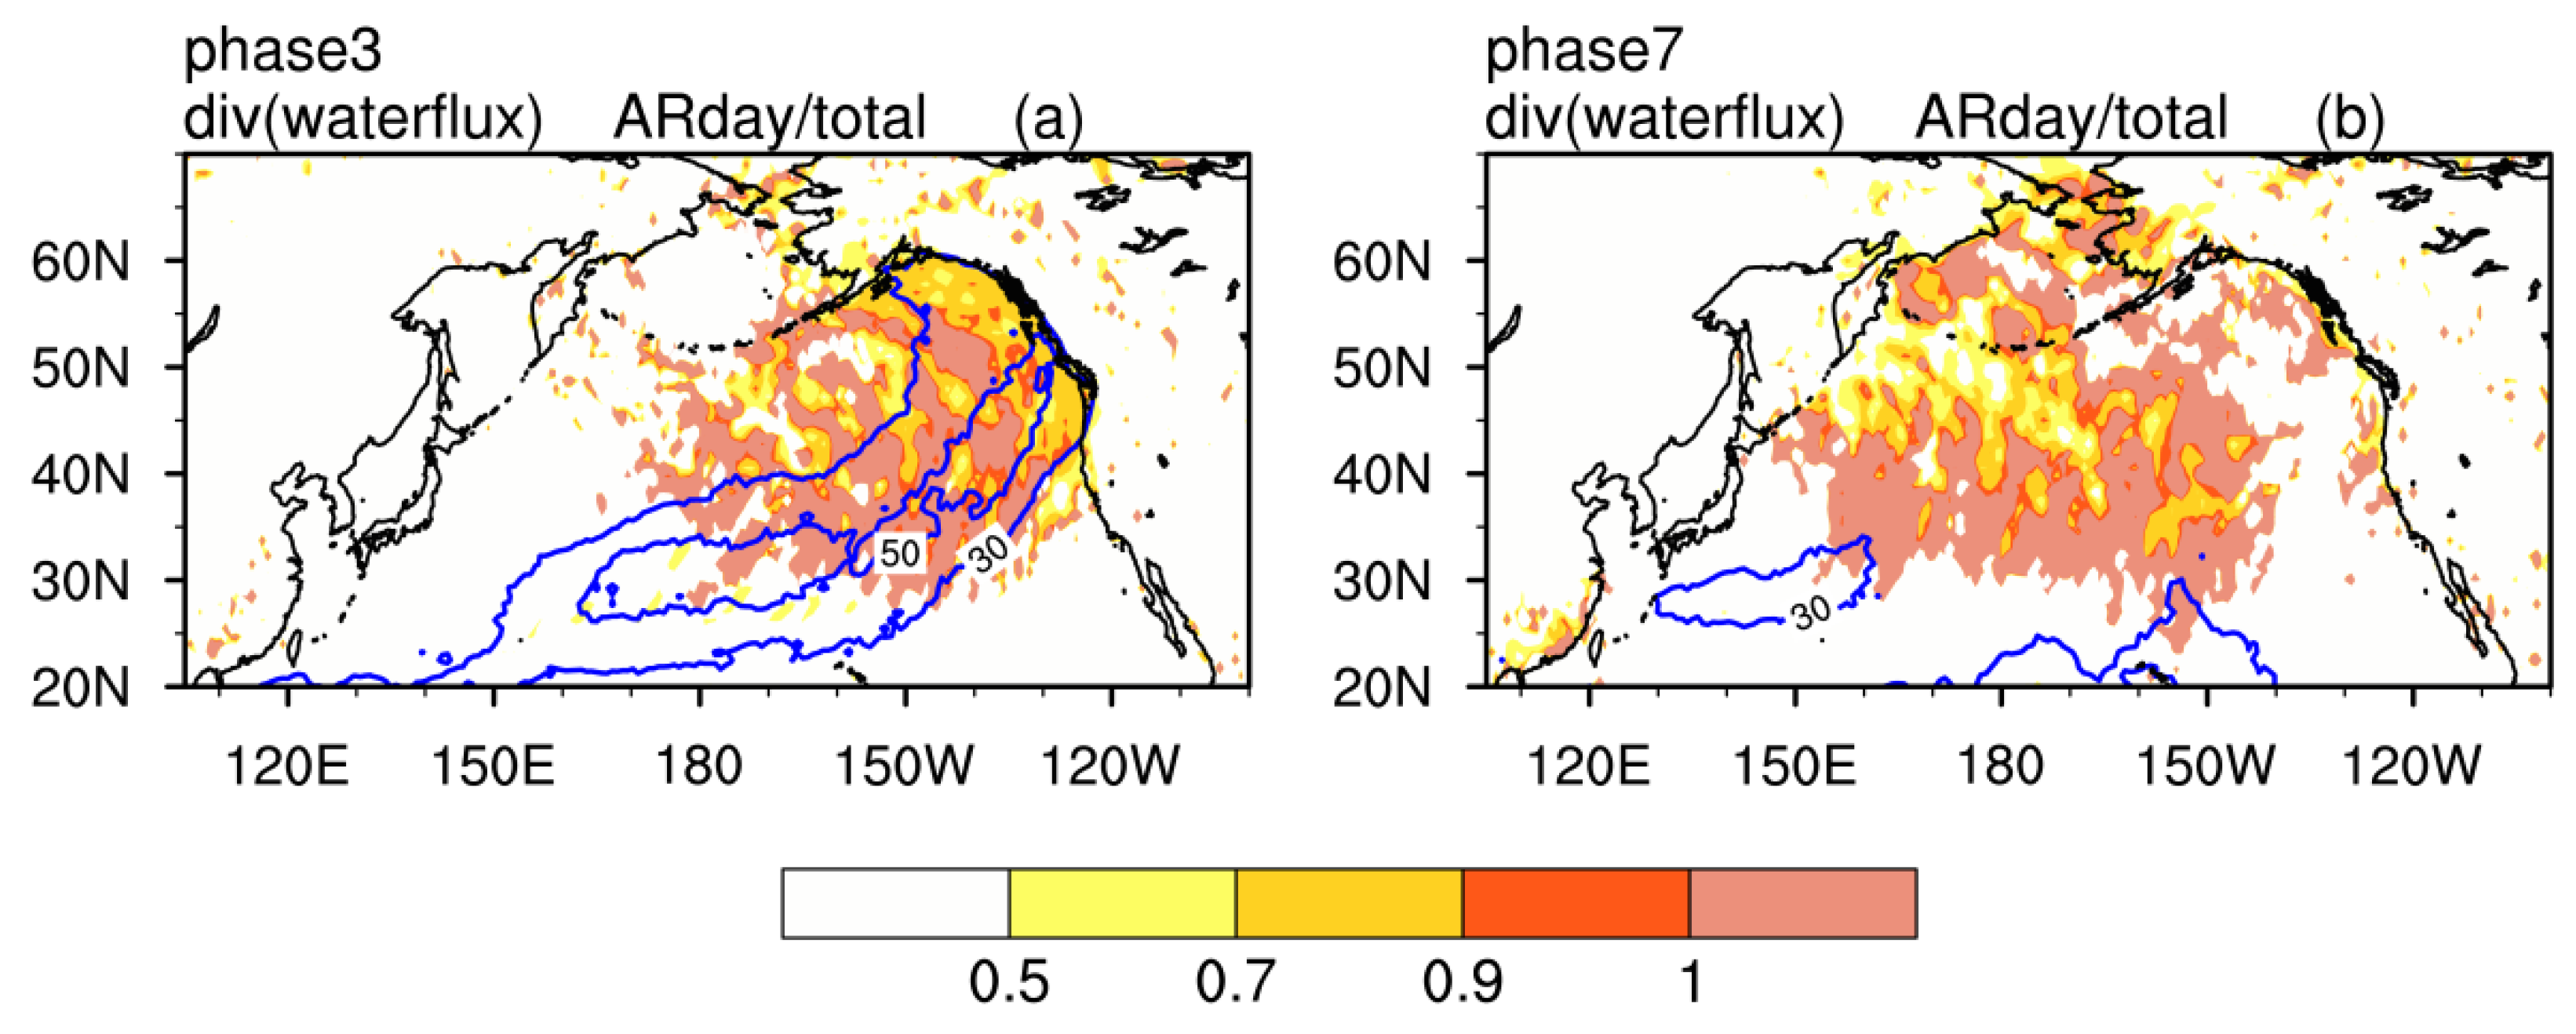
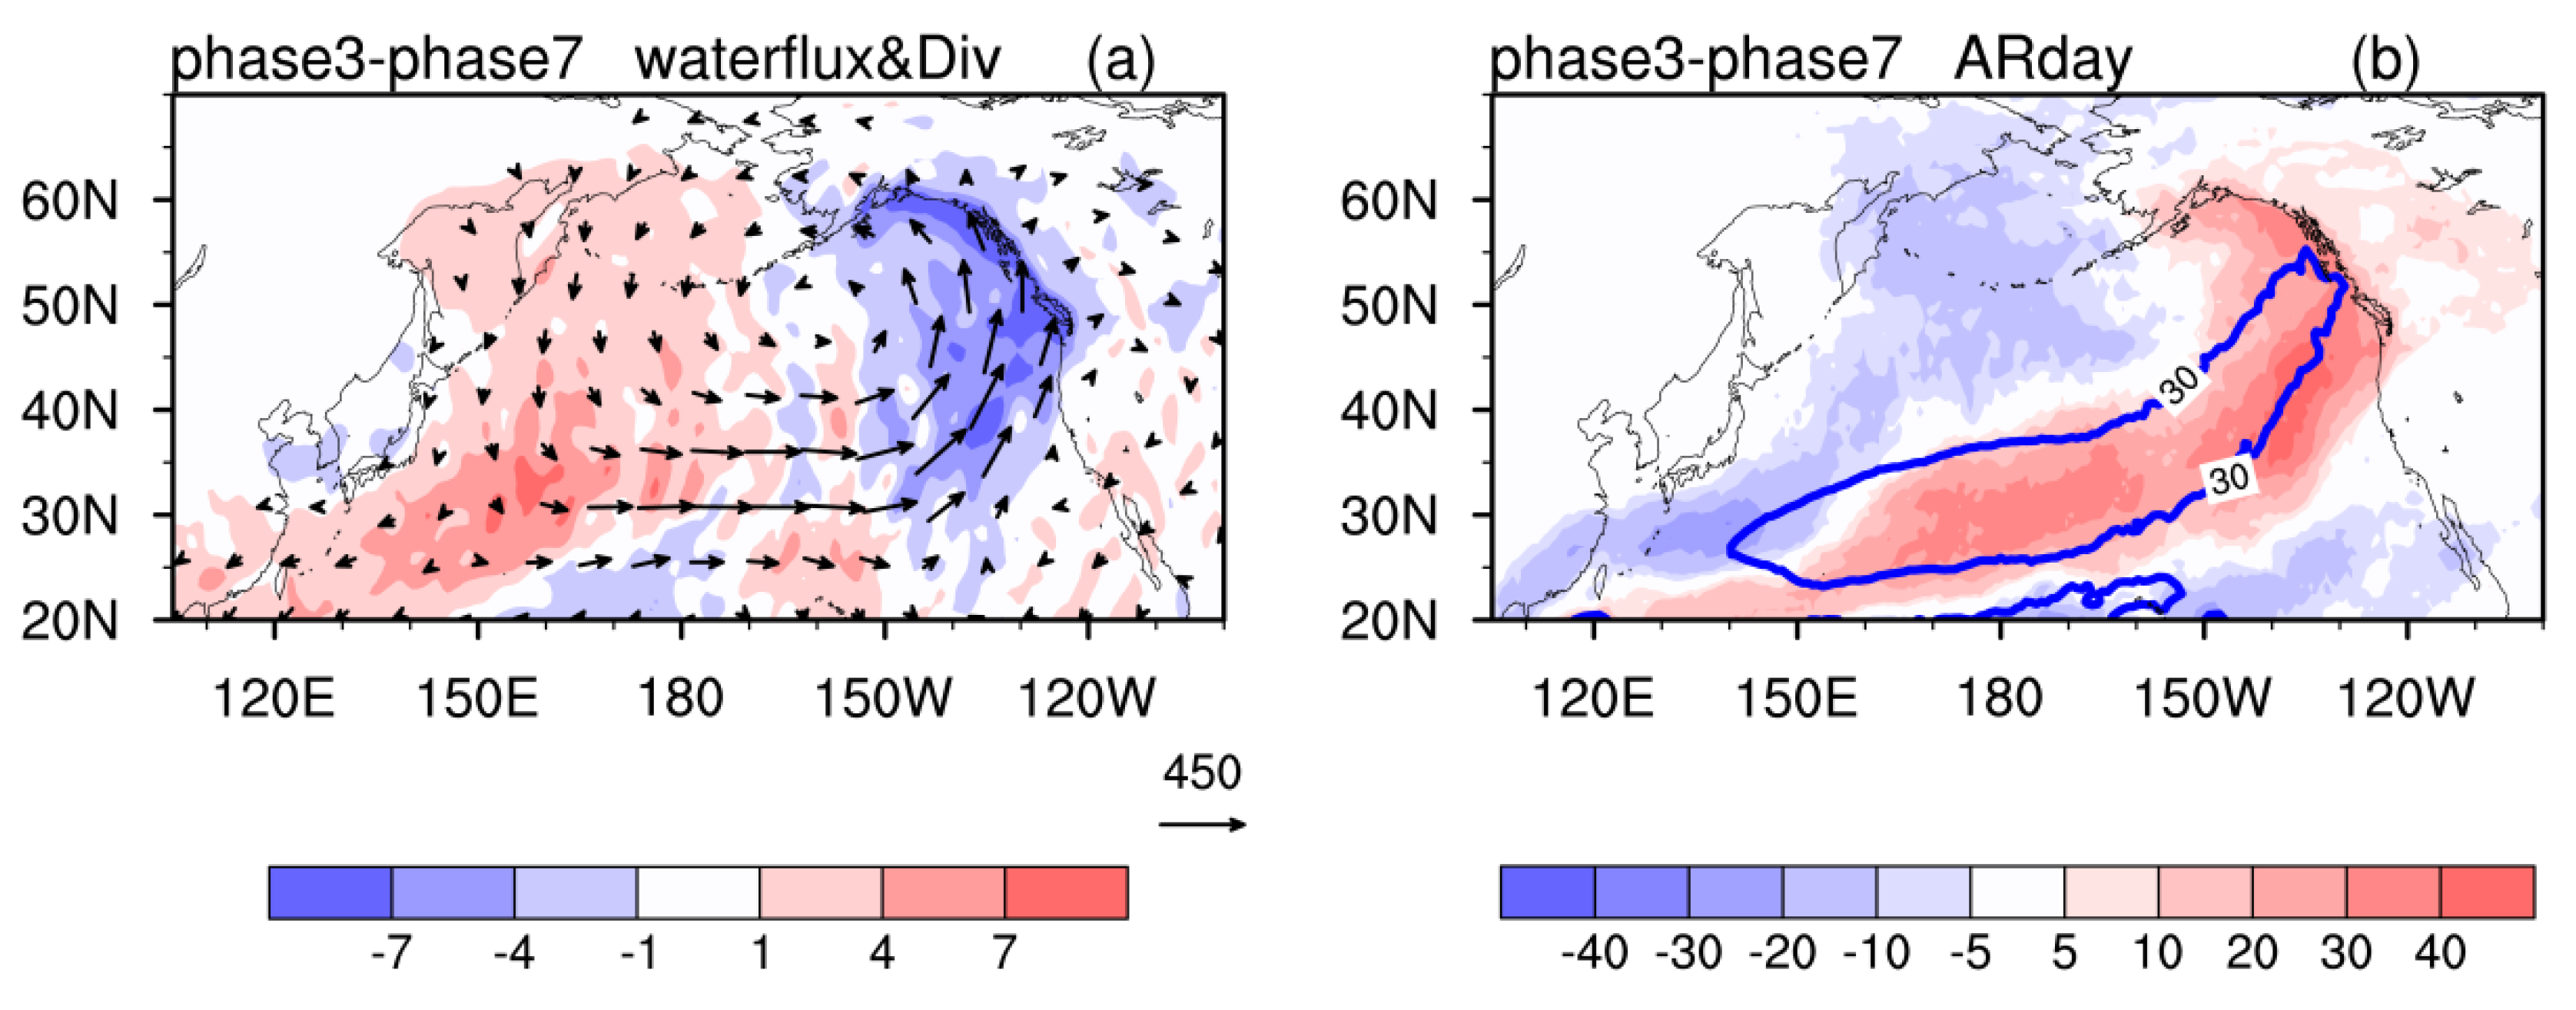
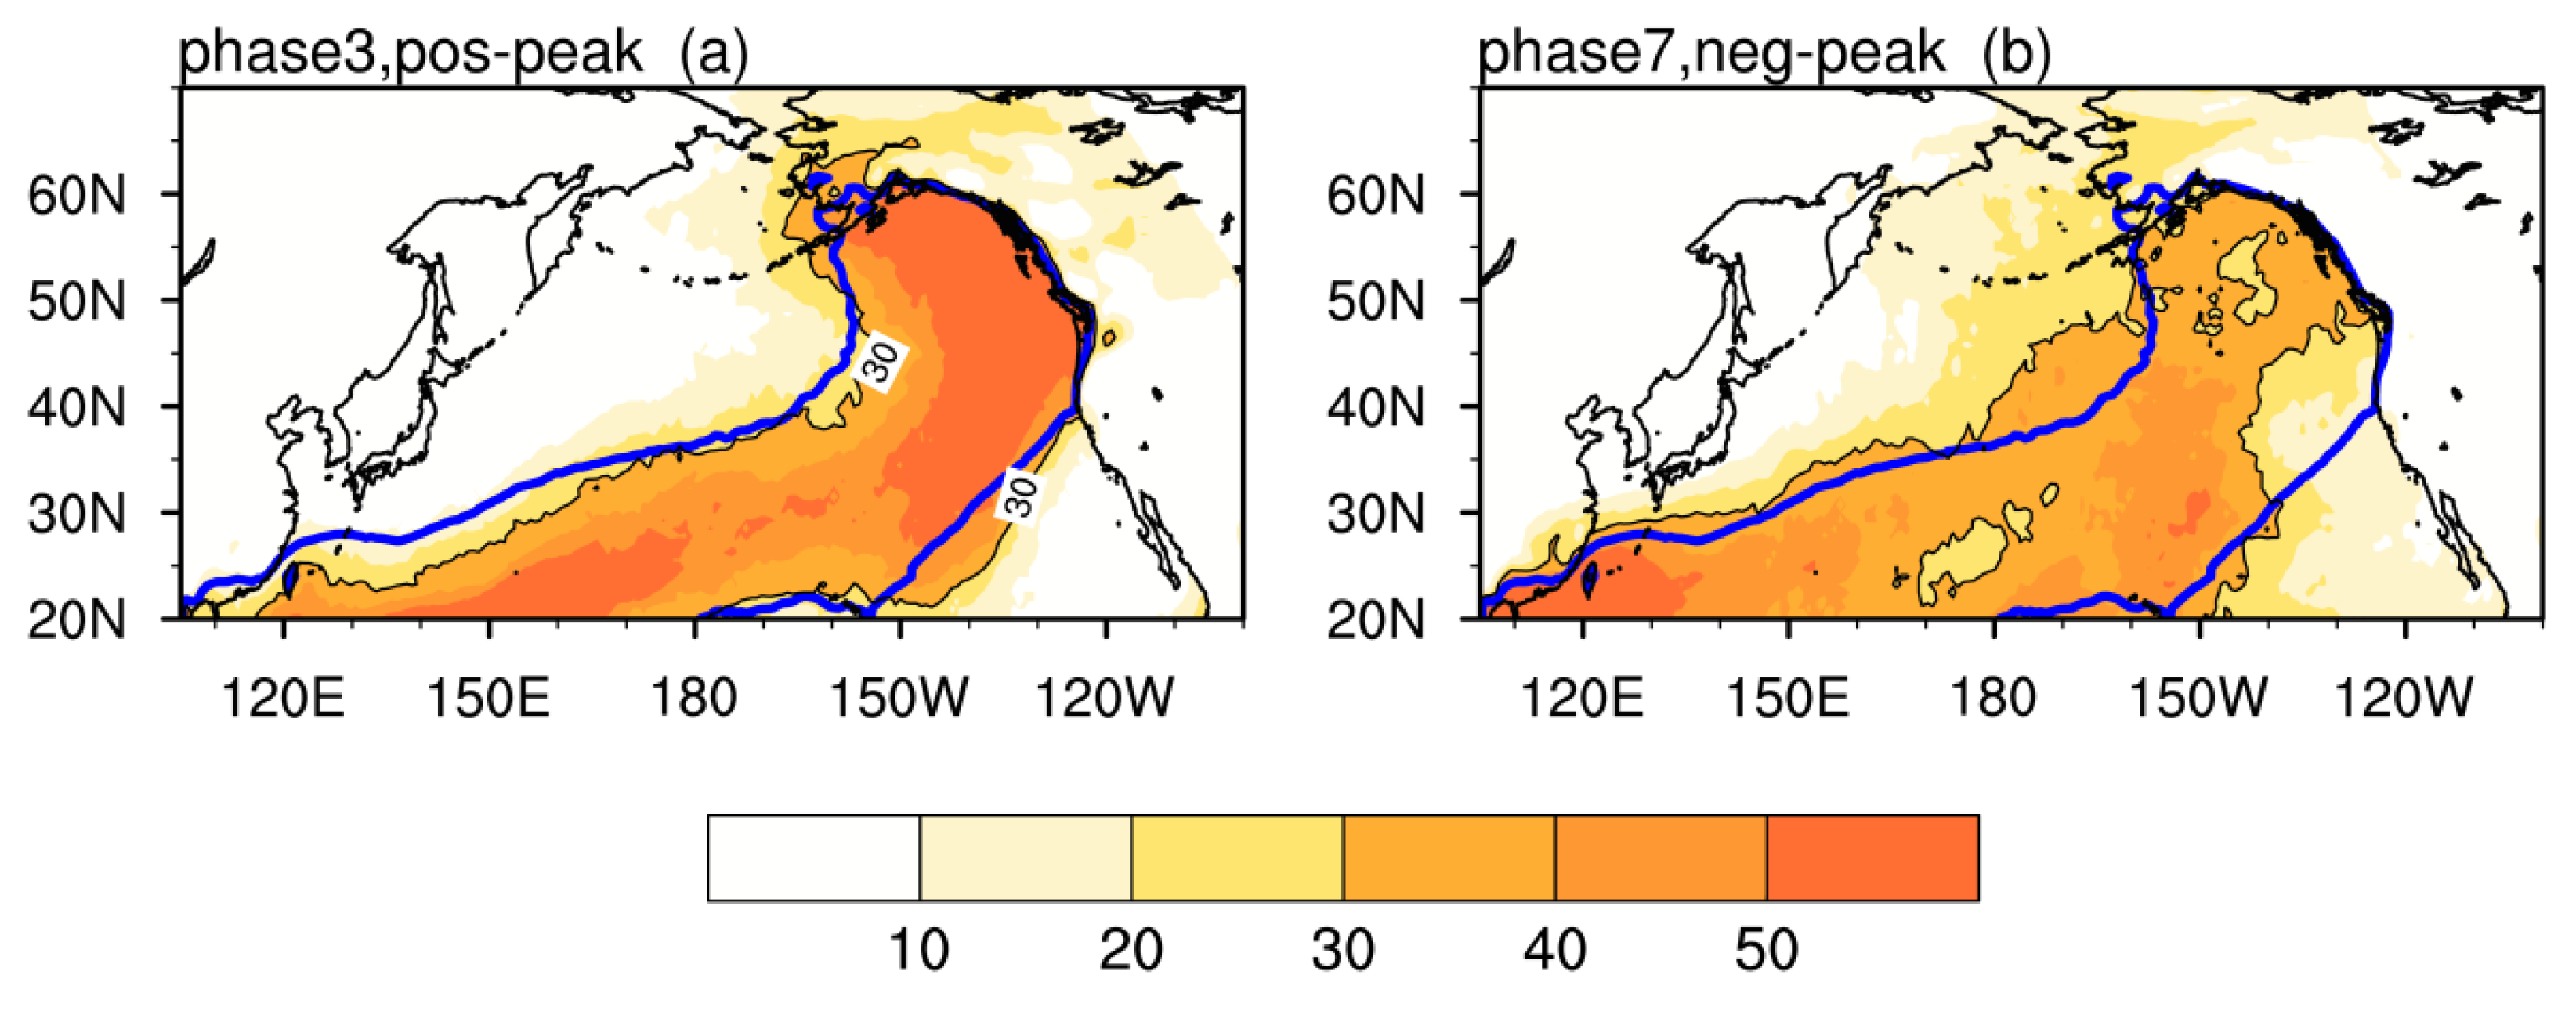
3.2. IVT and AR Changes Associated with the Intraseasonal Variation of AL

In this section, we reveal the changes in atmospheric water vapor transport and its divergence, and the ARs associated with the intraseasonal variation of AL over the North Pacific in winter. To demonstrate the fluctuation clearly, we show the actual value of IVT, ∇·IVT, and ARs, rather than the anomalies.
Figure 4 depicts the life cycle composite of IVT and ∇·IVT based on ALI in eight phases. A total of 43 AL intraseasonal oscillation events were used for composition. Overall, the observed IVT over the North Pacific region showed cyclonic transports for all the phases. However, the magnitude and direction of the IVT showed considerable differences between the AL’s strengthening stage (phases two, three, and four) and its weakened stage (phases six, seven, and eight). The IVT is featured by eastward transport to the west of 150° W, and poleward transport between 150° W–125° W during phases one to four. During phases five to eight, especially in phase seven, the eastward transport is slightly weaker, and mainly located to the west of the dateline, compared with the earlier stage. Meanwhile, a weak poleward transport is mostly concentrated over the western and central areas of the oceanic basin. The large moisture source is located over the western North Pacific, and the large moisture sink is over the northeastern North Pacific, which is the west coast of North America in phase three. In contrast, both the moisture source and moisture sink are weaker in phase seven. The moisture sink region shifts to the center basin in phase seven.
The structure and evolution of actual IVT during eight phases are highly associated with the life cycle of the AL. During the AL’s strengthening stage, especially in phase three, the enhanced cyclonic circulation suggests strengthened westerly winds over the mid-basin and strengthened northward and northeastward winds over the northeastern North Pacific (Figure 3c). Therefore, the AL’s circulation during phase three transports more moisture eastward over the mid-basin and poleward over the northeastern North Pacific (Figure 4c). During the AL’s weakened stage, especially phase seven, the moisture transport to the east of the dateline becomes weak because of the weakened AL.
Figure 5 shows the distribution of AR frequency over the North Pacific during the AL’s eight phases. The numerical value in Figure 5 is actual value of the AR frequency (not the anomaly). Thus, there is no negative value in Figure 5. The blue contour in Figure 5 means a climatological winter AR frequency of 30%, indicating the AR’s climatological main body region. From phases one to three, the AR frequency increases dramatically in its main body region. In phase three, the AR frequency in its main body region is larger than 40% (namely, larger than the climatological value). The region with 40% AR frequency stretches northeastward toward the western coastal region of North America, and even occupies the region of the Gulf of Alaska. The above enhancement of AR frequency is consistent with the strengthened AL and enhanced IVT over the same region. After phase four, the AR frequency decreases dramatically in its main body region. It enters its weakest stage during phase seven. The AR frequency in its main body region is robustly smaller than 30% in phase seven (namely, smaller than the climatological value). There is a slightly increased AR frequency north of 40° N over the basin region in phase seven (Figure 5g), which is due to the occurrence of poleward transport in this stage (Figure 4g). An AR judgment of Formula (2) has no threshold requirements for IVT or integrated water vapor (IWV). Therefore, more ARs might be detected in this study, especially over mid–high latitudes.
Composite fields of IVT and ∇⋅ IVT in phases three and seven for group AR days and non-AR days are illustrated in Figure 6. More intensive moisture transportation is seen for the AR day group than that for the non-AR day group, for both phases three and seven. For example, the IVT magnitude along 30° N over the mid-basin for the AR day group (Figure 6a) is about twice that for the non-AR day group (Figure 6c). Similarly, the IVT magnitude averaged over the northwestern North Pacific region for the AR day group (Figure 6a) is approximately two to three times larger than that of the non-AR day group (Figure 6c). For phase 7, the poleward transport is performed during the AR days (Figure 6b), but not on the non-AR days (Figure 6d). Regarding the moisture source and sink aspect, the moisture source over the western North Pacific is hoarded during non-AR days, while the moisture sinks over the northeastern North Pacific in phase three and those over the center basin in phase seven are converged during AR days.
Previous studies have demonstrated the huge contribution of the amount of IVT (∇⋅IVT) produced in AR-days to the total amount of IVT (∇⋅IVT) in the whole winter [7,8,20]. Figure 6 only highlights the intensity distribution of IVT for AR days and non-AR days. The quantitative contribution of IVT (∇⋅IVT) in AR days to the total amount of IVT (∇⋅IVT) for different phases is still not clear. To answer this question, we firstly calculate the accumulated amount of zonal component of IVT (denoted as IVT-X) that was performed on AR days in phase n for the 43 AL oscillation events for every grid cell. Secondly, the ratio of the accumulated amount of IVT-X performed on AR days to the total amount of IVT-X for total days in phase n for every grid cell is obtained. Similar processes are done for the meridional component of IVT (denoted as IVT-Y) and ∇⋅ IVT.
The above ratios are plotted in Figure 7 and Figure 8. It is observed that the accumulated amount of IVT-X (IVT-Y) during AR days is important mostly within AR’s main body region in phase three, which finishes 50–90% of the total amount of IVT-X (IVT-Y) for the total number of days in phase three (Figure 7a). The region with a ratio larger than one in Figure 7c,d denotes the occurrence of the opposite direction of an accumulated amount of IVT-Y between AR days and non-AR days. The accumulated amount of IVT-Y in AR days is northward, while it is slightly southward in the non-AR days, and is around the region of (160° E–160° W, 25° N–40° N) in phase three (Figure 7c). The poleward vapor transport in phase seven (Figure 4g) is mostly done during AR days (Figure 7d). Figure 8 shows that the moisture sink during AR days overwhelmingly dominates the pattern shown in Figure 4c,g.

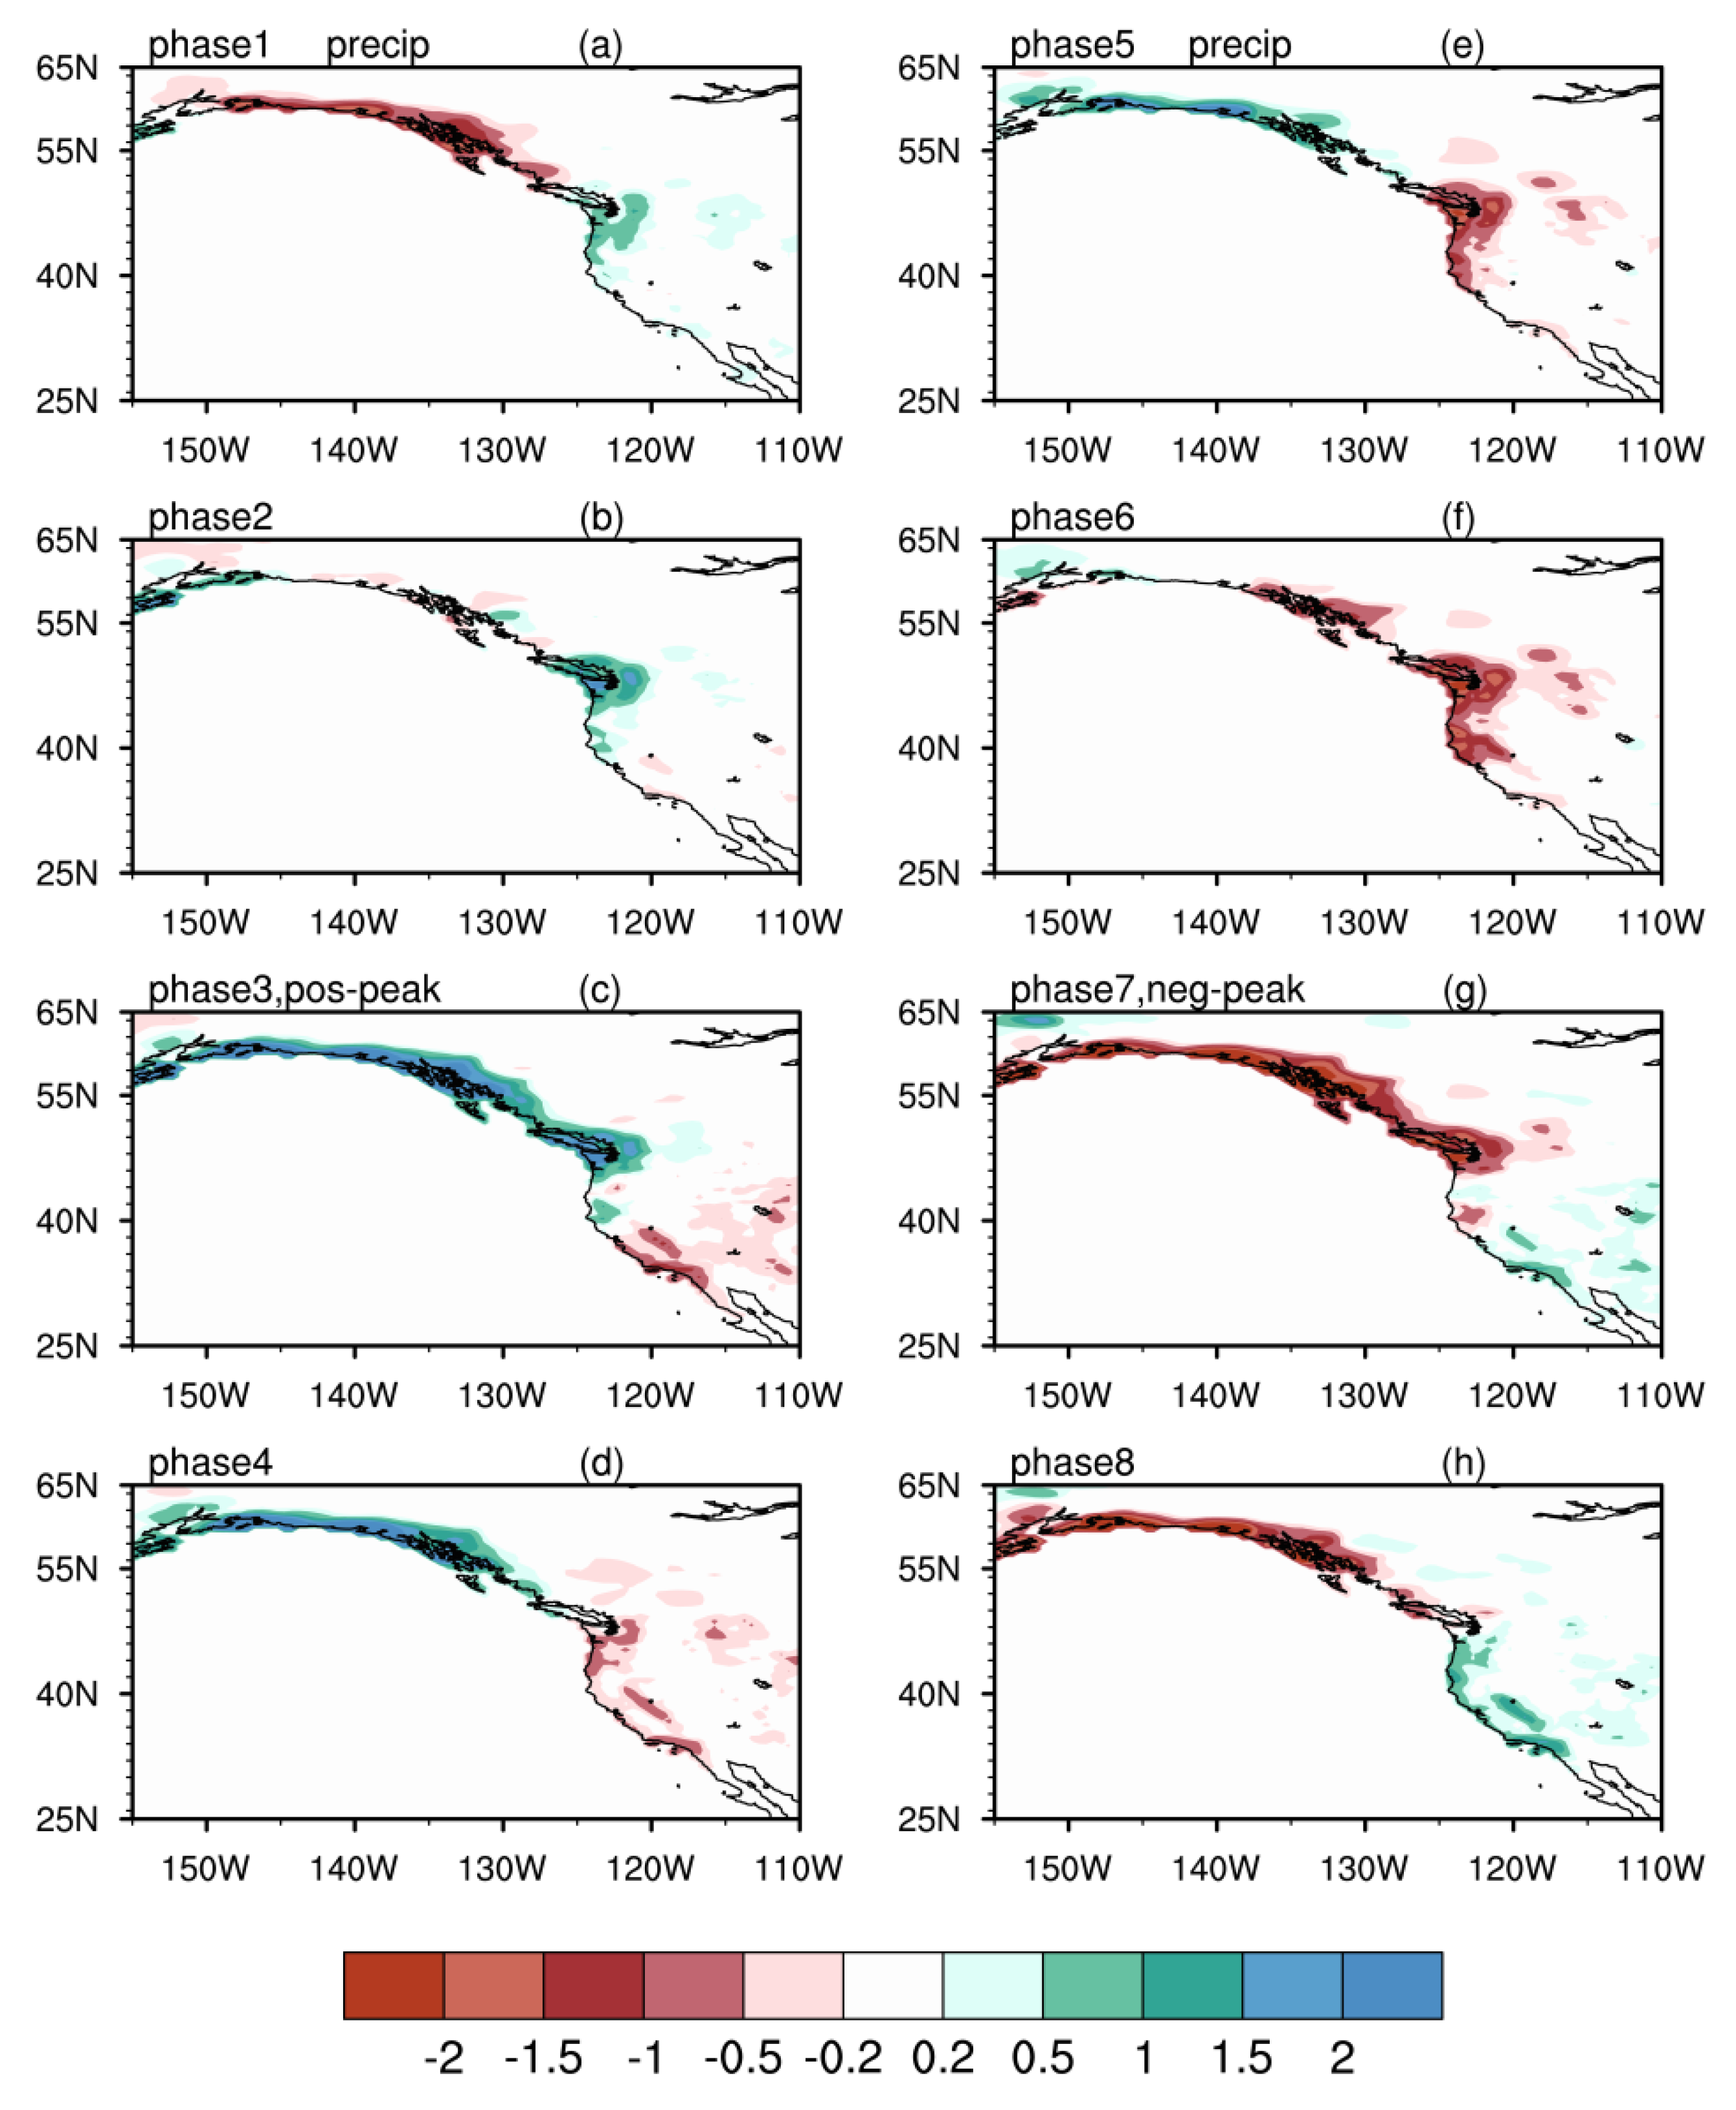
3.3. Precipitation Anomalies

Figure 9 depicts the composite fields of precipitation anomalies over northwestern North America for AL’s eight phases. Over the coastal region of northwestern North America, a positive anomaly in precipitation is seen in phases three and four. It gradually fades away in phase five, and shifts to a negative one in phase seven. The cause of the above opposite pattern in precipitation between phases three and seven can be attributed to the changes of moisture transport and AR frequency between these two phases. Figure 10 plots differences between phases three and seven for moisture transport and its convergence difference, as well as AR frequency. Compared to those in phase seven, more moisture transports towards the coastal region north of 40° N, and a larger AR frequency occurs over the northeastern North Pacific region in phase three. Thus, more moisture converges over the northwest coastal region, leading to more precipitation over the coastal region of northwestern North America in phase 3.

4. Discussion and Conclusions

4.1. Discussion

The present study demonstrates the changes of IVT and ARs accompanied by the intraseasonal variation of AL. However, the cause of the intraseasonal variation of AL is still not clear. Previous studies have shown that, as a dominant mode of tropical intraseasonal variability, the MJO has a remote impact on the large-scale circulation over the pan-North Pacific region [28,31] and the landfalling ARs over the west coast of North America [29]. In addition, in phase three, a negative anomaly in precipitation is seen over southeast China and southern Japan (figure omitted), while a positive one is observed over the coastal region of northwestern North America (Figure 9c). In phase seven, an opposite pattern of positive precipitation over southeast China (figure omitted) and negative one over the coastal region of northwestern North America appears (Figure 9g). Previous study has suggested that the precipitation over southeast China is influenced by the MJO [32]. Therefore, the issue about the relationship between the MJO and intraseasonal variations of AL and their climate effects needs to be addressed in future study.
The results about ARs are sensitive to the AR criteria [20,25]. We also use integrated water vapor (IWV, IWV = 1 g P t P s q d p ) to detect ARs according to Formula (2). Figure 11 plots the composite AR frequency for phases three and seven by the IWV method. Comparatively, the IWV method produces slightly more ARs than the IVT method, especially over the northwestern North Pacific region. We have no geometry requirement (e.g., length and width) or threshold requirement for the IVT (IWV) by which to judge the AR. Thus, slightly more AR may be detected in the present study.

4.2. Conclusions

This study investigates the intraseasonal variation of AL, and the accompanied atmospheric water vapor transport and ARs over the North Pacific during winters of 1979–2014. The daily data are filtered using a 20 to 80-day band-pass filter to obtain the intraseasonal signal. The AL index regarding the intraseasonal time scale is defined by the area average of the filtered MSLP anomaly over the region of (160° E–140° W, 30–65° N) for the winters (December, January, and February) of 1979–2014 (36 × 90 = 3240 days in total). The above AL index has a peak period of 40 days. We identified 43 AL’s intraseasonal oscillation events. Each event exhibits the AL’s intensity variation on an intraseaonal time scale. We divided each event into eight phases. The AL gets its strongest in phase three and weakest in phase seven.
During the AL’s intraseasonal life cycle, the IVT over the North Pacific region shows cyclonic transports for all the phases. However, the magnitude and direction are different between AL’s strengthening stage and its weakened stage. During the AL’s strengthening stage, the eastward water vapor transport is seen to the west of 150° W between 25° N–40° N. Poleward transport is dominant over the northeastern North Pacific region. During the AL’s weakening stage, the eastward transport is weakened and contracts to the west of the dateline. The poleward transport is only seen over the center basin. During the AL’s intraseasonal life cycle, AR frequency also demonstrates intraseasonal changes. AR frequency firstly increases then decreases over its climatological mean body region over the North Pacific. In phase three, the AR frequency in its climatological main body region is about 40–60% (which is larger than the climatological value of 30%). In phase seven, it is only about 20%. The IVT magnitude of the AR day group is markedly stronger than that of the non-AR day group for both phases three and seven.
During the AL’s intraseasonal life cycle, the divergence field of IVT shows broad areas of moisture sources within the subtropics and western North Pacific, and sinks over the northeastern North Pacific, including the west coast of North America, and the center basin. We divided the total composition into AR days and non-AR days for every phase. The results show that a moisture source over the western North Pacific is formed during non-AR days, while the moisture sinks over the northeastern North Pacific (the west coast of North America) in phase three and the center basin in phase seven are fuelled during AR days. During the AL’s intraseasonal life cycle, the anomalies in precipitation also display an intraseasonal fluctuation. In phase three, a positive precipitation is observed over the coastal region of northwestern North America. In phase seven, an opposite pattern of negative one over the coastal region of northwestern North America appears. It is suggested that the intraseasonal variation of Aleutian Low can modulate precipitation anomalies over the west coast of North America through moisture transport and AR frequency.

Author Contributions

Y.X., Q.C., and X.R. processed raw data, conducted analysis and made figures. X.R. and Y.X. wrote the paper.

Funding

This work was jointly supported by National Key R&D Program of China (Grant No. 2018YFC1505903), and National Natural Science Foundation of China (Grant Nos. 41621005, 41675067 and 41330420).

Acknowledgments

We thank the reviewers for their careful review of our manuscript and for many valuable comments and suggestions. The ERA-Interim daily and monthly data is downloaded from http://apps.ecmwf.int/datasets/.

Conflicts of Interest

The authors declare no conflict of interest.

References

  1. Hartmann, B.; Wendler, G. The significance of the 1976 Pacific climate shift in the climatology of Alaska. J. Clim. 2005, 18, 4824–4839. [Google Scholar] [CrossRef]
  2. Sugimoto, S.; Hanawa, K. Decadal and interdecadal variations of the Aleutian Low activity and their relation to upper oceanic variations over the North Pacific. J. Meteor. Soc. Jpn. 2009, 87, 601–614. [Google Scholar] [CrossRef]
  3. Rodionov, S.N.; Overland, J.E.; Bond, N.A. The Aleutian Low and winter climate conditions in the Bering Sea. Part I: Classification. J. Clim. 2005, 18, 160–177. [Google Scholar] [CrossRef]
  4. Compo, G.P.; Sardeshmukh, P.D.; Penland, C. Changes of subseasonal variability associated with El Nino. J. Clim. 2001, 14, 3356–3374. [Google Scholar] [CrossRef]
  5. Ren, X.; Yang, X.-Q.; Hu, H. Subseasonal Variations of Wintertime North Pacific Evaporation, Cold Air Surges and Water Vapor Transport. J. Clim. 2017, 30, 9475–9491. [Google Scholar] [CrossRef]
  6. Chen, T.-C.; Huang, W.-R.; Takle, E.-S. Annual Variation of Midlatitude Precipitation. J. Clim. 2004, 17, 4291–4298. [Google Scholar] [CrossRef] [Green Version]
  7. Newman, M.; Kiladis, G.N.; Weickmann, K.M.; Ralph, F.M.; Sardeshmukh, P.D. Relative contributions of synoptic and low-frequency eddies to time-mean atmospheric moisture transport, including the role of atmospheric rivers. J. Clim. 2012, 25, 7341–7360. [Google Scholar] [CrossRef]
  8. Liu, X.; Ren, X.; Yang, X.-Q. Decadal Changes of Multi-scale Water Vapor Transport and Atmospheric River Associated with the Pacific Decadal Oscillation and the North Pacific Gyre Oscillation. J. Hydrometeorol. 2016, 17, 273–286. [Google Scholar] [CrossRef]
  9. Newell, R.E.; Newell, N.E.; Zhu, Y.; Scott, C. Tropospheric rivers?—A pilot study. Geophys. Res. Lett. 1992, 19, 2401–2404. [Google Scholar] [CrossRef]
  10. Zhu, Y.; Newell, R.E. Atmospheric rivers and bombs. Geophys. Res. Lett. 1994, 21, 1999–2002. [Google Scholar] [CrossRef]
  11. Zhu, Y.; Newell, R.E. A proposed algorithm for moisture fluxes from atmospheric rivers. Mon. Wea. Rev. 1998, 126, 725–735. [Google Scholar] [CrossRef]
  12. Ralph, F.M.; Neiman, P.J.; Wick, G.A.; Gutman, S.I.; Dettinger, M.D.; Cayan, D.R.; White, A.B. Flooding on California’s Russian River: Role of atmospheric rivers. Geophys. Res. Lett. 2006, 33, L13801. [Google Scholar] [CrossRef]
  13. Neiman, P.J.; Ralph, F.M.; Wick, G.A.; Lundquist, J.D.; Dettinger, M.D. Meteorological characteristics and overland precipitation impacts of atmospheric rivers affecting the west coast of North America based on eight years of SSM/I satellite observations. J. Hydrometeorol. 2008, 9, 22–47. [Google Scholar] [CrossRef]
  14. Jiang, T.Y.; Deng, Y. Downstream modulation of North Pacific atmospheric river activity by East Asian cold surges. Geophys. Res. Lett. 2011, 38, L20807. [Google Scholar] [CrossRef]
  15. Kim, J.; Waliser, D.E.; Neiman, P.J.; Guan, B.; Ryoo, J.-M.; Wick, G.A. Effects of atmospheric river landfalls on the cold season precipitation in California. Clim. Dyn. 2013, 40, 465–474. [Google Scholar] [CrossRef]
  16. Kamae, Y.; Wei, W.; Xie, S.-P.; Naoi, M.; Ueda, H. Atmospheric rivers over the Northwestern Pacific: Climatology and interannual variability. J. Clim. 2017, 30, 5605–5619. [Google Scholar] [CrossRef] [Green Version]
  17. Leung, L.R.; Qian, Y. Atmospheric rivers induced heavy precipitation and flooding in the western U.S. simulated by the WRF regional climate model. Geophys. Res. Lett. 2009, 36, L03820. [Google Scholar] [CrossRef]
  18. Neiman, P.J.; Schick, L.J.; Ralph, F.M.; Hughes, M.; Wick, G.A. Flooding in western Washington: The connection to atmospheric rivers. J. Hydrometeorol. 2011, 12, 1337–1358. [Google Scholar] [CrossRef]
  19. Dong, L.; Leung, L.R.; Song, F.F.; Lu, J. Roles of SST versus internal atmospheric variability in winter extreme precipitation along the U.S. West Coast. J. Clim. 2018, 31, 8039–8058. [Google Scholar] [CrossRef]
  20. Guan, B.; Waliser, D.E. Detection of atmospheric rivers: Evaluation and application of an algorithm for global studies. J. Geophys. Res. Atmos. 2015, 120, 12514–12535. [Google Scholar] [CrossRef]
  21. Brands, S.; Gutiérrez, J.M.; San-Martín, D. Twentieth-century atmospheric river activity along the west coasts of Europe and North America: Algorithm formulation, reanalysis uncertainty and links to atmospheric circulation patterns. Clim. Dyn. 2017, 48, 2771–2795. [Google Scholar] [CrossRef]
  22. Kim, H.-M.; Zhou, Y.; Alexander, M.A. Changes in atmospheric rivers and moisture transport over the Northeast Pacific and western North America in response to ENSO diversity. Clim. Dyn. 2017. [Google Scholar] [CrossRef]
  23. Dee, D.P.; Uppala, S.M.; Simmons, A.J.; Berrisford, P.; Poli, P.; Kobayashi, S.; Andrae, U.; Balmaseda, M.A.; Balsamo, G.; Bauer, P.; et al. The ERA-Interim Reanalysis: Configuration and performance of the data assimilation system. Quart. J. R. Meteorol. Soc. 2011, 137, 553–597. [Google Scholar] [CrossRef]
  24. Chen, M.; Shi, W.; Xie, P.; Silva, V.B.; Kousky, V.E.; Wayne Higgins, R.; Janowiak, J.E. Assessing objective techniques for gauge-based analyses of global daily precipitation. J. Geophys. Res. 2008, 113, D04110. [Google Scholar] [CrossRef]
  25. Shields, C.A.; Rutz, J.J.; Leung, L.Y.; Ralph, F.M.; Wehner, M.; Kawzenuk, B.; Lora, J.M.; McClenny, E.; Osborne, T.; Payne, A.E.; et al. Atmospheric River Tracking Method Intercomparison Project (ARTMIP): Project goals and experimental design. Geosci. Model Dev. 2018, 11, 2455–2474. [Google Scholar] [CrossRef]
  26. Murakami, M. Large-scale aspects of deep convective activity over the GATE area. Mon. Wea. Rev. 1979, 107, 994–1013. [Google Scholar] [CrossRef]
  27. Trenberth, K.E.; Hurrell, J.W. Decadal atmosphere-ocean variations in the Pacific. Clim. Dyn. 1994, 9, 303–319. [Google Scholar] [CrossRef]
  28. Zhou, S.; L’Heureux, M.; Weaver, S.; Kumar, A. A composite study of the MJO influence on the surface air temperature and precipitation over the Continental United States. Clim. Dyn. 2012, 38, 1459–1471. [Google Scholar] [CrossRef]
  29. Guan, B.; Waliser, D.E.; Molotch, N.P.; Fetzer, E.J.; Neiman, P.J. Does the Madden-Julian oscillation influence wintertime atmospheric rivers and snowpack in the Sierra Nevada? Mon. Weather Rev. 2012, 140, 325–342. [Google Scholar] [CrossRef]
  30. Lee, J.-Y.; Wang, B.; Wheeler, M.C. Real-time multivariate indices for the boreal summer intraseasonal oscillation over the Asian summer monsoon region. Clim. Dyn. 2013, 40, 493–509. [Google Scholar] [CrossRef]
  31. Zheng, C.; Chang, E.K.-M.; Kim, H.-M.; Zhang, M.; Wang, W. Impacts of the Madden–Julian Oscillation on Storm-Track Activity, Surface Air Temperature, and Precipitation over North America. J. Clim. 2018, 31, 6113–6134. [Google Scholar] [CrossRef]
  32. Yao, Y.; Lin, H.; Wu, Q. Subseasonal variability of precipitation in China during boreal winter. J. Clim. 2015, 28, 6548–6559. [Google Scholar] [CrossRef]
Figure 1. Climatological field of the mean sea level pressure (MSLP, shaded; hPa) and 20 to 80-day standard deviations of MSLP (contour; hPa) during winters of 1979–2014. The red box (160° E–140° W, 30–65° N) denotes the area for the definition of the Aleutian Low index on a 20 to 80-day time scale.
Atmosphere 10 00049 g001
Figure 2. (a) Time series of daily MSLP for the region over 160° E–140° W, 30–65° N (box in Figure 1) (purple dotted line, in hPa) and the Aleutian Low index (ALI) on a 20 to 80-day time-scale (ALI, red line) for the winter of 2007. The black dots and blue line indicate the beginning and end of an identified event. (b) A diagram showing eight phase points for composition. (c) Averaged power spectra of ALI in winters between 1979–2014 and (dg) in four individual winters (1986, 1996, 2007, and 2012). The dotted lines in (cg) are the spectrum of 95% confidence level.
Atmosphere 10 00049 g002
Figure 3. Life cycle composite of MSLP anomaly based on ALI in eight phases (hPa). Green contours in Figure 3c,g denote a significant area at the 95% confidence level. (a) to (h) corresponsing to phases 1 to 8.
Atmosphere 10 00049 g003
Figure 4. Life cycle composite of integrated water vapor transport (IVT, vector; kg m−1 s−1) and its divergence (∇⋅ IVT, shaded areas; kg m−2 d−1) based on ALI in eight phases. (a) to (h) corresponding to phases 1 to 8.
Atmosphere 10 00049 g004
Figure 5. As in Figure 4, but for atmospheric river (AR) frequency (%). Blue contours indicate the climatological winter AR frequency of 30%. (a) to (h) corresponding to phases 1 to 8.
Atmosphere 10 00049 g005
Figure 6. Composite fields of IVT (vector; kg m−1 s−1) and ∇⋅ IVT (shaded areas; kg m−2 d−1) in phases three (a,c) and seven (b,d) for group AR days (a,b) and non-AR days (c,d). Only the fields with AR frequency exceeding 10% are shown in (a) and (b).
Atmosphere 10 00049 g006
Figure 7. Upper panel: composite fields of ratio of the zonal component of IVT (IVT-X) for the group of AR days to IVT-X for total days. Lower panel: composite fields of ratio of the meridional component of IVT (IVT-Y) for the group of AR days to IVT-Y for total days. (a) and (c) for phase three, and (b) and (d) for phase seven. Blue contours indicate the AR frequency of 30% and 50% in their individual phases.
Atmosphere 10 00049 g007
Figure 8. As in Figure 7, but for ∇⋅ IVT.
Atmosphere 10 00049 g008
Figure 9. As in Figure 3, but for precipitation anomalies (mm day−1) over northwestern North America. (a) to (h) corresponding to phases 1 to 8.
Atmosphere 10 00049 g009
Figure 10. (a) Moisture transport (vector; kg m−1 s−1) and its convergence (shaded areas; kg m−2 d−1) difference between phases three and seven. (b) AR frequency (%) difference between phases three and seven.
Atmosphere 10 00049 g010
Figure 11. As in Figure 5c,g, but for the integrated water vapor (IWV) method.
Atmosphere 10 00049 g011

