Influence of Boreal Winter Intraseasonal Variation of Aleutian Low on Water Vapor Transport and Atmospheric Rivers
Abstract
1. Introduction
2. Data and Methods
2.1. Data
2.2. Calculation of Integrated Water Vapor Transport and AR Frequency
2.3. Definition of AL Index on Intraseasonal Time-Scale (ALI)
3. Results
3.1. Intraseasonal Variation of AL
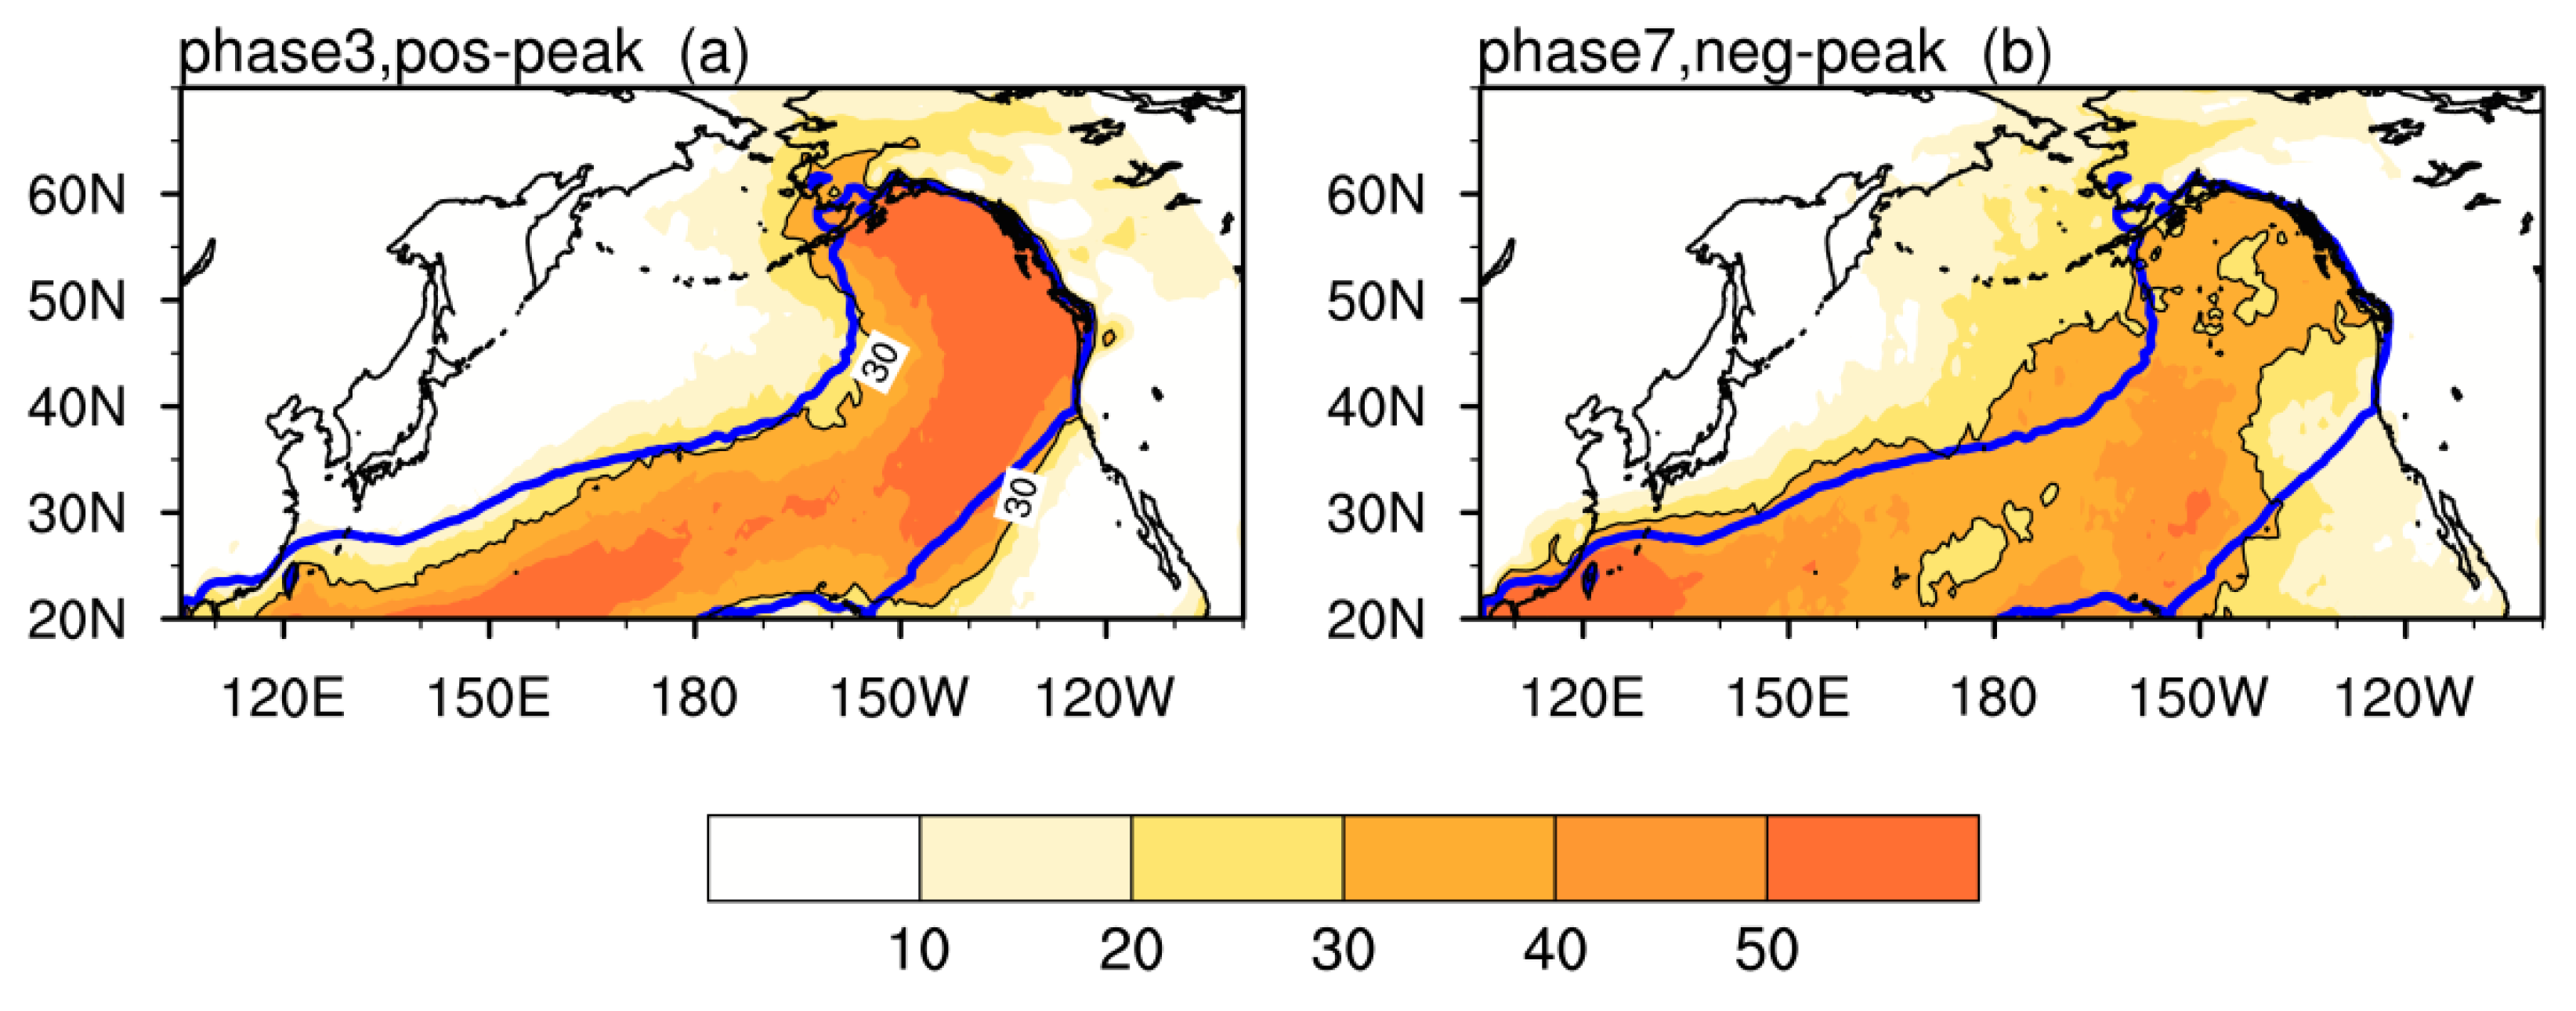
3.2. IVT and AR Changes Associated with the Intraseasonal Variation of AL
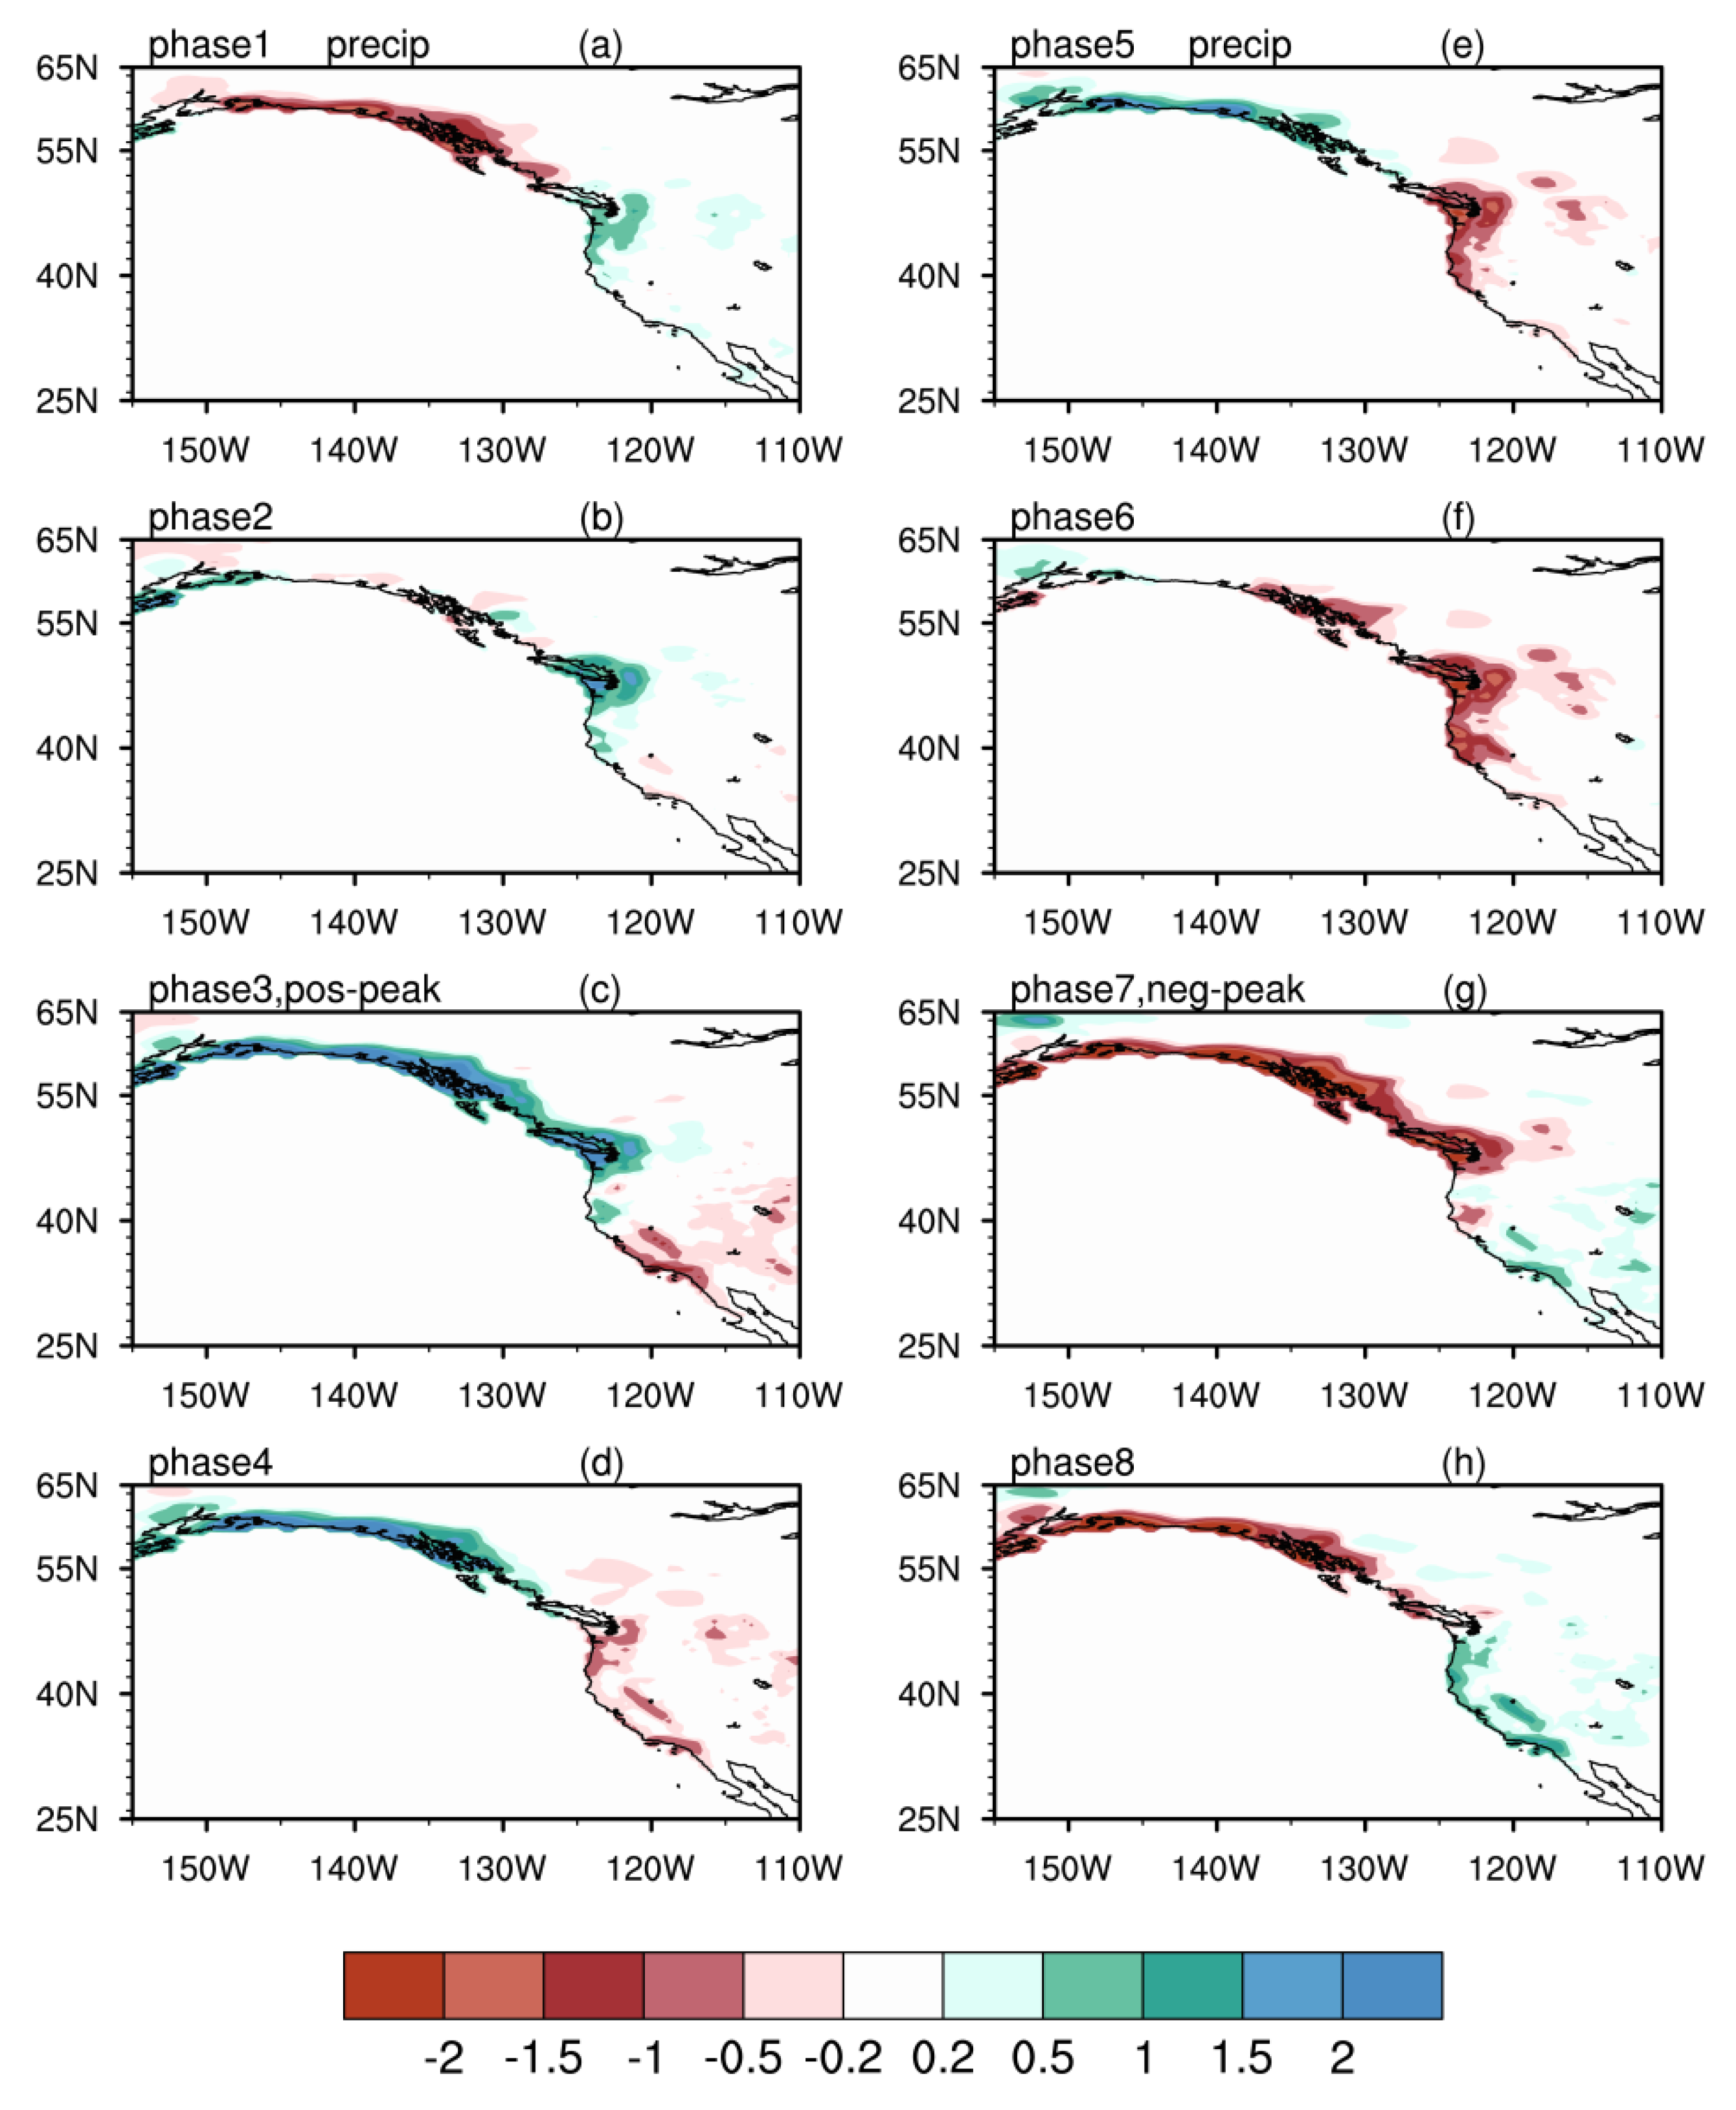
3.3. Precipitation Anomalies
4. Discussion and Conclusions
4.1. Discussion
4.2. Conclusions
Author Contributions
Funding
Acknowledgments
Conflicts of Interest
References
- Hartmann, B.; Wendler, G. The significance of the 1976 Pacific climate shift in the climatology of Alaska. J. Clim. 2005, 18, 4824–4839. [Google Scholar] [CrossRef]
- Sugimoto, S.; Hanawa, K. Decadal and interdecadal variations of the Aleutian Low activity and their relation to upper oceanic variations over the North Pacific. J. Meteor. Soc. Jpn. 2009, 87, 601–614. [Google Scholar] [CrossRef]
- Rodionov, S.N.; Overland, J.E.; Bond, N.A. The Aleutian Low and winter climate conditions in the Bering Sea. Part I: Classification. J. Clim. 2005, 18, 160–177. [Google Scholar] [CrossRef]
- Compo, G.P.; Sardeshmukh, P.D.; Penland, C. Changes of subseasonal variability associated with El Nino. J. Clim. 2001, 14, 3356–3374. [Google Scholar] [CrossRef]
- Ren, X.; Yang, X.-Q.; Hu, H. Subseasonal Variations of Wintertime North Pacific Evaporation, Cold Air Surges and Water Vapor Transport. J. Clim. 2017, 30, 9475–9491. [Google Scholar] [CrossRef]
- Chen, T.-C.; Huang, W.-R.; Takle, E.-S. Annual Variation of Midlatitude Precipitation. J. Clim. 2004, 17, 4291–4298. [Google Scholar] [CrossRef]
- Newman, M.; Kiladis, G.N.; Weickmann, K.M.; Ralph, F.M.; Sardeshmukh, P.D. Relative contributions of synoptic and low-frequency eddies to time-mean atmospheric moisture transport, including the role of atmospheric rivers. J. Clim. 2012, 25, 7341–7360. [Google Scholar] [CrossRef]
- Liu, X.; Ren, X.; Yang, X.-Q. Decadal Changes of Multi-scale Water Vapor Transport and Atmospheric River Associated with the Pacific Decadal Oscillation and the North Pacific Gyre Oscillation. J. Hydrometeorol. 2016, 17, 273–286. [Google Scholar] [CrossRef]
- Newell, R.E.; Newell, N.E.; Zhu, Y.; Scott, C. Tropospheric rivers?—A pilot study. Geophys. Res. Lett. 1992, 19, 2401–2404. [Google Scholar] [CrossRef]
- Zhu, Y.; Newell, R.E. Atmospheric rivers and bombs. Geophys. Res. Lett. 1994, 21, 1999–2002. [Google Scholar] [CrossRef]
- Zhu, Y.; Newell, R.E. A proposed algorithm for moisture fluxes from atmospheric rivers. Mon. Wea. Rev. 1998, 126, 725–735. [Google Scholar] [CrossRef]
- Ralph, F.M.; Neiman, P.J.; Wick, G.A.; Gutman, S.I.; Dettinger, M.D.; Cayan, D.R.; White, A.B. Flooding on California’s Russian River: Role of atmospheric rivers. Geophys. Res. Lett. 2006, 33, L13801. [Google Scholar] [CrossRef]
- Neiman, P.J.; Ralph, F.M.; Wick, G.A.; Lundquist, J.D.; Dettinger, M.D. Meteorological characteristics and overland precipitation impacts of atmospheric rivers affecting the west coast of North America based on eight years of SSM/I satellite observations. J. Hydrometeorol. 2008, 9, 22–47. [Google Scholar] [CrossRef]
- Jiang, T.Y.; Deng, Y. Downstream modulation of North Pacific atmospheric river activity by East Asian cold surges. Geophys. Res. Lett. 2011, 38, L20807. [Google Scholar] [CrossRef]
- Kim, J.; Waliser, D.E.; Neiman, P.J.; Guan, B.; Ryoo, J.-M.; Wick, G.A. Effects of atmospheric river landfalls on the cold season precipitation in California. Clim. Dyn. 2013, 40, 465–474. [Google Scholar] [CrossRef]
- Kamae, Y.; Wei, W.; Xie, S.-P.; Naoi, M.; Ueda, H. Atmospheric rivers over the Northwestern Pacific: Climatology and interannual variability. J. Clim. 2017, 30, 5605–5619. [Google Scholar] [CrossRef]
- Leung, L.R.; Qian, Y. Atmospheric rivers induced heavy precipitation and flooding in the western U.S. simulated by the WRF regional climate model. Geophys. Res. Lett. 2009, 36, L03820. [Google Scholar] [CrossRef]
- Neiman, P.J.; Schick, L.J.; Ralph, F.M.; Hughes, M.; Wick, G.A. Flooding in western Washington: The connection to atmospheric rivers. J. Hydrometeorol. 2011, 12, 1337–1358. [Google Scholar] [CrossRef]
- Dong, L.; Leung, L.R.; Song, F.F.; Lu, J. Roles of SST versus internal atmospheric variability in winter extreme precipitation along the U.S. West Coast. J. Clim. 2018, 31, 8039–8058. [Google Scholar] [CrossRef]
- Guan, B.; Waliser, D.E. Detection of atmospheric rivers: Evaluation and application of an algorithm for global studies. J. Geophys. Res. Atmos. 2015, 120, 12514–12535. [Google Scholar] [CrossRef]
- Brands, S.; Gutiérrez, J.M.; San-Martín, D. Twentieth-century atmospheric river activity along the west coasts of Europe and North America: Algorithm formulation, reanalysis uncertainty and links to atmospheric circulation patterns. Clim. Dyn. 2017, 48, 2771–2795. [Google Scholar] [CrossRef]
- Kim, H.-M.; Zhou, Y.; Alexander, M.A. Changes in atmospheric rivers and moisture transport over the Northeast Pacific and western North America in response to ENSO diversity. Clim. Dyn. 2017. [Google Scholar] [CrossRef]
- Dee, D.P.; Uppala, S.M.; Simmons, A.J.; Berrisford, P.; Poli, P.; Kobayashi, S.; Andrae, U.; Balmaseda, M.A.; Balsamo, G.; Bauer, P.; et al. The ERA-Interim Reanalysis: Configuration and performance of the data assimilation system. Quart. J. R. Meteorol. Soc. 2011, 137, 553–597. [Google Scholar] [CrossRef]
- Chen, M.; Shi, W.; Xie, P.; Silva, V.B.; Kousky, V.E.; Wayne Higgins, R.; Janowiak, J.E. Assessing objective techniques for gauge-based analyses of global daily precipitation. J. Geophys. Res. 2008, 113, D04110. [Google Scholar] [CrossRef]
- Shields, C.A.; Rutz, J.J.; Leung, L.Y.; Ralph, F.M.; Wehner, M.; Kawzenuk, B.; Lora, J.M.; McClenny, E.; Osborne, T.; Payne, A.E.; et al. Atmospheric River Tracking Method Intercomparison Project (ARTMIP): Project goals and experimental design. Geosci. Model Dev. 2018, 11, 2455–2474. [Google Scholar] [CrossRef]
- Murakami, M. Large-scale aspects of deep convective activity over the GATE area. Mon. Wea. Rev. 1979, 107, 994–1013. [Google Scholar] [CrossRef]
- Trenberth, K.E.; Hurrell, J.W. Decadal atmosphere-ocean variations in the Pacific. Clim. Dyn. 1994, 9, 303–319. [Google Scholar] [CrossRef]
- Zhou, S.; L’Heureux, M.; Weaver, S.; Kumar, A. A composite study of the MJO influence on the surface air temperature and precipitation over the Continental United States. Clim. Dyn. 2012, 38, 1459–1471. [Google Scholar] [CrossRef]
- Guan, B.; Waliser, D.E.; Molotch, N.P.; Fetzer, E.J.; Neiman, P.J. Does the Madden-Julian oscillation influence wintertime atmospheric rivers and snowpack in the Sierra Nevada? Mon. Weather Rev. 2012, 140, 325–342. [Google Scholar] [CrossRef]
- Lee, J.-Y.; Wang, B.; Wheeler, M.C. Real-time multivariate indices for the boreal summer intraseasonal oscillation over the Asian summer monsoon region. Clim. Dyn. 2013, 40, 493–509. [Google Scholar] [CrossRef]
- Zheng, C.; Chang, E.K.-M.; Kim, H.-M.; Zhang, M.; Wang, W. Impacts of the Madden–Julian Oscillation on Storm-Track Activity, Surface Air Temperature, and Precipitation over North America. J. Clim. 2018, 31, 6113–6134. [Google Scholar] [CrossRef]
- Yao, Y.; Lin, H.; Wu, Q. Subseasonal variability of precipitation in China during boreal winter. J. Clim. 2015, 28, 6548–6559. [Google Scholar] [CrossRef]

© 2019 by the authors. Licensee MDPI, Basel, Switzerland. This article is an open access article distributed under the terms and conditions of the Creative Commons Attribution (CC BY) license (http://creativecommons.org/licenses/by/4.0/).
Share and Cite
Xiong, Y.; Chen, Q.; Ren, X. Influence of Boreal Winter Intraseasonal Variation of Aleutian Low on Water Vapor Transport and Atmospheric Rivers. Atmosphere 2019, 10, 49. https://doi.org/10.3390/atmos10020049
Xiong Y, Chen Q, Ren X. Influence of Boreal Winter Intraseasonal Variation of Aleutian Low on Water Vapor Transport and Atmospheric Rivers. Atmosphere. 2019; 10(2):49. https://doi.org/10.3390/atmos10020049
Chicago/Turabian StyleXiong, Yating, Qiuyu Chen, and Xuejuan Ren. 2019. "Influence of Boreal Winter Intraseasonal Variation of Aleutian Low on Water Vapor Transport and Atmospheric Rivers" Atmosphere 10, no. 2: 49. https://doi.org/10.3390/atmos10020049
APA StyleXiong, Y., Chen, Q., & Ren, X. (2019). Influence of Boreal Winter Intraseasonal Variation of Aleutian Low on Water Vapor Transport and Atmospheric Rivers. Atmosphere, 10(2), 49. https://doi.org/10.3390/atmos10020049


