Article

Sub-Mode Aerosol Volume Size Distribution and Complex Refractive Index from the Three-Year Ground-Based Measurements in Chengdu China

1
State Environmental Protection Key Laboratory of Satellite Remote Sensing, Institute of Remote Sensing and Digital Earth, Chinese Academy of Sciences, Beijing 100101, China
2
University of Chinese Academy of Sciences, Beijing 100049, China
3
College of Resources and Environment, Chengdu University of Information Technology, Chengdu 610103, China
*
Author to whom correspondence should be addressed.
Atmosphere 2019, 10(2), 46; https://doi.org/10.3390/atmos10020046
Submission received: 9 January 2019 / Revised: 22 January 2019 / Accepted: 22 January 2019 / Published: 26 January 2019
(This article belongs to the Special Issue Lower Atmosphere Meteorology)

Abstract

:
Chengdu is a typical basin city of Southwest China with rare observations of remote sensing measurements. To assess the climate change and establish a region aerosol model, a deeper understanding of the separated volume size distribution (VSD) and complex refractive index (CRI) is required. In this study, we employed the sub-mode VSD and CRI in Chengdu based on the three years observation data to investigate the sub-mode characteristics and climate effects. The annual average fraction of the fine-mode aerosol optical depth (AODf) is 92%, which has the same monthly tendency as the total AOD. But the coarse-mode aerosol optical depth (AODc) has little variation in different months. There are four distinguishing modes of VSD in Chengdu; the median radii are 0.17 μm ± 0.05, 0.31 μm ± 0.12, 1.62 μm ± 0.45, 3.25 μm ± 0.99, respectively. The multi-year average and seasonal variations of fine- and coarse-mode VSD and CRI are also analyzed to characterize aerosols over this region. The fine-mode single scattering albedos (SSAs) are higher than the coarse-mode ones, which suggests that the coarse-mode aerosols have a stronger absorbing effect on solar light than the small-size aerosol particles in Chengdu.

1. Introduction

As one component of the terrestrial atmosphere, aerosol is an important factor in global climate change, with direct effects and indirect effects. Direct effects include changing the radiation balance of the Earth-atmosphere system by absorbing and scattering sunlight [1,2]. On the other hand, aerosol serves as cloud condensation nuclei (CCN) involved in cloud microphysics processes, referred to as indirect effects [3]. Moreover, as one major constituent of haze, aerosol particles endanger public health [4].
Chengdu, located in the central region of the Sichuan basin (Chengdu Plain) with a population of ~16 million (the resident population of Chengdu was counted in 2016), is the economic center and transportation hub in southwest China. Due to the special topography of the basin, the average wind speed is low [5,6]. Coupled with the development economy in Chengdu, a large amount of pollutants associated with regional industrial emissions are easy to accumulate. Abundant water vapor is conducive to the formation of aerosol particulates, which has made Chengdu become one of the regions in China with serious haze pollution [7,8,9,10]. The special topography and climate in Sichuan basin leads to a kind of wet, rainy and cloudy weather condition [11]. Therefore, it is difficult to obtain a large number of measurements through optical remote sensing observations in Chengdu. Sampling method of atmospheric particulates is one kind of Chengdu air pollution study [7,9,10,12], which fails to acquire the aerosol’s larger-scale spatial characteristics. The spatial characteristics of aerosols can be obtained by remote sensing, one kind of non-contact method [13,14,15]. For instance, some studies analyzed the spatial-temporal distribution of aerosol optical depth (AOD) in Sichuan basin using satellite remote sensing [16,17]. Besides, aerosol optical parameters obtained by the ground-based remote sensing observation were statistically analyzed in this area [18,19,20,21].
Although the above-mentioned research studies focus on the total-column aerosol properties by remote sensing methods, it still remains a big challenge to obtain the characteristics of sub-mode aerosol (fine- and coarse-mode) in Chengdu. The fine- and coarse-mode particles are related to the different sources and compositions. Fine-mode aerosols are mainly dominated by anthropogenic emissions and are related to the fog or low-altitude cloud dissipated events [22,23]. Coarse-mode particles are determined by the sea salt, dust and other natural sources. Therefore, the knowledge of aerosol sub-mode properties plays a role in the research on regional climate and the improvement of the aerosol model used in the satellite retrieval algorithms.
In this study, the sub-mode volume size distribution (VSD) and complex refractive index (CRI) in Chengdu area were investigated based on three years of measurements of the Sun-sky radiometer Observation NETwork (SONET). Section 2 presents the observation data and the method to separate VSD and CRI into sub mode (fine and coarse mode). Section 3 shows the seasonal characteristics of sub-mode VSD and CRI. The sub-mode optical properties (AOD, single scattering albedo (SSA)) and the climate effect of sub-mode aerosol in Chengdu are discussed in Section 4. The results are summarized in Section 5.

2. Data and Method

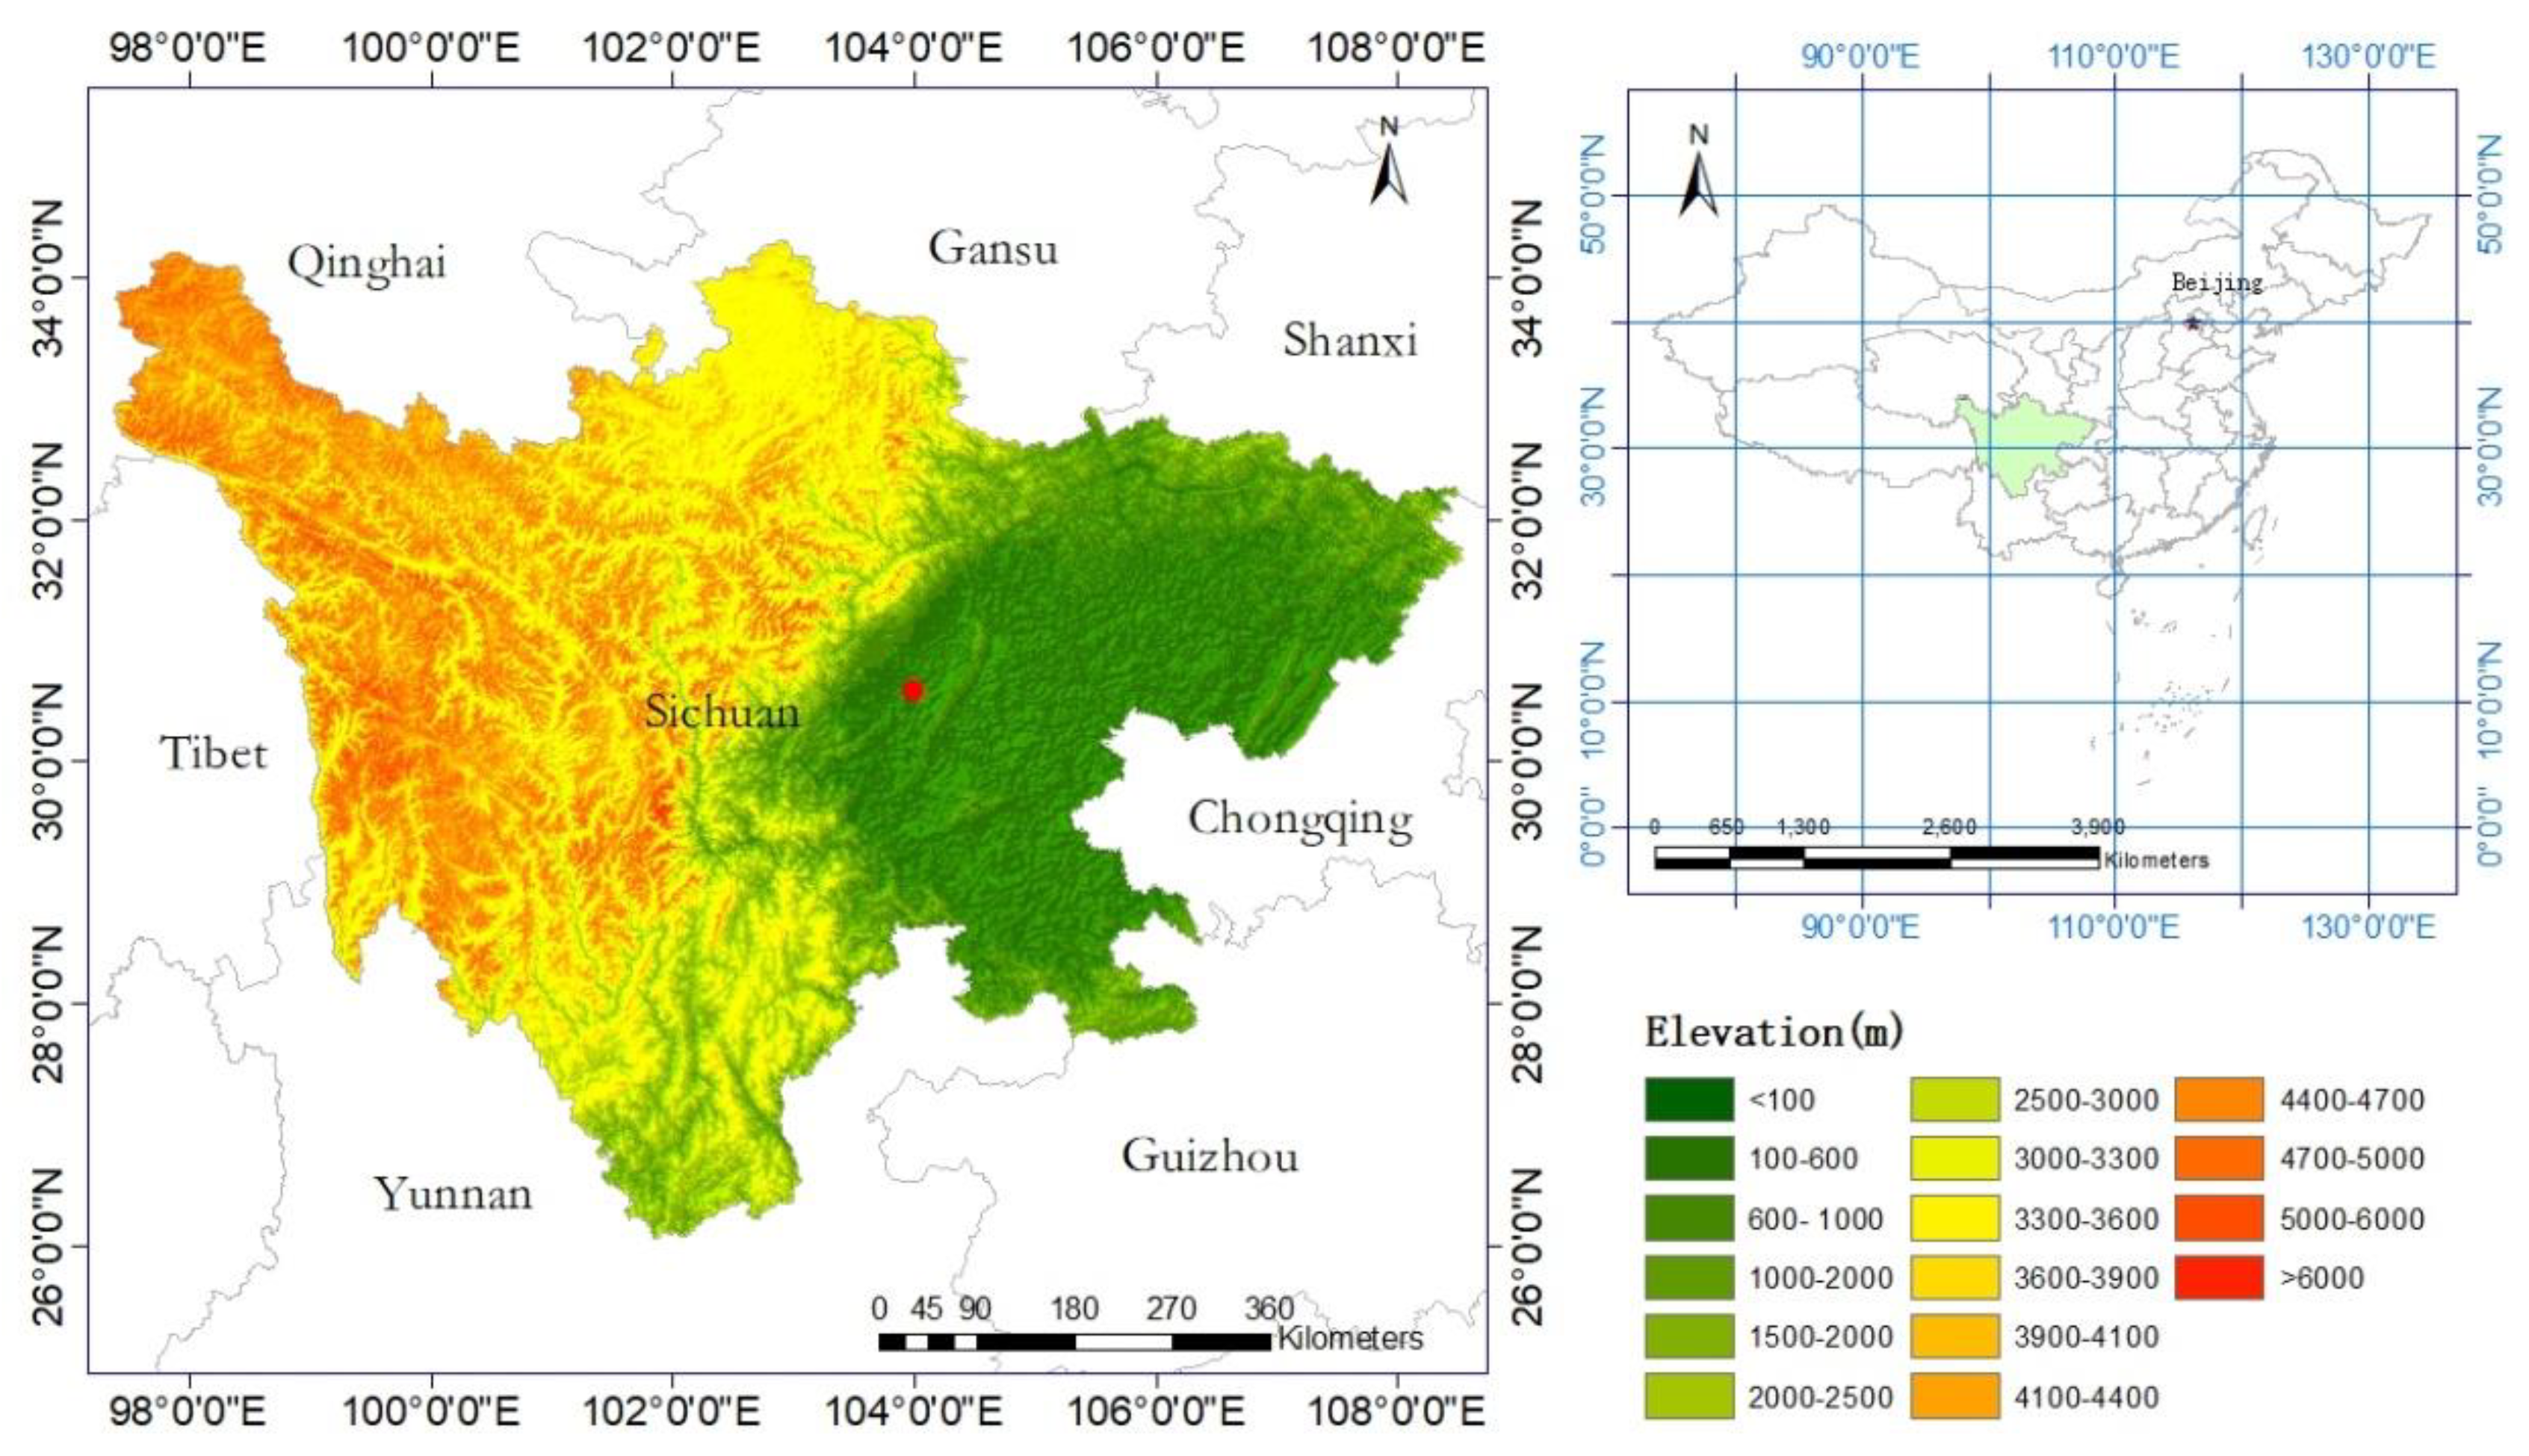
2.1. Observation Site and Data

SONET Chengdu site (Figure 1 red dot) is located in Chengdu, Sichuan province, a developing urban area. The CE318 (Cimel Electronique, Pairs France) is an automatic instrument for long-term continuous observation of direct solar radiation and diffused sky radiation in the Chengdu site with nine individual spectral channels: 340 nm, 380 nm, 440 nm, 500 nm, 675 nm, 870 nm, 1020 nm, 1640 nm and 940 nm. The parameters include AOD, Angstrom Exponent (AE), VSD, CRI and SSA, and so on [24,25,26]. To ensure data quality, SONET instruments are calibrated by a routine process of laboratory and field calibration experiments. The direct sun measurements are calibrated every year in a field, located on Ling Mountain (~1600 m, MSL), and compared with a master instrument that is regularly calibrated by Langley plot method with high precision [27,28]. For the calibration of sky radiance measurements, SONET adopts the method of vicarious/transfer calibration, which is different from the AErosol RObotic NETwork (AERONET) calibration method [29].
The accuracy assessment of SONET products is based on the Distributed Regional Aerosol Gridded Observational Network (DRAGON)–Korea–United States Air Quality Study (KORUS-AQ) 2016 campaign [30]. The aerosol optical and microphysical parameters were inverted by SONET and AERONET algorithm at the same time. The differences of two network products can reflect the accuracy and data acquisition of SONET products. It turned out that the Level 1.5 data amount of two kinds of products are all above 85%, and the average AOD difference between SONET and AERONET is 0.002 ± 0.0001, less than AERONET AOD uncertainty [28]. The VSD difference between SONET and AERONET is 1.5% ± 26% (radius range from 0.1 to 7 μm) and 18% ± 85% (radius more than 7 μm) [28]. The real part of CRI has a difference of 0.007 ± 0.04 from AERONET, and the imaginary part has a difference value of 18% ± 46%. The average difference on SSA is slightly higher, but other parameters are close to or less than AERONET normal uncertainties [28].
The products of SONET are graded into three level (Level 1.0, Level 1.5, Level 2.0), defined following the AERONET data level protocols of version 2.0. In detail, Level 1.0 is raw data calculated from measurement and calibration coefficient. The Level 1.5 is based on Level 1.0 with automatic cloud screening procedures [31]. Level 2.0 has the additional application of pre- and post-calibration coefficient and expert checking. This paper is based on Level 2.0 data of SONET Chengdu site from June 2013 to December 2016.

2.2. Method

In this paper, the sub-mode VSDs and CRIs were retrieved by the aerosol products [24,26], following by Zhang et al. (2016) and Zhang et al. (2017). The method developed by Cuesta et al. (2008) is employed to separate VSD into a single Log-Normal Modes (LNM). Each LNM parameters have three parameters: the modal concentration, geometric standard deviation and modal radius [32,33]. The sub-mode VSD can be modeled by the following function:
dV ( r ) dlnr = i = 1 m C i 2 π | ln σ i | exp [ 1 2 ( lnr lnr i ln σ i ) 2 ]
where C i   ( μ m 3 / μ m 2 ) is the volume modal concentration, r i ( μ m ) is the median radius, σ i is standard deviation, m is the total number of modes, dV/dlnr ( μ m 3 / μ m 2 ) is aerosol volume particle size distribution.
The modes of VSD with radius less than 1 μm can be considered as the fine mode and others belong to the coarse mode.
CRI can describe the scattering and absorption properties of atmospheric particulates. Most research analyzed aerosol total-columnar CRI, but fine- and coarse-mode particles are associated with different composition and source of pollution. So, in this study we recalculated the complex refractive indices for both of fine and coarse mode, following Zhang et al. (2017). For the calculation of the sub-mode CRI, we also choose the same radius limit (1 μm) as the sub-mode VSD. The separated results of CRI have their own fine and coarse modes in different wavelength as follow:
n f / c ( λ ) = n f / c   λ = 440,675,870,1020   nm
k f , c ( λ ) =   { k f , c   440      λ = 440   nm   k f , c    λ = 675,870,1020   nm
where n is real part of CRI, k is imaginary part of CRI, λ denotes the standard wavelengths of AERONET products, the subscripts f and c represent the fine and coarse modes, respectively.
The input parameters are the VSD, spectral AOD, and absorbing AOD. The initial guesses of sub-mode CRIs are from the inversion CRIs of measurements [34]. The effective CRIs are corresponding to each VSD bin, following the volume average rule [35]:
n ( r ) =   n f V f ( r ) + n c V c ( r ) V f ( r ) + V c ( r )
k ( λ , r ) =   k f V f ( r ) + k c V c ( r ) V f ( r ) + V c ( r )
Then the fine- and coarse-mode CRIs are found by iterative fitting of the input AODs and the calculated AODs by the CRIs (Equations (4) and (5)) and VSDs.
With regard to the test of error estimation, the error of real part of CRI is less than 0.046 and that of imaginary part is less than 0.003 in three typical modal (WS: water soluble, BB: biomass burning, DU: dust). As this algorithm applied to AERONET measurements, the total uncertainties are Δ n f / c = 0.11 , Δ k f / c = 78 % by considering all possible input of AERONET parameter errors together.

3. Results

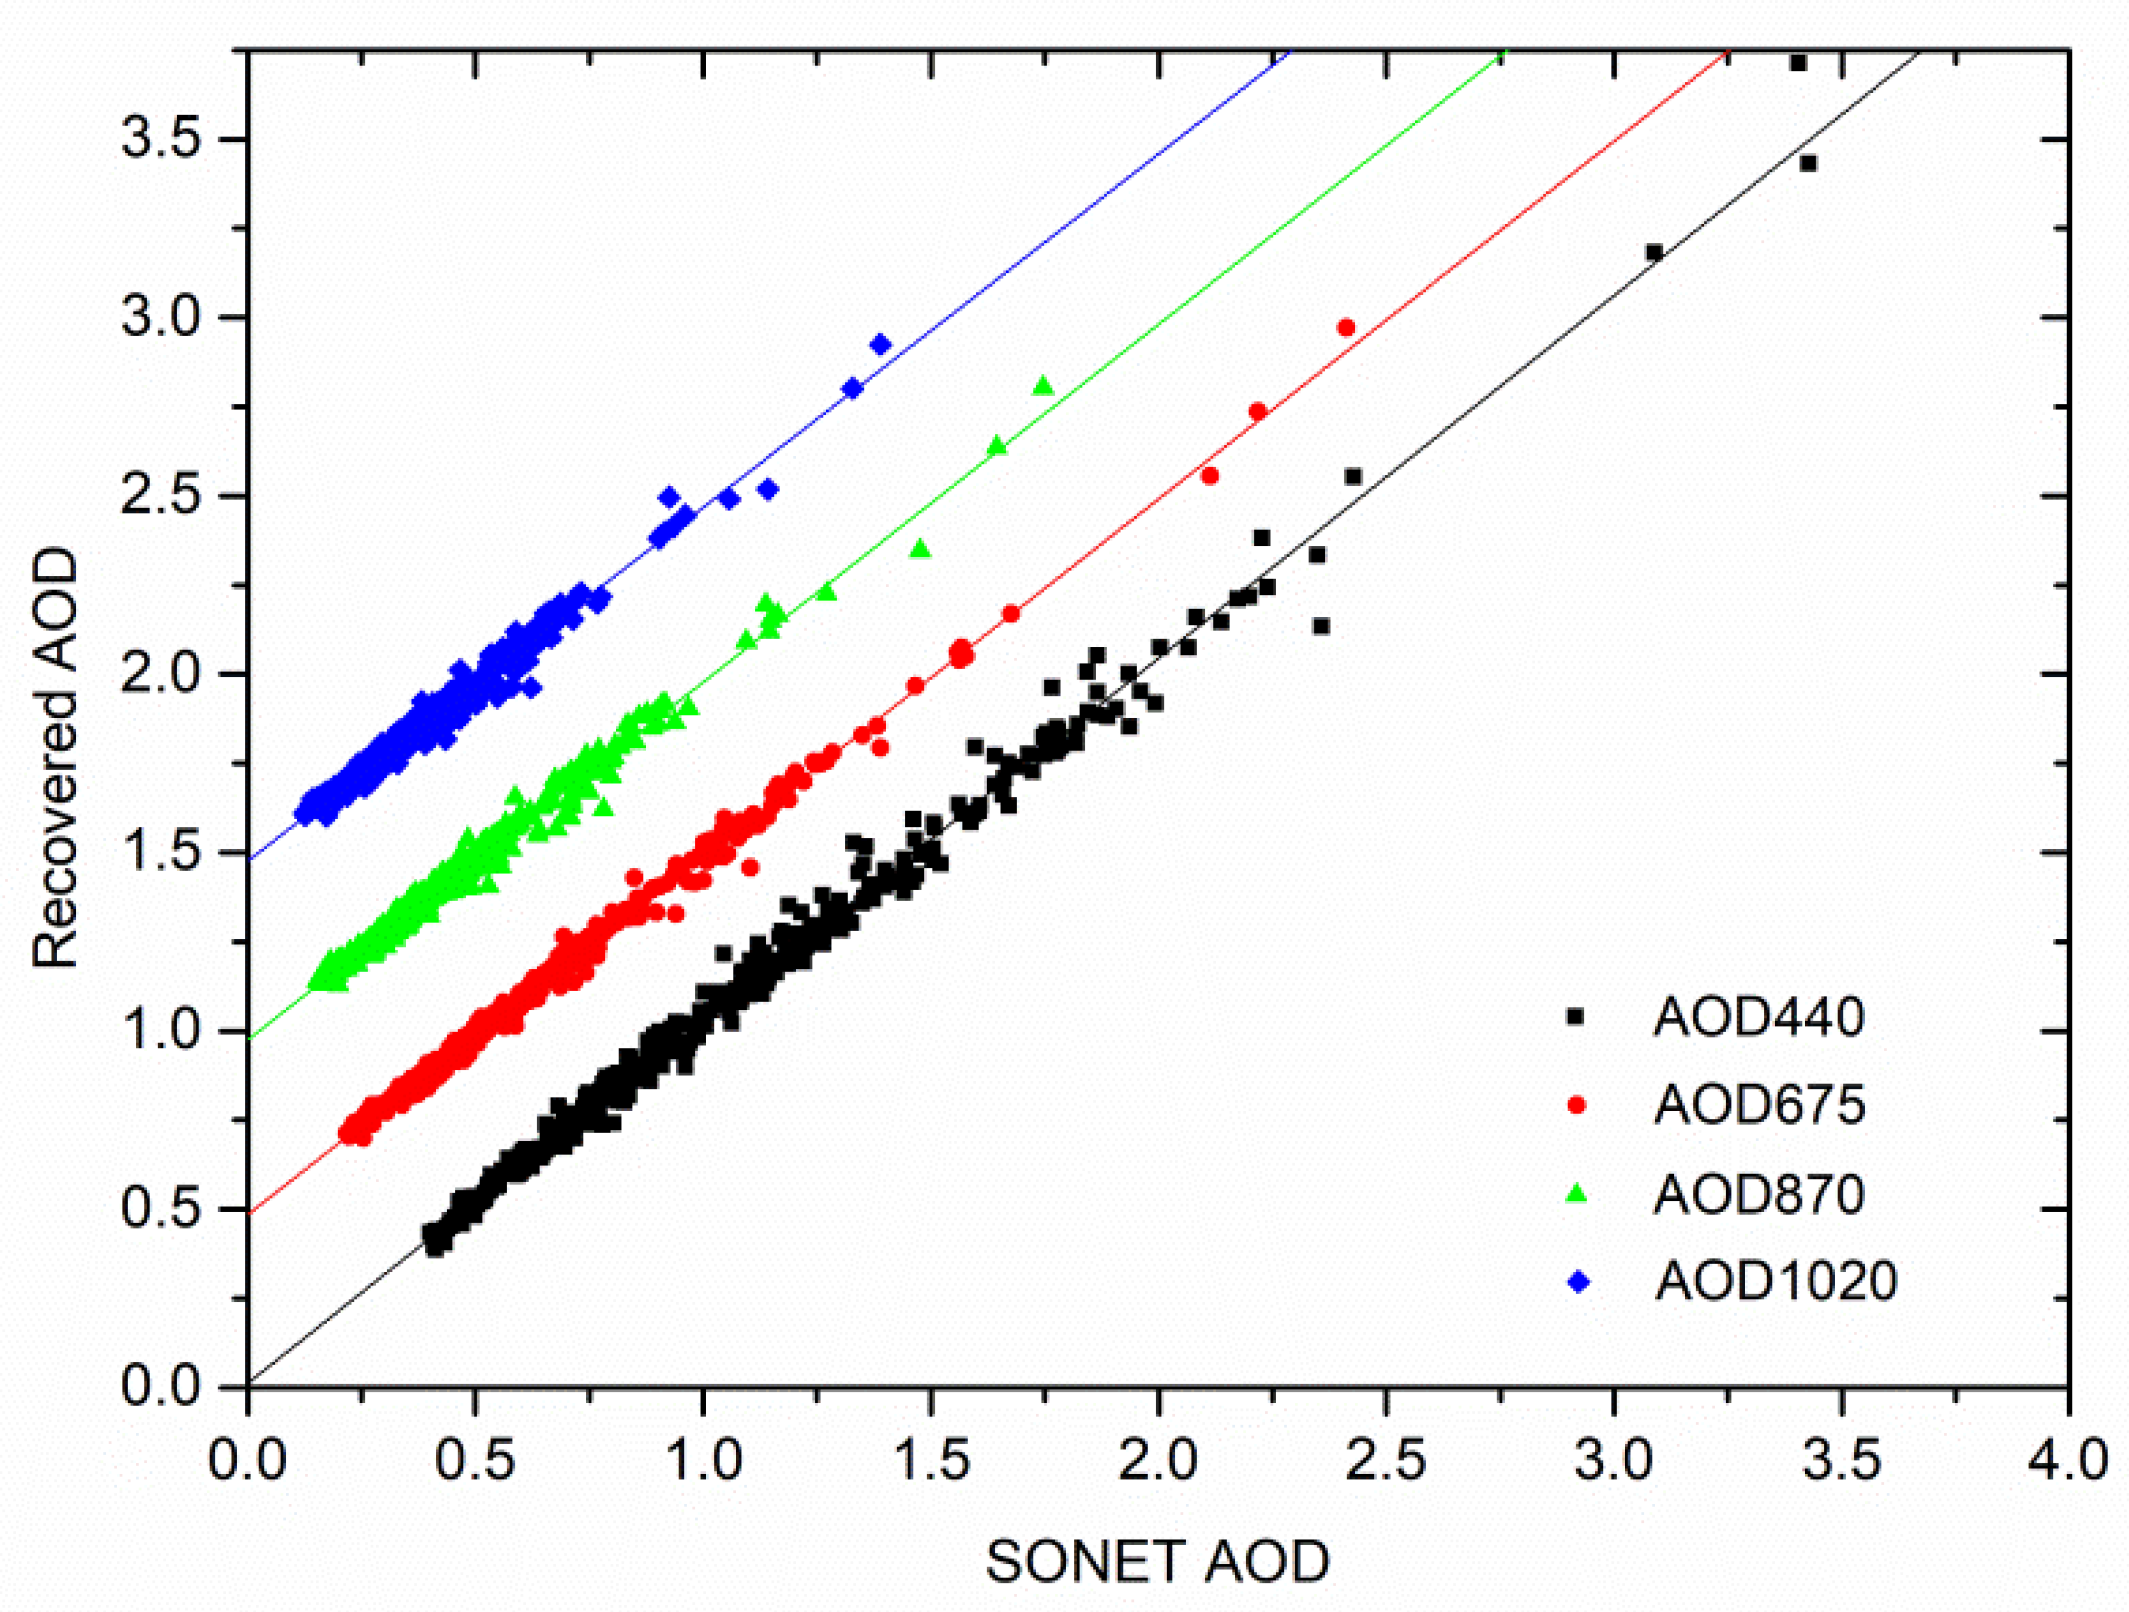
3.1. Fine- and Coarse-Mode AOD
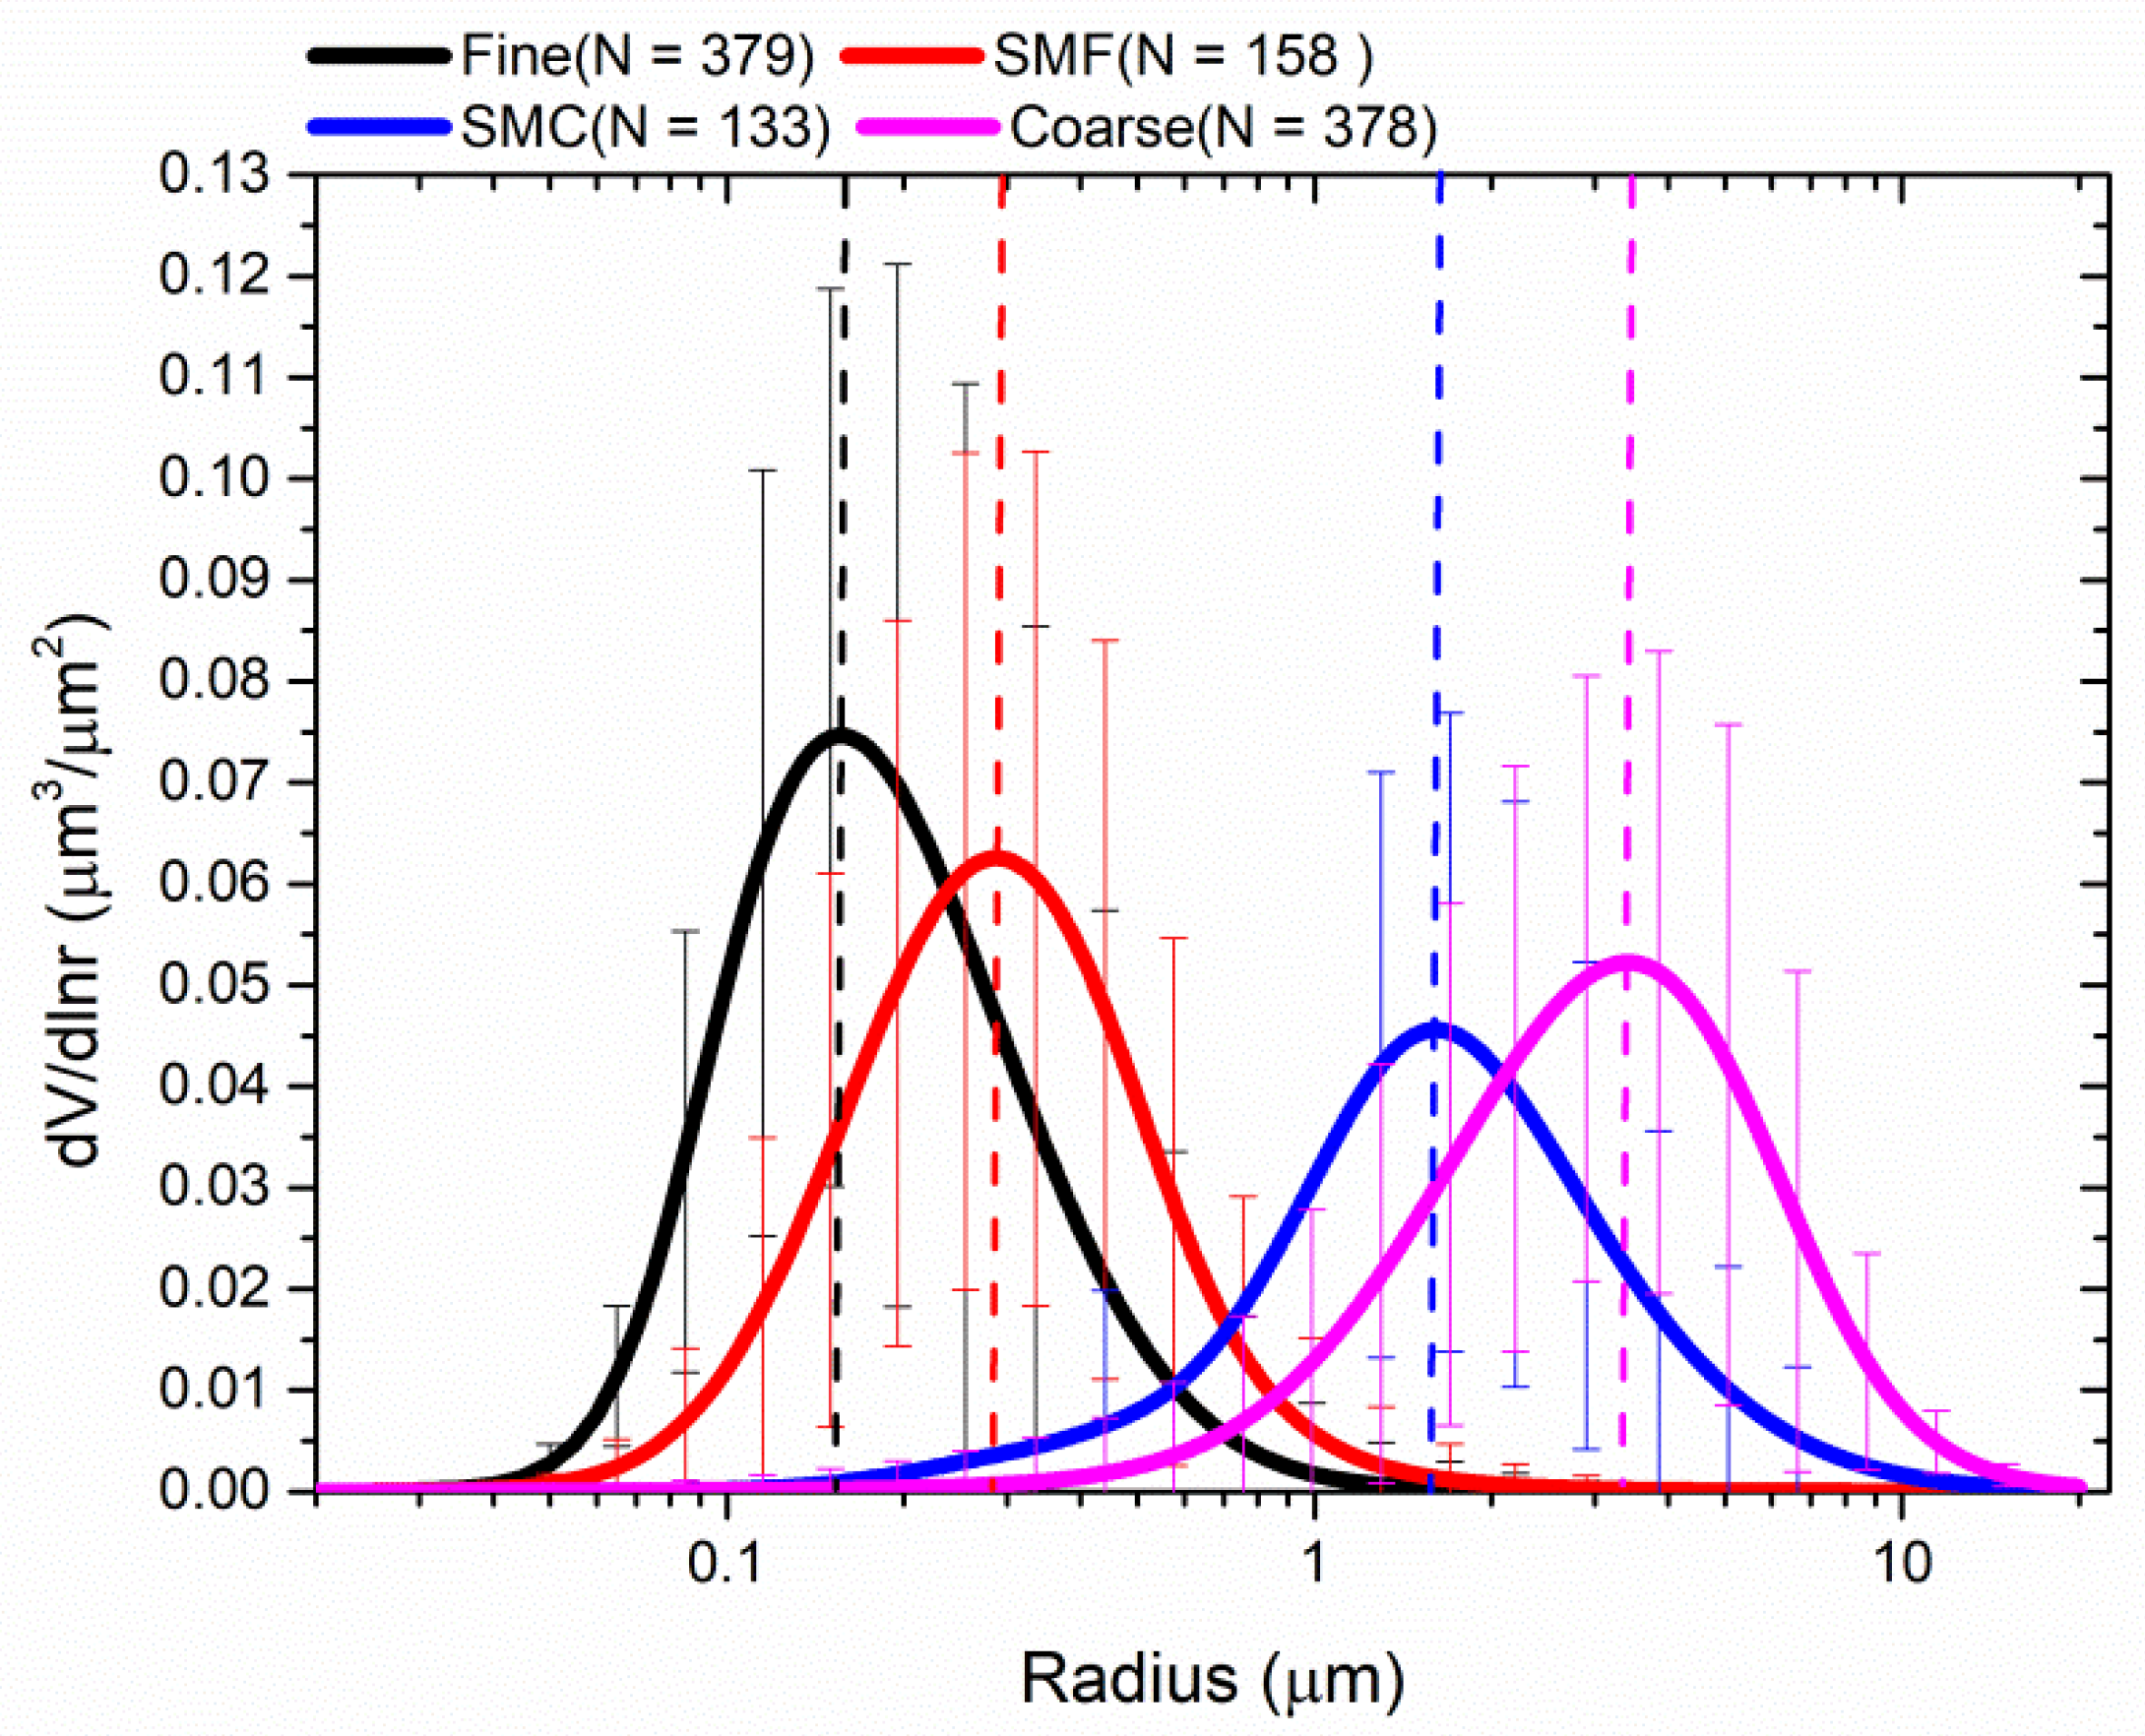
O’Neil et al. (2003) developed a spectral deconvolution algorithm (SDA) that utilizes spectral total extinction AOD data with the assumption of bimodal aerosol size distribution to infer the fine and coarse mode contributions to atmospheric AOD. SONET employs the algorithm’s ability to separated coarse and fine mode AOD that used in Figure 2 [25,36]. As illustrated in Figure 2, we find that the fine-mode AOD ( AOD f ) has the same monthly tendency with the total AOD. The annual AOD f percent is 92%, which varies from 86% to 96%. Nevertheless, the coarse-mode AOD ( AOD c ) has little variation in different month. It is demonstrable that the fine-mode aerosols are the principal pollutant in Chengdu area, which lead to the change of AOD. In summer, rainfall affected by the typical subtropical monsoon basin climate is significantly higher than that in winter [37]. The increasing precipitation can play a role in the removal of atmospheric pollutants. As a result, AOD decreases in summer, which reaches the lowest value of 0.64 in June. However, the average AOD in summer is 0.89, which still acts as a pollutant. There are two main reasons: firstly, the average surface wind speed all over the basin is low under the control of subtropical anticyclone in summer [38], which makes aerosol transport to other regions difficult. In addition, high temperature can cause the increasing formation of secondary organic aerosol particles [39]. In winter, the large variation of temperature from day to night leads to the rapid condensation of water vapor, which is conducive to the concentration of water and particulate matter. And the cold air is not conductive to the diffusion of aerosol because of the enclosed basin [16]. Therefore, AOD is the highest in winter (Winter: AOD = 1.12).
AE (440–870 nm) changes little with the value more than 1.0, which is similar to the previous research [12,20]. Convective precipitation occurs frequently in summer that the majority of coarse particles have been eliminated by wet settlement, but the fine particles remained in atmosphere with long suspension times [20,40,41,42]. Also, in Figure 2, it also can be illustrated by that the difference between AOD f and AOD is lowest in summer. The average AE is less than 1.2 in each month of spring. The main reason for the high AOD and low AE in spring is the long-distance transport of dust pollution from North China [43,44]. In addition, another reason may be the wind speed increasing, by which it can be speculated that large particles are emitted to the atmosphere or transported from other regions by strong wind [20,45].
The AOD can be separated into fine- and coarse-mode and the different mode has the obviously distinguishing extinction for solar light in Chengdu. Therefore, it is important to explore the more sub-mode properties to research on the climate effect of different mode aerosols.

3.2. Sub-Mode VSD

VSD is one of the important aerosol microphysical properties. Although the particle size changes constantly, atmospheric aerosol particles exist in three-mode VSD stably. According to particle radius, the modes can be divided into nuclear mode (less than 0.1 μm), accumulation mode (0.1–1 μm) and coarse mode (larger than 1 μm) [46]. The process of nuclear mode is concentrated in nanometer scale, and the accumulation mode and coarse mode can be shown in VSDs [47,48]. According to Eck et al. (2012), large fine mode-dominated aerosols (submicron radius) were observed after the fog or low-altitude cloud dissipated events. As cloud condensation nuclei or ice nuclei, the smaller coarse mode-dominated aerosols (supermicron radius) are involved in the fog/cloud formation and dissipation [49]. Li, et al. (2014) found that an unusual increase of submicron fine modes is an important mechanism for haze growth in the polluted region. As identified in Figure 3, there are four modes of the aerosol VSD in Chengdu area and the corresponding parameters are listed in Table 1. The different color lines are the average of each mode and the values of N in the legend are the amounts of data involved in averaging. The modes can be clearly distinguished. As the median radius is less than 1μm, there are two peaks: the fine mode and submicron fine (SMF) mode. Furthermore, there are two peaks as the radius more than 1 μm: supermicron coarse (SMC) mode and coarse mode. In the figure, the fine mode has an almost equal amount of data as the coarse mode, but the fine-mode with one addition, which is one record with only one-peak VSD. The SMC mode has the least data amount of all (N = 133). The median radius of each mode is obviously different. As to the fine mode, the average median radius is 0.17 μm ± 0.05 and the volume modal concentration is 0.10 ± 0.07, that is, the largest value of all modes. The median radii of the SMF modes are mainly in the range of 0.2–0.5 μm, which can indicate fog dissipation and haze growth, as previously mentioned. The SMC mode has a median radius of 1.62 μm ± 0.45 and the volume modal concentration of 0.07 ± 0.05. The coarse mode has an average median radius of 3.25 μm ± 0.99.

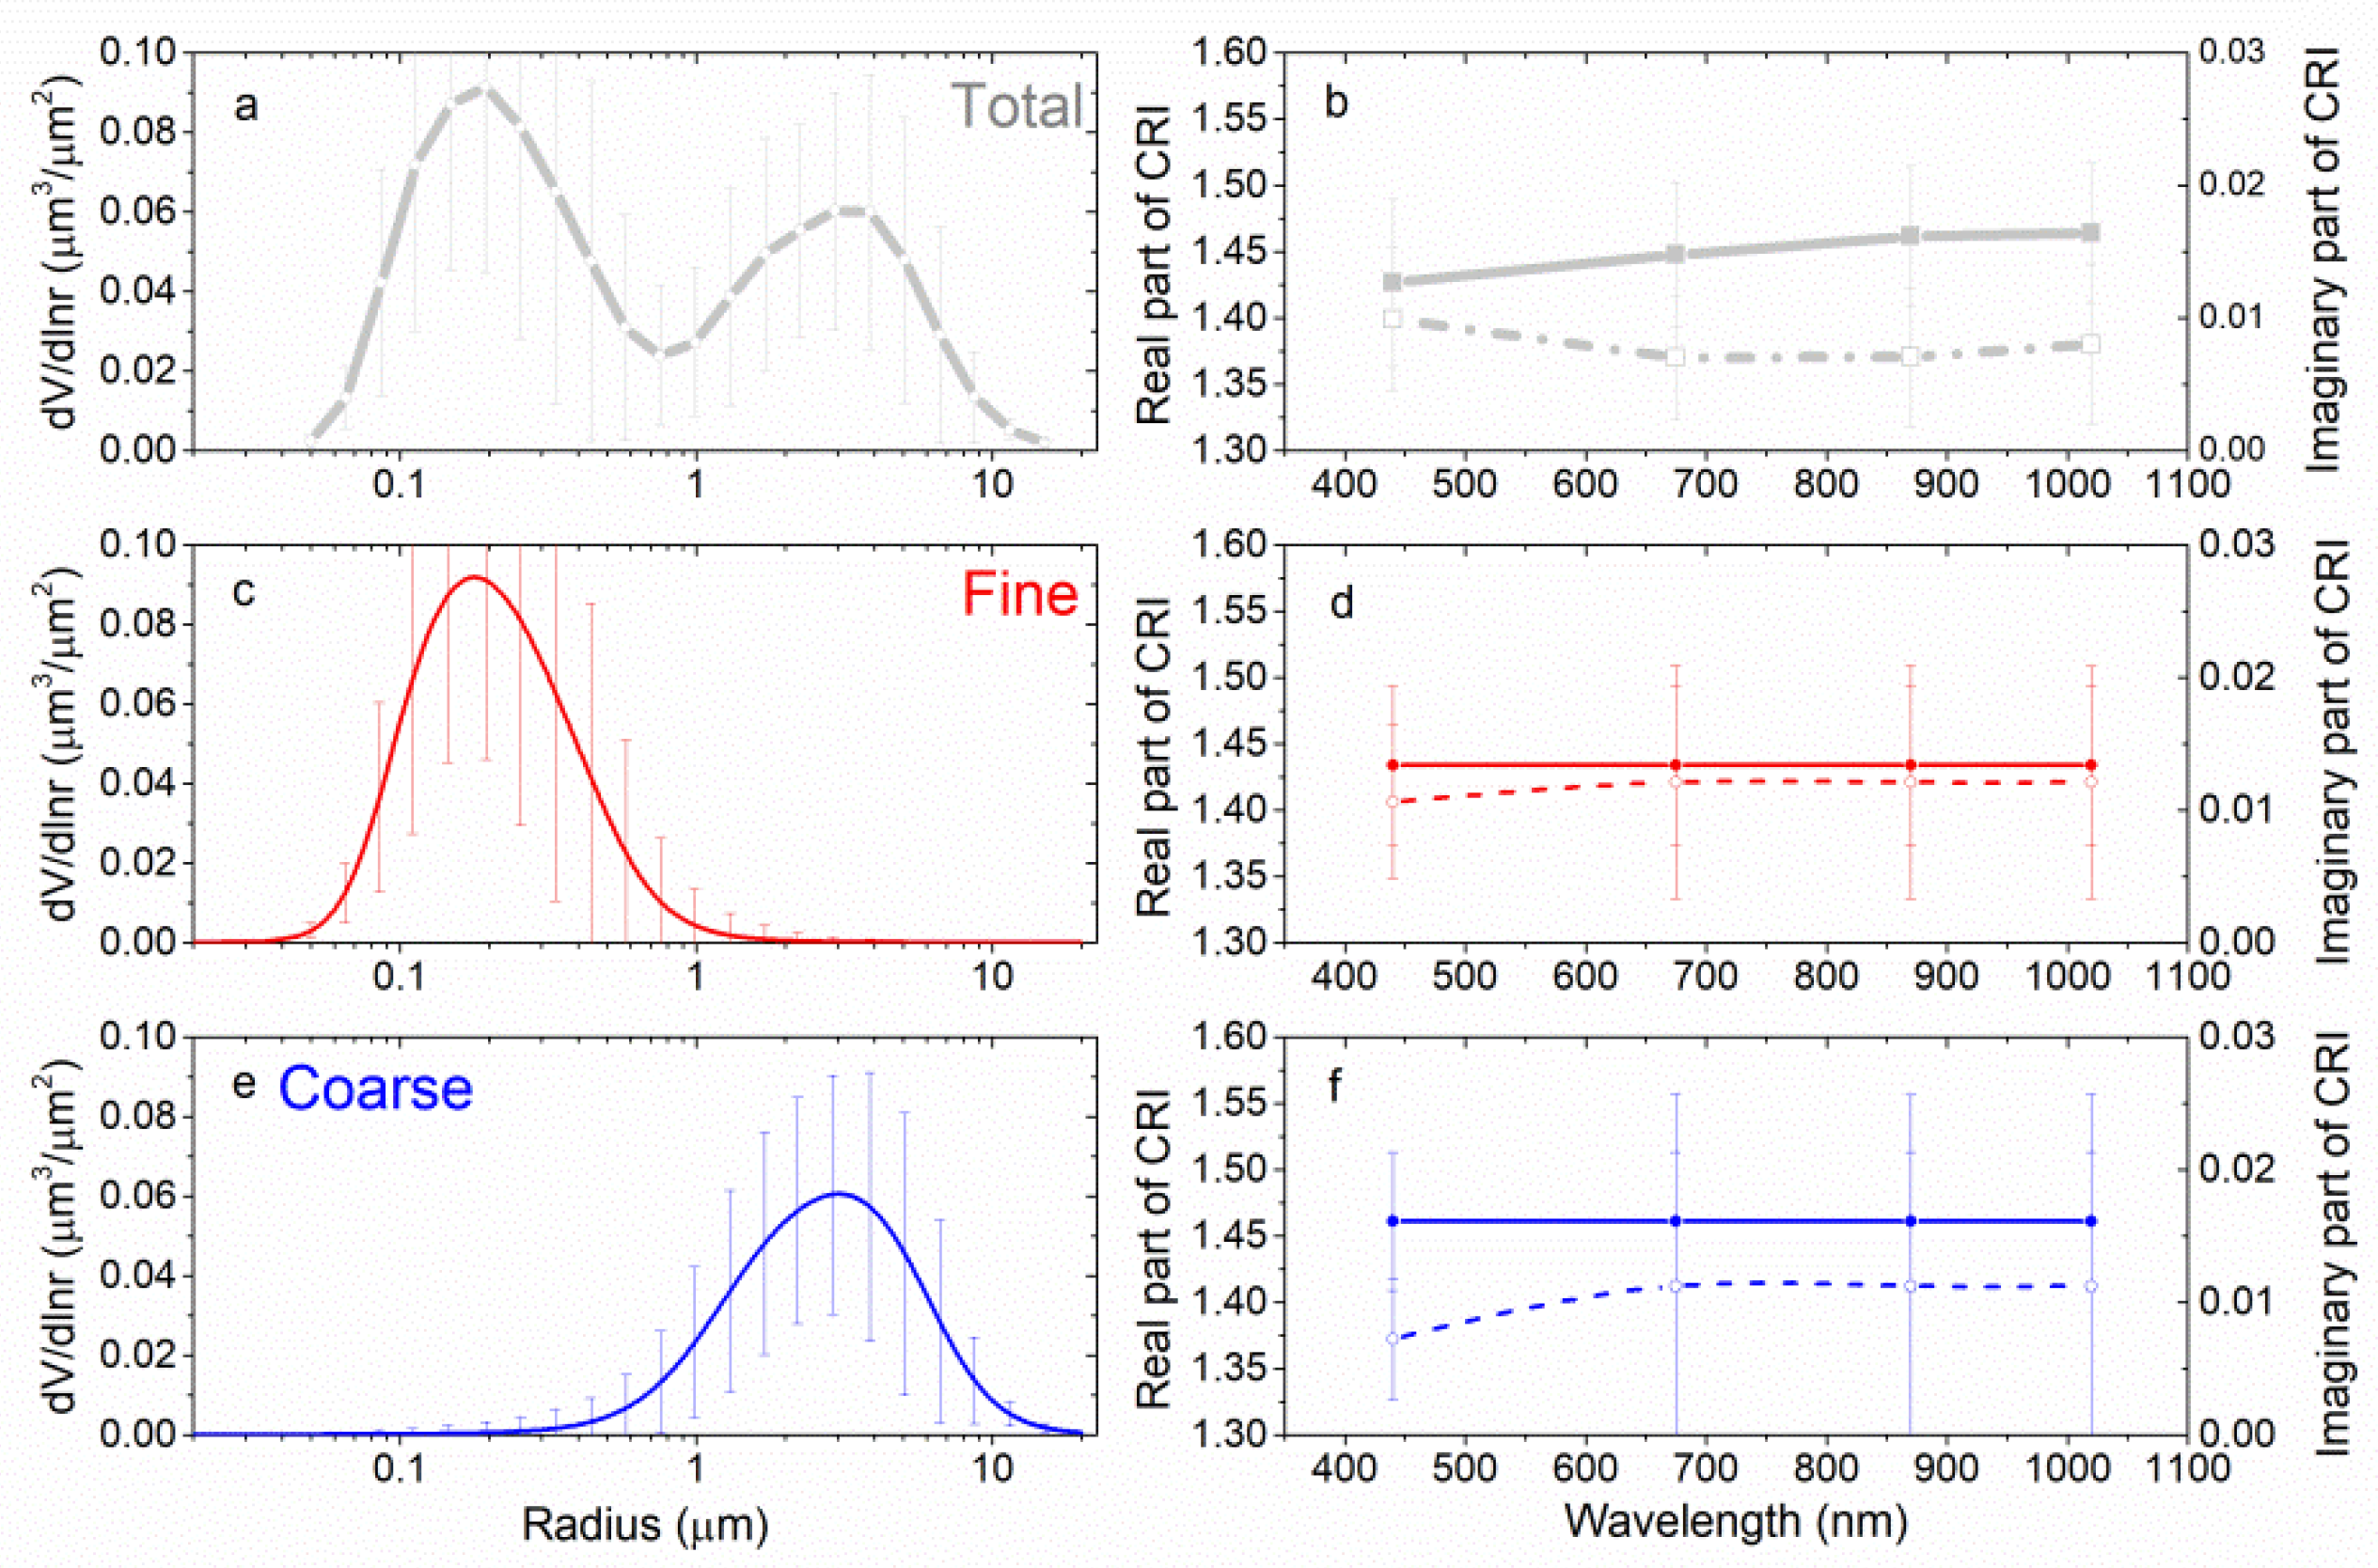
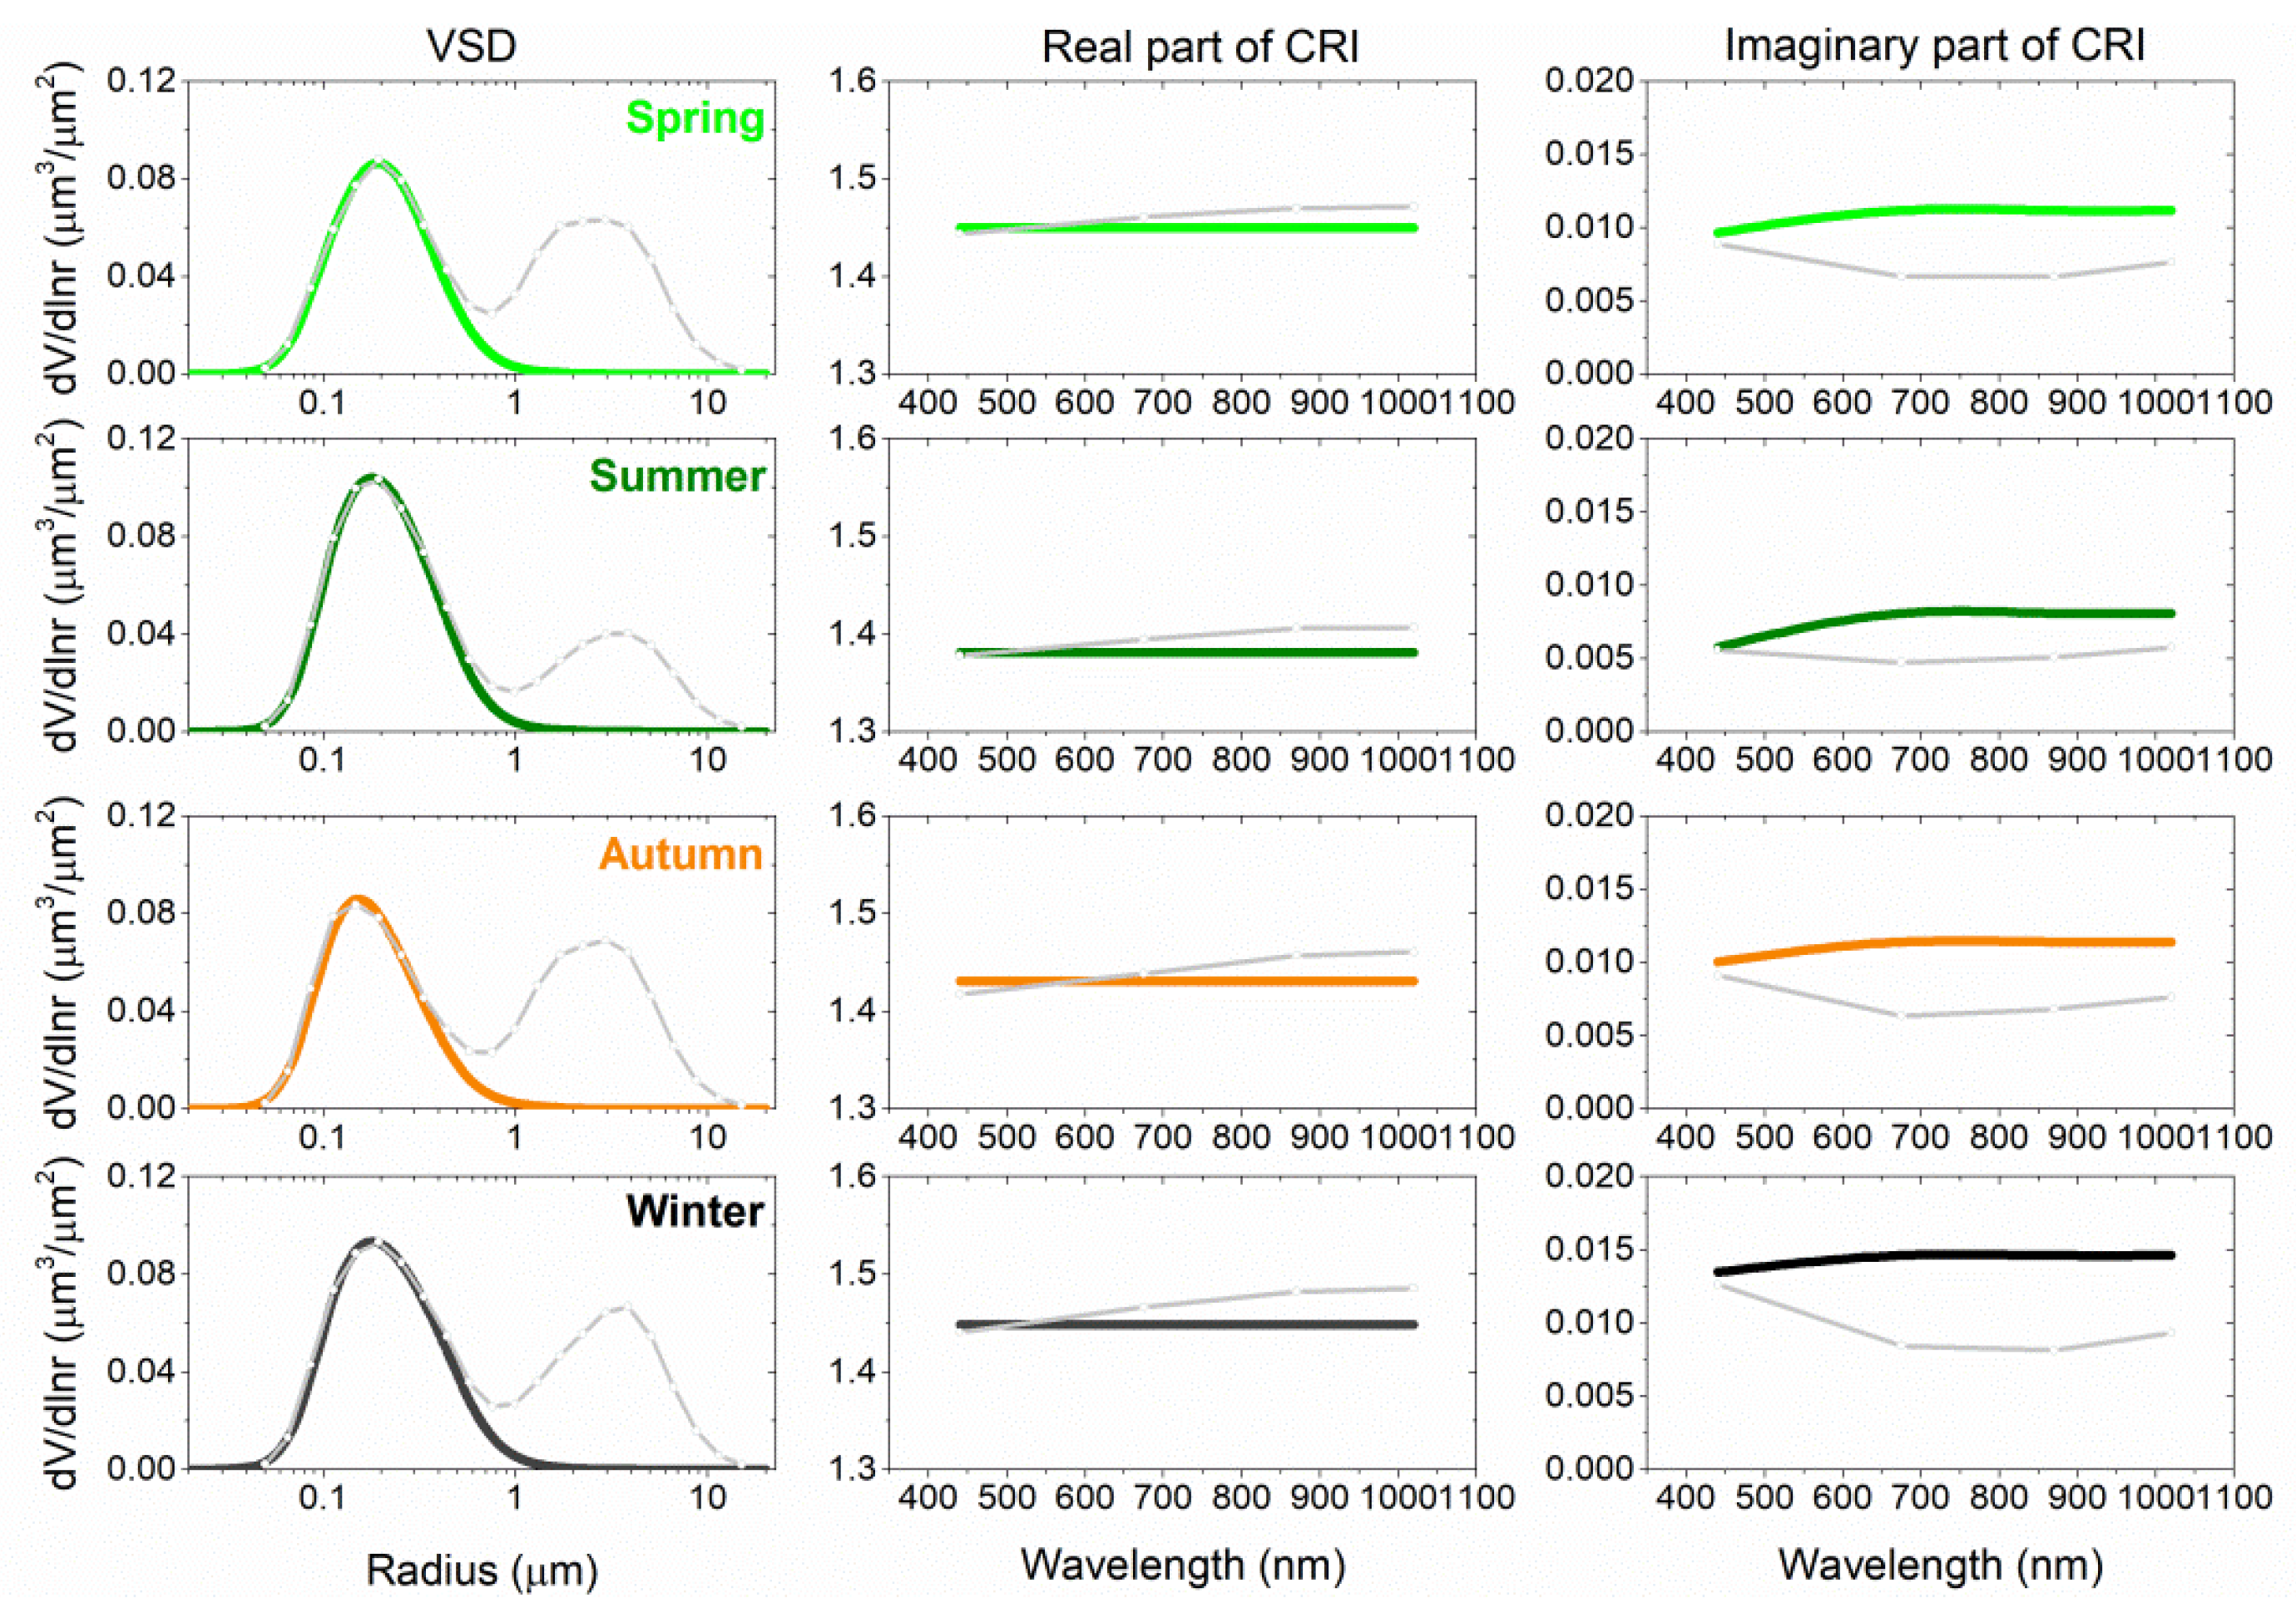
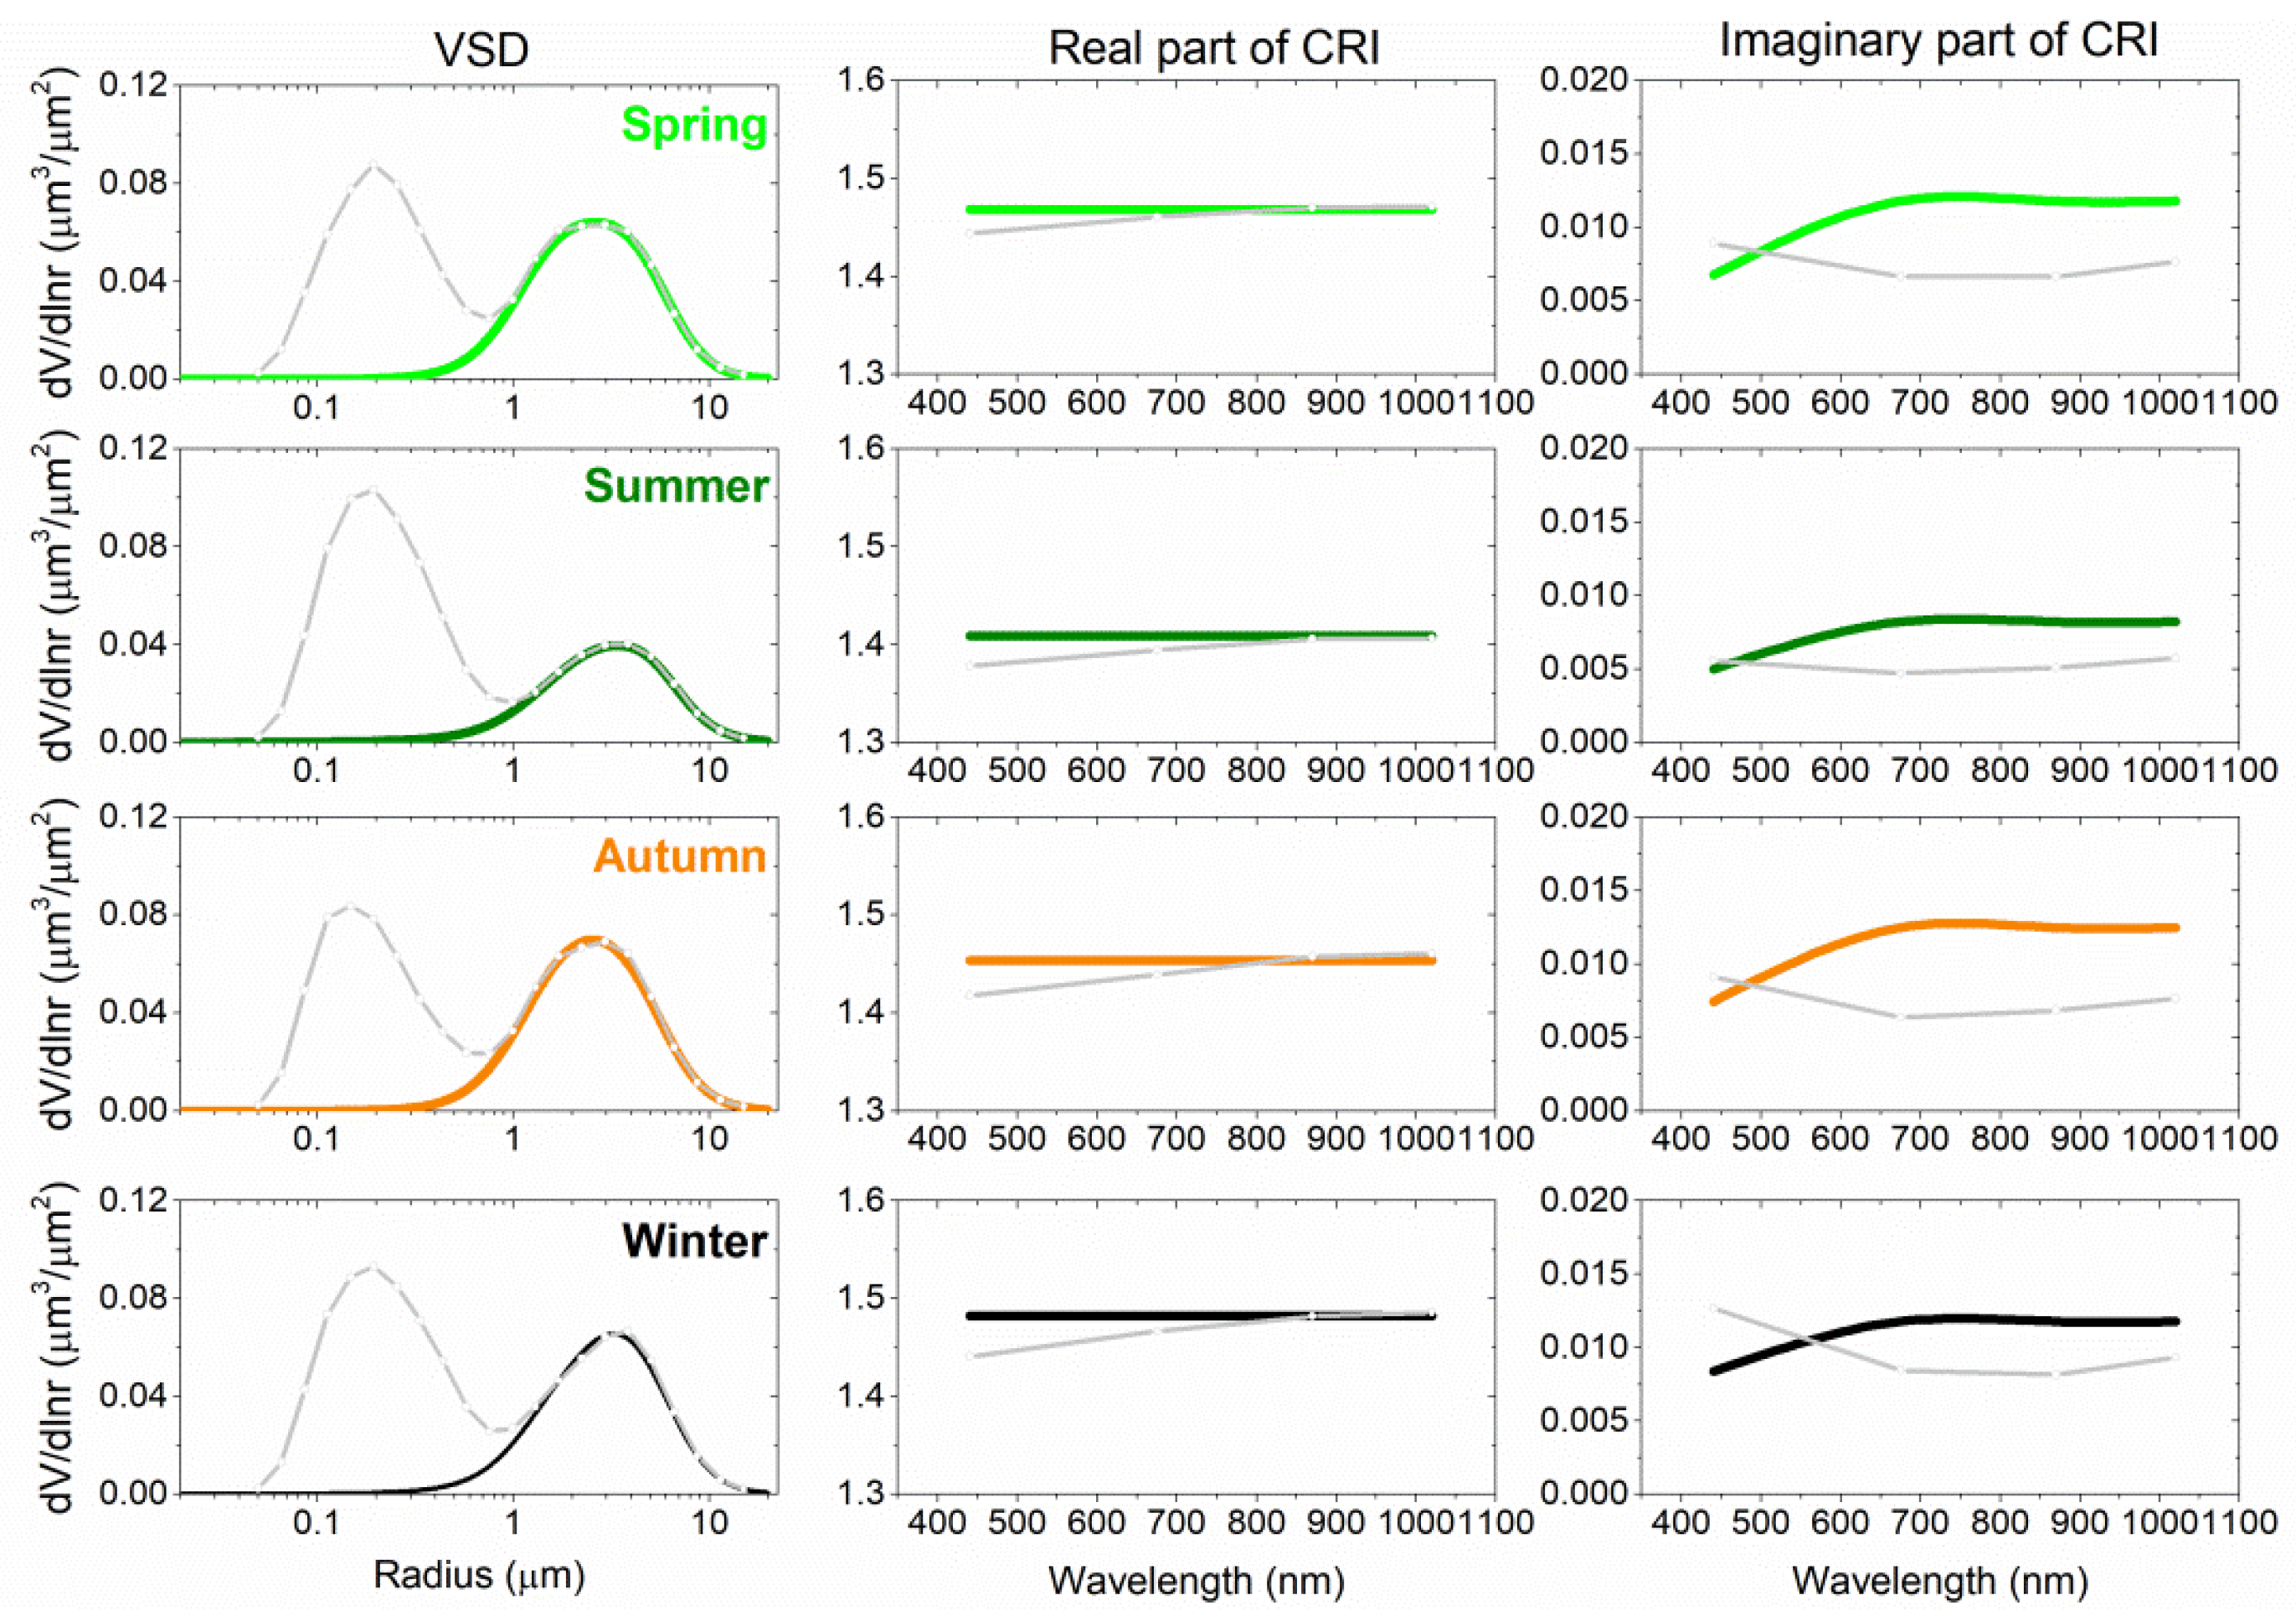
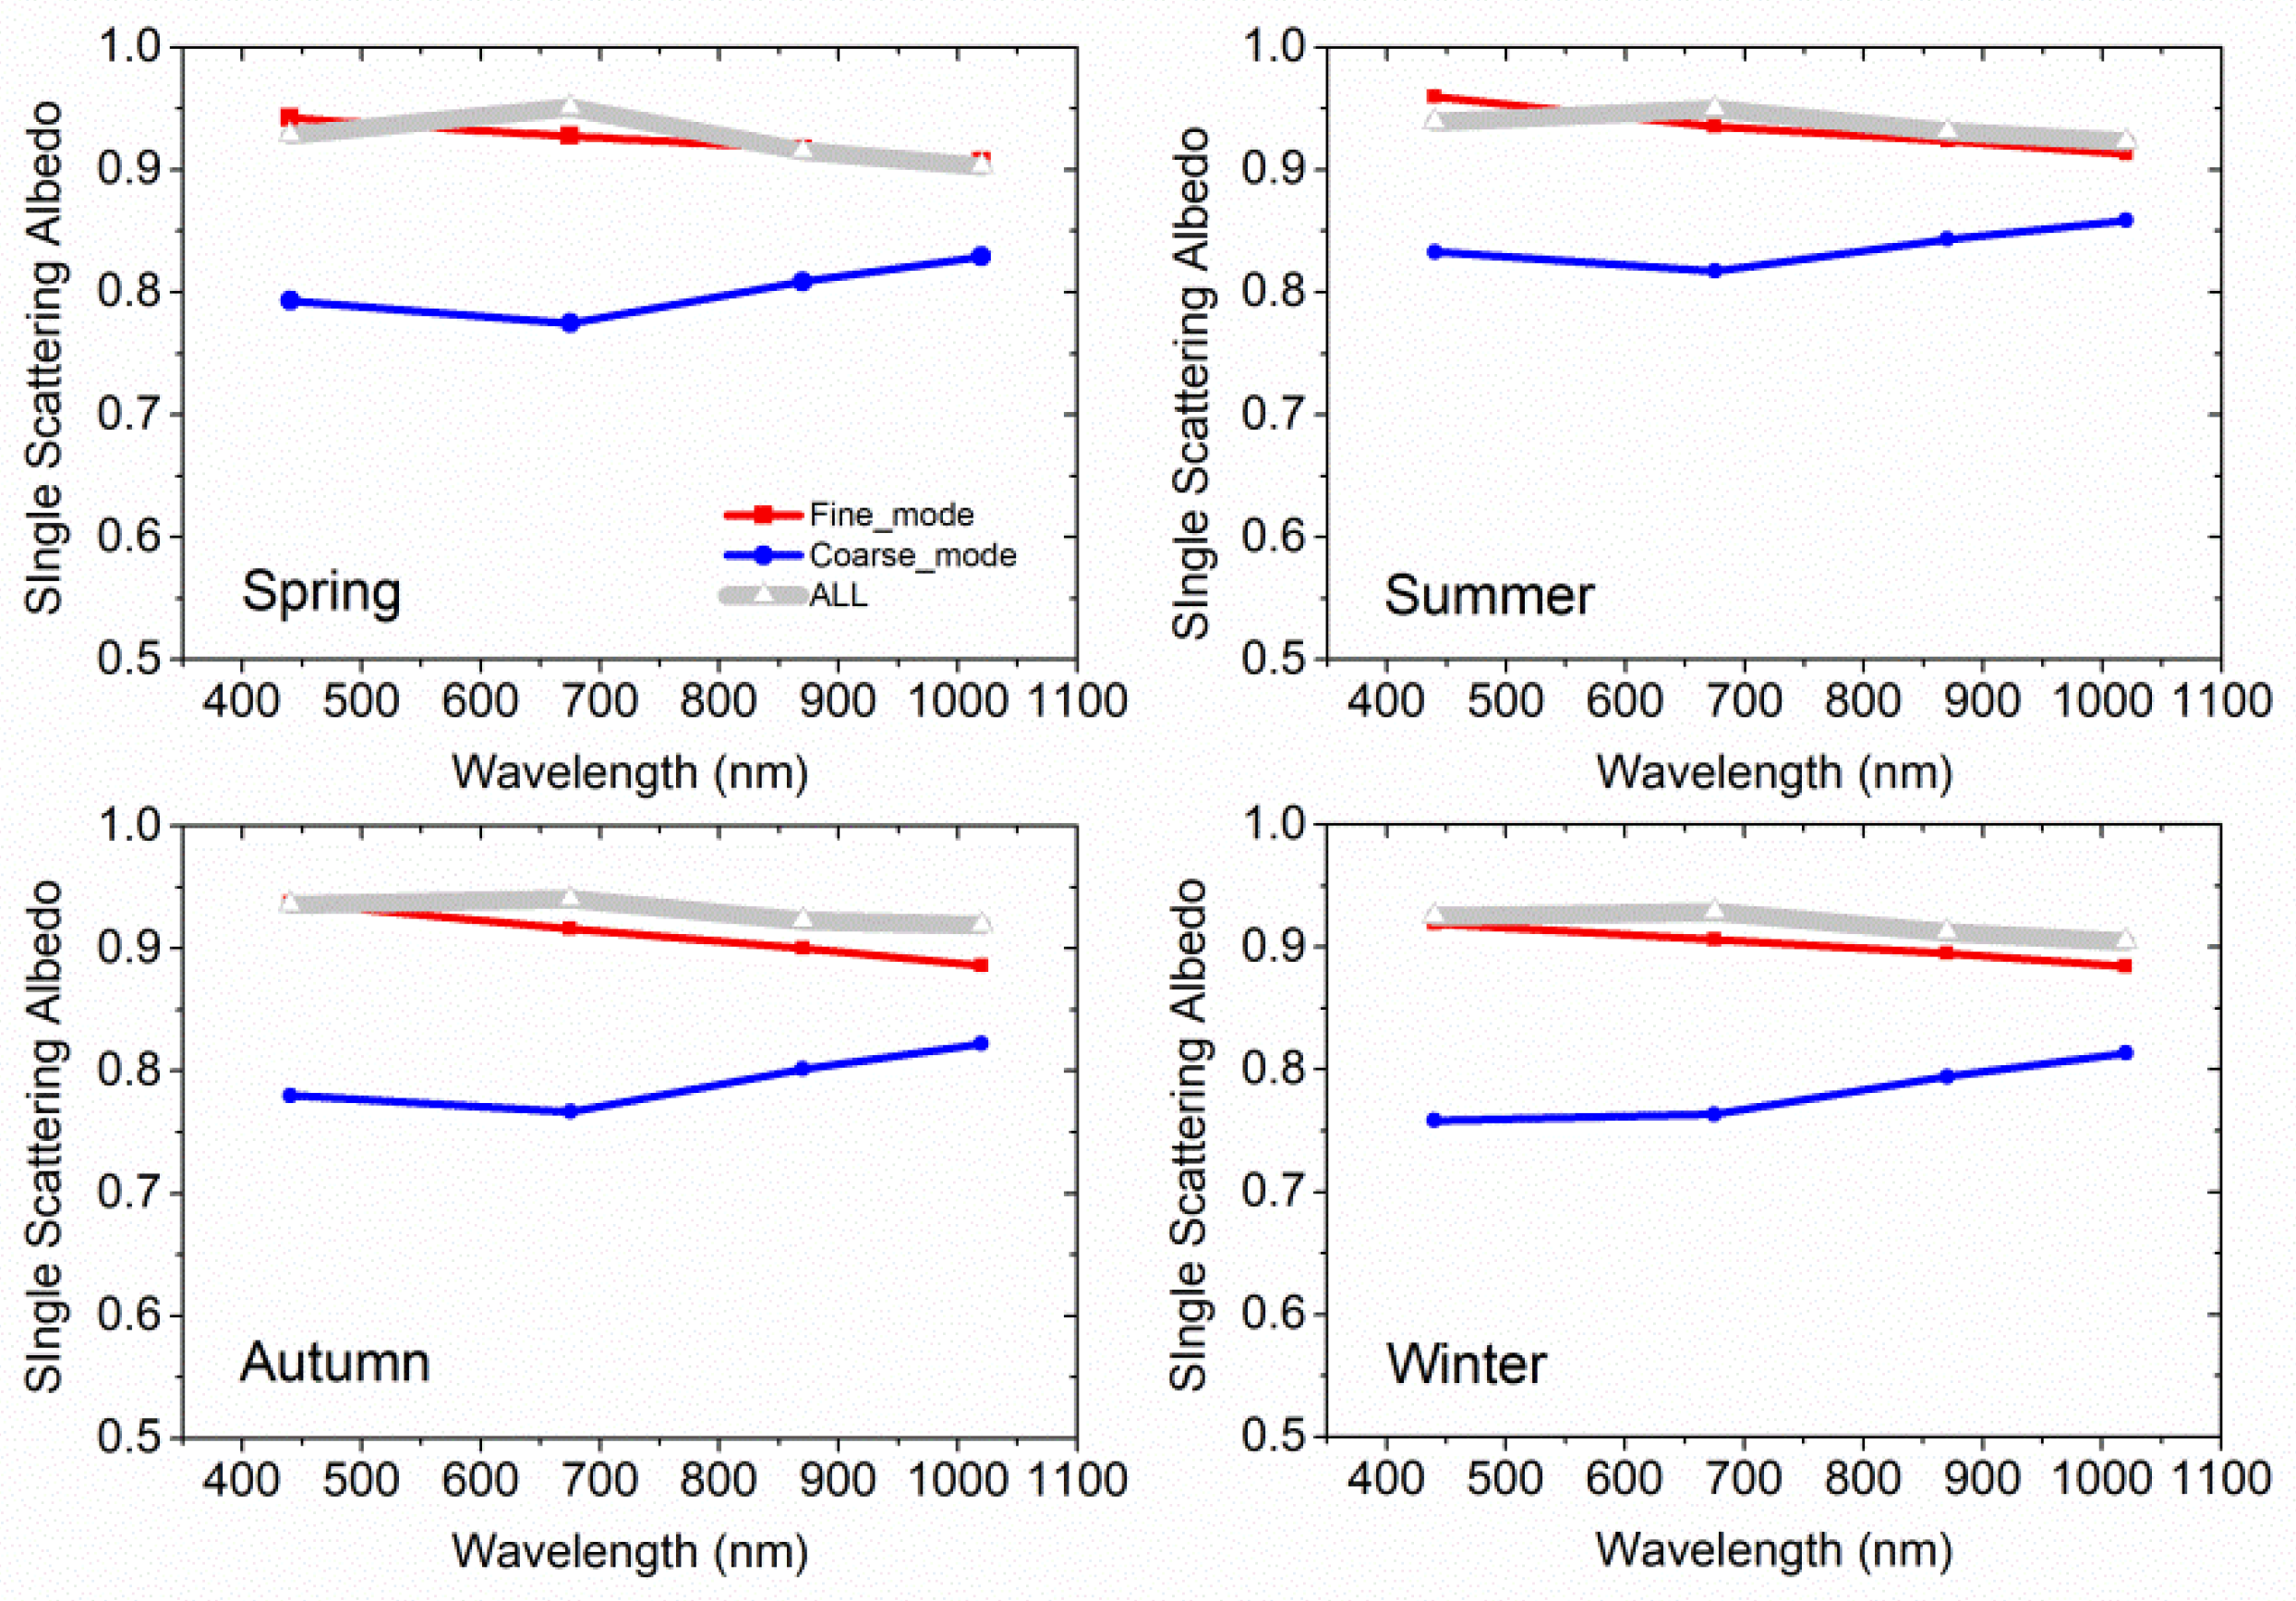
3.3. Fine- and Coarse-Mode VSD and CRI

The primary focus of Section 3.2 shows that the VSD can be separated into four distinguishing modes. However, in general, the natural aerosols, which are predominately coarse mode particles (r > 1 μm), and combustion-produced and anthropogenic emissions particles, which are predominately fine mode particles (r < 1 μm), of various mixed relative fractions are the mixtures in the aerosols. Furthermore, the fine mode and coarse mode particles are from different components. Also, at the same time, the CRI can only be separated into fine- or coarse-mode due to technical and precision limitations. Therefore, we focus on the fine- and coarse-mode VSD and CRI in Chengdu in this section.
In Figure 4, we present the multi-year average separated CRIs and the breakdown results of VSDs. It can be seen the fine- and coarse-mode VSD are well separated. The pictures (a) and (b) in the first row are the average values retrieved from the ground-based Sun-sky radiometer over multiple years. The second and third rows are the average of fine- and coarse-mode VSD and CRI. The sub-mode real part of CRI has non variation of wavelengths referring to Equation (2). The total CRI and sub-mode CRI are from different algorithms [21,32,34], but the sub-mode CRI is related to the volume modal concentration in the iterative algorithm of estimation of CRI for fine and coarse mode [34].
The fine-mode volume modal concentration is clearly higher than the coarse-mode one. The fine- and coarse-mode real parts of CRI exhibit little difference ( n f = 1.43 ,   n c = 1.46 ). However, the coarse mode has a lower imaginary part of CRI at 440 nm than that of fine mode ( k f 440 = 0.0106 ,   k c 440 = 0.0072 ). At longer wavelengths, the imaginary part of CRI has little variation between fine- and coarse-mode ( k f = 0.0121 ,   k c = 0.0112 ).
Figure 5 shows the fine-mode VSDs and CRIs in different seasons. The corresponding parameters are listed in Table 2. The typical bimodal or multimodal VSDs in all seasons imply a fine-coarse mixed–size distribution in the Chengdu area, similar to the urban-industrial aerosol type [50]. The fine-mode volume concentration is higher in summer, followed by winter, spring and autumn (Table 2). Furthermore, the fine-mode median radii are higher in summer (0.21) and winter (0.21). This can be explained by the increasing precipitation in summer and the low wind speed in winter that would lead to the high relative humidity and hygroscopic growth [22,23].
The CRI can reflect the aerosol chemical composition. The real part indicates the aerosol refractivity and scattering characteristics. Specifically, the real part of CRI of water is generally considered to be 1.33 [51], much lower than other dry matters. Therefore, the real part can also reflect the water content in aerosol. The total real part of CRI in summer is the lowest, which is associated with the high humidity and water content in summer. Moreover, the fine-mode real part of CRI is also the lowest ( n f   = 1.38 ). As shown in Table 2, the fine-mode real parts of CRIs are all lower than the coarse-mode ones, which suggests that the water content in fine-mode particles play a leading role in Chengdu aerosols.
The imaginary part of CRI is related to the absorption characteristics of aerosol. The fine-mode imaginary part of CRI generally indicates that the fine-mode absorption component, that is, Black carbon (BC) or Brown carbon (BrC) [52].
Figure 6 presents the coarse-mode VSDs and CRIs in different seasons. The coarse-mode volume concentration is obviously less than the fine-mode. In particular, the volume concentration in summer gets the lowest ( V c = 0.069 ), which is associated with the wet removal of coarse particles. In summer, the coarse-mode real part is the lowest value over the four seasons, but also higher than the fine-mode one in Figure 5 that suggests the coarse particles are weakly hygroscopic ( n f = 1.38 ,   n c = 1.41 ). For all seasons, the coarse-mode imaginary part of CRI is quite constant (Table 2). In contrast, the fine-mode imaginary part has great seasonal variation. That demonstrates the coarse particle components are relatively stable. The spectral difference of the imaginary part (between 440 nm and longer wavelength) has a discrepancy between fine- and coarse-mode. It should be mentioned that the imaginary part reflects the aerosol absorbing property, and its spectral pattern can reveal the relative fractions of absorbing aerosols, that is, BC and DU [52,53,54].

4. Discussion

In order to evaluate the overall analysis scheme, a numerical experiment was used to assess the performance of sub-mode results. In Figure 7, we illustrated the recovery of AOD in four wavelengths by the sub-mode VSD and CRI. It can be seen that the correlation coefficients are all larger than 0.98. The absolute deviations in four wavelengths are 0.04, 0.02, 0.03 and 0.03, corresponding relative standard deviations are 0.03, 0.03, 0.06, 0.09, respectively. These biases are basically close to the claimed uncertainties of SONET products (AOD), which demonstrate that the sub-mode VSD and CRI results are acceptable in understanding of optical closure.
For further details of the climate effect, the sub-mode SSAs were taken into account. SSAs could reflect the aerosol absorption and scattering of solar lights, which is an important parameter in climate modeling [55,56]. Hansen et al. (1997) noted that a change in SSA from 0.9 to 0.8 can change the radiative forcing from negative to positive depending on the reflectance of the underlying surface and the altitude of the aerosols. Moreover, strongly absorbing aerosols may have a large impact on the regional climate and heating the atmosphere [57,58].
In Figure 8, the sub-mode SSA is calculated by the separated VSD and sub-mode CRI under ignoring the influence of nonsphericity on dust aerosols. The total SSAs are all larger than 0.9 in the four seasons and the fine-mode SSAs are closed to the total SSAs that indicates the scattering properties are mainly dominated by fine-mode aerosol. Higher SSA at 675 nm could indicate the main absorption component BrC [52,53], but the high value of SSA indicates the absorbing effect is obvious less than scattering effect of solar lights. The SSA spectral trends from 675 nm to 870 nm show different patterns: the increasing pattern is usually corresponding to the absorbing coarse particles (e.g., Dust); the decreasing pattern is usually corresponding to the absorbing fine particles (e.g., BC, BrC) [52]. The fine-mode SSAs decrease and the coarse-mode SSAs increase with the increase of wavelength, which indicates the different absorbing component in different modes. Furthermore, the coarse-mode SSAs are lower than that of the fine-mode that suggests the absorption of coarse-mode particles is likely stronger than that of the small size aerosol particles. In this regard, the absorbing component in large-size aerosols (such as mineral dust, biomass burning, etc.) is possibly more than that of small-size aerosols.

5. Conclusions

In this study, we investigated the sub-mode VSD and CRI for fine- or coarse-mode in the Chengdu area. The annual average of AOD f percentage is 92%, which has the same monthly tendency with the total AOD, but AOD c has little variation in different months. The typical bimodal or multimodal VSDs employ a fine-coarse mixed–size distribution in Chengdu area. There are four distinguishing modes of VSD in Chengdu that the median radii are 0.17 μm ± 0.05, 0.31 μm ± 0.12, 1.62 μm ± 0.45, 3.25 μm ± 0.99, respectively.
The fine-mode annual average volume modal concentration is clearly higher than the coarse-mode one. The fine-mode volume concentration and median radius are higher in summer and winter. In particular, the coarse-mode volume concentration gets lowest in summer ( V c = 0.069 ), which is associated with the wet removal of large-size particles. For multi-year average results of CRI, the fine-mode and coarse-mode real parts show little difference. However, the coarse mode has a lower imaginary part at 440 nm than the fine-mode ( k f 440 = 0.0106 ,   k c 440 = 0.0072 ). At longer wavelengths, the imaginary part of CRI has little variation between fine and coarse mode ( k f = 0.0121 ,   k c = 0.0112 ). In summer, both fine- and coarse-mode real parts get the lowest value respectively because of the high humidity ( n f = 1.38 ,   n c = 1.41 ). For all seasons, the coarse-mode imaginary part of CRI is quite constant, but the fine-mode imaginary part has great seasonal variations. It indicates the coarse particle components are relatively stable.
In order to assess the performance of the sub-mode results, we illustrated the recovery of AOD by the sub-mode VSD and CRI. It can be seen that all the correlation coefficients are larger than 0.98. The sub-mode SSAs are calculated by sub-mode VSD and CRI under the condition of neglecting the non-sphericity. The total SSAs are all larger than 0.9 in the four seasons and the fine-mode SSAs are closed to the total SSAs that indicates the scattering properties are mainly dominated by fine-mode aerosols. The coarse-mode SSAs are lower than fine-mode, which suggests the absorbing effect of coarse-mode particles is likely stronger than that of the small size aerosol particles.

Author Contributions

Z.L. conceived and designed this study, and participated in drafting and revising the article. C.Z. substantially contributed to the analysis and interpretation of data, and drafted the articles. H.X. reviewed and edited the manuscript. Y.Z. and Y.W. undertook a part of the instrument maintenance job. D.L., K.L. and Y.X. contributed to the calibration of the sun-sky radiometer and analyses of the observation data. Y.Z. do formal analysis and investigation.

Acknowledgments

This work was supported by the National Key Research and Development Program of China under Grant 2016YFE0201400, the National Natural Science Foundation of China under Grant 41671364,41671367, 41771396, and Science and Technology Service network initiative (STS) Project of Chinese Academy of Sciences (KFJ-STS-QYZD-022).

Conflicts of Interest

The authors declare no conflict of interest.

References

  1. Twomey, S. Pollution and the planetary albedo. Atmos. Environ. (1967) 1974, 8, 1251–1256. [Google Scholar] [CrossRef]
  2. Kazil, J.; Stier, P.; Zhang, K.; Quaas, J.; Kinne, S.; O’donnell, D.; Rast, S.; Esch, M.; Ferrachat, S.; Lohmann, U. Aerosol nucleation and its role for clouds and Earth’s radiative forcing in the aerosol-climate model ECHAM5-HAM. Atmos. Chem. Phys. 2010, 10, 10733–10752. [Google Scholar] [CrossRef]
  3. Albrecht, B.A. Aerosols, cloud microphysics, and fractional cloudiness. Science 1989, 245, 1227–1231. [Google Scholar] [CrossRef] [PubMed]
  4. Pöschl, U. Atmospheric Aerosols: Composition, Transformation, Climate and Health Effects. Angew. Chem. Int. Ed. 2005, 44, 7520–7540. [Google Scholar] [CrossRef] [PubMed]
  5. Liao, W.; Wang, X.; Fan, Q.; Zhou, S.; Chang, M.; Wang, Z.; Wang, Y.; Tu, Q. Long-term atmospheric visibility, sunshine duration and precipitation trends in South China. Atmos. Environ. 2015, 107, 204–216. [Google Scholar] [CrossRef]
  6. Pan, L.; Che, H.; Geng, F.; Xia, X.; Wang, Y.; Zhu, C.; Chen, M.; Gao, W.; Guo, J. Aerosol optical properties based on ground measurements over the Chinese Yangtze Delta Region. Atmos. Environ. 2010, 44, 2587–2596. [Google Scholar] [CrossRef]
  7. Tao, J.; Cheng, T.; Zhang, R.; Cao, J.; Zhu, L.; Wang, Q.; Luo, L.; Zhang, L. Chemical composition of PM2.5 at an urban site of Chengdu in southwestern China. Adv. Atmos. Sci. 2013, 30, 1070–1084. [Google Scholar] [CrossRef]
  8. Tao, M.; Chen, L.; Wang, Z.; Tao, J.; Che, H.; Wang, X.; Wang, Y. Comparison and evaluation of the MODIS Collection 6 aerosol data in China. J. Geophys. Res. Atmos. 2015, 120, 6992–7005. [Google Scholar] [CrossRef] [Green Version]
  9. Deng, L.; Qian, J.; Liao, R.; Tong, H. Pollution characteristics of atmospheric particulates in Chengdu from August to September in 2009 and their relationship with meteorological conditions. China Environ. Sci. 2012, 32, 1433–1438. [Google Scholar]
  10. Li, X.; Yang, Z.; Fu, P.; Yu, J.; Lang, Y.-c.; Liu, D.; Ono, K.; Kawamura, K. High abundances of dicarboxylic acids, oxocarboxylic acids, and α-dicarbonyls in fine aerosols (PM2.5) in Chengdu, China during wintertime haze pollution. Environ. Sci. Pollut. Res. 2015, 22, 12902–12918. [Google Scholar] [CrossRef]
  11. Yong, L.; Allen, P.A.; Densmore, A.L.; Qiang, X. Evolution of the Longmen Shan foreland basin (western Sichuan, China) during the Late Triassic Indosinian orogeny. Basin Res. 2003, 15, 117–138. [Google Scholar] [CrossRef]
  12. Wang, Q.; Cao, J.; Shen, Z.; Tao, J.; Xiao, S.; Luo, L.; He, Q.; Tang, X. Chemical characteristics of PM2.5 during dust storms and air pollution events in Chengdu, China. Particuology 2012, 11, 70–77. [Google Scholar] [CrossRef]
  13. Hsu, N.C.; Tsay, S.-C.; King, M.D.; Herman, J.R. Deep Blue Retrievals of Asian Aerosol Properties during ACE-Asia. IEEE Trans. Geosci. Remote Sens. 2006, 44, 3180–3195. [Google Scholar] [CrossRef]
  14. Remer, L.; Kaufman, Y.; Tanré, D.; Mattoo, S.; Chu, D.; Martins, J.; Li, R.; Ichoku, C.; Levy, R.; Kleidman, R. The MODIS Aerosol Algorithm, Products and Validation. J. Atmos. Sci. 2005, 62, 947–973. [Google Scholar] [CrossRef]
  15. Remer, L.; Mattoo, S.; Levy, R.; Munchak, L. MODIS 3 km aerosol product: Algorithm and global perspective. Atmos. Meas. Tech. 2013, 6, 1829–1844. [Google Scholar] [CrossRef]
  16. Liu, X.; Chen, Q.; Che, H.; Zhang, R.; Gui, K.; Zhang, H.; Zhao, T. Spatial distribution and temporal variation of aerosol optical depth in the Sichuan basin, China, the recent ten years. Atmos. Environ. 2016, 147, 434–445. [Google Scholar] [CrossRef]
  17. Shi, G.; Liu, R.; Wang, D.Y.; Yang, F. Evaluation of the MODIS C6 Aerosol Optical Depth Products over Chongqing, China. Atmosphere 2017, 8, 227. [Google Scholar] [CrossRef]
  18. Lin, M.; Tao, J.; Chan, C.-Y.; Cao, J.-J.; Zhang, Z.-S.; Zhu, L.-H.; Zhang, R.-J. Characterization of Regression Relationship between Recent Air Quality and Visibility Changes in Megacities at Four Haze Regions of China. Aerosol Air Qual. Res. 2012, 12, 1049–1061. [Google Scholar] [CrossRef]
  19. Tao, J.; Zhang, L.; Cao, J.; Hsu, S.-C.; Xia, X.; Zhang, Z.; Lin, Z.; Cheng, T.; Zhang, R. Characterization and source apportionment of aerosol light extinction in Chengdu, southwest China. Atmos. Environ. 2014, 95, 552–562. [Google Scholar] [CrossRef]
  20. Tao, R.; Che, H.; Chen, Q.; Tao, J.; Wang, Y.; Sun, J.; Wang, H.; Zhang, X. Study of Aerosol Optical Properties Based on Ground Measurements over Sichuan Basin, China. Aerosol Air Qual. Res. 2014, 14, 905–915. [Google Scholar] [CrossRef]
  21. Dubovik, O.; King, M.D. A flexible inversion algorithm for retrieval of aerosol optical properties from Sun and sky radiance measurements. J. Geophys. Res. 2000, 105, 20673–20696. [Google Scholar] [CrossRef] [Green Version]
  22. Eck, T.F.; Holben, B.N.; Reid, J.; Giles, D.; Rivas, M.; Singh, R.P.; Tripathi, S.; Bruegge, C.; Platnick, S.; Arnold, G. Fog-and cloud-induced aerosol modification observed by the Aerosol Robotic Network (AERONET). J. Geophys. Res. Atmos. 2012, 117, 107–116. [Google Scholar] [CrossRef]
  23. Li, Z.; Eck, T.; Zhang, Y.; Zhang, Y.; Li, D.; Li, L.; Xu, H.; Hou, W.; Lv, Y.; Goloub, P. Observations of residual submicron fine aerosol particles related to cloud and fog processing during a major pollution event in Beijing. Atmos. Environ. 2014, 86, 187–192. [Google Scholar] [CrossRef]
  24. Dubovik, O.; Smirnov, A.; Holben, B.; King, M.; Kaufman, Y.; Eck, T.; Slutsker, I. Accuracy assessments of aerosol optical properties retrieved from Aerosol Robotic Network (AERONET) Sun and sky radiance measurements. J. Geophys. Res. Atmos. 2000, 105, 9791–9806. [Google Scholar] [CrossRef] [Green Version]
  25. O’Neill, N.; Eck, T.; Holben, B.; Smirnov, A.; Dubovik, O.; Royer, A. Bimodal size distribution influences on the variation of Angstrom derivatives in spectral and optical depth space. J. Geophys. Res. 2001, 106, 9787–9806. [Google Scholar] [CrossRef] [Green Version]
  26. Dubovik, O.; Sinyuk, A.; Lapyonok, T.; Holben, B.N.; Mishchenko, M.; Yang, P.; Eck, T.F.; Volten, H.; Muñoz, O.; Veihelmann, B. Application of spheroid models to account for aerosol particle nonsphericity in remote sensing of desert dust. J. Geophys. Res. Atmos. 2006, 111. [Google Scholar] [CrossRef] [Green Version]
  27. Holben, B.N.; Eck, T.; Slutsker, I.; Tanre, D.; Buis, J.; Setzer, A.; Vermote, E.; Reagan, J.; Kaufman, Y.; Nakajima, T. AERONET—A federated instrument network and data archive for aerosol characterization. Remote Sens. Environ. 1998, 66, 1–16. [Google Scholar] [CrossRef]
  28. Li, Z.; Xu, H.; Li, K.; Li, D.; Xie, Y.; Li, L.; Zhang, Y.; Gu, X.; Zhao, W.; Tian, Q. Comprehensive Study of Optical, Physical, Chemical, and Radiative Properties of Total Columnar Atmospheric Aerosols over China: An Overview of Sun–Sky Radiometer Observation Network (SONET) Measurements. Bull. Am. Meteorol. Soc. 2018, 99, 739–755. [Google Scholar] [CrossRef] [Green Version]
  29. Li, Z.; Blarel, L.; Podvin, T.; Goloub, P.; Buis, J.P.; Morel, J.P. Transferring the calibration of direct solar irradiance to diffuse-sky radiance measurements for CIMEL Sun-sky radiometers. Appl. Opt. 2008, 47, 1368–1377. [Google Scholar] [CrossRef]
  30. Holben, B.N.; Kim, J.; Sano, I.; Mukai, S.; Eck, T.F.; Giles, D.M.; Schafer, J.S.; Sinyuk, A.; Slutsker, I.; Smirnov, A. An overview of mesoscale aerosol processes, comparisons, and validation studies from DRAGON networks. Atmos. Chem. Phys. 2018, 18, 1–23. [Google Scholar] [CrossRef]
  31. Smirnov, A.; Holben, B.; Eck, T.; Dubovik, O.; Slutsker, I. Cloud-screening and quality control algorithms for the AERONET database. Remote Sens. Environ. 2000, 73, 337–349. [Google Scholar] [CrossRef]
  32. Zhang, Y.; Li, Z.; Zhang, Y.; Chen, Y.; Cuesta, J.; Ma, Y. Multi-peak accumulation and coarse modes observed from AERONET retrieved aerosol volume size distribution in Beijing. Meteorol. Atmos. Phys. 2016, 128, 537–544. [Google Scholar] [CrossRef]
  33. Cuesta, J.; Flamant, P.H.; Flamant, C. Synergetic technique combining elastic backscatter lidar data and sunphotometer AERONET inversion for retrieval by layer of aerosol optical and microphysical properties. Appl. Opt. 2008, 47, 4598–4611. [Google Scholar] [CrossRef] [PubMed]
  34. Zhang, Y.; Li, Z.; Zhang, Y.; Li, D.; Qie, L.; Che, H.; Xu, H. Estimation of aerosol complex refractive indices for both fine and coarse modes simultaneously based on AERONET remote sensing products. Atmos. Meas. Tech. 2017, 10, 1–17. [Google Scholar] [CrossRef]
  35. Heller, W. Remarks on Refractive Index Mixture Rules. J. Phys. Chem. 1965, 69, 1123–1129. [Google Scholar] [CrossRef]
  36. O’Neill, N.; Eck, T.; Smirnov, A.; Holben, B.; Thulasiraman, S. Spectral discrimination of coarse and fine mode optical depth. J. Geophys. Res. Atmos. 2003, 108. [Google Scholar] [CrossRef] [Green Version]
  37. Chen, Y.; Xie, S.-D. Characteristics and formation mechanism of a heavy air pollution episode caused by biomass burning in Chengdu, Southwest China. Sci. Total Environ. 2014, 473, 507–517. [Google Scholar] [CrossRef] [PubMed]
  38. Liu, Y.M.; Wu, G.X.; Liu, H.; Liu, P. Condensation heating of the Asian summer monsoon and the subtropical anticyclone in the Eastern Hemisphere. Clim. Dyn. 2001, 17, 327–338. [Google Scholar] [CrossRef]
  39. Kroll, J.H.; Seinfeld, J.H. Chemistry of secondary organic aerosol: Formation and evolution of low-volatility organics in the atmosphere. Atmos. Environ. 2008, 42, 3593–3624. [Google Scholar] [CrossRef]
  40. Gobbi, G.P.; Kaufman, Y.J.; Koren, I.; Eck, T.F. Classification of aerosol properties derived from AERONET direct sun data. Atmos. Chem. Phys. 2007, 7, 8713–8726. [Google Scholar] [CrossRef]
  41. Kaufman, Y.J. Aerosol optical thickness and atmospheric path radiance. J. Geophys. Res. Atmos. 1993, 98, 2677–2692. [Google Scholar] [CrossRef] [Green Version]
  42. King, M.D.; Byrne, D.M.; Herman, B.M.; Reagan, J.A. Aerosol Size Distributions Obtained by Inversion of Spectral Optical Depth Measurements. J. Atmos. Sci. 1978, 35, 2153–2167. [Google Scholar] [CrossRef]
  43. Gong, S.L.; Zhang, X.Y.; Zhao, T.L.; Mckendry, I.G.; Jaffe, D.A.; Lu, N.M. Characterization of soil dust aerosol in China and its transport and distribution during 2001 ACE-Asia: 2. Model simulation and validation. J. Geophys. Res. 2003, 108. [Google Scholar] [CrossRef] [Green Version]
  44. Wang, Y.; Sun, Y.; Xin, J.; Li, Z.; Wang, S.; Wang, P.; Hao, W.M.; Nordgren, B.L.; Chen, H.; Wang, L. Seasonal variations in aerosol optical properties over China. Atmos. Chem. Phys. Discuss. 2008, 8, 8431–8453. [Google Scholar] [CrossRef]
  45. Che, H.; Xia, X.; Zhu, J.; Li, Z.; Dubovik, O.; Holben, B.; Goloub, P.; Chen, H.; Estelles, V.; Cuevas-Agulló, E. Column aerosol optical properties and aerosol radiative forcing during a serious haze-fog month over North China Plain in 2013 based on ground-based sunphotometer measurements. Atmos. Chem. Phys. 2014, 14, 2125–2138. [Google Scholar] [CrossRef] [Green Version]
  46. Willeke, K.; Whitby, K. Atmospheric Aerosols: Size Distribution Interpretation. J. Air Pollut. Control Assoc. 1975, 25, 529–534. [Google Scholar] [CrossRef] [Green Version]
  47. Kulmala, M.; Vehkamäki, H.; Petäjä, T.; Maso, M.D.; Lauri, A.; Kerminen, V.M.; Birmili, W.; Mcmurry, P.H. Formation and growth rates of ultrafine atmospheric particles: A review of observations. J. Aerosol Sci. 2004, 35, 143–176. [Google Scholar] [CrossRef]
  48. Liu, X.; Li, J.; Qu, Y.; Han, T.; Hou, L.; Gu, J.; Chen, C.; Yang, Y.; Liu, X.; Yang, T. Formation and evolution mechanism of regional haze: A case study in the megacity Beijing, China. Atmos. Chem. Phys. 2013, 13, 4501–4514. [Google Scholar] [CrossRef]
  49. Hammer, E.; Gysel, M.; Roberts, G.C.; Elias, T.; Hofer, J.; Hoyle, C.R.; Bukowiecki, N.; Dupont, J.C.; Burnet, F.; Baltensperger, U. Size-dependent particle activation properties in fog during the ParisFog 2012/13 field campaign. Atmos. Chem. Phys. 2014, 14, 9475–9516. [Google Scholar] [CrossRef]
  50. Su, X.; Cao, J.; Li, Z.; Li, K.; Xu, H.; Liu, S.; Fan, X. Multi-Year Analyses of Columnar Aerosol Optical and Microphysical Properties in Xi’an, a Megacity in Northwestern China. Remote Sens. 2018, 10, 1169. [Google Scholar] [CrossRef]
  51. Dubovik, O.; Holben, B.; Eck, T.F.; Smirnov, A.; Kaufman, Y.J.; King, M.D.; Tanré, D.; Slutsker, I. Variability of Absorption and Optical Properties of Key Aerosol Types Observed in Worldwide Locations. J. Atmos. Sci. 2002, 59, 590–608. [Google Scholar] [CrossRef] [Green Version]
  52. Li, Z.; Gu, X.; Wang, L.; Li, D. Aerosol physical and chemical properties retrieved from ground-based remote sensing measurements during heavy haze days in Beijing winter. Atmos. Chem. Phys. 2013, 13, 10171–10183. [Google Scholar] [CrossRef] [Green Version]
  53. Wang, L.; Li, Z.-Q.; Li, D.-H.; Li, K.-T.; Tian, Q.J.; Li, L.; Zhang, Y.; Lv, Y. Retrieval of Dust Fraction of Atmospheric Aerosols Based on Spectra Characteristics of Refractive Indices Obtained from Remote Sensing Measurements. Spectrosc. Spectral Anal. 2012, 32, 1644. [Google Scholar]
  54. Schuster, G.L.; Dubovik, O.; Holben, B.N.; Clothiaux, E.E. Inferring black carbon content and specific absorption from Aerosol Robotic Network (AERONET) aerosol retrievals. J. Geophys. Res. Atmos. 2005, 110. [Google Scholar] [CrossRef] [Green Version]
  55. Bodhaine, B.A. Aerosol absorption measurements at Barrow, Mauna Loa, and the South Pole. J. Geophys. Res. Atmos. 1995, 100, 8967–8975. [Google Scholar] [CrossRef]
  56. Lee, K.H.; Li, Z.; Man, S.W.; Xin, J.; Wang, Y.; Hao, W.M.; Zhao, F. Aerosol single scattering albedo estimated across China from a combination of ground and satellite measurements. J. Geophys. Res. Atmos. 2007, 112. [Google Scholar] [CrossRef] [Green Version]
  57. Surabi, M.; James, H.; Larissa, N.; Yunfeng, L. Climate effects of black carbon aerosols in China and India. Science 2002, 297, 2250–2253. [Google Scholar]
  58. Hansen, J.E.; Sato, M.; Ruedy, R. Radiative forcing and climate response. J. Geophys. Res. Atmos. 1997, 102, 6831–6864. [Google Scholar] [CrossRef] [Green Version]
Figure 1. Topographic map of Sichuan province and location of the Sun-sky radiometer Observation NETwork (SONET) Chengdu site (marked with red dot). Data source is ASTER GDEM (Advanced Spaceborne Thermal Emission and Reflection Radiometer Global Digital Elevation Model).
Atmosphere 10 00046 g001
Figure 2. Monthly mean of aerosol optical depth (AOD), AODf, AODc at 440 nm and Angstrom Exponent (440–870 nm) in SONET Chengdu site from 2013 to 2016.
Atmosphere 10 00046 g002
Figure 3. The average sub-mode volume size distribution in Chengdu.
Atmosphere 10 00046 g003
Figure 4. The separated volume size distribution and sub-mode complex refractive index of multi-year average. The data source of (a) and (b) for total modes are from the inversion algorithm of SONET, and others (cf) are from the sub-mode algorithms. (a) Total volume size distribution (b) Total complex refractive index in four wavelengths; (c) Fine-mode volume size distribution; (d) Fine-mode complex refractive index; (e) Coarse-mode volume size distribution; (f) Coarse-mode complex refractive index; The solid lines in figure (b), (d), (f) are the real parts of complex refractive index, and the dash lines are the imaginary parts. The corresponding parameters are listed in Table 2.
Atmosphere 10 00046 g004
Figure 5. Seasonal variation of fine-mode volume size distribution (VSD) and complex refractive index (CRI) in SONET Chengdu site. The grey line refers to the total parameters. The corresponding parameters are listed in Table 2.
Atmosphere 10 00046 g005
Figure 6. Seasonal variation of coarse-mode VSD and CRI in SONET Chengdu site. The grey line refers to the total parameters. The corresponding parameters are listed in Table 2.
Atmosphere 10 00046 g006
Figure 7. Recovery of AOD at different wavelength based on the separated volume size distribution and sub-mode complex refractive index. N = 380 and curves (at 675 nm, 870 nm, 1020 nm) are shifted for a better viewing.
Atmosphere 10 00046 g007
Figure 8. The sub-mode single scattering albedo in different season based on the separated volume size distribution and sub-mode complex refractive index (ignore the influence of nonsphericity on dust aerosols). The grey, red, blue lines are the whole-, fine- and coarse-mode single scattering albedos (SSAs), respectively.
Atmosphere 10 00046 g008
Table 1. The parameters of sub-mode volume size distribution.
R (μm) σ V (μm3/μm2)
Fine0.17 ± 0.051.55 ± 0.180.10 ± 0.07
SMF0.31 ± 0.121.69 ± 0.280.09 ± 0.05
SMC1.62 ± 0.451.83 ± 0.350.07 ± 0.05
Coarse3.25 ± 0.991.82 ± 0.290.09 ± 0.05
Table 2. The separated volume size distribution and sub-mode complex refractive index in different seasons.
Aerosol PropertiesModeParameterMulti-Year AverageSpringSummerAutumnWinter
Real Part of Refractive IndexFineλ(440–1020 nm)1.43 ± 0.061.45 ± 0.051.38 ± 0.041.43 ± 0.061.45 ± 0.06
Coarseλ(440–1020 nm)1.46 ± 0.051.47 ± 0.051.41 ± 0.031.45 ± 0.041.48 ± 0.05
Totalλ(440 nm)1.43 ± 0.061.44 ± 0.051.38 ± 0.041.42 ± 0.061.44 ± 0.06
λ(675 nm)1.45 ± 0.051.46 ± 0.051.39 ± 0.031.44 ± 0.051.47 ± 0.05
λ(870 nm)1.46 ± 0.051.47 ± 0.051.41 ± 0.031.46 ± 0.041.48 ± 0.05
λ(1020 nm)1.46 ± 0.051.47 ± 0.051.41 ± 0.031.46 ± 0.041.49 ± 0.05
Imaginary Part of Refractive IndexFineλ(440 nm)0.011 ± 0.0060.010 ± 0.0060.006 ± 0.0040.010 ± 0.0050.014 ± 0.005
λ(675–1020 nm)0.012 ± 0.0090.011 ± 0.0140.008 ± 0.0050.011 ± 0.0060.015 ± 0.006
Coarseλ(440 nm)0.007 ± 0.0050.007 ± 0.0070.005 ± 0.0030.007 ± 0.0040.008 ± 0.003
λ(675–1020 nm)0.011 ± 0.0140.012 ± 0.0020.008 ± 0.0060.013 ± 0.0220.012 ± 0.007
Totalλ(440 nm)0.010 ± 0.0060.009 ± 0.0060.006 ± 0.0030.009 ± 0.0040.013 ± 0.005
λ(675 nm)0.007 ± 0.0050.007 ± 0.0070.005 ± 0.0030.006 ± 0.0040.008 ± 0.003
λ(870 nm)0.007 ± 0.0050.007 ± 0.0090.005 ± 0.0030.007 ± 0.0040.008 ± 0.003
λ(1020 nm)0.008 ± 0.0060.008 ± 0.0100.006 ± 0.0040.008 ± 0.0040.009 ± 0.004
Volume Particle Size DistributionFine R f 0.20 ± 0.050.20 ± 0.040.21 ± 0.050.18 ± 0.030.21 ± 0.05
Std f 0.55 ± 0.070.53 ± 0.060.54 ± 0.070.55 ± 0.060.56 ± 0.08
V f 0.15 ± 0.080.13 ± 0.060.17 ± 0.090.13 ± 0.070.16 ± 0.09
Coarse R c 2.86 ± 0.522.56 ± 0.433.08 ± 0.502.57 ± 0.413.05 ± 0.47
Std c 0.62 ± 0.060.64 ± 0.060.60 ± 0.060.63 ± 0.050.61 ± 0.07
V c 0.11 ± 0.060.12 ± 0.060.07 ± 0.050.12 ± 0.060.11 ± 0.05

