Article

Variations in Greenhouse Gas Fluxes in Response to Short-Term Changes in Weather Variables at Three Elevation Ranges, Wakiso District, Uganda

by
Nakiguli Fatumah
*,
Linus K. Munishi
and
Patrick A. Ndakidemi
The Nelson Mandela African Institution of Science and Technology, P.O. Box 447, Arusha, Tanzania
*
Author to whom correspondence should be addressed.
Atmosphere 2019, 10(11), 708; https://doi.org/10.3390/atmos10110708
Submission received: 9 September 2019 / Revised: 4 November 2019 / Accepted: 10 November 2019 / Published: 14 November 2019

Abstract

:
Weather conditions are among the major factors leading to the increasing greenhouse gas (GHG) fluxes from the agricultural soils. In this study, variations in the soil GHG fluxes with precipitation and soil temperatures at different elevation ranges in banana–coffee farms, in the Wakiso District, Uganda, were evaluated. The soil GHG fluxes were collected weekly, using the chamber method, and analyzed by using gas chromatography. Parallel soil temperature samples were collected by using a REOTEMP soil thermometer. Daily precipitation was measured with an automated weather station instrument installed on-site. The results showed that CO2, N2O, and CH4 fluxes were significantly different between the sites at different elevation ranges. Daily precipitation and soil temperatures significantly (p < 0.05) affected the soil GHG fluxes. Along an elevation gradient, daily precipitation and soil temperatures positively associated with the soil GHG fluxes. The combined factors of daily precipitation and soil temperatures also influence the soil GHG fluxes, but their effect was less than that of the single effects. Overall, daily precipitation and soil temperatures are key weather factors driving the soil GHG fluxes in time and space. This particular study suggests that agriculture at lower elevation levels would help reduce the magnitudes of the soil GHG fluxes. However, this study did not measure the soil GHG fluxes from the non-cultivated ecosystems. Therefore, future studies should focus on assessing the variations in the soil GHG fluxes from non-cultivated ecosystems relative to agriculture systems, at varying elevation ranges.

1. Introduction

Global warming and climate change are caused by the increasing concentration of atmospheric greenhouse gases (GHGs) emitted from the burning of fossil fuels and agricultural practices [1]. The most important GHGs causing global warming are carbon dioxide (CO2), methane (CH4), and nitrous oxide (N2O) [1,2]. Since the 19th century, there has been an unprecedented increase in the carbon footprint of agriculture [3]. The agriculture sector, which includes forestry and related land-use forms, contributes nearly 14% of the total global anthropogenic GHGs [4], where over 15% of it is emitted from the agricultural soils [1]. During the 20th century, the global temperature rose by 0.6 °C, which increased both the intensity and frequency of climate-change-induced extremes, such as drought and flooding, causing adverse effects in the agriculture sector [5]. The mean global temperature is projected to further increase within a range of 1.1 and 6.4 °C by 2099 [6]; as a result, this will further increase the intensity and frequency of the already erratic precipitation projected [7].
The projected rise in the global surface temperatures and erratic precipitation will further increase the intensity and frequency of climate-change-induced extremes, causing more adverse effects to the environment and agriculture [8]. The increase in food demand due to the growing global population will increase agricultural intensification. More than one billion hectares of additional fragile forest land is projected to be cleared for arable activities, which will further increase the agricultural GHG budget by up to 80% by 2050 [9].
The temperature and precipitation are the leading climatic factors influencing emission of the GHGs from the agricultural soils [10]. The rewetting of the soil after the onset of the rainy season, also called the “Birch effect” [11], increased the GHG fluxes—mainly soil CO2 flux—from different ecosystems, namely, savanna land [12], semiarid grass land use [13], and deserts [14]. During the Birch effect, the influence of precipitation on the production of the soil GHG fluxes correlated with soil microbes, soil pH, bulky density, and soil pore space [15]. In addition, the elevation and latitudinal location of an area influence the seasonal frequency and intensity of precipitation [16], which could also affect the soil GHG fluxes. The onset of the rainy season initiates infiltration of the rainwaters into dry soils, which displaces the CO2 gathered and withheld in the soil physical pores during the preceding dry season [17]. The seasonal precipitation increases soil moisture, which boosts the growth of fungal biomass and other microbial activities. The increase in the microbial biomass and activities increases soil aeration and respiration rate, which amplifies the production of CO2 [15,18] and N2O [19,20]. The increase in soil respiration from the microbial activities after the onset of precipitation could further accelerate the oxidation of soil organic matter, with transient effects on the seasonal GHG fluxes. However, a complete understanding of the effect of seasonal precipitation and soil temperature on the GHGs emission at different elevation ranges has not been achieved, and only a few studies have quantified aggregate GHGs emissions from the agricultural sector in sub-Saharan Africa (SSA) [21,22].
Seasonal precipitation and temperatures are among the most important weather parameters influencing agriculture production in the SSA region [23]. The temporal variation in precipitation and soil temperatures is dependent on the latitude and elevation of a specific area [16]. Climate-change models project a general increase in frequency and magnitude of extreme temperatures and erratic precipitation across the SSA region over the 21st century [22]. Uganda is one of the SSA countries that is most vulnerable to the aggravated climate change impacts, coupled with extreme poverty and food insecurity [24]. Therefore, a better understanding of how short-term precipitation and soil temperature could affect the soil GHG fluxes at the altitude of any locality is needed to inform local climate change mitigation and adaptation actions. This is because deficient empirical data could compromise accurate estimations of the soil GHG fluxes from the SSA agricultural systems [21], and consequently lead to misdirection of the limited financial resources, local GHG mitigation actions, and policy interventions [25]. In this study, therefore, the effect of daily precipitation and soil temperatures on the soil GHG (CO2, N2O, and CH4) fluxes at three elevation ranges was evaluated. The relationships between the soil GHG fluxes and the daily precipitation and soil temperature were assessed. The influence of the combined effect of daily precipitation and soil temperature at varying elevation ranges on soil GHG fluxes was also determined. It was hypothesized that (i) the daily precipitation and the soil temperatures could significantly influence the soil GHG fluxes at the different elevation ranges and (ii) the influence of the combined effects of daily precipitation and the soil temperatures on GHG fluxes could be higher than their single effect.

2. Materials and Methods

2.1. Site Description

The study was conducted during the wet season, from March to June 2018, in the Wakiso District (0°22′29″ N, 32°26′36″ E), Uganda. Wakiso District lies at an altitude between 900 and 1340 m above mean sea level [26]. The topography of the Wakiso District is undulating, characterized by flat-topped hills, which are dissected by broad valleys that are occupied by swamps. The study area has tropical climatic conditions, with a mean annual precipitation of 1320 mm. Between 2005 and 2018, the mean monthly minimum and maximum surface air temperatures of the district were 11.0 and 33.3 °C, respectively [27].
Three model farms (banana–coffee mixed farms) were selected based on the elevational differences (Figure 1). These farms were established in 2015 by Makerere University, School of Agriculture, at varying elevations, to determine the influence of elevation on crop yields. Farm C was established at an elevation range of 900–1000 m a.s.l, farm B was established between 1100 and 1200 m a.s.l, while farm A was established between 1200 and 1340 m a.s.l. The soil in the study sites was a sandy clay loam: 52.5% sandy, 35.3% clay, pH (CaCl2) = 5.9 at farm A; 52.0% sandy, 34.9% clay, pH (CaCl2) = 5.4 at farm B; and 52.1% sandy, 35.0% clay, pH (CaCl2) = 5.0 at farm C. They were classified as Lixic Ferralsols by FAO [28]. The farms were tilled once a year, and mulches from live biomass (elephant grass and crop residues, mainly common beans) at a thickness of 3–5 cm were used. The mulches suppressed weeds and provided manure, since synthetic fertilizers were not applied.

2.2. Experimental Layout

Two plots (5 × 5 m) were established on each experimental site. The chambers were placed randomly in each plot, based on the position of minimal canopy coverage, in order to reduce the effect of the canopy on precipitation and sunlight. The greenhouse-gas fluxes, daily precipitation, and soil temperatures were measured in duplicates within each plot, and the values were averaged as described in Section 2.5. Repetitive field data for soil GHG fluxes, the soil temperatures, and precipitation were collected on a weekly basis.

2.3. Measurement of Precipitation and Soil Temperature

For each sampling day, the daily precipitation was recorded with a rain gauge embedded in the automatic-weather-station instruments (model: JL-03-Q4; Shandong, China). The soil temperatures were measured at the same time duration as GHG sampling during the whole experimental period. Soil temperature was measured between a depth of 0 and 12 cm by using a REOTEMP soil thermometer (model: REOTEMP, San Diego, CA, USA).

2.4. Soil Sampling and Analysis

The soil sample (0–15 cm depth) was collected from each plot during gas sampling, for the entire sampling period. Soil physical and chemical properties were analyzed following standard procedures. Total N and soil organic C were analyzed by a dry combustion method, using a C/N analyzer [29]. A 1:25 wet-soil-to-extract-volume ratio method was used to determine the soil pH, following the protocols described by Rayment and Higginson [30]. Bulk density was obtained by using the core method, following protocols outlined by Blake [31]. Soil texture (sand and clay) of the samples was determined by using the particle-size-distribution method, following procedures of Rayment and Higginson [30].

2.5. Greenhouse Gas Fluxes: Sampling and Analysis

The soil GHG fluxes were collected by using the static chamber method [32] for four months (04 May 2018 to 28 June 2018). The chamber method was used because it allows gas samples to be stored for future analysis and can be deployed in small plots. The chambers consisted of two parts: the base (14 cm × 20 cm × 16 cm), which was inserted 5 cm into the soil, and the lid (14 cm × 20 cm × 18 cm). The frame base was fixed in the soil for the whole experiment period. The lids were equipped with thermometers, in order to measure the internal temperature. The two pieces were held together with clamps and foam placed between them, to form an airtight seal. The measurement was conducted after every five days, four to five times per month. Three chambers in total were installed at each site. At each point of sample collection, the mulches and weeds growing in the chamber were cut, and the chambers were placed on the bare soil, to capture the soil GHG fluxes. The chambers were installed 2 days before the first soil GHG flux measurements, to minimize soil disturbances and disruption in soil microclimate [33]. To make turbulence when chambers were closed, a fan was installed on the top wall inside each chamber. The outside of the chambers was insulated with the white cover, to reduce the impact of direct radiative heating during sampling [34,35]. The top of the chambers contained rubber septa, through which a syringe was inserted to collect air samples after the closing of the chamber [36]. The air samples (15 mL) were taken from the chamber at 0, 30, 45, and 60 min intervals, following linear stabilization of the soil fluxes produced [32,37]. The collected air samples were immediately injected into the pre-evacuated airtight gas vial tubes (12 mL) capped with butyl rubber stoppers (Voigt Global Distribution Inc, Lawrence, Kansas, USA). The soil GHG fluxes were measured in the morning hours, between 9:00 am and 11:30 am, for comparability enhancement of the data, measuring in different days [38]. The measurements were used to represent the daily average flux value [39].
The gas chromatography (GC) (model 8610C, SRI Instruments, Torrance, CA, USA) method was used to determine the concentration of the soil CO2, CH4, and N2O fluxes within 48 h. To facilitate the sample injection to the GC, an auto-sampler (Teledyne Tekmar, Mason, OH, USA) was connected to the GC, as described by Arnold et al. [40], via a sample valve with a 1.0 mL sample loop. The stainless-steel packed column (diameter = 0.3175 cm; length = 74.54 cm), with Haysep D contained in the GC column oven at 50 °C, was used for separating the component in gas mixtures. The soil CH4 and CO2 fluxes were analyzed by using a flame ionization detector set at a temperature of 350 °C, with hydrogen as a carrier. The air and hydrogen gas flow rates were set at 210 and 25 mL per minute, respectively. The CO2 flux was converted to CH4 flux through a methanizer packed with a nickel catalyst powder [41]. The N2O was quantified by using an electron-capture detector set at a temperature of 330 °C. The nitrogen was used as a carrier and set at a flow rate of 20 mL per minute. The GC machine was calibrated to read the gas sample concentrations in parts per million (ppm), and the GHGs readings were reflected along with calibrated line graphs. The standards of CO2 (100, 1000, and 10,000 µg m−3), CH4 (10, 100, and 1000 µg m−3), and N2O (1 and 100 µg m−3) obtained from Makerere University were used.
The mean values for the concentrations of the soil GHG (CO2, CH4, and N2O) samples taken at 0, 30, 45, and 60 min intervals were computed and converted from ppm to µg m−2 h−1, following protocols described by Liu et al. [42]. The mean concentration of the GHG fluxes and the volume of the gas chambers were standardized, as described in Equation (1):
GHG   Concentration   ( µ g · m 2 · h r 1 ) = ( Δ C Δ t ) × V A × P × M R × ( T + 273.15 )
where: (ΔC/Δt) is the concentration of GHG in the chamber during the closure time (ppm per hour); V is the volume of the chamber (m3); A is the base area of the chamber (m2); P is the atmospheric pressure; M is the molecular mass of the gas (g mol−1); R is the gas constant (8.3145 J mol−1 K−1); and T is the air temperature (°C) in the gas sampling chamber.

2.6. Statistical Analysis

A repeated measures analysis of variance (ANOVA) was used to test for the main effect of soil temperature, daily precipitation, and their interactive effect on the soil GHG fluxes. The data were tested for normal distribution before analysis, using the Shapiro–Wilk test for goodness of fit, and homoscedasticity was evaluated by using Levene’s test for equality of variances. To avoid multi-collinearity and autocorrelations between independent variables (daily precipitation and soil temperatures), collinearity diagnostic tests were performed.
The Pearson correlation method and simple regression analysis were used for relating mean GHG fluxes to site data (daily precipitation and soil temperatures) when data were normally distributed. The Spearman rank correlation was used to test relationships between GHG fluxes and site data when data were not normally distributed. Regression model fitting (linear or quadratic function) were selected via the Bayesian information criterion (BIC), following the procedures of Schwarz [43]. Statistical analyses were performed in Statistical Package for the Social Sciences (SPSS) version 20.0 (SPSS, Chicago, IL, USA). All results are shown as arithmetic means ± standard error (SE), with the analyses performed at a 95% confidence interval.

3. Results

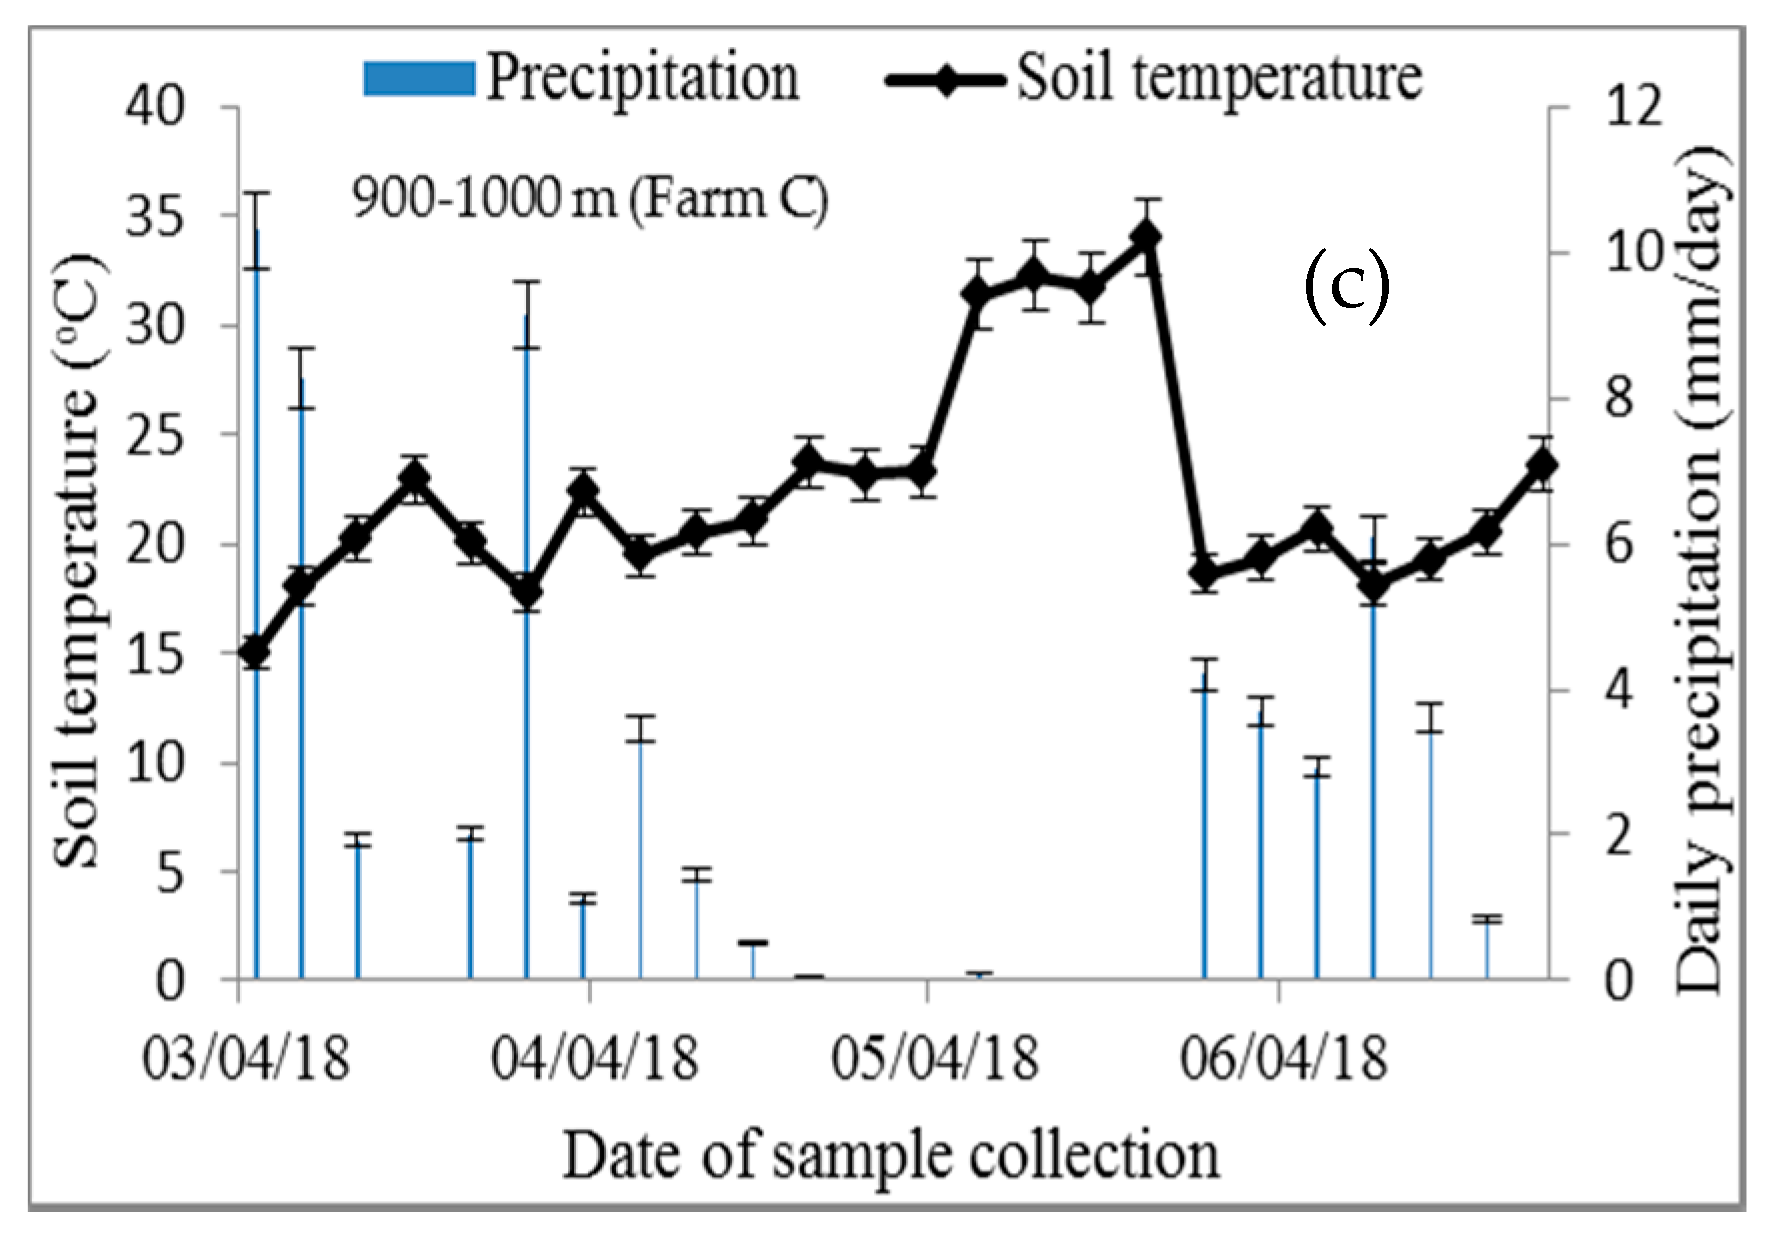
3.1. Precipitation and Soil Temperatures in the Study Sites

Large weekly variation in daily precipitation was observed from March to June in 2018, with a dry spell in the last days of May. As expected, higher precipitation was observed at the higher elevations (>1200 m), and precipitation decreased at lower elevations (900–1800 m) (Figure 2). On average, precipitation was 3.5 mm/day at 1200–1340 m (farm A), 2.6 mm/day at 1100–1200 m (farm B), and 3.0 mm/day at 900–1000 m (farm C) (Figure 2). The total precipitation for the entire sampling period (March, April, May, and June) was 561, 477, and 395 mm, at 1200–1340 m (farm A), 1100–1200 m (farm B), and 900–1000 m (farm C), respectively. The amount of precipitation was higher in March and June and lowest in May at all the elevation ranges. On average, the soil temperatures in the upper 12 cm were higher at 900–1000 m (farm C), followed by 1100–1200 m (farm B), and lowest at 1200–1340 m (farm A), with the mean values of 23.2, 21.1, and 20.5 °C, respectively (Figure 2).

3.2. Physical–Chemical Characterization of the Soil Sampled at the Studied Sites

The physical–chemical properties of the soil in the studied sites are presented in Table 1. The nitrogen and carbon content was highly variable at each elevation range and greater at the higher elevations compared to the lower elevations. The nitrogen content was 4.8 ± 2.1 g kg−1 at 1200–1340 m (farm A), 3.6 ± 1.1 g kg−1 at 1100–1200 m (farm B), and 2.4 ± 1.2 g kg−1 at 900–1000 m (farm C). The carbon content was 17.8 ± 5.8 g kg−1 at 1200–1340 m (farm A), 15.9 ± 5.5 g kg−1 at 1100–1200 m (farm B), and 12.9 ± 3.4 g kg−1 at 900–1000 m (farm C). Similarly, the soil bulk densities were greater at the higher elevation sites (1.5 ± 0.2 g m−3 at 1200–1340 m and 1.3 ± 0.1 g m−3 at 1100–1200 m) compared to the lower elevation site (1.0 ± 0.1 g m–3 at 900–1000 m) (Table 1).

3.3. Spatial and Temporal Variation in the Soil Greenhouse-Gas Fluxes

The soil greenhouse-gas fluxes varied both spatially and temporally (Figure 3). The soil GHG fluxes were higher on wet days than dry days. The lowest soil GHG fluxes were observed during the dry spell, which occurred in May (Figure 3). The soil GHG fluxes followed similar patterns, but they varied in magnitude at all the elevation ranges.

3.4. Effect of the Daily Precipitation and Soil Temperatures on the Soil Greenhouse-Gas Fluxes

Table 2 presents the mean values of the soil GHG fluxes at different elevation ranges and the effect of daily precipitation and soil temperatures on the soil GHG fluxes. The highest soil GHG (CO2, N2O, and CH4) fluxes were observed at 1200–1340 m (farm A), followed by 1100–1200 m (farm B), and the lowest at 900–1000 m (farm C) (Table 2). The soil CO2 flux varied significantly (p < 0.05) between the elevation ranges, with the means of 87.42 ± 5.6 µg C m−2 h−1, 67.62 ± 4.4 µg C m−2 h−1, and 52.41 ± 3.9 µg C m−2 h−1 at 1200–1340 m (farm A), 1100–1200 m (farm B), and 900–1000 m (farm C), respectively. Similarly, the soil N2O flux varied significantly (p < 0.05) between the elevation ranges. The highest soil N2O flux was observed at 1200–1340 m (farm A), with a mean of 6.82 ± 0.8 µg N m−2 h−1, followed by 1100–1200 m (farm B), with a mean of 4.75 ± 0.7 µg N m−2 h−1. The lowest soil N2O flux was emitted at an elevation range of 900–1000 m (farm C), with a mean of 3.65 ± 0.6 µg N m−2 h−1. Both negative and positive soil CH4 flux were observed (Figure 3A). The soil CH4 flux ranged from –0.33 to 0.82 µg C m−2 h−1 (mean: 0.31 ± 0.01 µg C m−2 h−1) at 1200–1340 m (farm A), −0.4 to 0.62 µg C m−2 h−1 (mean: 0.20 ± 0.01 µg C m−2 h−1) at 1100–1200 m (farm B), and −0.5 to 0.43 µg C m−2 h−1 (mean: 0.04 ± 0.00 µg C m−2 h−1) at 900–1000 m (farm C) (Table 2).
The daily precipitation and soil temperatures significantly (p < 0.05) influenced all the soil GHG (CO2, N2O, and CH4) fluxes. Hence, the hypothesis that daily precipitation and soil temperatures could significantly influence the soil GHG fluxes received empirical evidence. Likewise, the combined effect of soil temperatures and daily precipitation significantly (p < 0.05) affected soil CO2 and N2O fluxes (Table 2). However, the influence of the combined effect on the soil GHG fluxes was less than that of the single effects, hence the hypothesis that the combined effect could influence the soil GHG fluxes more than their single effect was rejected.

3.5. Relationship between the Daily Precipitation, Soil Temperatures, and Soil Greenhouse-Gas Fluxes

Figure 4A,B shows the correlation between the daily precipitation, soil temperatures, and the soil GHG fluxes at three elevation ranges (1200–1340 m, 1100–1200 m, and 900–1000 m). Varying patterns of changes over time in the soil CO2, N2O, and CH4 fluxes were observed at the elevation ranges in response to increasing daily precipitation and soil temperatures (Figure 4A,B). During the sampling period, the soil GHG fluxes showed increasing trends, with small fluctuation in the soil temperatures (Figure 4B).
The amount of the daily precipitation affected the magnitude of the soil GHG fluxes at the different elevation ranges. Daily precipitation positively associated with the soil GHG (CO2, N2O, and CH4) fluxes (Figure 4A). Strong and significant (p < 0.05) relationships were observed between soil CO2 flux with daily precipitation with Adj. R2 of 0.84, 0.77, and 0.80, at 1200–1340 m (farm A), 1100–1200 m (farm B), and 900–1000 m (farm C), respectively. The soil N2O flux strongly correlated with the daily precipitation with Adj. R2 = 0.81, 0.90, and 0.91, at 1200–1340 m (farm A), 1100–1200 m (farm B), and 900–1000 m (farm C), respectively. Similarly, the soil CH4 flux positively associated with daily precipitation with Adj. R2 of 0.70, 0.70, and 0.58, at 1200–1340 m (farm A), 1100–1200 m (farm B), and 900–1000 m (farm C), respectively (Figure 4A).
Similarly, there were strong relationships between the soil CO2 flux and the soil temperatures at all the elevation ranges with Adj. R2 of 0.93, 0.91, and 0.89, at 1200–1340 m (farm A), 1100–1200 m (farm B), and 900–1000 m (farm C), respectively. The soil N2O flux also strongly correlated with the soil temperatures with Adj. R2 of 0.90, 0.96, and 0.81, at 1200–1340 m (farm A), 1100–1200 m (farm B), and 900–1000 m (farm C), respectively. Similarly, the soil CH4 flux strongly associated with the soil temperatures with Adj. R2 of 0.92, 0.93, and 0.88 at 1200–1340 m (farm A), 1100–1200 m (farm B), and 900–1000 m (farm C), respectively (Figure 4B).

4. Discussion

4.1. Spatial and Temporal Variation in the Soil Greenhouse Gas Fluxes

The soil GHG fluxes varied both spatially and temporally (Figure 3). These variations in the soil GHG fluxes could be attributed to the differences in weather conditions and the physiochemical properties of the soil at the different elevation ranges. For example, Novara et al. [44] reported that the soil physiochemical properties can alter the ecosystem and affect its source and sink capacity for the soil GHG fluxes. Carbon, nitrogen, soil pH, and bulky density can influence the biogeochemical activities, which are the processes affecting the soil GHG fluxes [45]. In the current study, the nitrogen and carbon contents were higher at the 1200–1340 m (farm A) range than the other elevation ranges (1100–1200 m (farm B) and 900–1000 m (farm C)), which could have led to the higher soil GHG fluxes at 1200–1340 m (farm A) (Table 1).
The climate variables also affect the biogeochemical processes, which are important in the carbon and nitrogen cycles that influence the production of the soil GHG fluxes [46]. The differences in the amount of precipitation and soil temperatures at the elevation ranges could have resulted in the variations in the magnitude of the soil GHG fluxes spatially. The soil moisture changes through precipitation variability is an important factor limiting microbial biomass and activity in soils [47], hence affecting the soil GHG fluxes [48]. The precipitation amount varied significantly between the elevation ranges (Table 2), and this is likely to be one of the major reasons for the difference in the soil GHG fluxes emitted at the different elevation ranges. Scott-Denton et al. [49] reported that the quantity of CO2 fluxes from the agricultural soil is dependent on soil carbon content, moisture, and temperatures. Hence, the increase in the soil temperatures and moisture accelerate the microbial decomposition of the soil organic matter [50] and thereby influences the emission rates. The temporal variations in the soil GHG fluxes are likely to be caused by the short-term fluctuations in precipitation and soil temperatures in the days of sampling at each elevation range, which might have differently affected the soil microbes.

4.2. The Effect of Daily Precipitation on the Soil Greenhouse-Gas Fluxes

The soil GHG fluxes increased significantly with increasing daily precipitation (Figure 4A), which is in good accord with the results from the literature, which reported increasing soil GHG fluxes with increasing precipitation [1,51]. The precipitation increases the soil moisture content, which instantaneously influences the soil microbes, soil pH, bulky density, and soil pore space [15,52], hence releasing the GHG fluxes. The increase in the soil microbial activities enhances soil respiration and aeration, which tend to physically boost the production of CO2 [15,18] and N2O [20]. The onset of precipitation also directly influences the soil microbes [53], through reducing the water limitations to the soil microbes and, hence, increasing their respiration and releasing oxidized soil carbon in the form of CO2 [54]. Högberg et al. [55] further explained that the increasing precipitation tends to increase soil respiration indirectly by increasing plant photosynthesis, causing further physical changes in the micro soil environment. Smith et al. [56] attributed the increase in soil CO2 flux during precipitation to disturbance of the soil aggregate structures which increase substrate supplies and facilitate oxidation of the soil carbon and CO2 release. This mechanism could further be explained by the fact that the increase in the soil moisture after precipitation indirectly affects soil temperature and respiration of the temperature-sensitive microbes [57].
The soil N2O flux increased significantly with increasing daily precipitation (Figure 4A). The increase in the precipitation-induced soil moisture could have been a crucial factor regulating partitioning of soil N2O flux between denitrification and nitrification sources [58,59]. The rewetting of the soil after a dry season could have increased the microbial community and activities, which led to rapid consumption of the accumulated mineral N and organic substrates and accelerated the release of the soil N2O flux [60]. Additionally, the increasing precipitation may stimulate soil N2O flux from denitrification by increasing soil N and C availability [61], whereas a reduction in precipitation stimulates soil aeration, resulting in unfavorable conditions for soil N2O flux production by denitrification process [62]. Similarly, the decreasing precipitation may affect nitrifiers by reducing their growth rate, hence leading to reduced soil N2O flux [63].
In this study, daily precipitation events exerted a great influence on the soil CH4 flux in the banana–coffee farms. The soil CH4 flux was positively affected by daily precipitation (Figure 4A). However, both negative and positive soil CH4 fluxes were observed (Figure 3A). Other studies in the agricultural soils e.g., Bayer et al. [64] and Chan and Parkin [65], assessed CH4 flux in the no-till cropping systems of grass and legume cover crops and non-manured agricultural sites, respectively, and observed both negative and positive soil CH4 flux, as well. Baggs et al. [66], also observed soil CH4 production from an agroforestry system during a rainy season. The release of the soil CH4 flux from the soil could be linked to the increase in moisture of the soil after the precipitation event [67]. The presence of both methanogens and methanotrophs in any terrestrial ecosystems depends on the soil moisture content [68,69], and they can simultaneously be active in the same ecosystem [70]. Flooding events were frequent in the studied areas during the wet season, and this could have caused the positive soil CH4 flux from the banana–coffee farms. One of the leading mechanisms behind the increased soil CH4 flux in the soil is decreasing O2 diffusion [71]. The flooding episodes could have led to poorly drained soils, resulting in CH4 production [72]. As reported by Chamberlain et al. [73], soil CH4 flux from a flooded ecosystem can be a product of CH4 production, consumption, and transport within soils and water. This is because the production and consumption of CH4 in soils is influenced by the position of the water table and O2 status [74]. The rise in the water table tends to create anaerobic conditions, leading to CH4 production by methanogens [75].
However, the current study used daily precipitation as a proxy for soil moisture, which could have influenced the magnitude of the soil GHG fluxes. This is because moisture tends to build up in the soil ecosystem over subsequent days to weeks, during the wet season [76]; this might have influenced the soil GHG fluxes.

4.3. The Effect of the Soil Temperatures on the Soil Greenhouse-Gas Fluxes

The soil GHG (CO2, N2O, and CH4) fluxes significantly increased with the soil temperatures (Figure 4B). The current results are consistent with the findings of Zhou et al. [77], who observed a 13% increase in CO2 emissions for every 2 °C rise in the soil temperatures. The increase in soil temperatures could have caused the increase in microbial activities and, hence, accelerated the production of the GHG fluxes [78]. The increase in the soil temperatures affects the soil respiration, leading to an increase in the soil CO2 flux [51,79]. Sensitivity in soil C pool due to changes in the soil temperatures could also partly explain the increase in soil CO2 flux [80].
The soil N2O flux increased with soil temperatures, and this could be contributed to by nitrification processes, which are accelerated by increasing soil temperatures and vice versa [81]. Several studies have also reported a directly proportional relationship between the soil N2O flux from agricultural soils and the soil temperatures [58,82]. The increase in the soil temperatures tends to enhance the composition and activities of the nitrifiers, which then accelerate production of the soil N2O flux [82,83]. In this study, however, soil N2O flux increased with soil temperatures up to a maximum level (at 30 °C), beyond which the flux started to decrease. The observations are in agreement with the findings of Hartmann and Niklaus [84], who reported that the rate of production of the soil N2O emissions declines under extreme temperatures. The decline in the soil N2O flux under extreme soil temperatures could be partly explained by a subsequent abrupt reduction in the soil moisture due to direct evaporation and evapotranspiration processes, which inhibits the nitrification and denitrification processes in the dehydrated soils [84].
The soil CH4 flux exhibited a positive trend with the soil temperatures (Figure 4B). While studies by Butterbach-Bahl and Papen [85] and Oelbermann and Schiff [86] reported an increase in the soil CH4 flux with temperatures, Tu and Li [87] reported a gradual decrease in the soil CH4 flux with increasing temperature. These variations indicate that the response of the soil CH4 flux to soil temperature is more varied. The increase in the soil CH4 flux could have been contributed to by a balance in the biological process between the soil CH4 production by methanogens and consumption by methanotrophs [88]. The soil CH4 flux could have been enhanced by the increasing soil respiration rates with increasing soil temperatures, at decreasing O2 concentrations in the soil [88].

4.4. Influence of the Combined Effect of Daily Precipitation and Soil Temperatures on the Soil Greenhouse-Gas Fluxes

The combined effect of daily precipitation and the soil temperatures significantly affected the GHG fluxes (Table 2). The current results are in line with the findings of Sjögersten et al. [89], who study CO2 and CH4 fluxes in the tropical peatlands and observed that the interaction of moisture and temperature significantly influenced both soil CO2 and CH4 fluxes. Similarly, Smith et al. [56] reported that the interactions of drought and wetting of the soil significantly influenced CO2 and CH4 emissions. However, the influence of the combined effect on the soil GHG fluxes was less than that of the single effects, which contrasted with the findings of Smith et al. [56].The influence of the combined effect on the soil GHG fluxes could be explained by various factors. For example, soil temperatures influence soil respiration in moderately wet soils relative to the dry soils [90]. Additionally, “when both temperature and moisture are not at their extremes, the two factors interactively influence soil respiration” [91], leading to increased soil GHG fluxes.

5. Conclusions

In this study, the soil GHG (CO2, N2O, and CH4) fluxes were observed at three elevation ranges (1200–1340 m, 1100–1200 m, and 900–1000 m) in the banana–coffee farms, during the wet season in the Wakiso District, Uganda. The soil GHG fluxes varied significantly (p < 0.05) between the elevation ranges. The highest soil GHG (CO2, N2O, and CH4) fluxes were observed at 1200–1340 m (farm A), followed by 1100–1200 m (farm B), and the lowest were observed at 900–1000 m (farm C). Not surprisingly, the soil carbon and nitrogen contents were higher at the higher elevation range (1200–1340 m/farm A) compared to the lower elevation range (900–1000 m/farm C). These results imply that elevation has the ability to dramatically influence soil C and N pools and further affect the response of the GHG fluxes from the soil. Therefore, this particular study suggests that agriculture at lower elevation levels would help reduce the magnitudes of the soil CO2, N2O, and CH4 fluxes, which are currently the most important GHGs affecting the globe. This could be recommended as a mitigation option in agriculture at the farm level. However, this study did not measure the soil GHG fluxes from the non-cultivated ecosystems. Therefore, future studies should focus on assessing the variations in the soil GHG fluxes from non-cultivated ecosystems relative to agriculture systems at varying elevation ranges.
The effects of the daily precipitation and the soil temperatures on the soil GHG fluxes were evaluated. The daily precipitation and the soil temperatures significantly affected all the soil GHG fluxes at all the elevation ranges. At each elevation range, the daily precipitation and the soil temperatures positively associated with the soil GHG fluxes. Both positive and negative soil CH4 fluxes were observed, while only positive soil CO2 and N2O fluxes were observed. From the ANOVA, the influence of the main effects on the soil GHG fluxes was greater than the influence of the combined effects (i.e., soil temperatures × daily precipitation). The soil CH4 flux was not influenced by the combined effects of daily precipitation and the soil temperatures.
Overall, the current findings highlight that both daily precipitation and the soil temperatures are key weather factors driving soil GHG fluxes at both spatial and temporal scales. The daily precipitation had stronger impacts on the soil GHG fluxes than the soil temperatures. This indicates that daily precipitation played a dominant role in regulating the level of GHG exchange in the banana–coffee farms at all the studied elevation ranges.

Author Contributions

N.F. conceptualized the research idea, methodology, data collection, and analysis; P.A.N. and L.K.M. provided technical assistance, editing of the manuscript, and supervision.

Funding

This research was funded by German Academic Exchange Services (DAAD), in collaboration with the Regional Universities Forum for Capacity Building in Agriculture (RUFORUM), grant number 91671794.

Conflicts of Interest

The authors declare no conflicts of interest.

References

  1. IPCC. Climate Change 2013: The Physical Science Basis. Contribution of Working Group I to the Fifth Assessment Report of the Intergovernmental Panel on Climate Change; Stocker, T.F., Qin, D., Plattner, G.-K., Tignor, M., Allen, S.K., Boschung, J., Nauels, A., Xia, Y., Bex, V., Midgley, P.M., Eds.; Cambridge University Press: Cambridge, UK; New York, NY, USA, 2013; p. 1535. [Google Scholar]
  2. Hansen, J.; Sato, M.; Kharecha, P.; Russell, G.; Lea, D.W.; Siddall, M. Climate change and trace gases. Philos. Trans. R. Soc. A 2007, 365, 1925–1954. [Google Scholar] [CrossRef] [PubMed]
  3. Sanderman, J.; Hengl, T.; Fiske, G.J. Soil carbon debt of 12,000 years of human land use. Proc. Natl. Acad. Sci. USA 2017, 114, 9575–9580. [Google Scholar] [CrossRef] [PubMed]
  4. Smith, P.; Bustamante, M.; Ahammad, H.; Clark, H.; Dong, H.; Elsiddig, E.A. Chapter 11—Agriculture, forestry and other land use (AFOLU). In Climate Change 2014: Mitigation of Climate Change. IPCC Working Group III Contribution to AR5; Cambridge University Press: Cambridge, UK, 2014. [Google Scholar]
  5. IPCC. Climate Change 2014: Synthesis Report. Contribution of Working Groups I, II and III to the Fifth Assessment Report of the Intergovernmental Panel on Climate Change; Core Writing Team, Pachauri, R.K., Meyer, L.A., Eds.; IPCC: Geneva, Switzerland, 2014; p. 151. [Google Scholar]
  6. IPCC. Summary for Policymakers. Climate Change 2007: The Physical Science Basis. Contribution of Working Group I to the Fourth Assessment Report of the Intergovernmental Panel on Climate Change; Solomon, S., Qin, D., Manning, M., Chen, Z., Marquis, M., Averyt, K.B., Tignor, M., Miller, H.L., Eds.; Cambridge University Press: Cambridge, UK; New York, NY, USA, 2007. [Google Scholar] [CrossRef]
  7. Donat, M.G.; Lowry, A.L.; Alexander, L.V.; O’Gorman, P.A.; Maher, N. More extreme precipitation in the world’s dry and wet regions. Nat. Clim. Chang. 2016, 6, 508–513. [Google Scholar] [CrossRef]
  8. Dijkstra, F.A.; Prior, S.A.; Runion, G.B.; Torbert, H.A.; Tian, H.; Lu, C.; Venterea, R.T. Effects of elevated carbon dioxide and increased temperature on methane and nitrous oxide fluxes: Evidence from field experiments. Front. Ecol. Environ. 2012, 10, 520–527. [Google Scholar] [CrossRef]
  9. Tilman, D.; Balzer, C.; Hill, J.; Befort, B.L. Global food demand and the sustainable intensification of agriculture. Proc. Natl. Acad. Sci. USA 2011, 108, 20260–20264. [Google Scholar] [CrossRef] [PubMed]
  10. Bloor, J.M.G.; Bardgett, R.D. Stability of above-ground and below-ground processes to extreme drought in model grassland ecosystems: Interactions with plant species diversity and soil nitrogen availability. Perspect. Plant. Ecol. Evol. Syst. 2012, 14, 193–204. [Google Scholar] [CrossRef]
  11. Birch, H.F. Mineralisation of plant nitrogen following alternate wet and dry conditions. Plant. Soil 1964, 20, 43–49. [Google Scholar] [CrossRef]
  12. Fan, Z.; Neff, J.C.; Hanan, N.P. Modeling pulsed soil respiration in an African savanna ecosystem. Agric. For. Meteorol. 2015, 200, 282–292. [Google Scholar] [CrossRef]
  13. López-Ballesteros, A.; Serrano-Ortiz, P.; Sánchez-Cañete, E.P.; Oyonarte, C.; Kowalski, A.S.; Pérez-Priego, Ó.; Domingo, F. Enhancement of the net CO2 release of a semiarid grassland in SE Spain by rain pulses. J. Geophys. Res. 2016, 121, 52–66. [Google Scholar] [CrossRef]
  14. Ma, J.; Zheng, X.J.; Li, Y. The response of CO2 flux to rain pulses at a saline desert. Hydrol. Process. 2012, 26, 4029–4037. [Google Scholar] [CrossRef]
  15. Unger, S.; Máguas, C.; Pereira, J.S.; David, T.S.; Werner, C. The influence of precipitation pulses on soil respiration - Assessing the Birch effect by stable carbon isotopes. Soil Biol. Biochem. 2010, 42, 1800–1810. [Google Scholar] [CrossRef]
  16. Bond-Lamberty, B.; Wang, C.; Gower, S.T. Spatiotemporal measurement and modeling of stand-level boreal forest soil temperatures. Agric. For. Meteorol. 2005, 131, 27–40. [Google Scholar] [CrossRef]
  17. Huxman, T.E.; Snyder, K.A.; Tissue, D.; Leffler, A.J.; Ogle, K.; Pockman, W.T.; Sandquist, D.R.; Potts, D.L.; Schwinning, S. Precipitation pulses and carbon fluxes in semiarid and arid ecosystems. Oecologia 2004, 141, 254–268. [Google Scholar] [CrossRef] [PubMed]
  18. Liu, Y.; Liu, S.; Miao, R.; Liu, Y.; Wang, D.; Zhao, C. Seasonal variations in the response of soil CO2 efflux to precipitation pulse under mild drought in a temperate oak (Quercus variabilis) forest. Agric. For. Meteorol. 2019, 271, 240–250. [Google Scholar] [CrossRef]
  19. Ortiz-Gonzalo, D.; de Neergaard, A.; Vaast, P.; Suárez-Villanueva, V.; Oelofse, M.; Rosenstock, T.S. Multi-scale measurements show limited soil greenhouse gas emissions in Kenyan smallholder coffee-dairy systems. Sci. Total Environ. 2018, 626, 328–339. [Google Scholar] [CrossRef] [PubMed]
  20. Pang, J.; Wang, X.; Peng, C.; Mu, Y.; Ouyang, Z.; Lu, F.; Zhang, H.; Zhang, S.; Liu, W. Nitrous oxide emissions from soils under traditional cropland and apple orchard in the semi-arid Loess Plateau of China. Agric. Ecosyst. Environ. 2019, 269, 116–124. [Google Scholar] [CrossRef]
  21. Kim, D.G.; Thomas, A.D.; Pelster, D.; Rosenstock, T.S.; Sanz-Cobena, A. Greenhouse gas emissions from natural ecosystems and agricultural lands in sub-Saharan Africa: Synthesis of available data and suggestions for further research. Biogeosciences 2016, 13, 4789–4809. [Google Scholar] [CrossRef]
  22. Pfahl, S.; O’Gorman, P.A.; Fischer, E.M. Understanding the regional pattern of projected future changes in extreme precipitation. Nat. Clim. Chang. 2017, 7, 423–427. [Google Scholar] [CrossRef]
  23. Adhikari, U.; Nejadhashemi, A.P.; Woznicki, S.A. Climate change and eastern Africa: A review of the impact on major crops. Food Energy Secur. 2015, 4, 110–132. [Google Scholar] [CrossRef]
  24. Sasson, A. Food security for Africa: An urgent global challenge. Agric. Food Secur. 2012, 1, 1–16. [Google Scholar] [CrossRef]
  25. Rosenstock, T.S.; Rufino, M.C.; Butterbach-Bahl, K.; Wollenberg, E. Toward a protocol for quantifying the greenhouse gas balance and identifying mitigation options in smallholder farming systems. Environ. Res. Lett. 2013, 8, 021003. [Google Scholar] [CrossRef]
  26. WDLG. Higher Local Government Statistical Abstract: Wakiso District Local Government (WDLG); WDLG: Wakiso, Uganda, 2009; pp. 2–3. [Google Scholar]
  27. UBOS. Uganda Bureau of Statistics 2018 Statistical Abstract. Kampala. Available online: https://www.ubos.org/wp-content/.../05_2019STATISTICAL_ABSTRACT_2018.pdf (accessed on 5 April 2019).
  28. FAO. World Reference Base for Soil Resources; FAO: Rome, Italy, 1998. [Google Scholar]
  29. Nelson, D.W.; Sommers, L.E. Total carbon, organic carbon, and organic matter. In Methods of Soil Analysis. Part 3—Chemical Methods; Madison: SSSA Book Ser. 5; Sparks, D.L., Ed.; Soil Science Society of America, American Society of Agronomy: Madison, WI, USA, 1996; pp. 961–1010. [Google Scholar]
  30. Rayment, G.E.; Higginson, F.R. Soil survey standard test method for electrical conductivity. In Australian Laboratory Handbook of Soil and Water Chemical Methods; Australian Soil L. Surv. Handbooks; Inkata Press: Melbourne, Australian, 1992. [Google Scholar]
  31. Blake, G. Bulk density. In Methods of Soil Analysis, Part 1. Physical and Mineralogical Properties, Including Statistics of Measurement and Sampling; Black, C.A., Ed.; American Society of Agronomy: Madison, WI, USA, 1965; Volume 1, p. 770. [Google Scholar]
  32. Smemo, K.A.; Ostrom, N.E.; Opdyke, M.R.; Ostrom, P.H.; Sven, B.; Robertson, G.P. Improving process-based estimates of N2O emissions from soil using temporally extensive chamber techniques and stable isotopes. Nutr. Cycl. Agroecosyst. 2011, 91, 91–145. [Google Scholar] [CrossRef]
  33. Yao, Z.; Zheng, X.; Xie, B.; Liu, C.; Mei, B.; Dong, H.; Butterbach-Bahl, K.; Zhu, J. Comparison of manual and automated chambers for field measurements of N2O, CH4, CO2 fluxes from cultivated land. Atmos. Environ. 2009, 43, 1888–1896. [Google Scholar] [CrossRef]
  34. Hutchinson, G.L.; Livingston, G.P. Vents and seals in non-steady state chambers used for measuring gas exchange between the soil and the atmosphere. Eur. J. Soil Sci. 2001, 52, 675–682. [Google Scholar] [CrossRef]
  35. Xu, L.; Furtaw, M.D.; Madsen, R.A.; Garcia, R.L.; Anderson, D.J.; McDermitt, D.K. On maintaining pressure equilibrium between a soil CO2 flux chamber and the ambient air. J. Geophys. Res. 2006, 111. [Google Scholar] [CrossRef]
  36. Menke, K.H.; Raab, L.; Salewski, A.; Steingass, H.; Fritz, D.; Schneider, W. The estimation of the digestibility and metabolisable energy content of ruminant feeding stuffs from the gas production when they are incubated with rumen liquor. J. Agric. Sci. 1979, 93, 217–222. [Google Scholar] [CrossRef]
  37. Rochette, P. Towards a standard non-steady-state chamber methodology for measuring soil N2O emissions. Anim. Feed Sci. Technol. 2011, 166, 141–146. [Google Scholar] [CrossRef]
  38. Dong, Y.S.; Zhang, S.; Qi, Y.C.; Chen, Z.Z.; Geng, Y.B. Fluxes of CO2, N2O, and CH4 from a typical temperate grassland in Inner Mongolia and its daily variation. Chin. Sci. Bull. 2000, 45, 1590–1594. [Google Scholar] [CrossRef]
  39. Cosentino, V.R.N.; Fernandez, P.L.; Aureggi, S.A.F.; Taboada, M.A. NO2 emission from a cultivated mollisol: Optimal time of day for sampling and the role of soil temperature. Rev. Bras. Cienc. Solo 2012, 36, 1814–1819. [Google Scholar] [CrossRef]
  40. Arnold, S.; Parkin, T.B.; Doran, J.W.; Mosier, A.R. Automated gas sampling system for laboratory analysis of CH4 and N2O. Commun. Soil Sci. Plant. Anal. 2001, 32, 2795–2807. [Google Scholar] [CrossRef] [Green Version]
  41. Giovannelli, D.; Black, B.A.; Cox, A.D.; Sheik, C.S. Deep Carbon in Earth: Early Career Scientist Contributions to the Deep Carbon Observatory; Frontiers Media SA: Lausanne, Switzerland, 2017. [Google Scholar]
  42. Liu, J.; Shen, J.; Li, Y.; Su, Y.; Ge, T.; Jones, D.L.; Wu, J. Effects of biochar amendment on the net greenhouse gas emission and greenhouse gas intensity in a Chinese double rice cropping system. Eur. J. Soil Biol. 2014, 65, 30–39. [Google Scholar] [CrossRef]
  43. Schwarz, G.E. Estimating the dimension of a model. Ann. Stat. 1978, 6, 461–464. [Google Scholar] [CrossRef]
  44. Novara, A.; La Mantia, T.; Barbera, V.; Gristina, L. Paired-site approach for studying soil organic carbon dynamics in a Mediterranean semiarid environment. Catena 2012, 89, 1–7. [Google Scholar] [CrossRef]
  45. McClain, M.E.; Boyer, E.W.; Dent, C.L.; Gergel, S.E.; Grimm, N.B.; Groffman, P.M.; Hart, S.C.; Harvey, J.W.; Johnston, C.A.; Mayorga, E.; et al. Biogeochemical hot spots and hot moments at the interface of terrestrial and aquatic ecosystems. Ecosystems 2003, 6, 301–312. [Google Scholar] [CrossRef]
  46. Dalal, R.C.; Allen, D.E. Greenhouse gas fluxes from natural ecosystems. Aust. J. Bot. 2008, 56, 369–407. [Google Scholar] [CrossRef]
  47. Liu, L.; Hu, C.; Yang, P.; Ju, Z.; Olesen, J.E.; Tang, J. Effects of experimental warming and nitrogen addition on soil respiration and CH4 fluxes from crop rotations of winter wheat–soybean/fallow. Agric. For. Meteorol. 2015, 207, 38–47. [Google Scholar] [CrossRef]
  48. Savage, K.; Phillips, R.; Davidson, E. High temporal frequency measurements of greenhouse gas emissions from soils. Biogeosciences 2014, 11, 2709–2720. [Google Scholar] [CrossRef] [Green Version]
  49. Scott-Denton, L.E.; Rosenstiel, T.N.; Monson, R.K. Differential controls by climate and substrate over the heterotrophic and rhizospheric components of soil respiration. Glob. Chang. Biol. 2006, 12, 205–216. [Google Scholar] [CrossRef]
  50. Wan, S.; Norby, R.J.; Ledford, J.; Weltzin, J.F. Responses of soil respiration to elevated CO2, air warming, and changing soil water availability in a model old-field grassland. Glob. Chang. Biol. 2007, 13, 2411–2424. [Google Scholar] [CrossRef]
  51. Schaufler, G.; Kitzler, B.; Schindlbacher, A.; Skiba, U.; Sutton, M.A.; Zechmeister-Boltenstern, S. Greenhouse gas emissions from European soils under different land use: Effects of soil moisture and temperature. Eur. J. Soil Sci. 2010, 61, 683–696. [Google Scholar] [CrossRef]
  52. Li, X.; Zhao, Y.; Yang, H.; Zhang, P.; Gao, Y. Soil respiration of biologically-crusted soils in response to simulated precipitation pulses in the Tengger Desert, Northern China. Pedosphere 2018, 28, 103–113. [Google Scholar] [CrossRef]
  53. Curiel Yuste, J.; Hereş, A.M.; Ojeda, G.; Paz, A.; Pizano, C.; García-Angulo, D.; Lasso, E. Soil heterotrophic CO2 emissions from tropical high-elevation ecosystems (Páramos) and their sensitivity to temperature and moisture fluctuations. Soil Biol. Biochem. 2017, 110, 8–11. [Google Scholar] [CrossRef] [Green Version]
  54. Huang, G.; Li, Y.; Su, Y.G. Effects of increasing precipitation on soil microbial community composition and soil respiration in a temperate desert, Northwestern China. Soil Biol. Biochem. 2015, 83, 52–56. [Google Scholar] [CrossRef]
  55. Högberg, P.; Nordgren, A.; Buchmann, N.; Taylor, A.F.S.; Ekblad, A.; Högberg, M.N.; Nyberg, G.; Ottosson-Löfvenius, M.; Read, D.J. Large-scale forest girdling shows that current photosynthesis drives soil respiration. Nature 2001, 411, 789–792. [Google Scholar] [CrossRef] [PubMed]
  56. Smith, A.P.; Bond-Lamberty, B.; Benscoter, B.W.; Tfaily, M.M.; Hinkle, C.R.; Liu, C.; Bailey, V.L. Shifts in pore connectivity from precipitation versus groundwater rewetting increases soil carbon loss after drought. Nat. Commun. 2017, 8, 1335. [Google Scholar] [CrossRef] [PubMed]
  57. McCulley, R.L.; Boutton, T.W.; Archer, S.R. Soil respiration in a subtropical savanna parkland: Response to water additions. Soil Sci. Soc. Am. J. 2007, 71, 820–828. [Google Scholar] [CrossRef]
  58. Linfeng, L.; Fan, W.; Kang, X.; Wang, Y.; Cui, X.; Xu, C.; Griffin, K.L.; Hao, Y. Responses of greenhouse gas fluxes to climate extremes in a semiarid grassland. Atmos. Environ. 2016, 142, 32–42. [Google Scholar] [CrossRef]
  59. Morse, J.L.; Bernhardt, E.S. Using 15N tracers to estimate N2O and N2 emissions from nitrification and denitrification in coastal plain wetlands under contrasting land-uses. Soil Biol. Biochem. 2013, 57, 635–643. [Google Scholar] [CrossRef]
  60. Liu, B.; Frostegård, Å.; Bakken, L.R. Impaired reduction of N2O to N2 in acid soils is due to a posttranscriptional interference with the expression of nosZ. mBio 2014, 5, e01383-14. [Google Scholar] [CrossRef] [Green Version]
  61. Chen, W.; Zheng, X.; Chen, Q.; Wolf, B.; Butterbach-Bahl, K.; Brüggemann, N.; Lin, S. Effects of increasing precipitation and nitrogen deposition on CH4 and N2O fluxes and ecosystem respiration in a degraded steppe in Inner Mongolia, China. Geoderma 2013, 192, 335–340. [Google Scholar] [CrossRef]
  62. Homyak, P.M.; Allison, S.D.; Huxman, T.E.; Goulden, M.L.; Treseder, K.K. Effects of drought manipulation on soil nitrogen cycling: A meta-analysis. J. Geophys. Res. 2017, 122, 3260–3272. [Google Scholar] [CrossRef]
  63. Wu, D.; Cárdenas, L.M.; Calvet, S.; Brüggemann, N.; Loick, N.; Liu, S.; Bol, R. The effect of nitrification inhibitor on N2O, NO and N2 emissions under different soil moisture levels in a permanent grassland soil. Soil Biol. Biochem. 2017, 113, 153–160. [Google Scholar] [CrossRef]
  64. Bayer, C.; Gomes, J.; Vieira, F.C.B.; Zanatta, J.A.; Piccolo, M.C.; Dieckow, J. Methane emission from soil under long-term no-till cropping systems. Soil Tillage Res. 2012, 124, 1–7. [Google Scholar] [CrossRef] [Green Version]
  65. Chan, A.S.K.; Parkin, T.B. Effect of land use on methane flux from soil. J. Environ. Qual. 2001, 30, 786–797. [Google Scholar] [CrossRef] [PubMed] [Green Version]
  66. Baggs, E.M.; Chebii, J.; Ndufa, J.K. A short-term investigation of trace gas emissions following tillage and no-tillage of agroforestry residues in western Kenya. Soil Tillage Res. 2006, 90, 69–76. [Google Scholar] [CrossRef]
  67. Christiansen, J.R.; Levy-Booth, D.; Prescott, C.E.; Grayston, S.J. Different soil moisture control of net methane oxidation and production in organic upland and wet forest soils of the pacific coastal rainforest in Canada. Can. J. For. Res. 2017, 47, 628–635. [Google Scholar] [CrossRef]
  68. Teh, Y.A.; Silver, W.L.; Conrad, M.E. Oxygen effects on methane production and oxidation in humid tropical forest soils. Glob. Chang. Biol. 2005, 11, 1283–1297. [Google Scholar] [CrossRef]
  69. Hall, S.J.; McDowell, W.H.; Silver, W.L. When wet gets wetter: Decoupling of moisture, redox biogeochemistry, and greenhouse gas fluxes in a humid tropical forest soil. Ecosystems 2013, 16, 576–589. [Google Scholar] [CrossRef] [Green Version]
  70. Topp, E.; Pattey, E. Soils as sources and sinks for atmospheric methane. Can. J. Soil Sci. 1997, 77, 167–178. [Google Scholar] [CrossRef]
  71. Levy, P.E.; Burden, A.; Cooper, M.D.A.; Dinsmore, K.J.; Drewer, J.; Evans, C.; Fowler, D.; Gaiawyn, J.; Gray, A.; Jones, S.K.; et al. Methane emissions from soils: Synthesis and analysis of a large UK data set. Glob. Chang. Biol. 2012, 18, 1657–1669. [Google Scholar] [CrossRef] [Green Version]
  72. Sgouridis, F.; Ullah, S. Soil Greenhouse Gas Fluxes, Environmental Controls, and the Partitioning of N2O Sources in UK Natural and Seminatural Land Use Types. J. Geophys. Res. 2017, 122, 2617–2633. [Google Scholar] [CrossRef]
  73. Chamberlain, S.D.; Gomez-Casanovas, N.; Walter, M.T.; Boughton, E.H.; Bernacchi, C.J.; DeLucia, E.H.; Groffman, P.M.; Keel, E.W.; Sparks, J.P. Influence of transient flooding on methane fluxes from subtropical pastures. J. Geophys. Res. Biogeosci. 2016, 121, 965–977. [Google Scholar] [CrossRef] [Green Version]
  74. Conrad, M.E.; Templeton, A.S.; Daley, P.F.; Alvarez-Cohen, L. Seasonally-induced fluctuations in microbial production and consumption of methane during bioremediation of aged subsurface refinery contamination. Environ. Sci. Technol. 1999, 33, 4061–4068. [Google Scholar] [CrossRef]
  75. Turetsky, M.R.; Treat, C.C.; Waldrop, M.P.; Waddington, J.M.; Harden, J.W.; McGuire, A.D. Short-term response of methane fluxes and methanogen activity to water table and soil warming manipulations in an Alaskan peatland. J. Geophys. Res.-Biogeosci. 2008, 113. [Google Scholar] [CrossRef] [Green Version]
  76. Lin, B.B.; Egerer, M.H.; Liere, H.; Jha, S.; Philpott, S.M. Soil management is key to maintaining soil moisture in urban gardens facing changing climatic conditions. Sci. Rep. 2018, 8, 17565. [Google Scholar] [CrossRef]
  77. Zhou, X.; Sherry, R.A.; An, Y.; Wallace, L.L.; Luo, Y. Main and interactive effects of warming, clipping, and doubled precipitation on soil CO2 efflux in a grassland ecosystem. Glob. Biogeochem. Cycles 2006, 20, 1–12. [Google Scholar] [CrossRef]
  78. Shi, F.; Chen, H.; Chen, H.; Wu, Y.; Wu, N. The combined effects of warming and drying suppress CO2 and N2O emission rates in an alpine meadow of the eastern Tibetan Plateau. Ecol. Res. 2012, 27, 725–733. [Google Scholar] [CrossRef]
  79. Ahmad, W.; Singh, B.; Dijkstra, F.A.; Dalal, R.C.; Geelan-Small, P. Temperature sensitivity and carbon release in an acidic soil amended with lime and mulch. Geoderma 2014, 214, 168–176. [Google Scholar] [CrossRef]
  80. Conen, F.; Leifeld, J.; Seth, B.; Alewell, C. Warming mineralises young and old soil carbon equally. Biogeosciences 2006, 3, 515–519. [Google Scholar] [CrossRef] [Green Version]
  81. Butterbach-Bahl, K.; Stange, F.; Papen, H.; Grell, G.; Li, C. Impact of changes in temperature and precipitation on N2O and NO emissions from forest soils. In Non-CO2 Greenhouse Gases: Scientific Understanding, Control, and Implementation; van Ham, J., Baede, A.P.M., Meyer, L.A., Ybema, R., Eds.; Springer: Dordrecht, The Netherlands, 2000; pp. 165–171. [Google Scholar]
  82. Hu, Z.; Cui, H.; Chen, S.; Shen, S.; Li, H.; Yang, Y.; Li, C. Soil respiration and N2O flux response to UV-B radiation and straw incorporation in a soybean-winter wheat rotation system. Water Air Soil Pollut. 2013, 224, 1394. [Google Scholar] [CrossRef]
  83. Hu, Y.; Chang, X.; Lin, X.; Wang, Y.; Wang, S.; Duan, J.; Zhang, Z.; Yang, X.; Luo, C.; Xu, G.; et al. Effects of warming and grazing on N2O fluxes in an alpine meadow ecosystem on the Tibetan plateau. Soil Biol. Biochem. 2010, 42, 944–952. [Google Scholar] [CrossRef]
  84. Hartmann, A.A.; Niklaus, P.A. Effects of simulated drought and nitrogen fertilizer on plant productivity and nitrous oxide (N2O) emissions of two pastures. Plant. Soil 2012, 361, 411–426. [Google Scholar] [CrossRef]
  85. Butterbach-Bahl, K.; Papen, H. Four years continuous record of CH4-exchange between the atmosphere and untreated and limed soil of a N-saturated spruce and beech forest ecosystem in Germany. Plant. Soil 2002, 240, 77–90. [Google Scholar] [CrossRef]
  86. Oelbermann, M.; Schiff, S.L. Inundating contrasting boreal forest soils: CO2 and CH4 production rates. Ecoscience 2010, 17, 216–224. [Google Scholar] [CrossRef]
  87. Tu, C.; Li, F. Responses of greenhouse gas fluxes to experimental warming in the wheat season under conventional tillage and no-tillage fields. J. Environ. Sci.-China 2017, 54, 314–327. [Google Scholar] [CrossRef]
  88. Christiansen, J.R.; Romero, A.J.B.; Jørgensen, N.O.G.; Glaring, M.A.; Jørgensen, C.J.; Berg, L.K.; Elberling, B. Methane fluxes and the functional groups of methanotrophs and methanogens in a young Arctic landscape on Disko Island, West Greenland. Biogeochemistry 2015, 122, 15–33. [Google Scholar] [CrossRef] [Green Version]
  89. Sjögersten, S.; Aplin, P.; Gauci, V.; Peacock, M.; Siegenthaler, A.; Turner, B. Temperature response of ex-situ greenhouse gas emissions from tropical peatlands: Interactions between forest type and peat moisture conditions. Geoderma 2018, 324, 47–55. [Google Scholar] [CrossRef]
  90. Harper, C.W.; Blair, J.M.; Fay, P.A.; Knapp, A.K.; Carlisle, J.D. Increased rainfall variability and reduced rainfall amount decreases soil CO2 flux in a grassland ecosystem. Glob. Chang. Biol. 2005, 11, 322–334. [Google Scholar] [CrossRef]
  91. Yiqi, L.; Zhou, X. Soil Respiration and the Environment; Elsevier Academic Press: London, UK, 2006. [Google Scholar] [CrossRef]
Figure 1. Map showing the study sites (banana–coffee farms) in Wakiso district, Central Uganda.
Atmosphere 10 00708 g001
Figure 2. Temporal and spatial variations in daily precipitation and soil temperatures from the banana–coffee farms at three elevation ranges (1200–1340 m (a), 1100–1200 m (b), and 900–1000 m (c)) from March to June 2018, in Wakiso District, Uganda.
Atmosphere 10 00708 g002aAtmosphere 10 00708 g002b
Figure 3. Temporal and spatial variations in methane (A), nitrous oxide (B), and carbon dioxide (C) fluxes from the banana–coffee farms at three elevation ranges (1200–1340 m, 1100–1200 m, and 900–1000 m), from March to June 2018, in Wakiso District, Uganda.
Atmosphere 10 00708 g003
Figure 4. (A) Correlations between daily precipitation and greenhouse-gas fluxes during the wet season (March to June 2018) from the banana–coffee farms located at three elevation ranges (1200–1340 m, 1100–1200 m, and 900–1000 m), Wakiso District, Uganda. The data plotted are the grand means for each sampling day. (B) Correlations between the soil temperatures and greenhouse-gas fluxes during the wet season (March to June 2018) from the banana–coffee farms located at three elevation ranges (1200–1340 m, 1100–1200 m, and 900–1000 m), Wakiso District, Uganda. The data plotted are the grand means for each sampling day.
Atmosphere 10 00708 g004
Table 1. Physical–chemical characterization of the soil (0–15 cm depth) sampled at the studied sites (mean ± standard error; n = 24 for each elevational range).
Elevation Range (m)NCSandClayBulk DensitypH
g kg−1%g cm−3-
1200–1340 (Farm A)4.8 ± 2.117.8 ± 5.852.5 ± 7.235.3 ± 8.11.5 ± 0.25.9
1100–1200 (Farm B)3.6 ± 1.115.9 ± 5.552.0 ± 6.534.9 ± 0.21.3 ± 0.15.4
900–1000 (Farm C)2.4 ± 1.212.9 ± 3.452.1 ± 6.335.0 ± 7.61.0 ± 0.15.0
Table 2. Mean values of the GHG fluxes and two-way ANOVA testing the effect of daily precipitation, soil temperatures, and their interactions on the soil greenhouse-gas fluxes emitted from the Banana–coffee mixed farms in Wakiso district, Uganda.
Elevation Range (m)P (mm/day)T (°C)CO2 (µg C m−2 h−1)N2O (µg N m−2 h−1)CH4 (µg C m−2 h−1)
1200–1340 (Farm A)3.5 ± 0.15 a20.5 ± 0.5 a87.42 ± 5.6 a6.82 ± 0.8 a0.31 ± 0.01 a
1100–1200 (Farm B)3.0 ± 0.15 b21.1 ± 0.5 a67.62 ± 4.4 b4.75 ± 0.7 b0.20 ± 0.01 b
900–1000 (Farm C)2.6 ± 0.10 c23.2 ± 0.7 b52.41 ± 3.9 c3.65 ± 0.6 c0.04 ± 0.00 c
ANOVA
FactorCO2 (µg C m−2 h−1)N2O (µg N m−2 h−1)CH4 (µg C m2 h1)
F-valuep-valueF-valuep-valueF-valuep-value
T142.2630.00056.7810.01053.0110.010
P235.5210.000201.0260.000115.0780.000
T × P4.5210.0015.6100.01418.023ns
The superscript lower-case letters (a, b, and c) in the columns represent significance (p < 0.05) in the greenhouse-gas fluxes. The p-values marked in bold are considered significant (p < 0.05); nonsignificant p-values are reported as ns in the ANOVA. Soil temperature is for T and daily precipitation for P. Mean ± standard error; n = 24 for each elevation range.

