Article

Evaluation and Projection of Extreme Precipitation over Northern China in CMIP5 Models

School of Atmospheric Sciences and Guangdong Province Key Laboratory for Climate Change and Natural Disaster Studies, Sun Yat-sen University, Guangzhou 510275, China
*
Author to whom correspondence should be addressed.
Atmosphere 2019, 10(11), 691; https://doi.org/10.3390/atmos10110691
Submission received: 7 October 2019 / Revised: 30 October 2019 / Accepted: 7 November 2019 / Published: 9 November 2019
(This article belongs to the Section Meteorology)

Abstract

:
This study evaluates 32 climate models from CMIP5 compared with a daily gridded observation dataset of extreme precipitation indices including total extreme precipitation (R95p), maximum consecutive five days of precipitation (RX5day) and wet days larger than 10 mm of precipitation (R10mm) over Northern China during the historical period (1986–2005). Results show the majority models have good performance on spatial distribution but overestimate the amplitude of precipitation over Northern China. Most models can also capture interannual variation of R95p and RX5d, but with poor simulations on R10mm. Considering both spatial and temporal factors, the best multi-model ensemble (Group 1) has been selected and improved by 42%, 34%, and 37% for R95p, RX5d, and R10mm, respectively. Projection of extreme precipitation indicates that the fastest-rising region is in Northwest China due to the enhanced rainfall intensity. However, the uncertainty analysis shows the increase of extreme rainfall over Northwest China has a low confidence level. The projection of increasing extreme rainfall over Northeast China from Group 1 due to the longer extreme rainfall days is more credible. The weak subtropical high and southwest winds from Arabian Sea lead to the low wet biases from Group 1 and the cyclonic anomalies over Northeast China, which result in more extreme precipitation.

1. Introduction

Global warming has had a profound impact on climate change in recent years not only regarding the mean climate system but also regarding extreme events. The continued emissions of green gas will induce more serious disasters on the ecosystem, human society, and the global environment, according to the Fifth Assessment Report (AR5) of the intergovernmental Panel on Climate Change (IPCC) [1,2,3]. Many studies have found regional climate changes are more complex. Therefore, accurate simulation is a challenge for climate models under global warming scenarios [4,5,6,7,8]. China is a vulnerable region of great concern affected by the East Asian monsoon and complex topography. This country is susceptible to extreme precipitation events. Hence, several studies have investigated the future change of extreme events over China under different emission scenarios based on the simulations of global climate models from Coupled Model Inter-Comparison Project Phase 5 (CMIP5) [9,10,11,12]. Zhou et al. [13] showed the inhomogeneous intensification of extreme precipitation in different regions of China. Di et al. [14] also demonstrated the large increasing percentage of extreme rainfall in Northern China and weak drying in Southwestern China in the future. Xu et al. analyzed the similar diploe pattern of consecutive dry days with a reduction in the north and an increment in the south over China [15]. Previous studies have focused on the projection of extreme rainfall events over all of China using the climate model ensembles and paid more attention to Southeast China. However, the ecological environment of Northern China is more fragile because of rare vegetation and the change of extreme precipitation may increase the risk of the local ecosystem. Hence, the main objective of this paper is to investigate the future change of extreme rainfall events over Northern China and the results are important for references of Chinese developing adaptation strategies [11,16].
In recent years, the argument of the future projection should be based on the multi-model ensemble or the optimal model ensemble becomes a major issue. The previous studies have indicated the multi-model ensemble shows better performance than the single model and this method is usually used for a future projection [17,18]. However, some researchers consider that not every model has good performance on the individual variable over the locale area. Thus, selecting the optimal model ensemble is vital to reduce the uncertainness of the projection [19,20,21]. In order to reduce the uncertainties of future change projection of extreme events, it is vital to evaluate the climate models’ performance based on the observations [22,23,24]. Many studies have evaluated CMIP5 model simulation abilities of extreme events over China both on spatial distributions and temporal variations. Ou et al. [12] found most climate models overestimate extreme precipitations in Western China especially for mountain regions while underestimating it in Southern China. Additionally, the models simulate well in Eastern China. Jiang et al. [25] also showed the simulations are more reliable in the eastern part of China. However, few studies have investigated the uncertainties and the differences of the future projections between the optimal model ensemble and the multi-model ensemble.
As mentioned above, evaluating the simulation ability of extreme rainfall from each model on spatial and temporal variations over Northern China and selecting the best model ensemble for future projection are key issues for this study. We compare the simulations against the observations of extreme indices from Expert Team on Climate Change Detection and Indicies (ETCCDI) [26,27] in the historical period and select the best performance model ensemble for projecting climate change of extreme rainfall events under RCP4.5 and RCP8.5 scenarios. Additionally, the uncertainties, differences, and possible reasons of the future projections based on the optimal model ensemble and multi-model ensemble are also explored. The paper is organized as follows. The data and method are described in Section 2. Section 3 evaluates the model performance on spatial patterns and temporal variations. Projected future changes of precipitation extremes are present in Section 4. Lastly, the discussion and conclusions are given in Section 5.

2. Experiments

2.1. Observation Data and CMIP5 Simulations

The CN05.1 gridded observation dataset with 0.5° high resolution [28], which contains 2416 stations in China by the National Climate Center, China Meteorological Administration, has been used to validate model performance for extreme simulations [13,14]. This dataset includes daily precipitation, daily mean, and maximum and minimum temperature [29]. CMIP5 ensembles based on 32 models from 18 different institutes supply the historical run from 1986 to 2005 for assessment with observations in Northern China (north of 35° N). In addition, we focus on the projections of CMIP5 simulations under RCP4.5 and RCP8.5 that are medium and high emission scenarios during two periods from 2046–2065 (middle of the 21st century) and 2080 to 2099 (end of the 21st century). The details of each model are listed in Table 1. The entirety of Northern China (WNC) has been divided for three sub-regions including Northeast China (NEC, 39°–54° N, 119°–134° E), North China (NC, 36°–46° N, 111°–119° E), and Northwest China (NWC, 36°–46° N, 75°–111° E) [14] to investigate future changes in specific regions (Figure 1).

2.2. Extreme Rainfall Indices

Three indices defined by ETCCDI have been chosen to quantify the model performance on extreme rainfall events in this study (Table 2). The annual total precipitation exceeding the 95th percentage (R95p) represents the extreme precipitation events. The maximum consecutive five days of precipitation (RX5day) and number of wet days with larger than 10 mm of precipitation (R10mm) denotes the wet part of the precipitation spectrum and heavy rainfall days, respectively. These indices can describe the climatic characteristics of extreme rainfall and are sensitive to global warming, which have been used in previous studies [22,23,26,30,31,32]. In order to evaluate the model performance with the observations, the calculation results have been interpolated to the resolution with 0.5° × 0.5° using a bilinear interpolation scheme.

2.3. Analysis Methods

To evaluate the CMIP5 model performances of extreme rainfall over Northern China on spatial distribution and interannual variation, three evaluation methods including the Taylor diagram, the interannual variability score (IVS), and comprehensive metrics (MR) have been used in this research [25]. The Taylor diagram [33] containing a spatial correlation coefficient, centered pattern root mean square errors (RMSE), and a ratio of standard deviations provides a good tool to quantify the simulation ability of spatial distribution. In order to assess the model performance on the time variation, a score skill IVS [10,34,35] has been defined as follows.
IVS = ( STD m STD O STD o STD m ) 2
where STDm and STDo denote the interannual standard deviation of model simulation and observation, respectively. IVS is a symmetric variability statistic that can filter the interdecadal signal and the value closer to 0 indicates the better performance of the model simulation in terms of interannual variations. Based on three extreme rainfall indices, the comprehensive ranking index MR [25,36] is defined below.
MR = 1 1 nm i = 1 n rank i
where m is the model number and n is the number of extreme rainfall indices. In this study, the MR values for the Taylor diagram and IVS from the best performance model are both close to 1.
The signal-to-noise ratio (SNR) is used in this study to estimate the uncertainties from the CMIP5 multi-model ensemble. SNR is calculated below.
SNR = X σ
where X is a multi-model ensemble mean as the model signal and σ is the standard deviation of the multi-model projection as the noise. The larger the SNR is, the more credible the projection of the signal is, which is larger than the noise [37,38,39].

3. Evaluation of Models

Each climate model and the CMIP5 multi-model ensemble are evaluated over Northern China during the reference period (1986–2005) in this section.

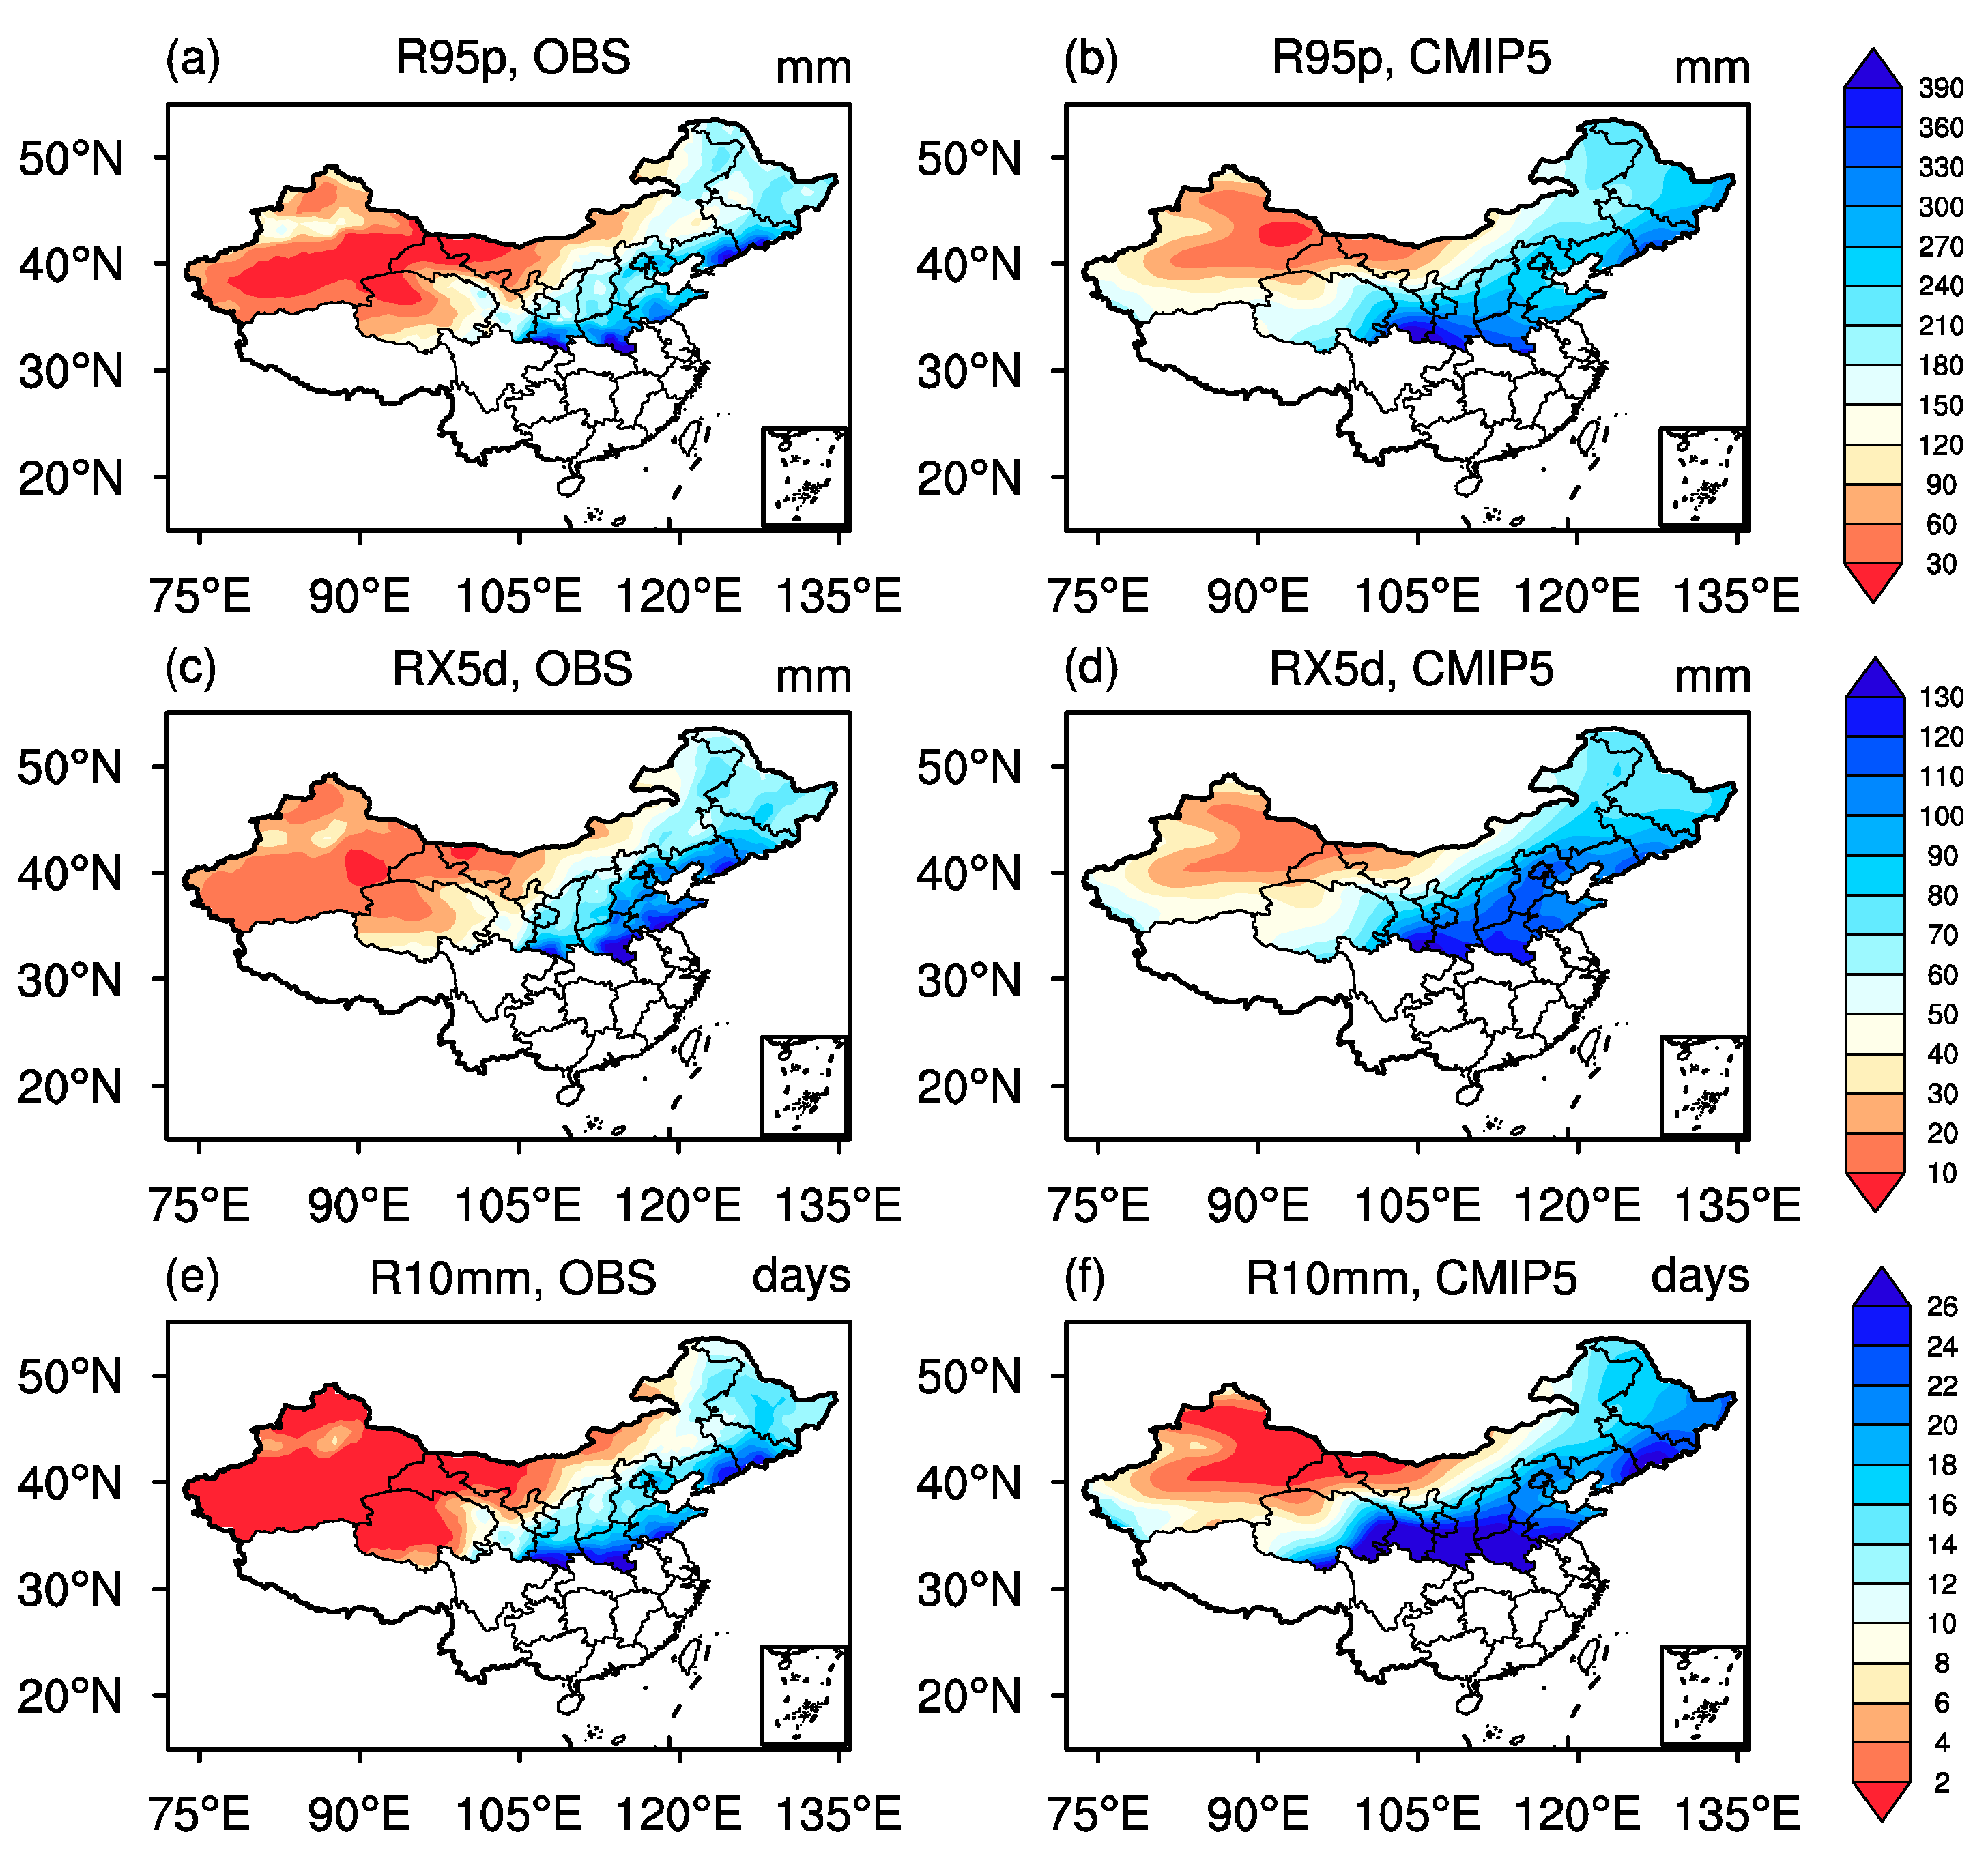
3.1. Spatial Distribution

Extreme rainfall indices (R95p, RX5d, and R10mm) from the CMIP5 multi-model ensemble and observations are presented in Figure 2. Both the observations and model simulations of extreme rainfall show the decreasing trend from east to west over Northern China and their correlations are over 0.85 with the significant values above a 95% level that indicate the CMIP5 multi-model ensemble simulates the spatial distribution effectively. The maximum extreme rainfall center can be found in the east edge of the Tibetan Plateau and the minimum rainfall center is in the border of three main basins (Tarim Basin, Turpan Basin, and Qaidam Basin) over Northwest China where little rainfall happens every year. However, the general overestimations in Northern China from the CMIP5 multi-model ensemble are clear for three indices (Figure 3). The maximum wet bias is over 100 mm, 40 mm, and 10 days near the east edge of the Tibetan Plateau for R95p, RX5d, and R10mm, respectively. The overestimation in Northern China is consistent with previous findings that can be found widely in the GCM/RCM simulations to the coarse resolutions [34,35,36,37,38,39,40,41,42,43]. Concerning the northern edge of the Tibetan Plateau, uncertainties in observation should be considered due to the lack of observation stations in this region that induces the underestimation of extreme rainfall [28].
The Taylor diagrams are used to evaluate each model performance on the spatial pattern of extreme rainfall (Figure 3). The majority of models have good correlations with observations above 0.6 for R95p and R10mm and all the models are over 0.6 for Rx5d, which is consistent with the results in Figure 2. In term of the amplitude of biases, the ratio of the standard deviation is between 0.75 and 1.2 for R95p and RX5d. However, the value increases to between 1.0 and 1.65 for R10mm with loosely scattered distribution in the Taylor diagrams. This indicates climate models differ widely for their simulations and increase uncertainty for the days of heavy rainfall. In addition, the CMIP5 multi-model ensemble has better performance than most of CMIP5 climate models, but it is not the best one. The five best models for spatial distribution of heavy rainfall over Northern China are CNRM-CM5, CSIRO-Mk3.6.0, EC-EARTH, IPSL-CM5A-LR, and MRI-CGCM3, which are all better than the CMIP5 multi-model ensemble.

3.2. Interannual Variability
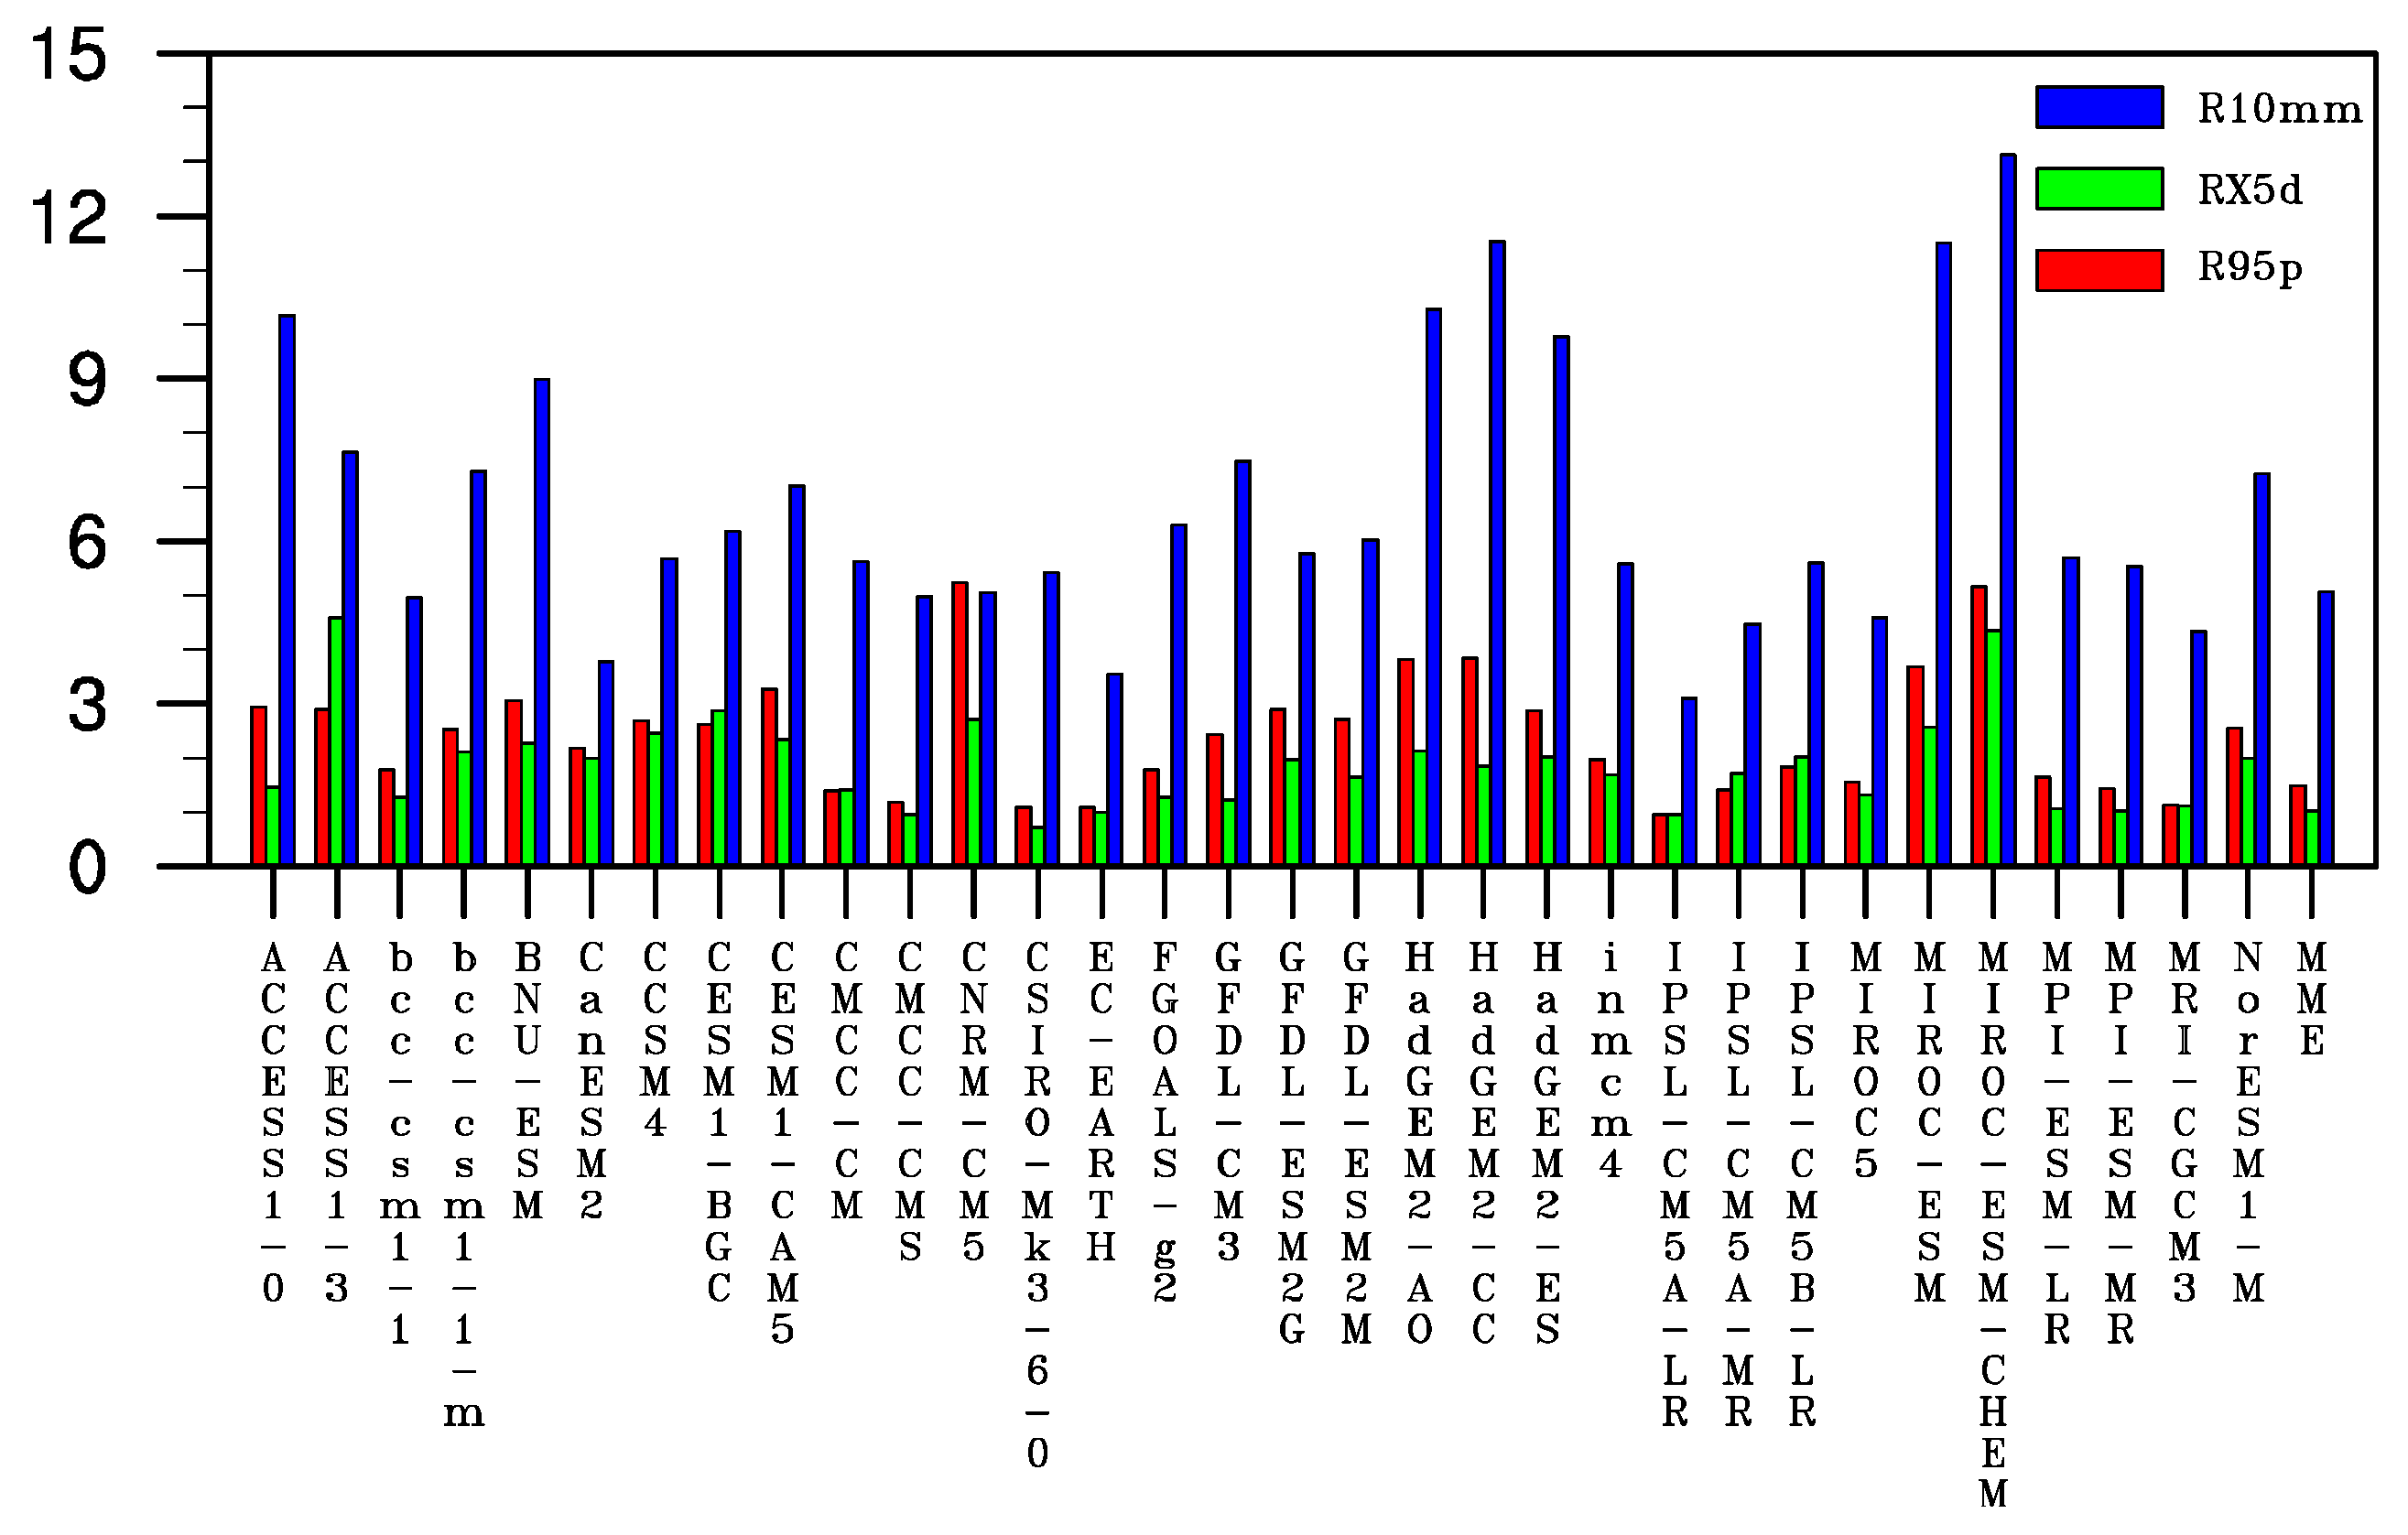
Besides the spatial distribution, the temporal variation is also a key factor for validating the model skills. Figure 4 shows the IVS defined in Section 2.3 for three extreme rainfall indices. As mentioned above, when IVS is closer to 0, the model has better simulation ability. The climate models have lager differences for simulating extreme rainfall on temporal variation. For R95p and RX5d, the range of IVS is 0.9–5.2 and 0.6–4.6, respectively, and most models have the value of IVS below 3 that implies the climate models can reproduce interannual variation of total heavy rainfall. However, the IVS of R10mm is between 3.1 and 13.1, which is clearly larger than other extreme rainfall indexes that indicate climate models have poor simulation ability on days of large rain. Over all, the five models IPSL-CM5A-LR, EC-EARTH, CSIRO-Mk3.6.0, CMCC-CMS, and MRI-CGCM3 have best performance on temporal variation of heavy rainfall events.

3.3. Optimal Models

Previous studies have selected the most skillful climate models on spatial distribution and temporal variation, respectively. The comprehensive evaluation considering both spatial and temporal factors has been taken using the MR rank. Figure 5 shows the scatter diagrams of MR based on Taylor diagrams and IVS for heavy rainfall. The correlation between Taylor diagrams and IVS for extreme precipitation is 0.8 with the significant value at 95% levels implying the consistency of model simulation on spatial and temporal patterns. Hence, the best models are in the upper right quadrant of the scatter diagram where both the Taylor diagram MR and IVS MR are close to 1. Based on the scatter diagrams of MR, the five optimal models for extreme rainfall are EC-EARTH, IPSL-CM5A-LR, CSIRO-Mk3-6-0, MRI-CGCM3, and IPSL-CM5A-MR (Group 1). The MR ranks of the Taylor diagram and IVS are both more than 0.7 for optimal models.
In order to evaluate the simulation performance from optimal models, the five worst models including MIROC-ESM-CHEM, MIROC-ESM, BNU-ESM, ACCESS1-3, and HadGEM2-CC (Group 2) have been selected for comparison. The model biases of three extreme rainfall indices from Group 1, Group 2, and all multi-model ensembles (AMME) have been shown in Figure 6. The results show the typical model wet biases for R95p and RX5d have been slowed from Group 1. The dry biases can be found in the North China Plain. In contrast, the wet biases have increased significantly from Group 2 especially for the Tibetan Plateau because the resolutions of models are too coarse to simulate the rainfall with complex terrain. Comparison with AMME, Group1 simulation skill has increased by 42%, 34%, and 37% for R95p, RX5d, and R10mm, respectively. In terms of R95p, the model biases averaged for Northern China are 31.8 mm, 54.7 mm, and 84.2 mm from Group 1, AMME, and Group 2, respectively. However, these values decrease to 12.0 mm, 18.2 mm, and 24.8 mm for Rx5d. Moreover, the biases of extreme rainfall days are 3.4 days, 5.4 days, and 8.5 days for Rx10 mm. In a word, simulations from Group 1 with high resolution significantly improve the performance in an extreme rainfall situation.
The box-and-whisker plot for relative error from Group 1, AMME, and Group 2 has been used to quantify the relative errors between model simulations and observations (Figure 7). The upper and lower bounds of the box indicate the 75th and 25th percentile of multi-model simulations and the middle horizontal line in the box indicates the multi-model median. Meanwhile, the whiskers imply the maximum and minimum values of the relative errors of the ensemble. The results show the wet biases exist in Northern China from all three ensembles while Group 1 has significant improvement. Compared with AMME, the model’s median of relative error of R95p, RX5d, and R10mm decreased by 18%, 12%, and 23% from Group 1, respectively. All ensembles have better simulation ability for R95p and RX5d, but worse performance for R10mm, which coincides with spatial distribution of model biases (Figure 6). It is also notable that the interquartile model ranges (boxes) of three indices are clearly smaller in Group 1 when compared with AMME and Group 2. This implies that the variability of individual model simulation is small in Group 1 and the results are more believable. In other words, Group 2 has not only lager relative errors, but also increased uncertainties of the individual model.

4. Projected Future Changes in Precipitation Extremes

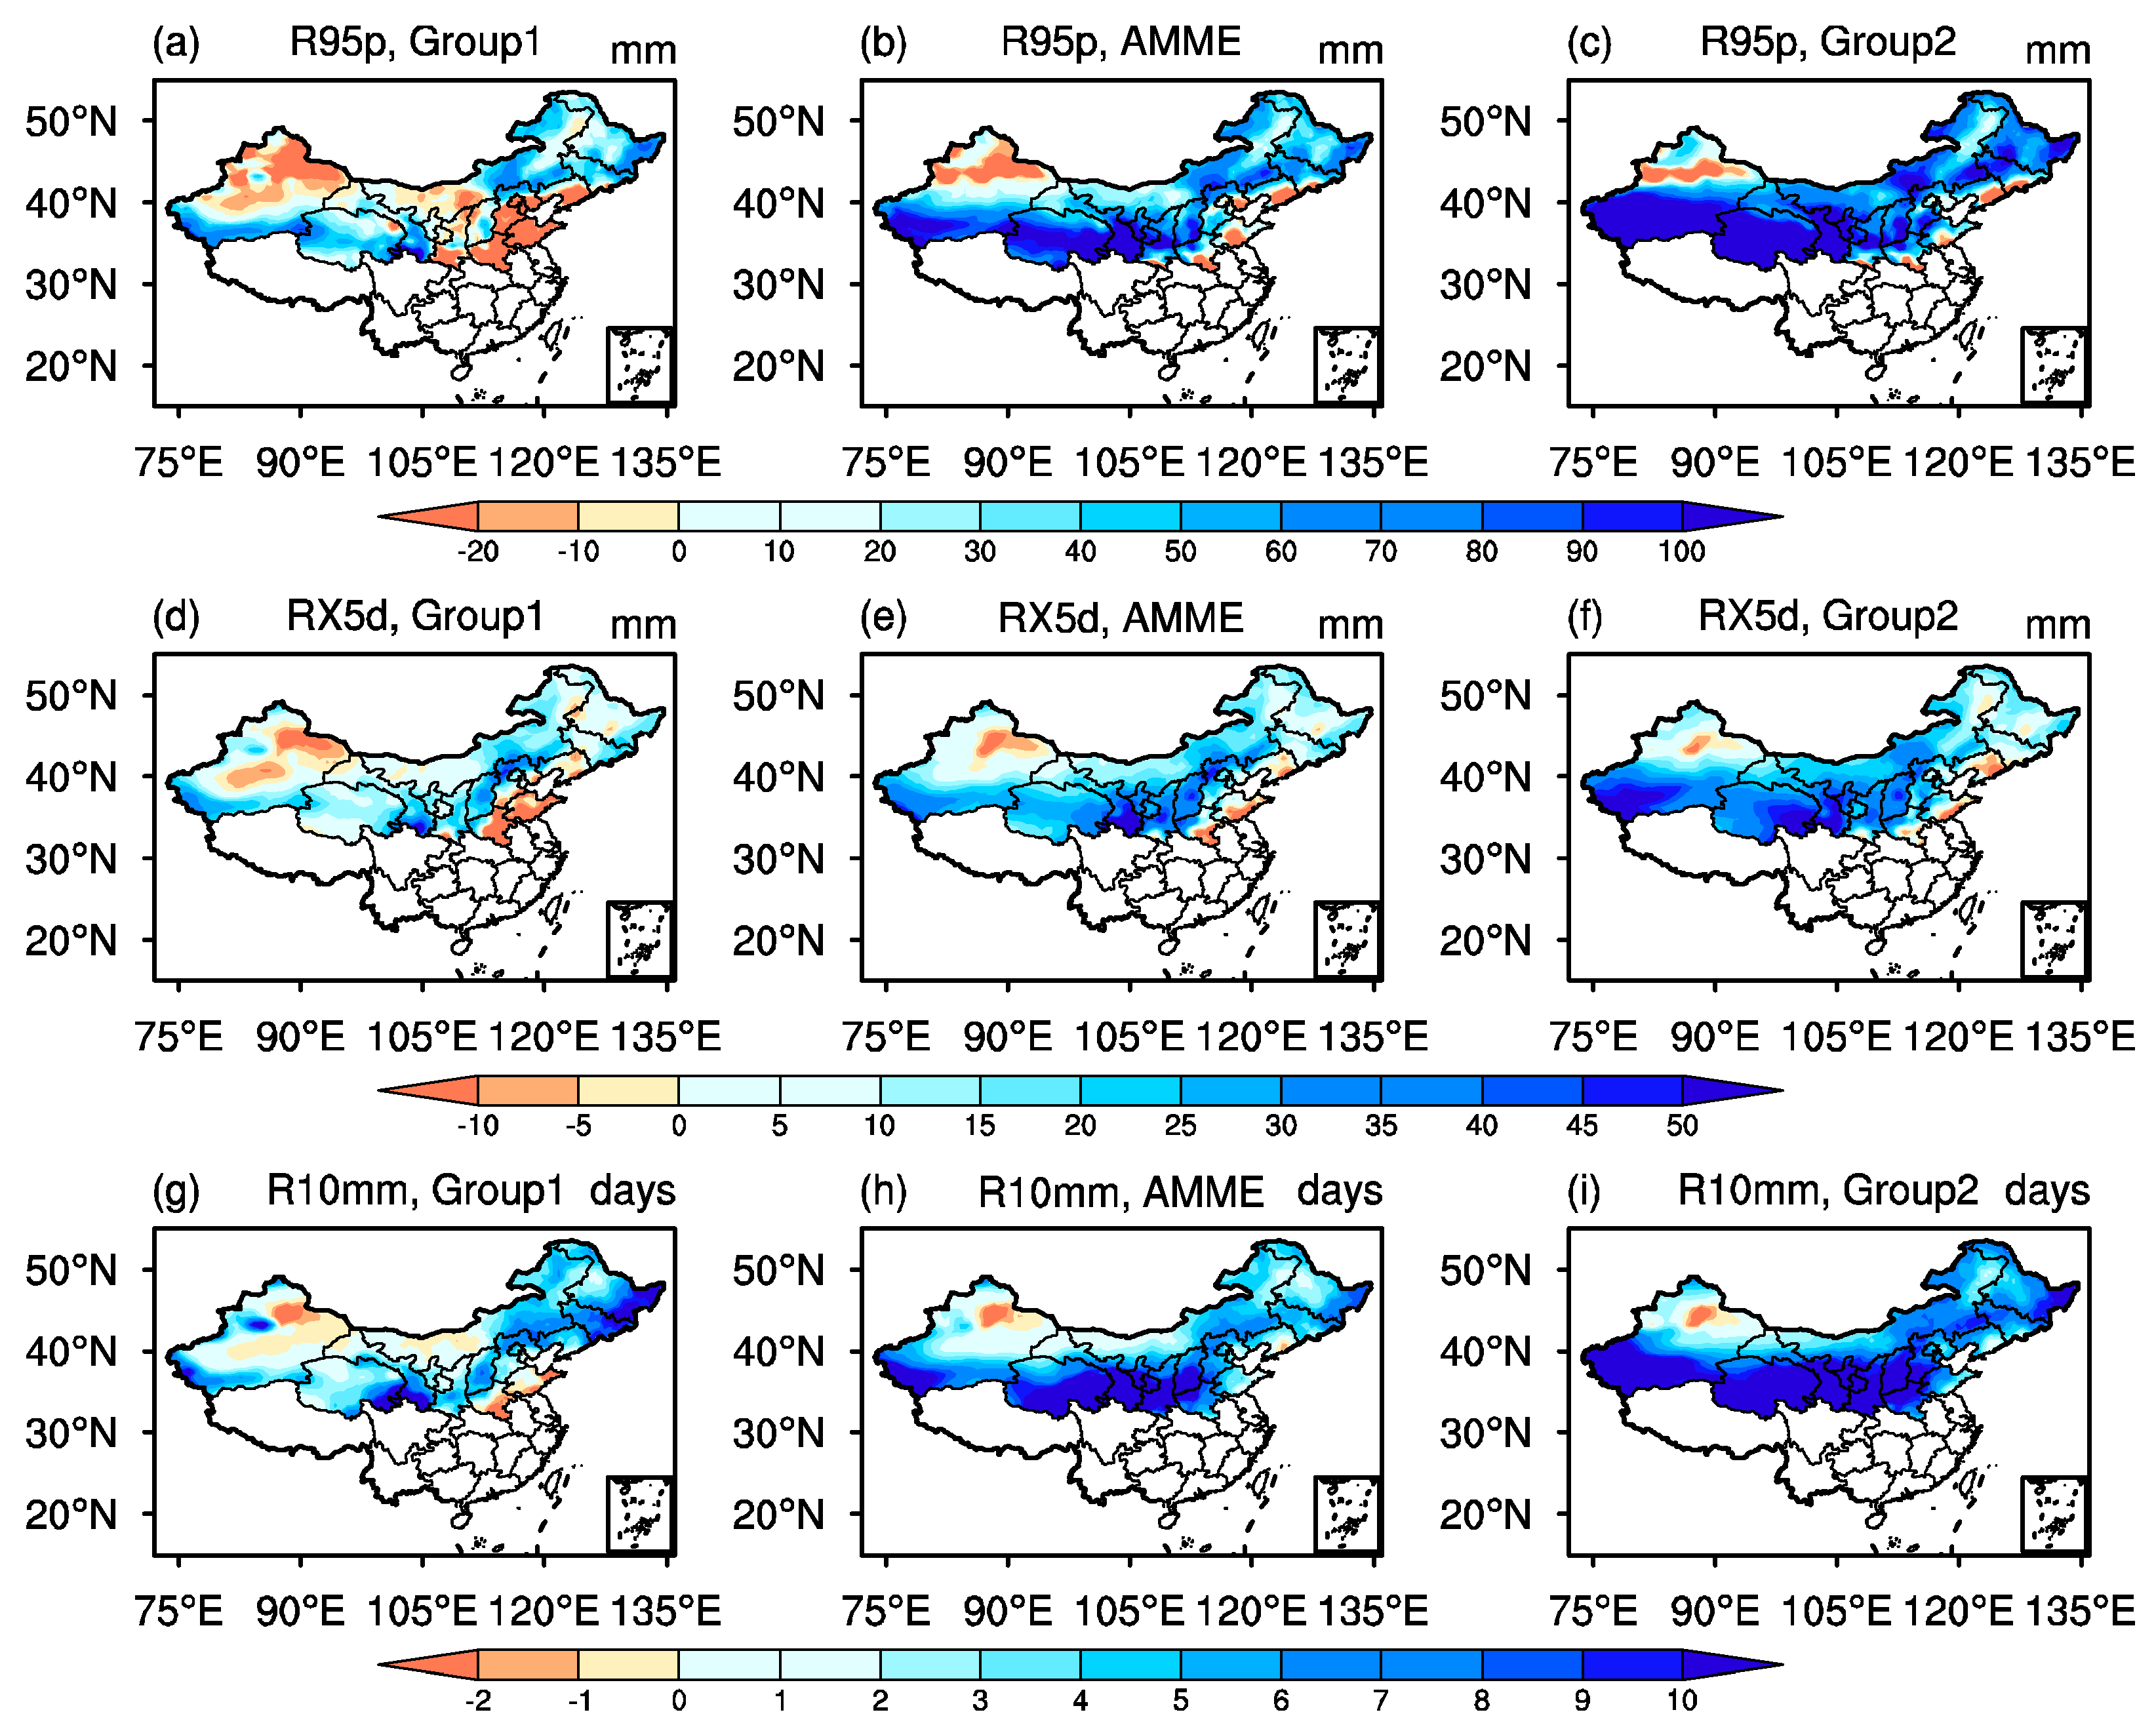
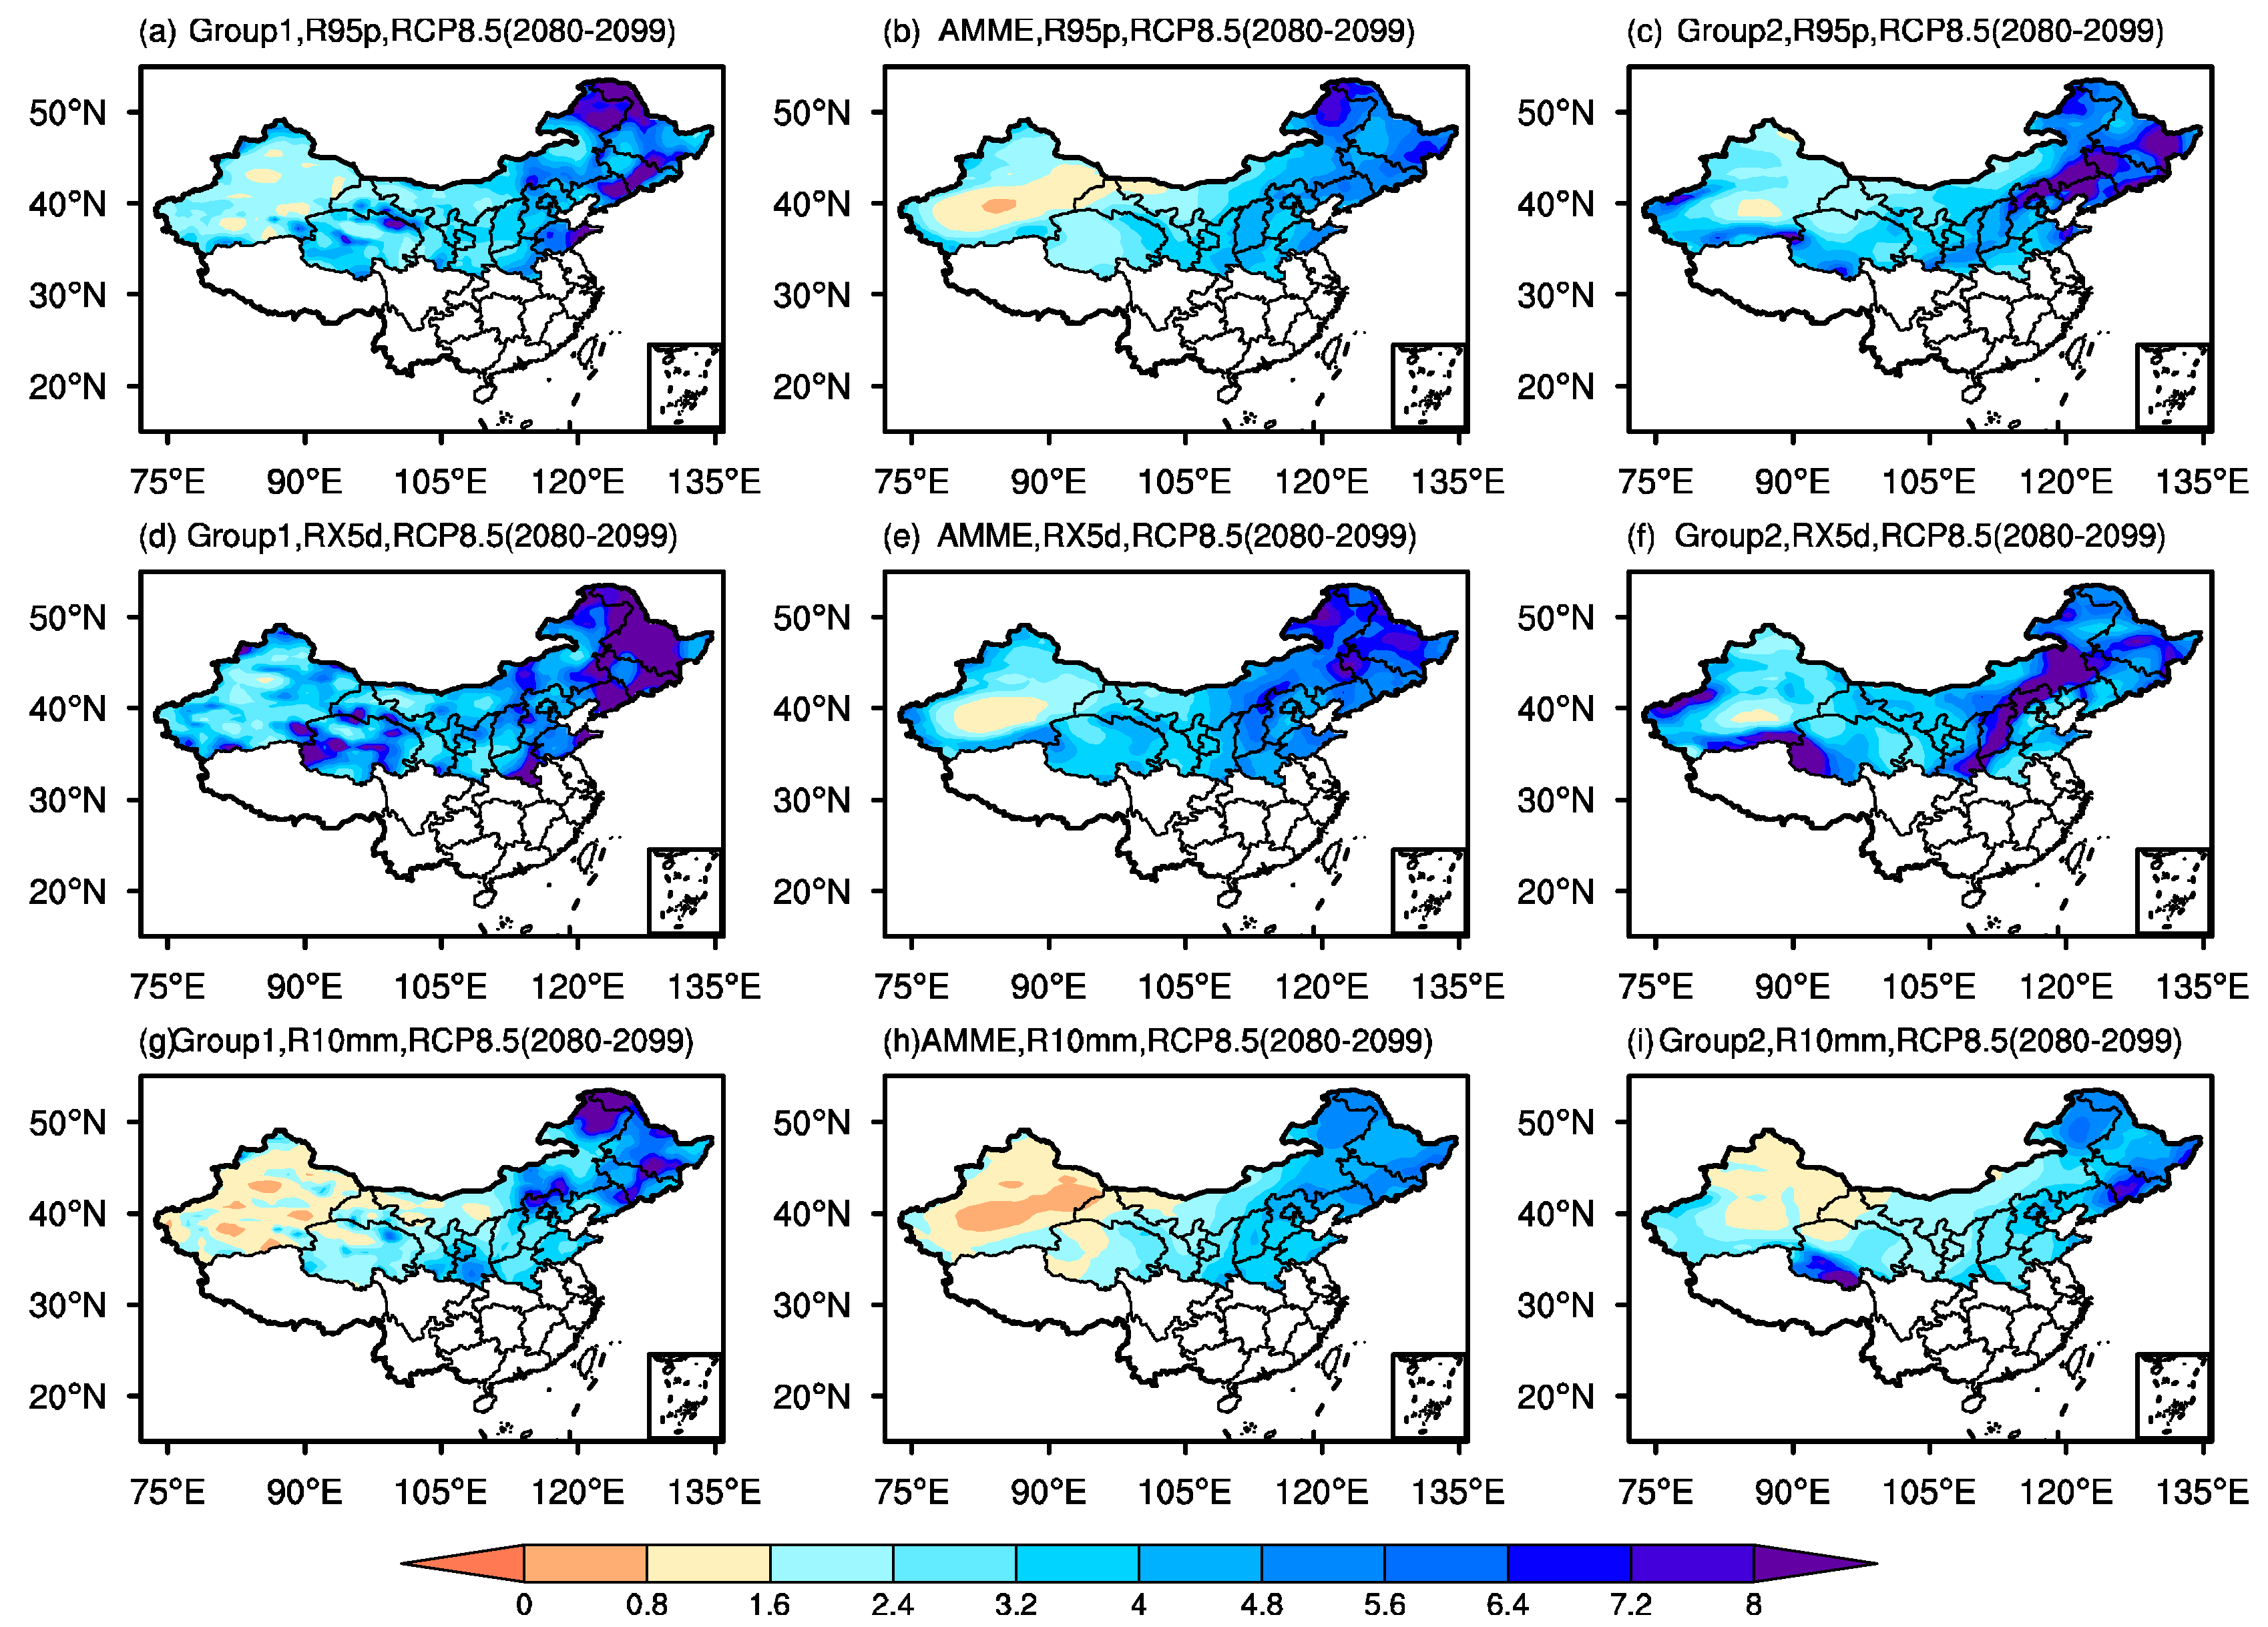
4.1. Spatial Patterns

The projected changes of three extreme rainfall indices for the medium (2046–2065) and the end of the 21st century (2080–2099) under RCP4.5 and RCP8.5 were displayed in Figure 8. As mentioned in Section 2, Northern China has been divided into three sub-regions. For R95p, the changes of three multi-model ensemble means are all about 22% over WNC, NEC, and NC under RCP4.5 in the middle of the 21st century (Figure 8a). However, the differences can be found in NWC. The change of Group 2 is clearly larger than Group 1 and AMME. In addition, there is no significant difference in the spatial pattern among three multi-model ensembles (Figure 9a–c). Under RCP8.5, the projected change of Group 2 has a significant rise than the other two model ensembles, which indicates the climate models of Group 2 are more sensitive to high emission. Meanwhile, the maximum projected change can be found in different parts over NWC from three multi-model ensembles. This implies the enhanced uncertainties in this region (Figure 9d–f). By the end of the 21st century, there is a similar pattern to the middle term, but the projected changes from Group 1 and Group 2 increase to 58% over NEC greater than the mean value from AMME under RCP8.5 because of the projected longer extreme rainfall days (Figure 8c). Moreover, the increase of extreme events is more pronounced in the basins over NWC compared to the mountains nearby (Figure 9i,j).
In term of RX5d, in the middle of the 21st century, there is no clear difference between various multi-model ensembles over Northern China except NEC under RCP4.5 (Figure 10a–c). Under higher emission RCP8.5, the variations of projections are focused on the NWC and NEC (Figure 8b and Figure 10d–f). By the end of the century, the projected change from Group 2 rises to about 3% than the value from Group 1 and AMME under RCP4.5. As the performance in the historical period, the change from Group 1 is the smallest when compared with Group 2 and AMME, especially for NWC under RCP8.5 (Figure 10i,j).
The biggest variation of R10mm from three multi-model ensembles can also be found in NWC in the middle of the 21st century both under RCP4.5 and 8.5 scenarios. The extreme rainfall events are four days longer than the present day over the north edge of the Tibetan Plateau from Group 2 due to the poor simulation with huge terrain differences. It is also notable that the days of R10mm prolongs in NEC at the end of the century both under RCP4.5 and 8.5 scenarios from Group 1 (Figure 8c and Figure 11) that is consistent with the projected increase of R95P (Figure 9). The differences of R10mm from multi-model ensembles are significant over Northern China with higher emission because the variability of the climate model simulation is large in the historical period mentioned above.
It should be noted that the impact of higher emission on the extreme rainfall indices is not clear by the middle of the century but significant by the end of the century. In a word, the most sensitive region with high emission is NWC especially for the basins where the change of R95P and Rx5d reaches 80% and 40%, respectively, by the end of the century based on the simulations from Group 1, AMME, and Group 2. However, there is no clear increase for R10mm in NWC from Group 1 and AMME, which shows the change in NWC may be due to the increase in enhanced rainfall intensity. In addition, overestimation of total extreme rainfall from Group 2 is related with the longer extreme rainfall days. Another sensitive region is NEC, which has a significant rise from Group 1 and Group 2 combined with the six longer days of extreme precipitation events. Thus, these results indicate the danger of flood events in Northern China specifically for NWC and NEC in the future, which deserves more attention.

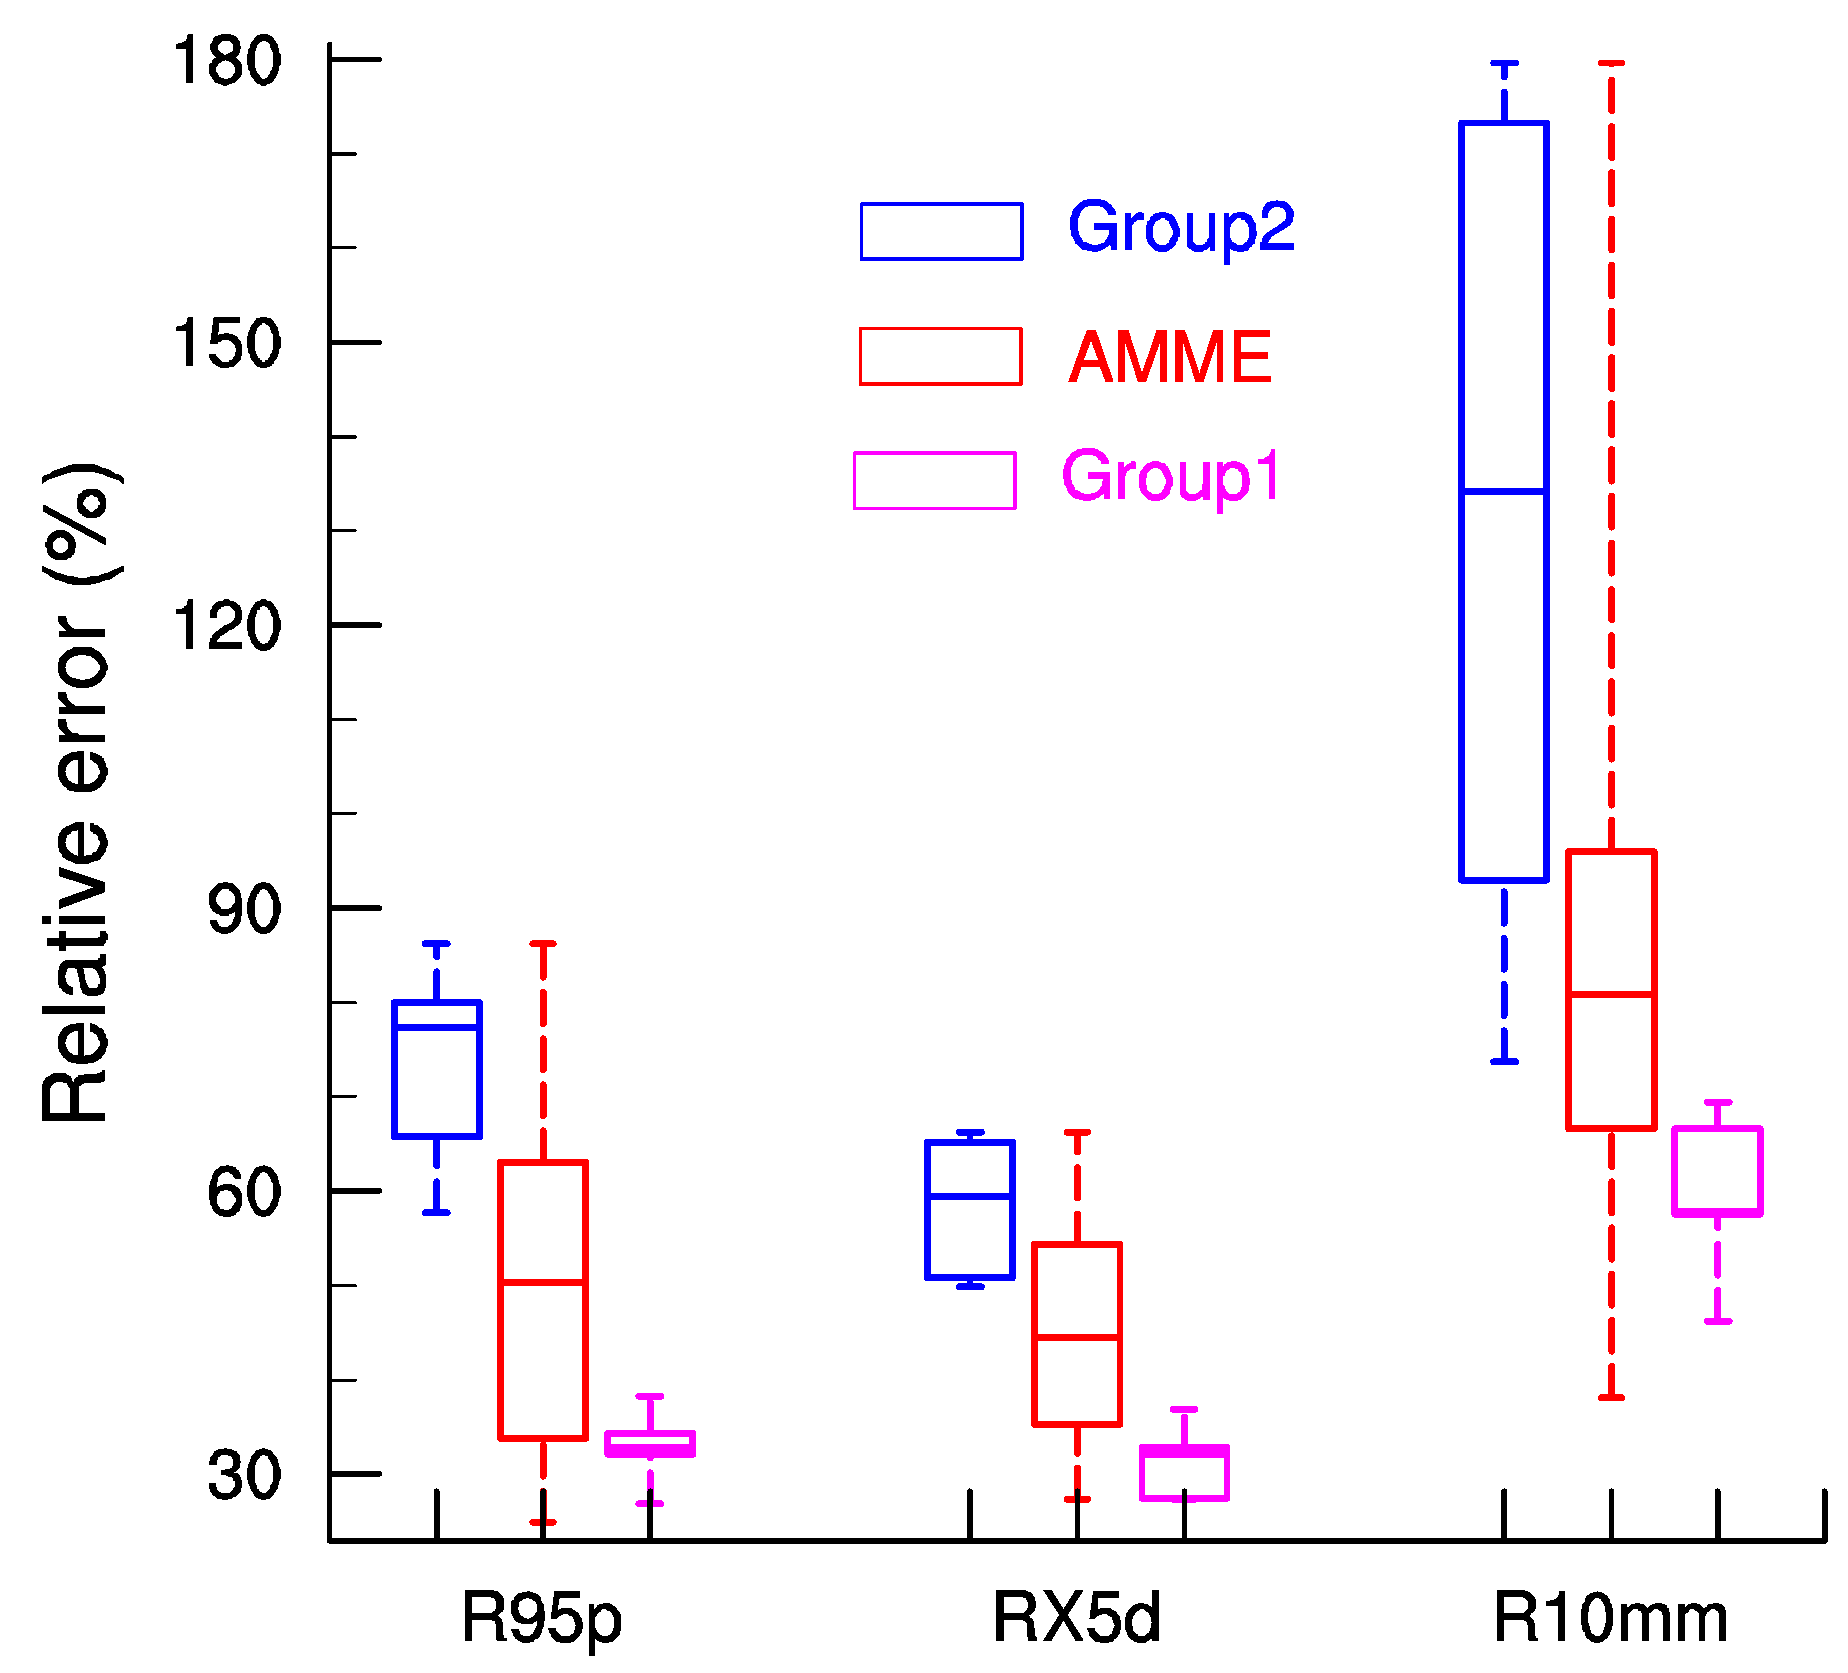
4.2. Uncertainties of Projections

The uncertainties of projection from multi-model ensemble simulations should be considered important for policy-makers. Figure 12 shows the spatial pattern of SNR for three extreme rainfall indices from Group 1, AMME, and Group 2 at the end of the 21st century under RCP8.5. The SNR distribution shows the eastern parts especially for NEC are more credible than the western part of Northern China [12,25]. Group 1 has the highest SNR while the value is lowest in AMME, which indicates the optimal model projections are at a higher confidence level. These results certify that selection of the best performance model ensembles is appropriate for future projection. The SNR values for changes of R95P and RX5d are relatively higher than those for R10mm, which imply simulation of the extreme rainfall day is difficult for climate models. Compared with the results for the middle term (Figure not shown), the SNR of three extreme rainfall indices increases with time, which shows a more clear climate signal at the end of the century.

4.3. Temporal Evolution

Figure 13 shows the temporal evolution of projected changes of three extreme precipitation indices. The change of Group 1 is smaller than observations during the historical period, while there is a significant increasing trend for precipitation indices in the 21st century. At the end of the 21st century, the projected change of P95p, RX5d, and R10mm increases by 30% and 13% and, after 1.6 days under RCP4.5, increases by 54%, and increases by 23% for 2.7 days under RCP8.5, respectively. The results show different emission scenarios have little influence on extreme rainfall indices in the middle of the century but the impacts become significant after the middle of the 21st century especially for R95p because the natural variability may play a larger role before the mid-21st century, according to IPCC AR5 [2]. Moreover, the change of R10mm is not clear, which indicates the increase of P95p is mainly due to the enhanced precipitation intensity. Hence, the high emission may result in the increase of extreme total precipitation and intensity in Northern China at the end of the century that is consistent with other studies [13,44].

4.4. Possible Causes

The atmospheric circulation during the summer from three multi-model ensembles has been shown in Figure 14 to investigate the possible causes of the differences of extreme rainfall indices. The southwest winds from the Arabian sea combined with southeast winds over the eastern edge of the subtropical high bring the high moisture transport to Northern China in the summer (Figure 14a). However, the weak subtropical high and southwesterlies from Group 1 lead to less moisture transport to Northern China especially for NWC (Figure 14c) so that the wet biases decease significantly (Figure 6). Moreover, the cyclonic anomalies can be found over NEC, which results in more extreme rainfall events. In contrast, the enhanced subtropical high associated with stronger southwest winds lead to the northward extension of the East Asian summer monsoon with overestimation rainfall over Northern China from Group 2 [25,45,46]. The simulation of atmospheric circulation from AMME is similar with JRA55 but the weak intensified south winds can still be found over Eastern China, which results in the wet biases over Northern China.

5. Discussion and Conclusions

In this study, 32 CMIP5 climate models have been assessed for extreme rainfall indices over Northern China in terms of spatial distribution using Taylor diagrams and temporal variations based on IVS during the historical period from 1986 to 2005. Based on MR rank considering both spatial and temporal factors, five optimal models have been selected for extreme precipitation events. Then the projections of future changes and the possible reasons from Group 1, AMME, and Group 2 have been analyzed under RCP 4.5 and RCP 8.5 scenarios during the middle and end of the 21st century. The main conclusions can be summarized as follows.
(1) CMIP5 models show good performance on spatial patterns but overestimate the amplitude of extreme rainfall over Northern China especially for the east edge of the Tibetan Plateau. The spatial distributions of R95p and RX5d are simulated better than R10mm. The performance of temporal variation is not as good as spatial distribution but most of models still capture interannual variation of R95p and RX5d. For R10mm, most of the models show poor simulation abilities on days of large rain.
(2) The good correlations of Taylor diagrams and IVS indicate the consistency of the model simulation on spatial and temporal patterns. The five best models for extreme rainfall are EC-EARTH, IPSL-CM5A-LR, CSIRO-Mk3-6-0, MRI-CGCM3, and IPSL-CM5A-MR. As a comparison with AMME, the performance of Group 1 has improved by 42%, 34%, and 37% for R95p, RX5d, and R10mm, respectively. Moreover, the small variations of the five best models imply the reduction of uncertainties from Group 1.
(3) In the middle of the 21st century, the higher emission has no clear influence on extreme rainfall indices. However, the impacts of different greenhouse gas emissions become significant and there is a clear rising trend for R95p and RX5d under RCP8.5 at the end of the century. The fastest-rising region can be found in NWC from three multi-model ensembles due to the increase of enhanced rainfall intensity. Moreover, the overestimation of total extreme rainfall from Group 2 in NWC is related with the longer heavy rainfall days. However, the uncertainties analysis shows the increase of extreme rainfall over NWC reached the low confidence level. On the other hand, the increases of R95p and RX5d are higher over NEC from Group 1 because of the longer extreme rainfall days. The SNR results show the projection from Group 1 are more credible especially for NEC, which should be focused on in the future.
(4) The improvement of Group1 simulation is related to the weak subtropical high and the southwest winds from the Arabian sea lead to a decrease in moisture transport into Northern China. However, the cyclonic anomalies over NEC result in more extreme rainfall. In contrast, the situation is completely opposite from Group 2. The stronger subtropical high and southwesterlies cause the overestimation of extreme rainfall over Northern china, especially for NWC.
The present study gives the performance of the individual CMIP5 model and the projection of extreme rainfall over Northern China, which provides references for future scientific research and policy decision-making. The future analysis of the upcoming CMIP6 model and application of the (multi-ensemble) high resolution RCMs over this region with complex topography is worthy for further investigations [47,48].

Author Contributions

Conceptualization, X.L. and X.R.; methodology, X.L.; software, X.R.; validation, X.L.; formal analysis, X.L.; investigation, X.L. and X.R.; resources, X.R.; data curation, X.R.; writing—original draft preparation, X.L.; writing—review and editing, X.L.; visualization, X.R.; supervision, X.L.; project administration, W.D.; funding acquisition, W.D.

Funding

This research was funded by the National Key R & D Program of China, grant number “2016YFA0600704”.

Acknowledgments

The National Key R & D Program of China (2016YFA0600704), the National Natural Science Foundation of China (Grans 41530530, 41575069), and Pearl River Science & Technology Nova Program of Guangzhou (201806010146) supported this study. We acknowledge the World Climate Research Program’s Working Group on Coupled Modeling, which is responsible for CMIP. We also thank the climate modeling groups for producing and making their simulations available.

Conflicts of Interest

The authors declare no conflict of interest. The funders had no role in the design of the study; in the collection, analyses, or interpretation of data; in the writing of the manuscript, or in the decision to publish the results.

References

  1. Field, C.B.; Barros, V.; Stocker, T.F.; Dahe, Q. (Eds.) Managing the Risks of Extreme Events and Disasters to Advance Climate Change Adaptation; Cambridge University Press: Cambridge, UK, 2012; 582p. [Google Scholar]
  2. IPCC. Climate Change 2013: The Physical Science Basis; Stocker, T.F., Qin, D., Nauels, A., Xia, Y., Bex, V., Midgley, P.M., Plattner, G.K., Tignor, M.M.B., Allen, S.K., Boschung, J., Eds.; Contribution of Working Group I to the Fifth Assessment Report of the Intergovernmental Panel on Climate Change; Cambridge University Press: Cambridge, UK; New York, NY, USA, 2013; 1029p. [Google Scholar]
  3. Stocker, T.F.; Qin, D.; Plattner, G.-K.; Tignor, M.; Allen, S.K.; Boschung, J.; Nauels, A.; Xia, Y.; Bex, V.; Midgley, P.M.; et al. (Eds.) Climate Change 2013: The Physical Science Basis; Cambridge University Press: Cambridge, UK, 2013; 1535p. [Google Scholar]
  4. Pierce, D.W.; Barnett, T.P.; Santer, B.D.; Gleckler, P.J. Selecting global climate models for regional climate change studies. Proc. Natl. Acad. Sci. USA 2009, 106, 8441–8446. [Google Scholar] [CrossRef] [PubMed] [Green Version]
  5. Sperber, K.R.; Annamalai, H.; Kang, I.-S.; Kitoh, A.; Moise, A.; Turner, A.; Wang, B.; Zhou, T. The Asian summer monsoon: An intercomparison of CMIP5 vs. CMIP3 simulations of the late 20th century. Clim. Dyn. 2012, 41, 2711–2744. [Google Scholar] [CrossRef]
  6. Wuebbles, D.; Meehl, G.; Hayhoe, K.; Karl, T.R.; Kunkel, K.; Santer, B.; Wehner, M.; Colle, B.; Fischer, E.M.; Fu, R.; et al. CMIP5 climate model analyses: Climate extremes in the United States. Bull. Am. Meteorol. Soc. 2014, 95, 571–583. [Google Scholar] [CrossRef]
  7. Yu, E.T.; Xiang, W.L. Projected Climate Change in the Northwestern Arid Regions of China: An Ensemble of Regional Climate Model Simulations. Atmos. Ocean. Sci. Lett. 2015, 8, 131–142. [Google Scholar]
  8. Xia, L.; Zhou, Y. Tracking Jianghuai cyclones in China and their climate characteristics. Atmosphere 2018, 9, 341. [Google Scholar] [CrossRef]
  9. Gao, X.J.; Zhao, Z.C.; Giorgi, F. Changes of extreme events in regional climate simulations over east Asia. Adv. Atmos. Sci. 2002, 19, 927–942. [Google Scholar]
  10. Chen, W.L.; Jiang, Z.; Li, L. Probabilistic projections of climate change over China under the SRES A1B scenario using 28 AOGCMs. J. Clim. 2011, 24, 4741–4756. [Google Scholar] [CrossRef]
  11. Wang, H.-J.; Sun, J.-Q.; Chen, H.-P.; Zhu, Y.-L.; Zhang, Y.; Jiang, D.-B.; Lang, X.-M.; Fan, K.; Yu, E.-T.; Yang, S. Extreme Climate in China: Facts, Simulation and Projection. Meteorol. Z. 2012, 21, 279–304. [Google Scholar] [CrossRef]
  12. Ou, T.; Chen, D.; Linderholm, H.; Jeong, J.-H. Evaluation of global climate models in simulating extreme precipitation in China. Tellus A Dyn. Meteorol. Oceanogr. 2013, 65. [Google Scholar] [CrossRef]
  13. Zhou, B.; Wen, Q.H.; Xu, Y.; Song, L.; Zhang, X. Projected Changes in Temperature and Precipitation Extremes in China by the CMIP5 Multimodel Ensembles. J. Clim. 2014, 27, 6591–6610. [Google Scholar] [CrossRef]
  14. Di, T.; Yan, G.; Dong, W.J. Future changes and uncertainties in temperature and precipitation over China on CMIP5 models. Adv. Atmos. Sci. 2015, 32, 487–496. [Google Scholar]
  15. Xu, Y.; Gao, X.; Giorgi, F.; Zhou, B.; Shi, Y.; Wu, J.; Zhang, Y. Projected changes in temperature and precipitation extremes over China as measured by 50-yr return values and periods based on a CMIP5 ensemble. Adv. Atmos. Sci. 2018, 35, 376–388. [Google Scholar] [CrossRef]
  16. Chen, H.P. Projected change in extreme rainfall events in China by the end of the 21st century using CMIP5 models. Chin. Sci. Bull. 2013, 58, 1462–1472. [Google Scholar] [CrossRef] [Green Version]
  17. Palmer, T.N.; Doblas-Reyes, F.J.; Hagedorn, R.; Weisheimer, A. Probabilistic prediction of climate using muti-model ensembles: From basics to applications. Philos. Trans. R. Soc. B 2005, 360, 1991–1998. [Google Scholar] [CrossRef] [PubMed]
  18. Thomson, M.C.; Doblas-Reyes, F.J.; Mason, S.J.; Hagedorn, R.; Connor, S.J.; Phindela, T.; Morse, A.P.; Palmer, T.N. Malaria early warnings based on seasonal climate forecasts from multi-model ensembles. Nature 2006, 439, 576–579. [Google Scholar] [CrossRef] [PubMed]
  19. Sun, Y.; Ding, Y.H. An assessment on the performance of IPCC AR4 climate models in simulating interdecadal variations of the East Asian summer monsoon. Acta Meteor. Sin. 2008, 22, 427–488. [Google Scholar]
  20. Knutti, R. The end of model democracy? An editorial comment. Clim. Chang. 2010, 102, 395–404. [Google Scholar] [CrossRef]
  21. Seo, K.H.; Ok, J. Assessing future changes in the East Asian summer monsoon using CMIP3 models: Results from the best model ensemble. J. Clim. 2013, 26, 1807–1817. [Google Scholar] [CrossRef]
  22. Sillmann, J.; Kharin, V.V.; Zhang, X.; Zwiers, F.W.; Bronaugh, D. Climate extremes indices in the CMIP5 multimodel ensemble: Part Model evaluation in the present climate. J. Geophys. Res. 2013, 118, 1716–1733. [Google Scholar] [CrossRef]
  23. Sillmann, J.V.; Kharin, V.; Zhang, X.W.; Zwiers, F.; Bronaugh, D. Climate extremes indices in the CMIP5 multimodel ensemble: Part Future climate projections. J. Geophys. Res. 2013, 118, 2473–2493. [Google Scholar] [CrossRef]
  24. Yu, E.T.; Sun, J.Q.; Chen, H.P.; Xiang, W.L. Evaluation of a high-resolution historical simulation over China: Climatology and extremes. Clim. Dyn. 2014, 45, 2013–2031. [Google Scholar] [CrossRef]
  25. Jiang, Z.H.; Li, W. Extreme precipitation indices over China in CMIP5 models. J. Clim. 2015, 28, 8603–8619. [Google Scholar] [CrossRef]
  26. Tebaldi, C.; Hayhoe, K.; Arblaster, J.M.; Meehl, G.A. Going to the extremes: An intercomparison of model-simulated historical and future changes in extreme events. Clim. Chang. 2006, 79, 185–211. [Google Scholar] [CrossRef]
  27. Zhang, X.B.; Alexander, L.; Hegerl, G.C.; Jones, P.; Tank, A.K.; Perterson, T.C.; Trewin, B.; Zwiers, F.W. Indices for monitoring changes in extremes based on daily temperature and precipitation data. Wiley Interdiscip. Rev. Clim. Chang. 2011, 2, 851–870. [Google Scholar] [CrossRef]
  28. Wu, J.; Gao, X.J. A gridded daily observation dataset over China region and comparison with the other datasets. Chin. J. Geophys. 2013, 56, 1102–1111. [Google Scholar]
  29. Xu, Y.; Gao, X.J.; Luo, Y. Projected changes in temperature and precipitation extremes over the Yangtze River Basin of China in the 21th century. Quat. Int. 2009, 208, 44–52. [Google Scholar] [CrossRef]
  30. Klein Tank, A.M.G.; Konnen, G.P. Trends in indices of daily temperature and precipitation extremes in Europe 1964–1999. J. Clim. 2003, 16, 3665–3680. [Google Scholar] [CrossRef]
  31. Alexander, L.V.; Zhang, X.; Peterson, T.C.; Caesar, J.; Gleason, B.; Tank, A.M.G.K.; Haylock, M.; Collins, D.; Trewin, B.; Rahimzadeh, F.; et al. Global observed changes in daily climate extremes of temperature and precipitation. J. Geophys. Res. 2006, 111, 1–22. [Google Scholar] [CrossRef]
  32. Nie, H.; Qin, T.; Yang, H.; Chen, J.; He, S.; Lv, Z.; Shen, Z. Trend Analysis of Temperature and Precipitation Extremes during Winter Wheat Growth Period in the Major Winter Wheat Planting Area of China. Atmosphere 2019, 10, 240. [Google Scholar] [CrossRef]
  33. Taylor, K.E. Summarizing multiple aspects of model performance in a single diagram. J. Geophys. Res. 2001, 106, 7183–7192. [Google Scholar] [CrossRef]
  34. Gleckler, P.J.; Taylor, K.E.; Doutriaux, C. Performance metrics for climate models. J. Geophys. Res. 2008, 113, D06104. [Google Scholar] [CrossRef]
  35. Santer, B.D.; Taylor, K.E.; Gleckler, P.J.; Bonfils, C.; Barnett, T.P.; Pierce, D.W.; Wigley, T.M.L.; Mears, C.; Wentz, F.J.; Brüggemann, W.; et al. Incorporating model quality information in climate change detection and attribution studies. Proc. Natl. Acad. Sci. USA 2009, 106, 14778–14783. [Google Scholar] [CrossRef] [PubMed] [Green Version]
  36. Schuenemann, K.C.; Cassano, J.J. Changes in synoptic weather patterns and Greenland precipitation in the 20th and 21st centuries: Evaluation of late 20th century simulations from IPCC models. J. Geophys. Res. 2009, 114. [Google Scholar] [CrossRef]
  37. Hawkins, E.; Sutton, R. The potential to narrow uncertainty in projections of regional precipitation change. Clim. Dyn. 2011, 37, 407–418. [Google Scholar] [CrossRef]
  38. Kim, J.; Park, S.K. Uncertainties in calculating precipitation climatology in East Asia. Hydrol. Earth. Syst. Sci. 2016, 20, 651–658. [Google Scholar] [CrossRef] [Green Version]
  39. Kim, I.W.; Oh, J.; Woo, S.; Kripalani, R.H. Evaluation of precipitation extremes over the Asia domain: Observation and modelling studies. Clim. Dyn. 2019, 52, 1317–1342. [Google Scholar] [CrossRef]
  40. Zhang, Y.; Xu, Y.L.; Dong, W.J.; Cao, L.J.; Sparrow, M. A future climate scenario of regional changes in extreme climate events over China using the PRECIS climate model. Geophys. Res. Lett. 2006, 33. [Google Scholar] [CrossRef]
  41. Gao, X.J.; Shi, Y.; Song, R.Y.; Giorgi, F.; Wang, Y.G.; Zhang, D.F. Reduction of future monsoon precipitation over China: Comparison between a high resolution RCM simulation and the driving GCM. Meteorol. Atmos. Phys. 2008, 100, 73–86. [Google Scholar] [CrossRef]
  42. Xu, J.Y.; Shi, Y.; Gao, X.J.; Giorgi, F. Projected changes in climate extremes over China in the 21st century from a high resolution regional climate model (RegCM3). Chin. Sci. Bull. 2013, 58, 1443–1452. [Google Scholar] [CrossRef]
  43. Lee, J.W.; Hong, S.Y.; Chang, E.C.; Suh, M.S.; Kang, H.S. Assessment of future climate change over East Asia due to the RCP scenarios downscaled by GRIMs-RMP. Clim. Dyn. 2014, 42, 733–747. [Google Scholar] [CrossRef]
  44. Li, W.; Jiang, Z.H.; Xu, J.J.; Li, L. Extreme precipitation Indices over China in CMIP5 Models. Part II: Probabilistic Projection. J. Clim. 2016, 29, 8989–9004. [Google Scholar] [CrossRef]
  45. You, Q.; Kang, S.; Aguilar, E.; Pepin, N.; Flügel, W.A.; Yan, Y.; Xu, Y.; Zhang, Y.; Huang, J. Changes in daily climate extremes in China and their connection to the large scale atmospheric circulation during 1961–2003. Clim. Dyn. 2011, 36, 2399–2417. [Google Scholar] [CrossRef]
  46. Zhang, Q.; Xu, C.; Zhang, Z.; Chen, Y.D.; Liu, C.; Lin, H. Spatial and temporal variability of precipitation maxima during 1960–2005 in the Yangtze River basin and possible association with large-scale circulation. J. Hydrol. 2008, 353, 215–227. [Google Scholar] [CrossRef]
  47. Gao, X.J.; Shi, Y.; Filippo, G. Comparison of convective parameterizations in RegCM4 experiments over China with CLM as the land surface model. Atmos. Ocean. Sci. Lett. 2016, 9, 246–254. [Google Scholar] [CrossRef] [Green Version]
  48. Gao, X.-J.; Wu, J.; Shi, Y.; Wu, J.; Han, Z.-Y.; Zhang, D.-F.; Tong, Y.; Li, R.-K.; Xu, Y.; Giorgi, F. Future changes in thermal comfort conditions over China based on multi-RegCM4 simulations. Atmos. Ocean. Sci. Lett. 2018, 11, 291–299. [Google Scholar] [CrossRef] [Green Version]
Figure 1. Terrain elevations (m, shaded) over Northern China and three subregions including NEC (Northeast China), NC (North China), and NWC (Northwest China).
Atmosphere 10 00691 g001
Figure 2. Spatial distribution of extreme rainfall indices over Northern China in the present day (1986–2005) with observations (left column), CMIP5 multi-model ensembles (middle column): (a,b) R95p (units: mm), (c,d) RX5d (units: mm) (e,f), and R10mm (units: days).
Atmosphere 10 00691 g002
Figure 3. Taylor diagrams of three extreme rainfall indices including R95p (red dot), RX5d (blue dot), and R10mm (purple dot) over Northern China. Small dots represent 32 CMIP5 climate models (Table 1) and large dots denote the CMIP5 multi-model ensemble mean.
Atmosphere 10 00691 g003
Figure 4. IVS of 32 individual CMIP5 climate model and CMIP5 multi-model ensemble mean for three extreme rainfall indices including R95p (red), RX5d (green), and R10mm (blue).
Atmosphere 10 00691 g004
Figure 5. Scatter diagrams of MR based on Taylor diagrams and IVS for extreme rainfall. The numbers of 1–32 represent 32 individual CMIP5 climate models (Table 1) and 33 denotes the CMIP5 multi-model ensemble mean.
Atmosphere 10 00691 g005
Figure 6. Model biases of three extreme rainfall indices including (ac) R95p, (df) RX5d, and (gi) R10mm form Group 1, AMME, and Group 2.
Atmosphere 10 00691 g006
Figure 7. Box-and-whisker plot for relative error change (%) of three extreme rainfall indices including R95p, RX5d, R10mm from Group 1 (pink), AMME (red), and Group 2 (blue) over Northern China in the present day (1986–2005).
Atmosphere 10 00691 g007
Figure 8. Box-and-whisker plot for projected changes (%) of three extreme rainfall indices including (a) R95p, (b) RX5d, and (c) R10mm form AMME during the middle of the century (2046–2065) and the end of the 21st century (2080–2099) relative to the reference period (1986–2005) under RCP 4.5 (blue) and RCP8.5 (red). The Group 1, Group 2, and AMME multi-model ensemble means are indicated by the purple, black, and blue dots.
Atmosphere 10 00691 g008
Figure 9. Projection change (%) of R95P from Group 1 (left column), AMME (middle column), and Group 2 (right column) under RCP4.5 and RCP 8.5 during the middle of the century (2046–2065) (af) and the end of the 21st century (2080–2099) (gl).
Atmosphere 10 00691 g009
Figure 10. Same as in Figure 9 but for RX5d.
Atmosphere 10 00691 g010
Figure 11. Same as in Figure 9 but for R10mm.
Atmosphere 10 00691 g011
Figure 12. The spatial pattern of SNR for R95P (ac), RX5d (df), and R10mm (gi) from Group 1, AMME, and Group 2 under RCP 8.5 at the end of the 21st century (2080–2099).
Atmosphere 10 00691 g012
Figure 13. Three extreme rainfall indices including R95p (a), RX5d (b), and R10mm (c) change relative to the reference period (1986–2005) for observation (black), historical simulation (yellow), projection under RCP4.5 (blue), and RCP8.5 (red) from Group 1. Solid lines show the Group 1 average and the shading indicates interquartile AMME spread (25th and 75th quantiles).
Atmosphere 10 00691 g013
Figure 14. Summer (June-August) seasonal-mean geopotential height (shaded: gpm) and wind vectors (m/s) at 850 hPa from (a) JRA55 and differences between AMME (b), Group 1 (c), Group 2 (d), and JRA55.
Atmosphere 10 00691 g014
Table 1. Information of the 32 CMIP5 climate models used in this study.
No.Model NameInstitution Name and CountryAtmospheric Resolution
1ACCESS1.0Commonwealth Scientific and Industrial Research Organization (CSIRO), and Bureau of Meteorology (BoM), Australia1.875° × 1.25°
2ACCESS1.3CSIRO and BoM, Australia1.875° × 1.25°
3BCC_CSM1.1Beijing Climate Center (BCC), China Meteorological Administration (CMA), China2.8125° × 2.8125°
4BCC_CSM1.1 (m)BCC and CMA, China1.125° × 1.12°
5BNU-ESMCollege of Global Change and Earth System Science, Beijing Normal University (GCESS), China2.8° × 2.8°
6CanESM2Canadian Center for Climate Modelling and Analysis (CCCma), Canada2.8° × 2.8°
7CCSM4National Center for Atmospheric Research (NCAR), USA1.25° × 0.94°
8CESM1(BGC)National Science Foundation (NSF), Department of Energy (DOE), National Center for Atmospheric Research (NCAR), USA1.25° × 0.94°
9CESM1 (CAM5)NSF-DOE-NCAR, USA1.25° × 0.94°
10CMCC-CMCentro Euro-Mediterraneo per I Cambiamenti Climatici (CMCC), Italy0.75° × 0.75°
11CMCC-CMSCMCC1.875° × 1.875°
12CNRM-CM5Centre National de Recherches Météorologiques–Centre Européen de Recherche et de Formation Avancée en Calcul Scientifique (CNRM–CERFACS), France1.4° × 1.4
13CSIRO-Mk3.6.0CSIRO Marine and Atmospheric Research (Melbourne) in collaboration with the Queensland Climate Change Centre of Excellence (QCCCE) (Brisbane), Australia1.875° × 1.875°
14EC-EARTHEC-EARTH consortium1.125° × 1.125°
15FGOALS-g2LASG, Institute of Atmospheric Physics, Chinese Academy of Sciences and Center for Earth System Science (CESS), Tsinghua University, China2.8° × 3°
16GFDL-CM3NOAA/Geophysical Fluid Dynamics Laboratory (GFDL), USA2.5° × 2.0°
17GFDL-ESM2GNOAA/GFDL, USA2.5° × 2.0°
18GFDL-ESM2MNOAA/GFDL, USA2.5° × 2.0°
19HadGEM2-AONational Institute of Meteorological Research (NIMR)/Korea Meteorological Administration (KMA), Korea and United Kingdom1.875° × 1.25°
20HadGEM2-CCMet Office Hadley Centre (MOHC), United Kingdom1.875° × 1.25°
21HadGEM2-ESMOHC, United Kingdom1.875° × 1.25°
22INM-CM4Institute for Numerical Mathematics (INM), Russia2.0° × 1.5°
23IPSL-CM5A-LRInstitute Pierre-Simon Laplace (IPSL), France3.75° × 1.875°
24IPSL-CM5A-MRIPSL, France2.5° × 1.27°
25IPSL-CM5B-LRIPSL, France3.75° × 1.875°
26MIROC5The University of Tokyo (MIROC), Japan1.40625° × 1.40625°
27MIROC-ESMMIROC2.8125° × 2.8125°
28MIROC-ESM-CHEMMIROC2.8125° × 2.8125°
29MPI-ESM-LRMax Planck Institute for Meteorology (MPI-M), Germany1.875° × 1.875°
30MPI-ESM-MRMPI-M, Germany1.875° × 1.875°
31MRI-CGCM3Meteorological Research Institute (MRI), Japan1.125° × 1.125°
32NorESM1-MNorwegian Climate Center (NCC), Norway1.8725° × 2.5
Table 2. Information of extreme rainfall indices used in this study.
LabelDefinitionUnit
R95pannual total precipitation when the daily precipitation exceeds the 95th percentage of the wet-day precipitation (greater than 1 mm).mm
RX5dayMaximum consecutive 5-day precipitation.mm
R10mmNumber of wet days with daily precipitation greater than 10 mm.days

