Investigating the Influence of the Implementation of an Energy Development Plan on Air Quality Using WRF-CAMx Modeling Tools: A Case Study of Shandong Province in China


Abstract
1. Introduction
2. Methodology
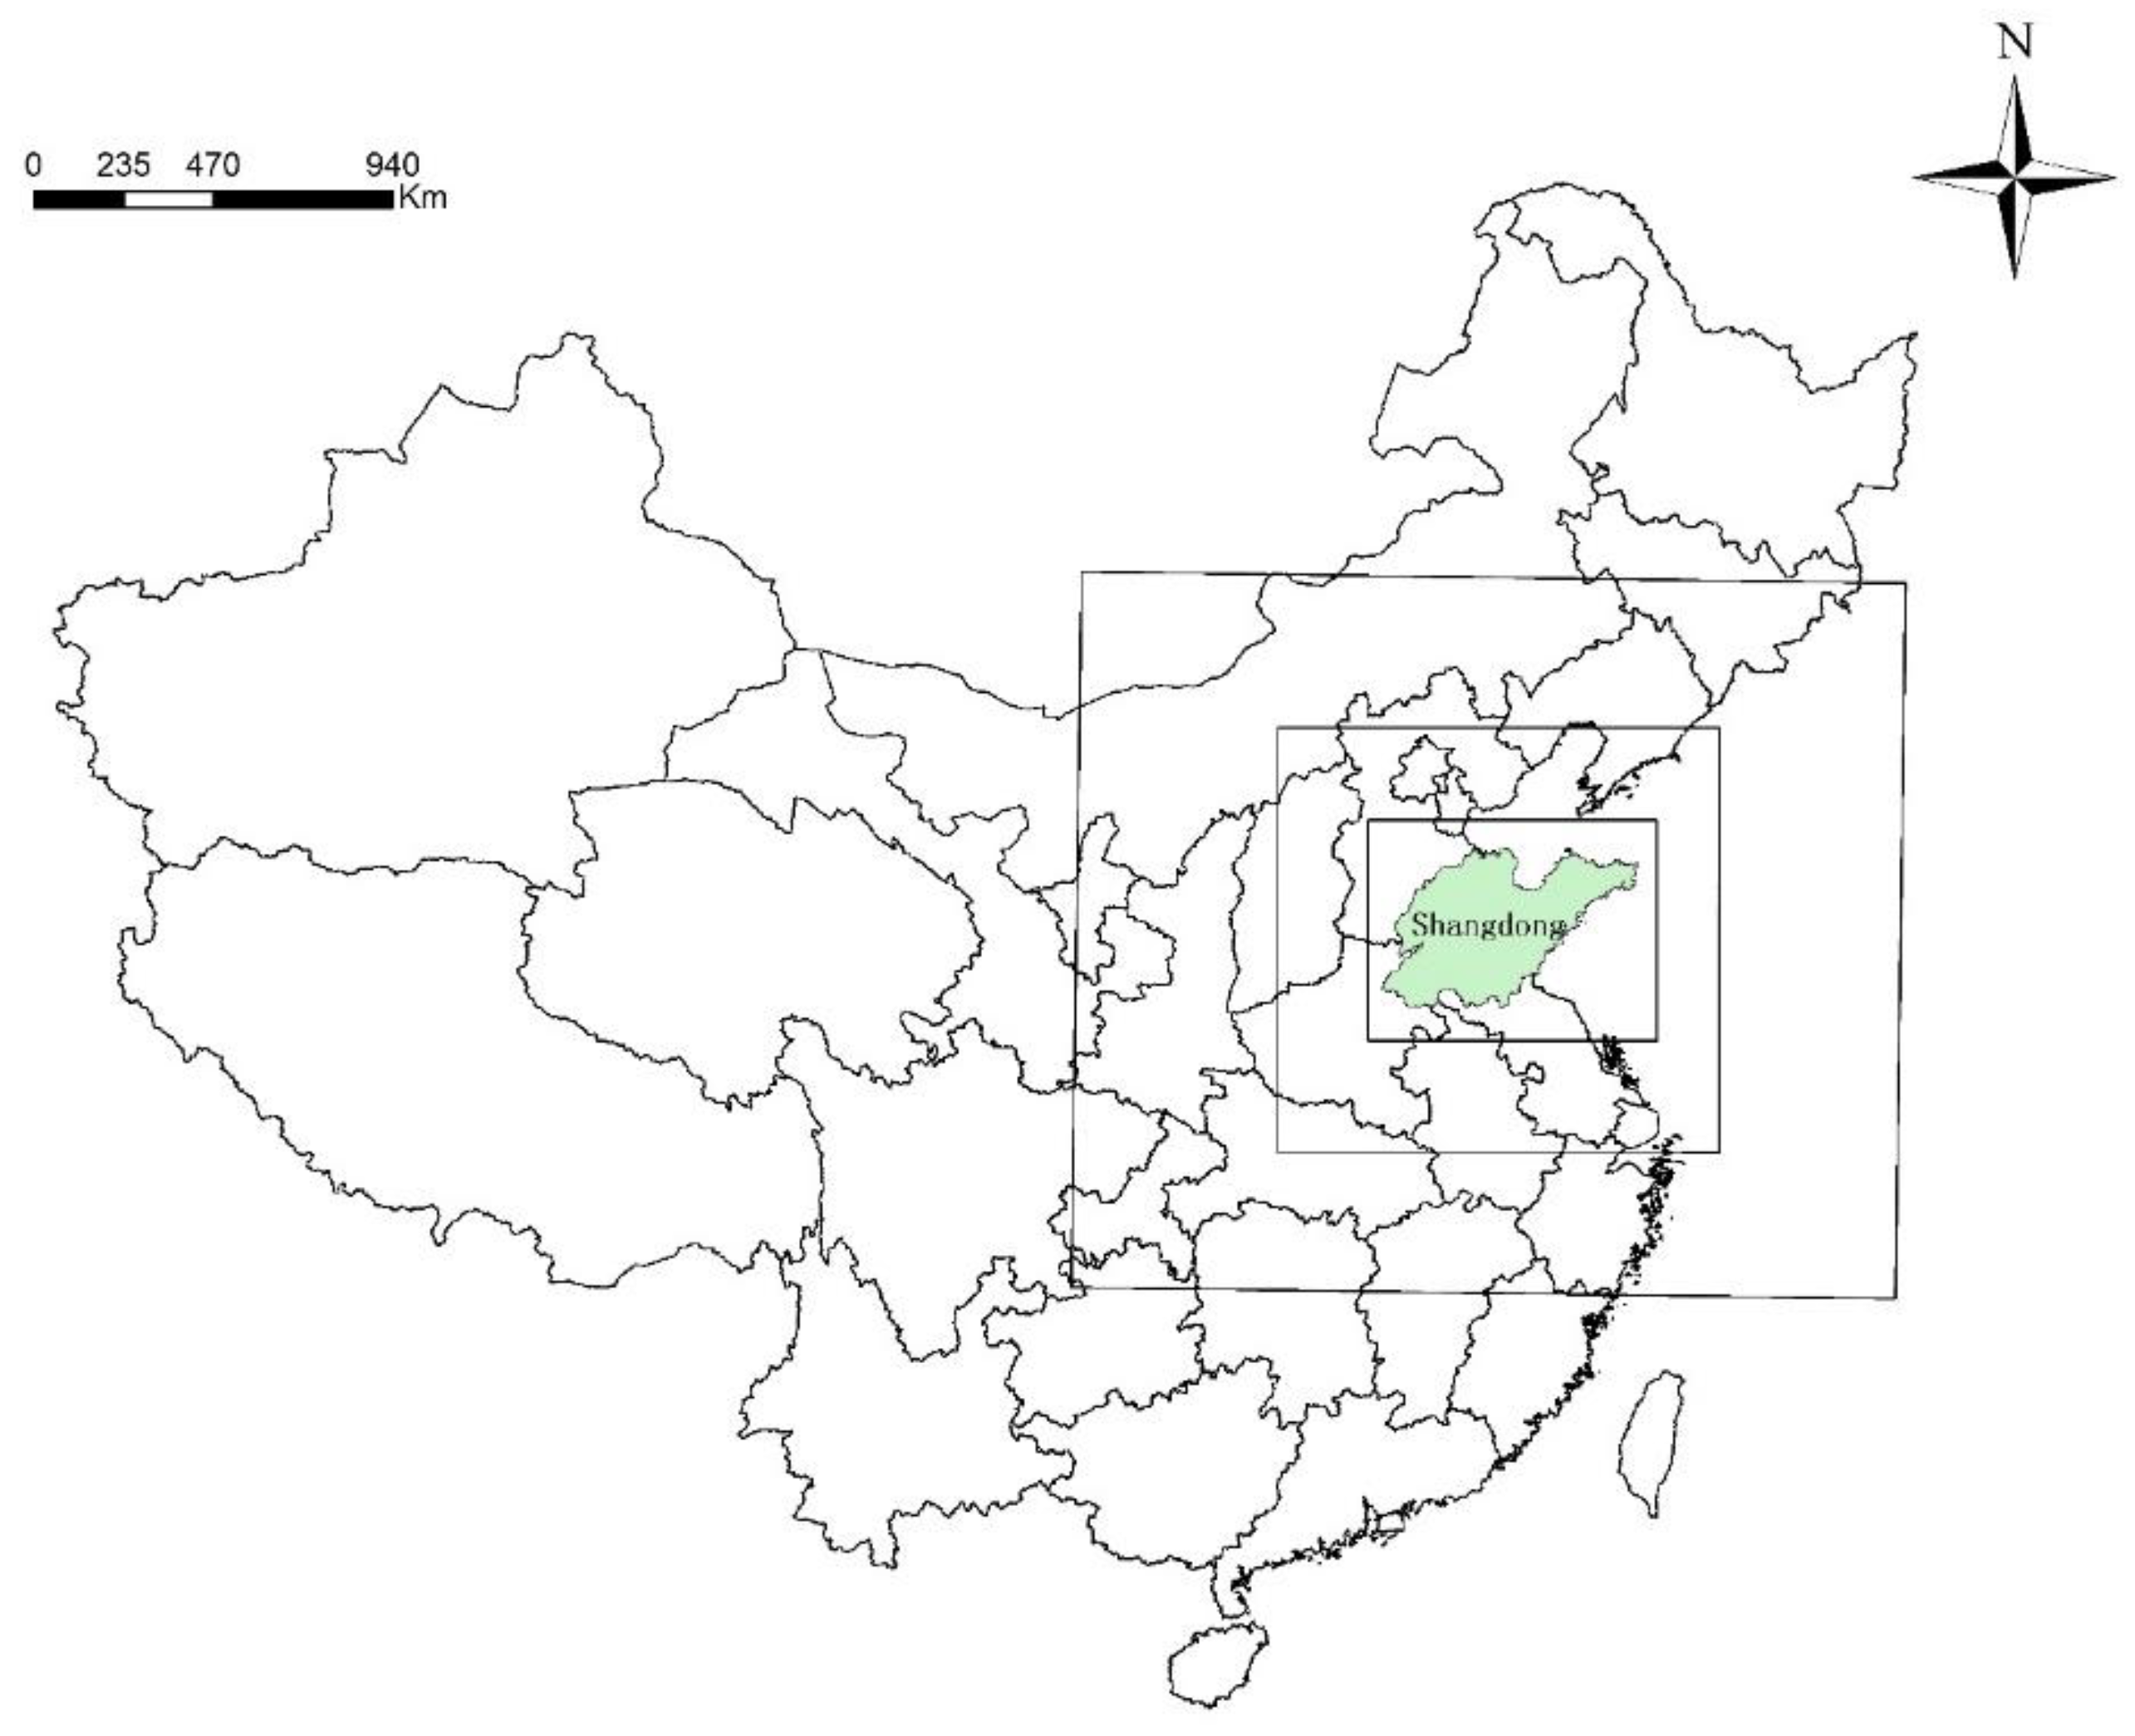
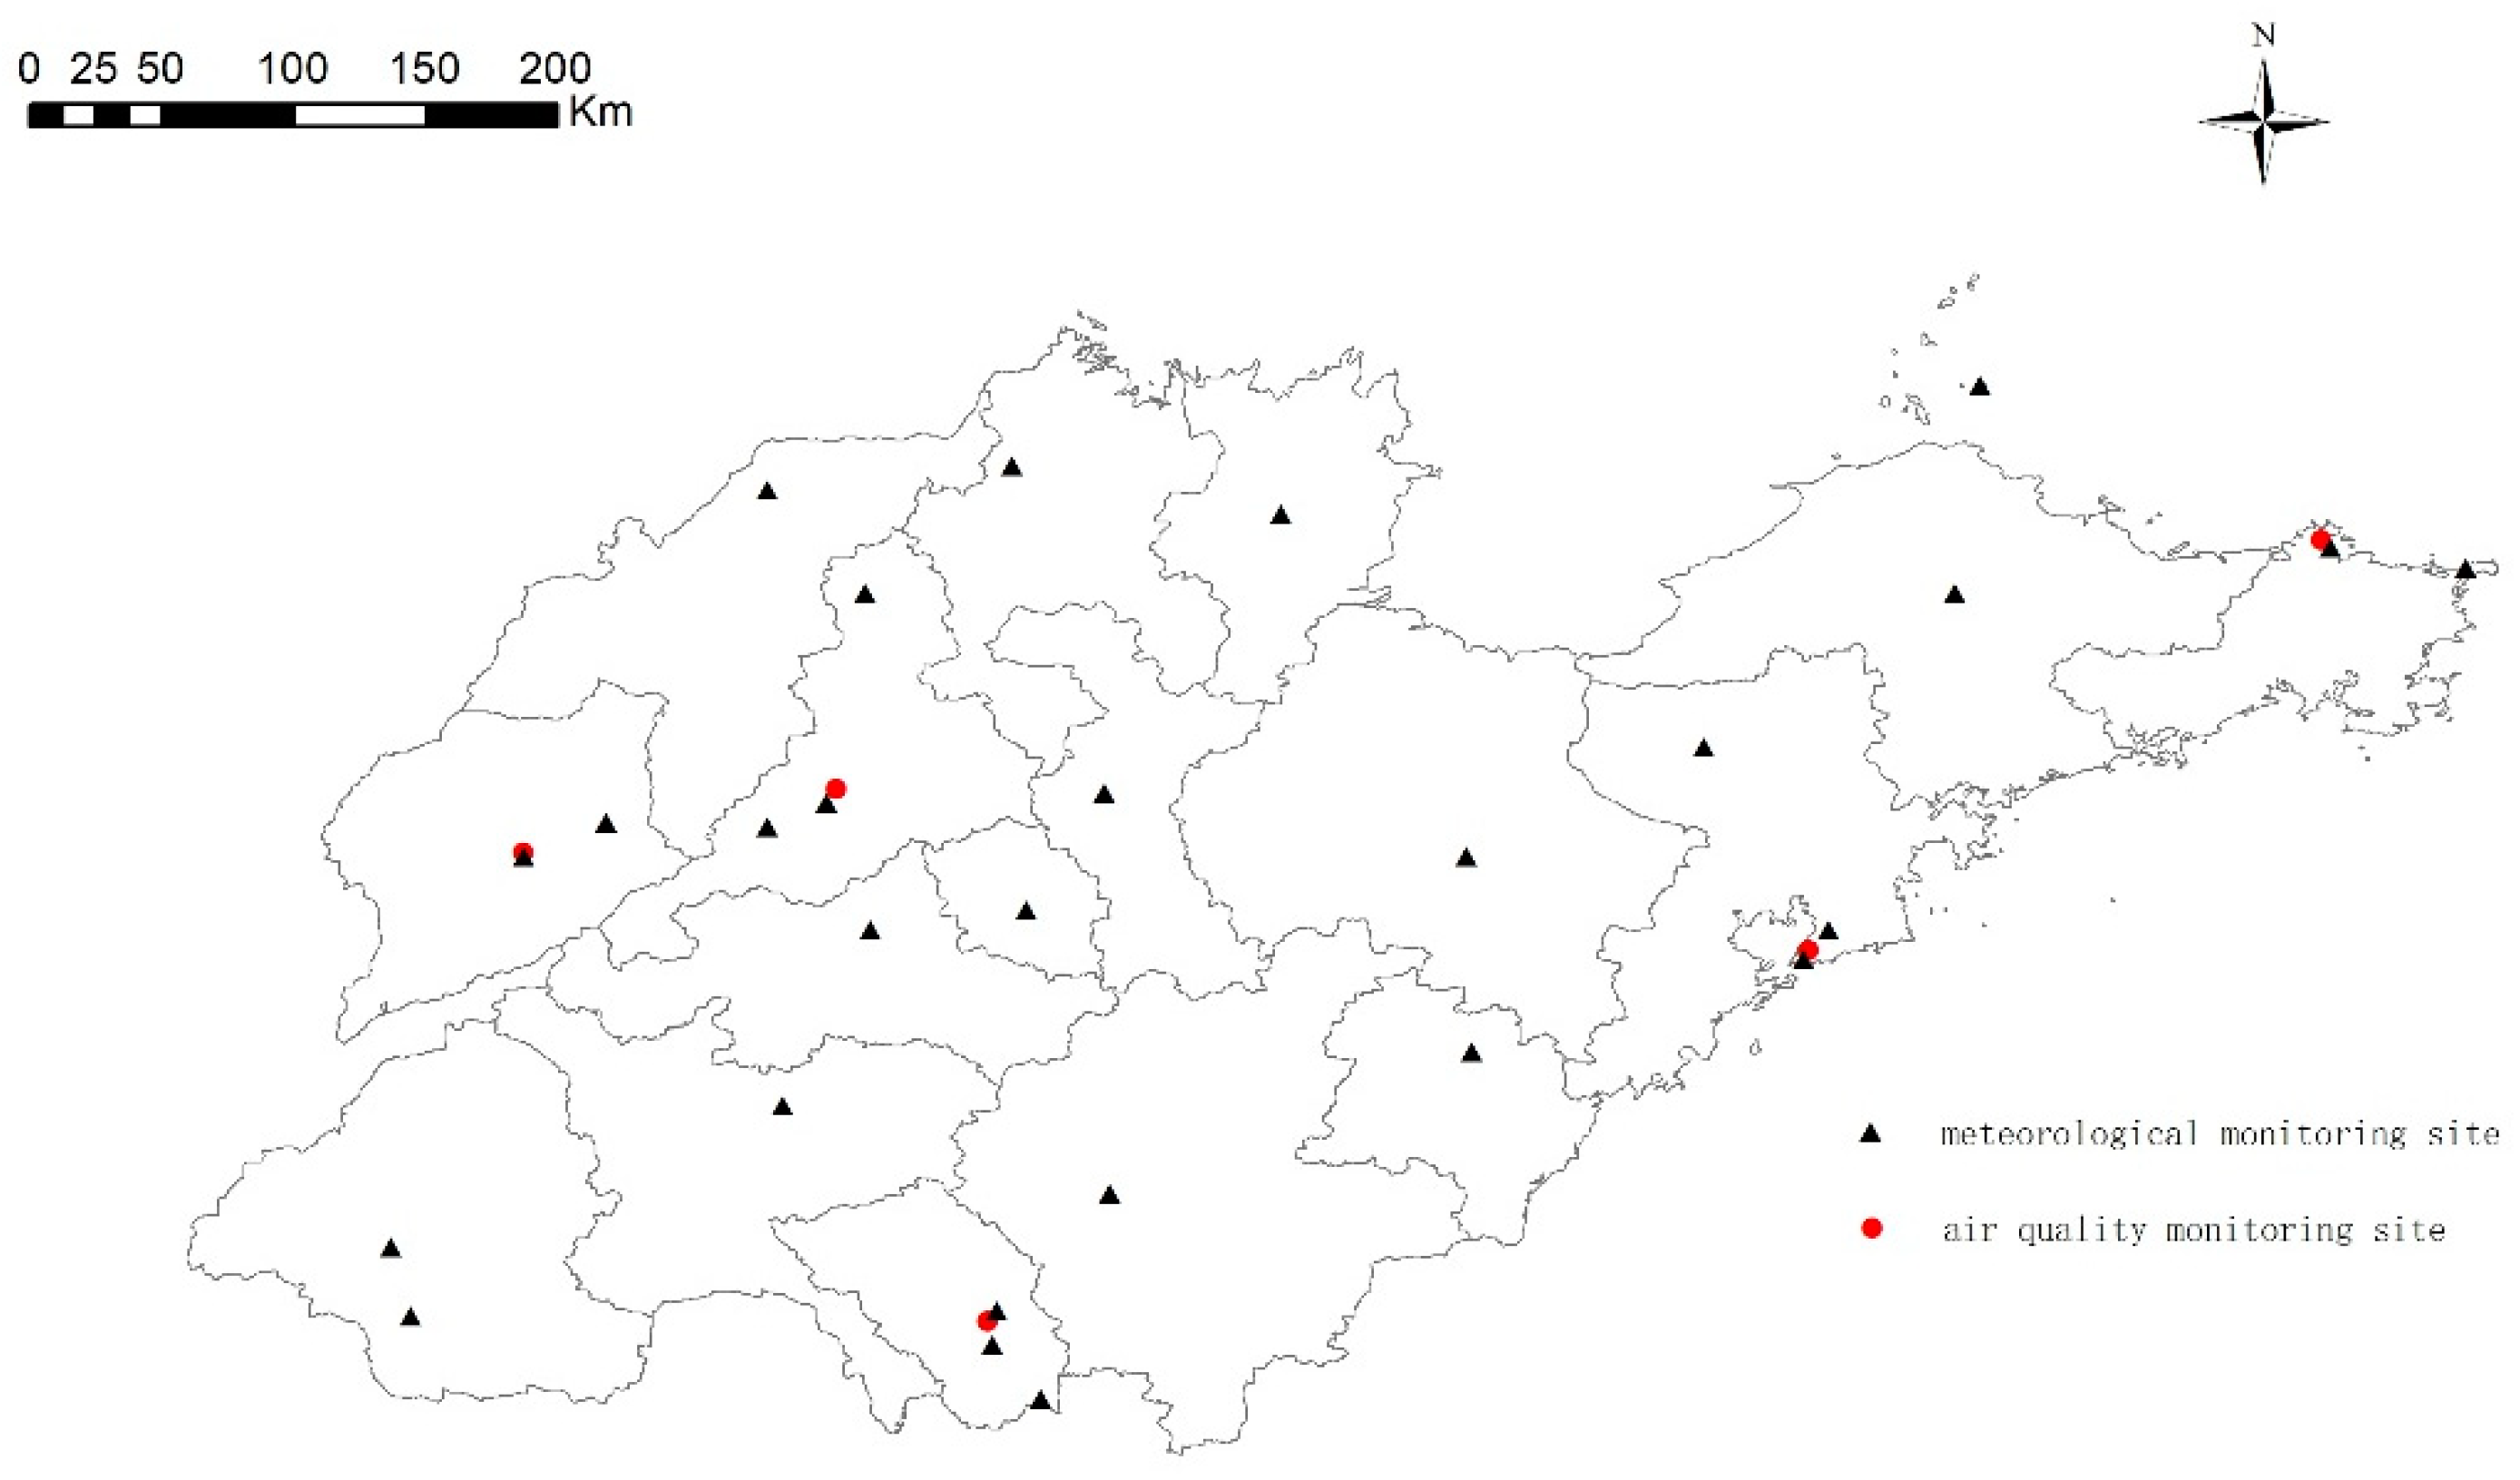
2.1. Study Area
2.2. Emission Inventory
2.2.1. Calculation Method and Emission Factors
2.2.2. Source Categorization
2.3. The 2020 Emission Reduction Scenario
2.4. Modeling Configuration
3. Results and Discussion
3.1. Base Year Emission Inventory, and 2020 Emission Reduction Scenario
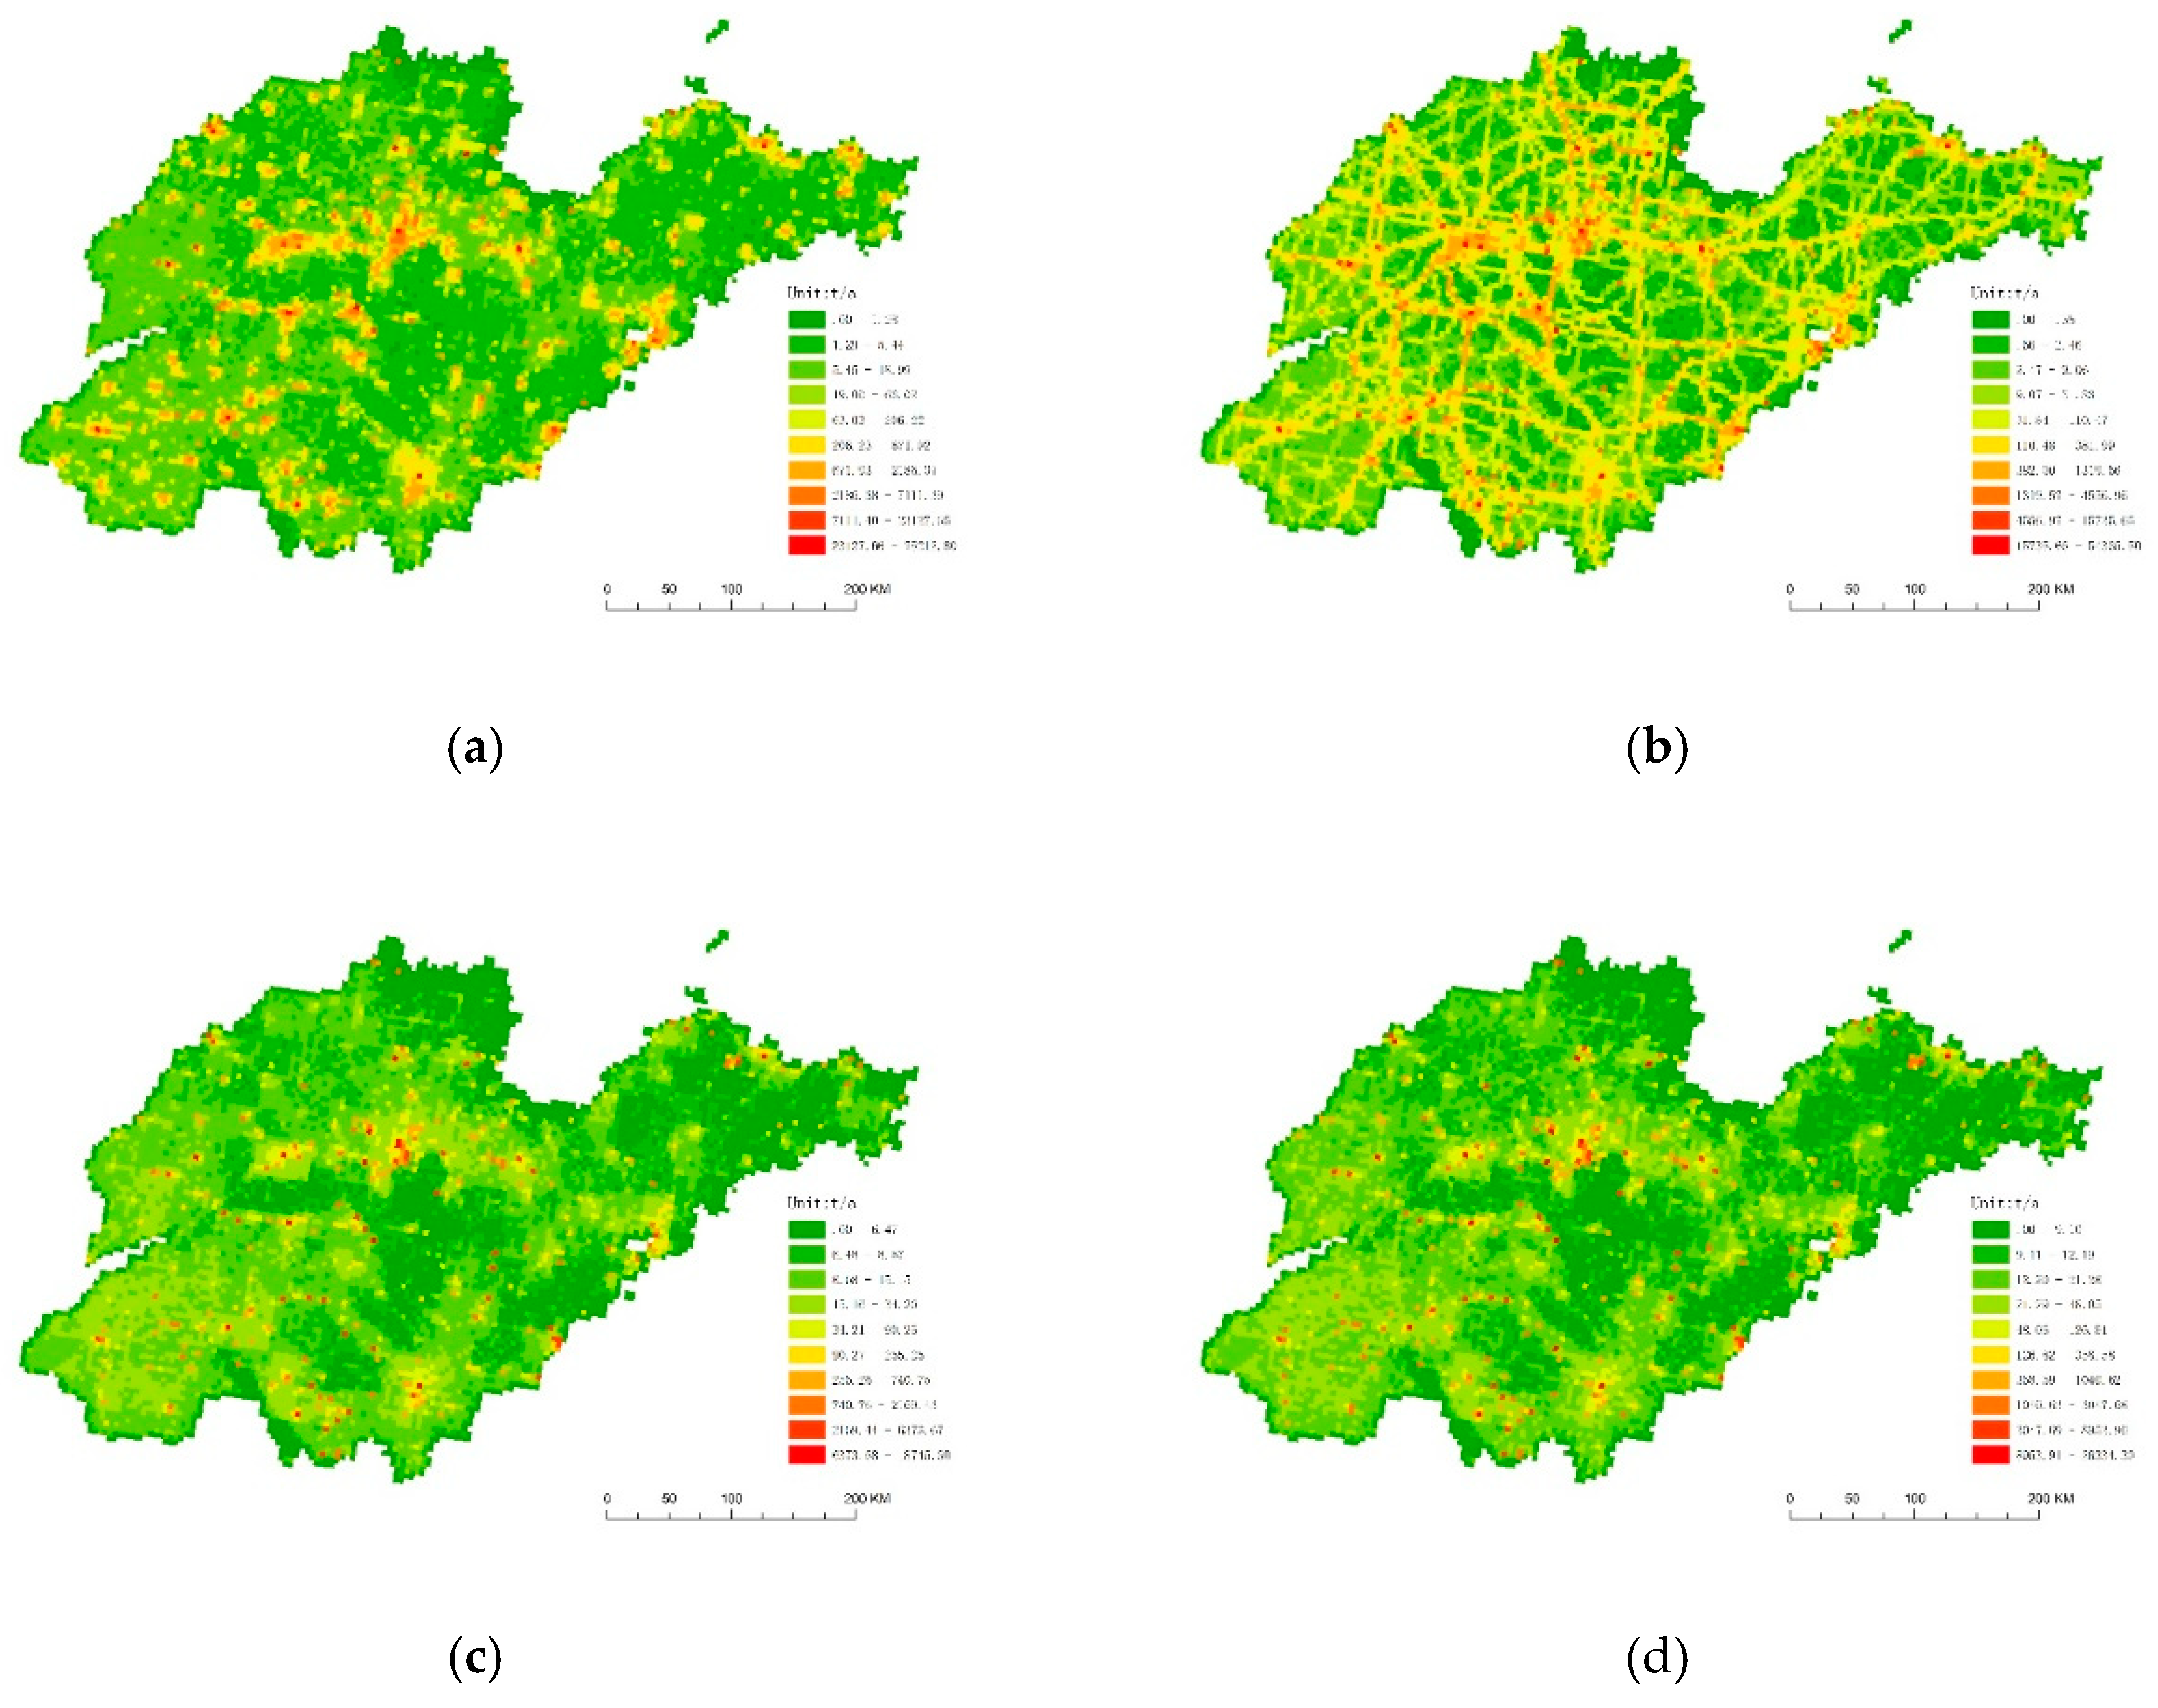
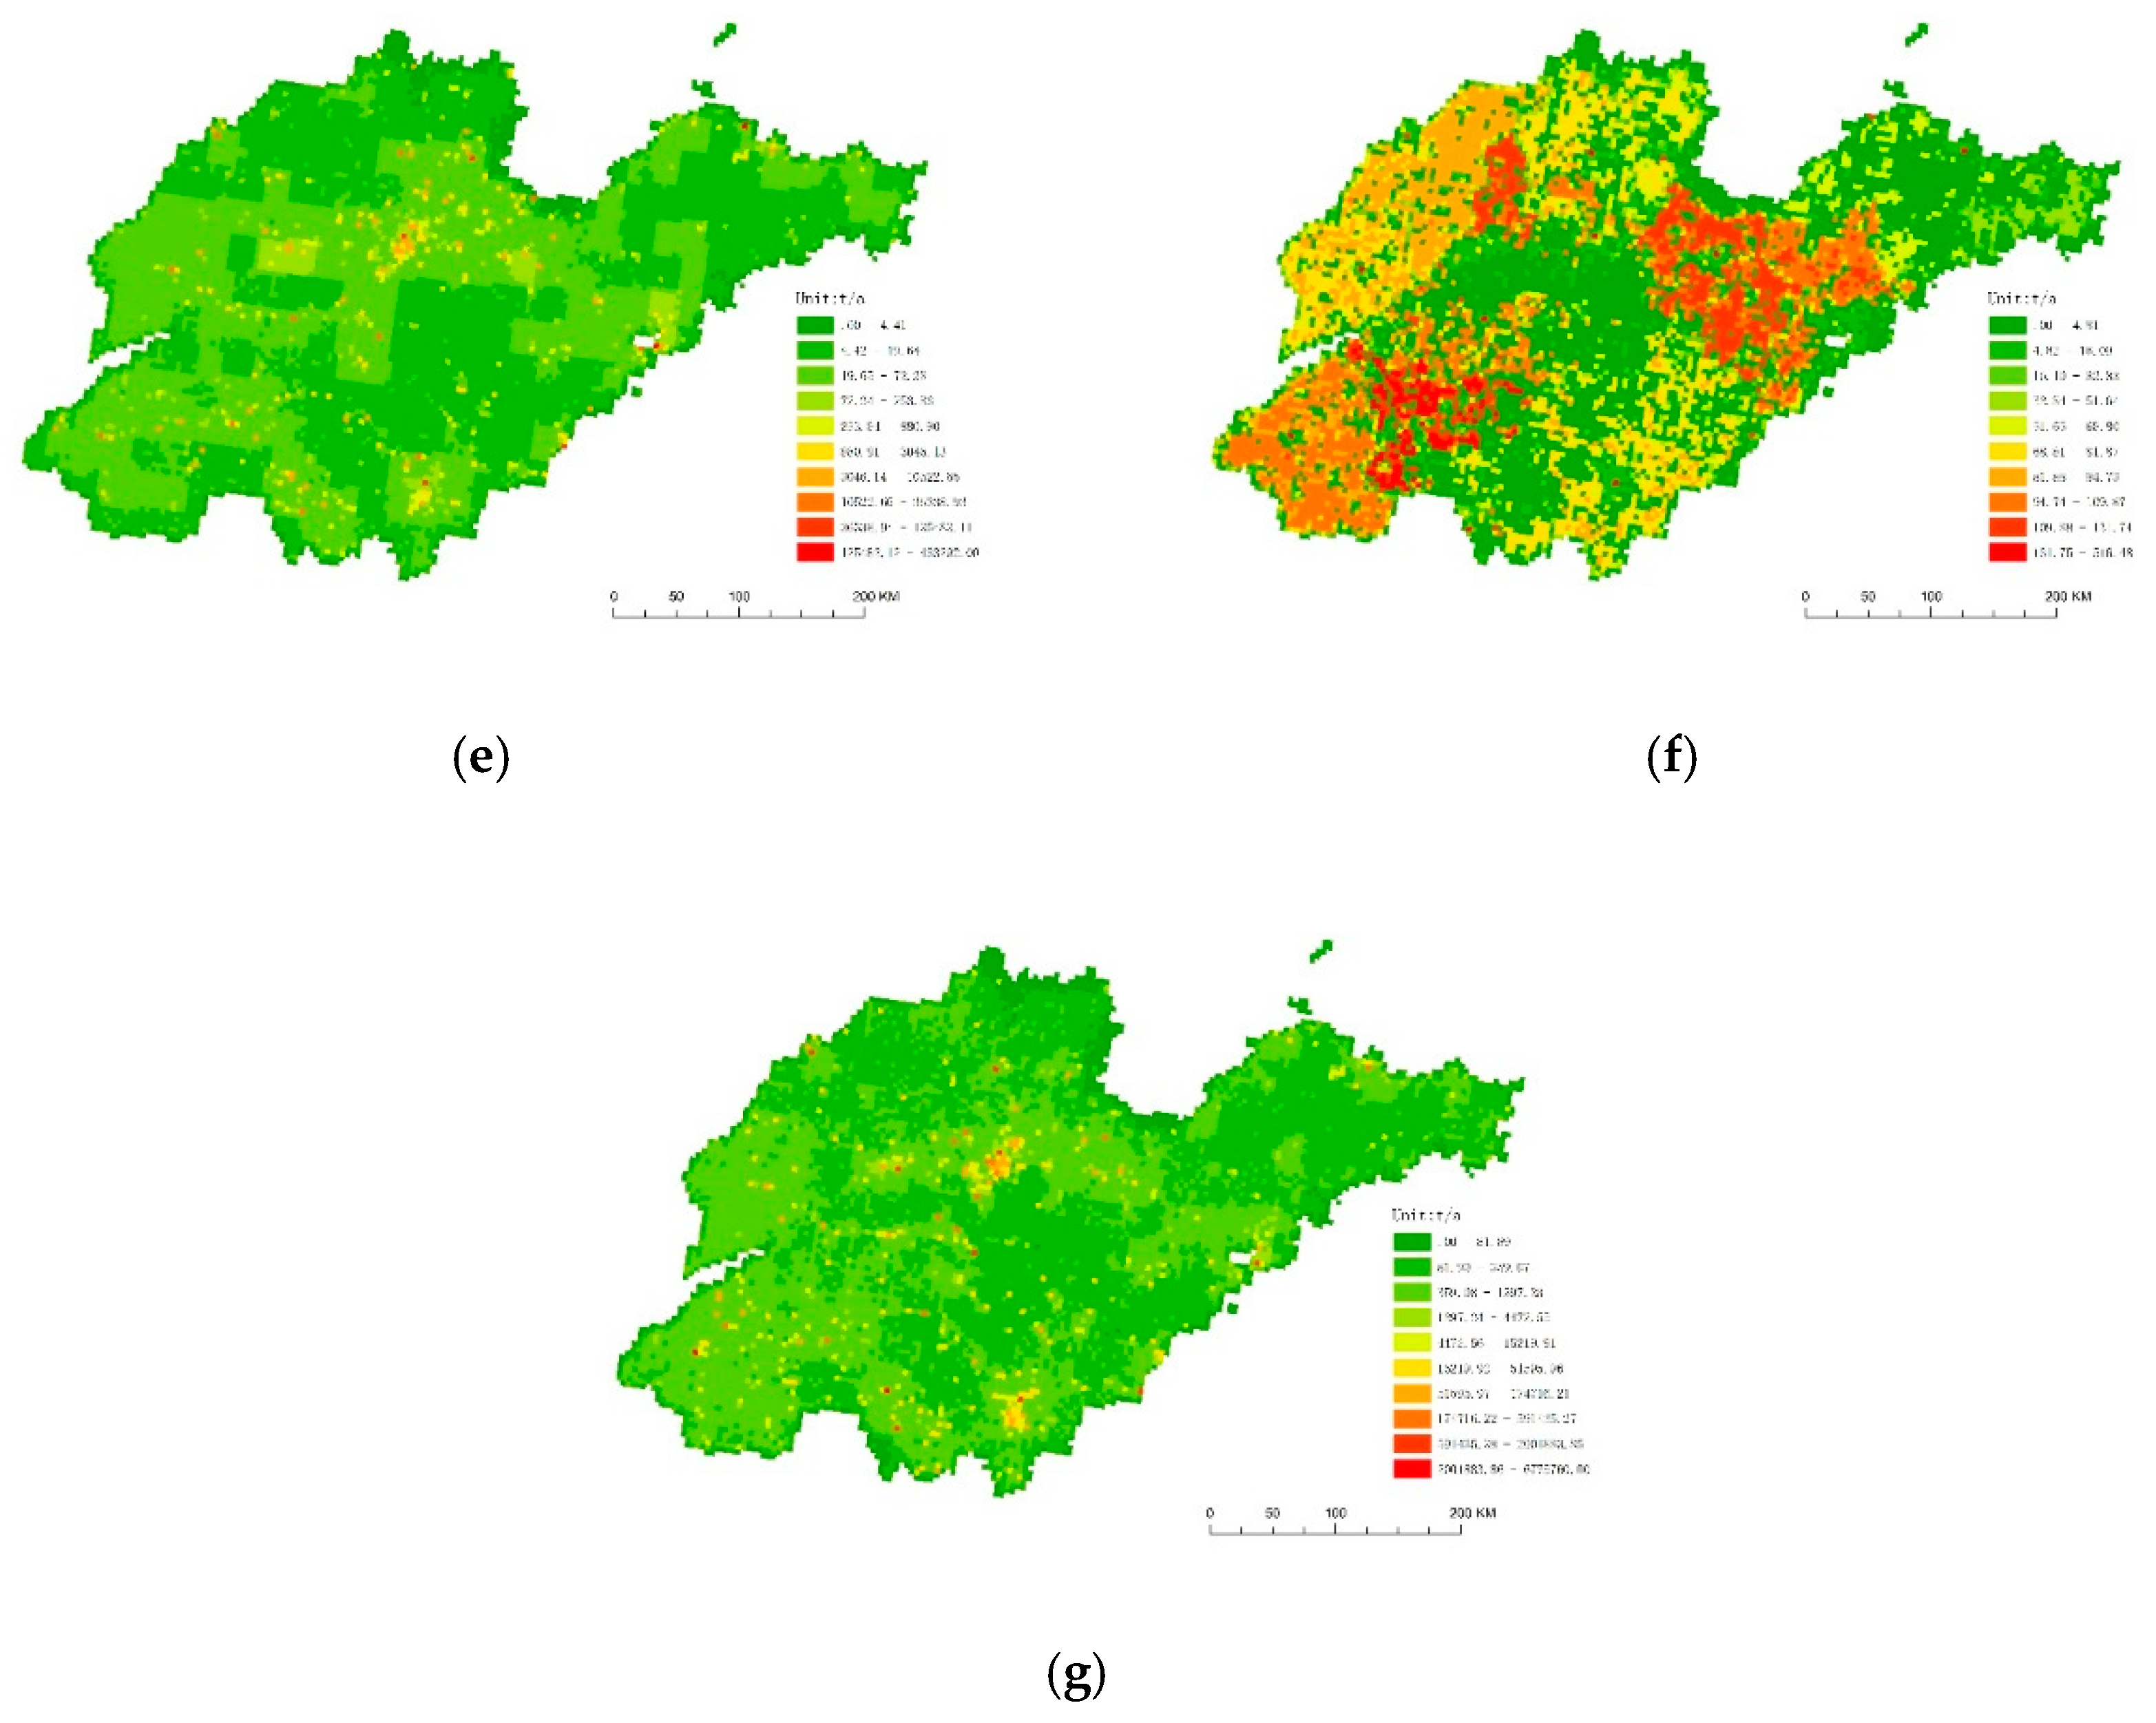
3.1.1. Base Year Emission Inventory
3.1.2. Emission Inventories for 2020 Emission Reduction Scenario
3.2. Model Verification
3.2.1. Statistical Performance of Meteorological Variable Prediction
3.2.2. Statistical Performance of Air Pollutant Predictions
3.3. Results of the Simulation of the Base Year
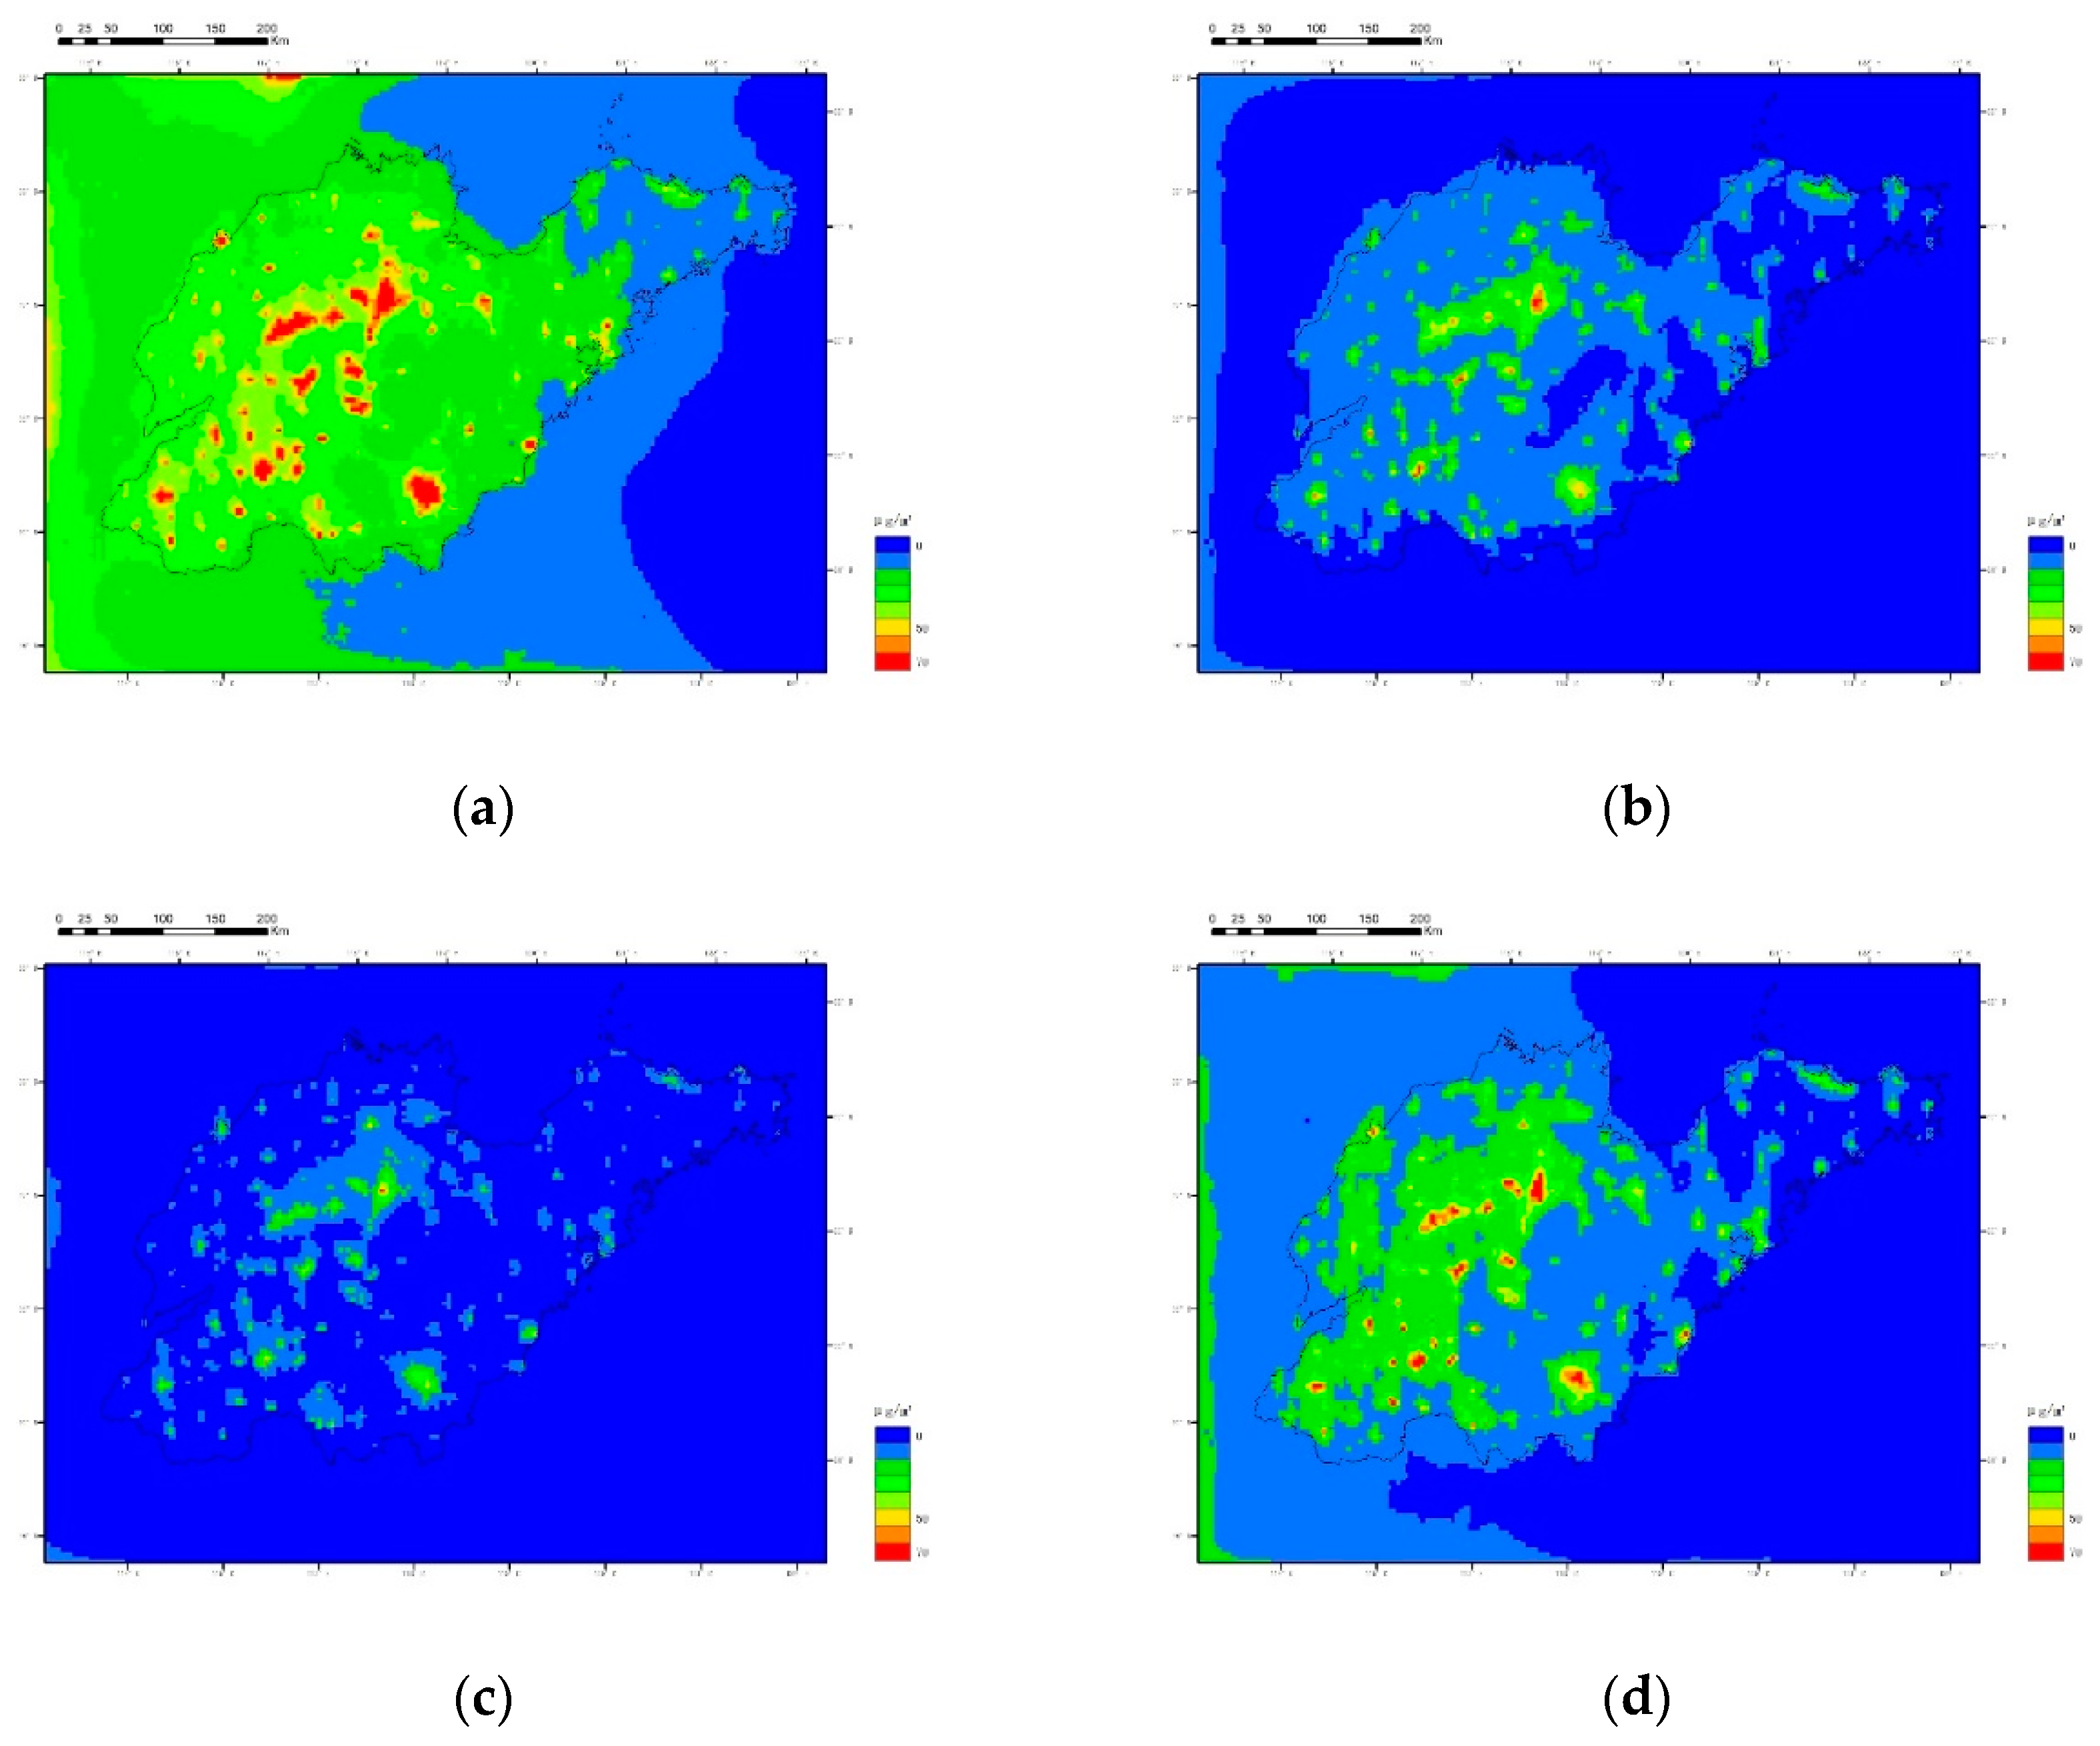
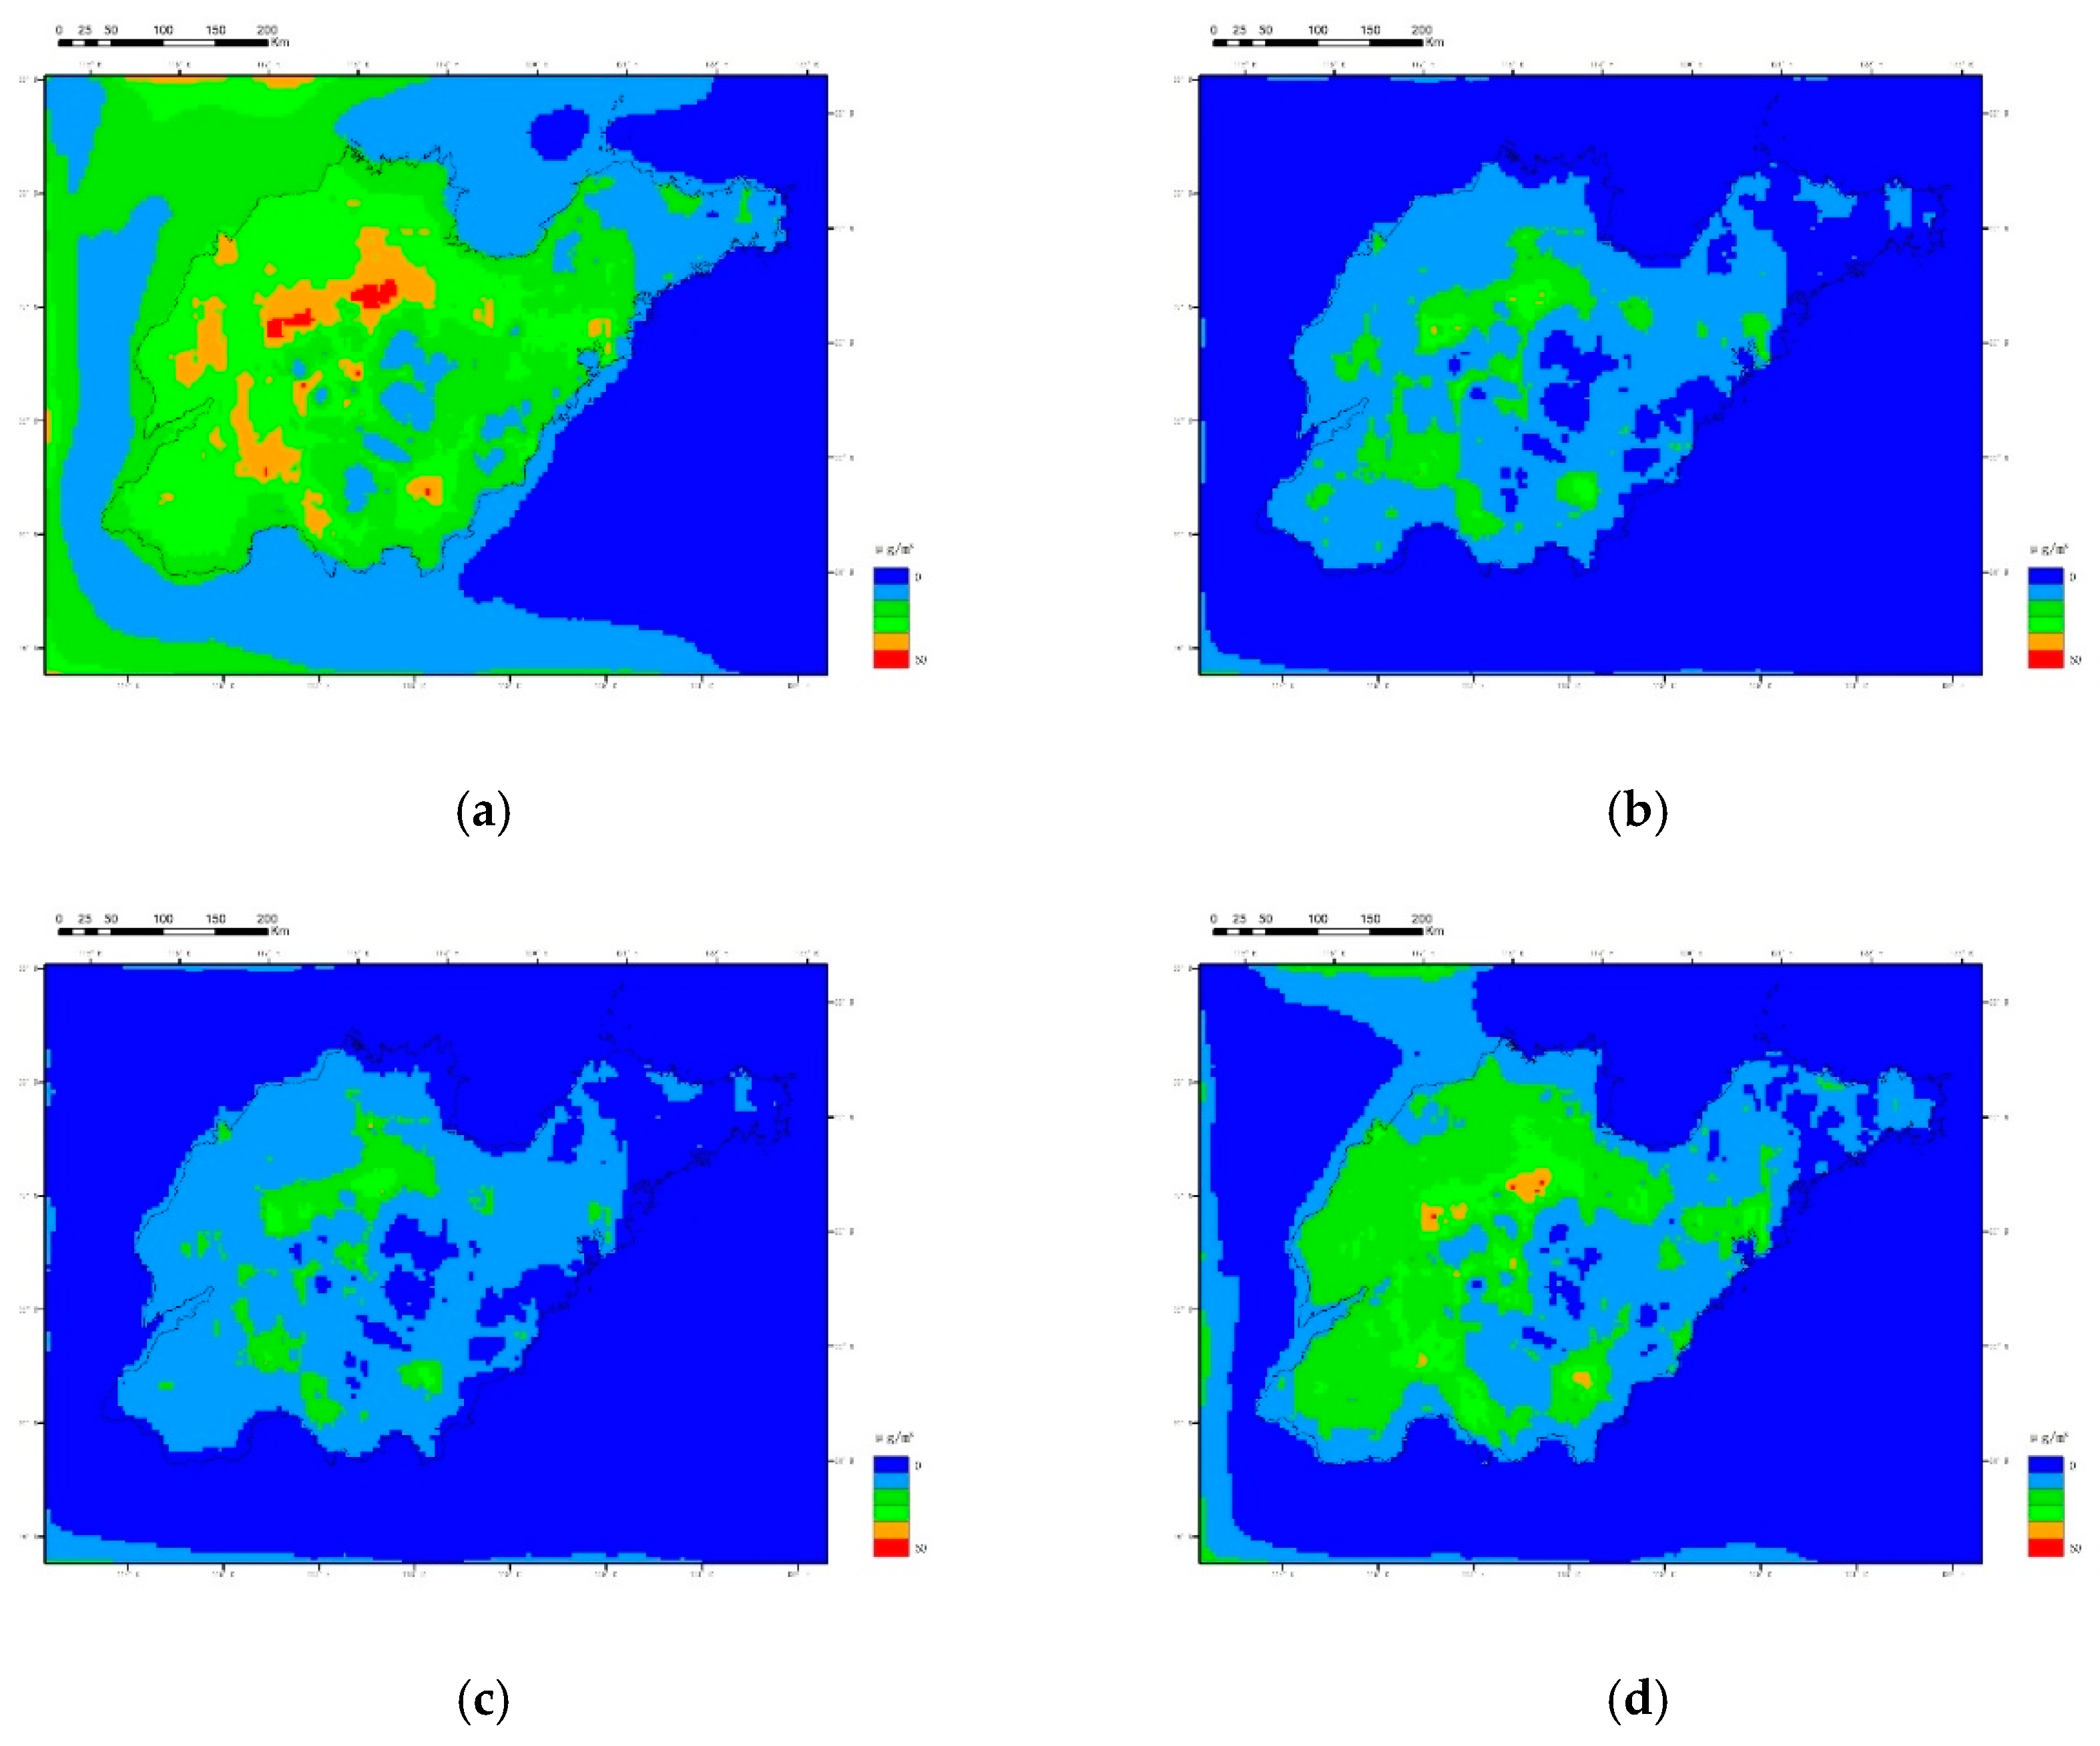
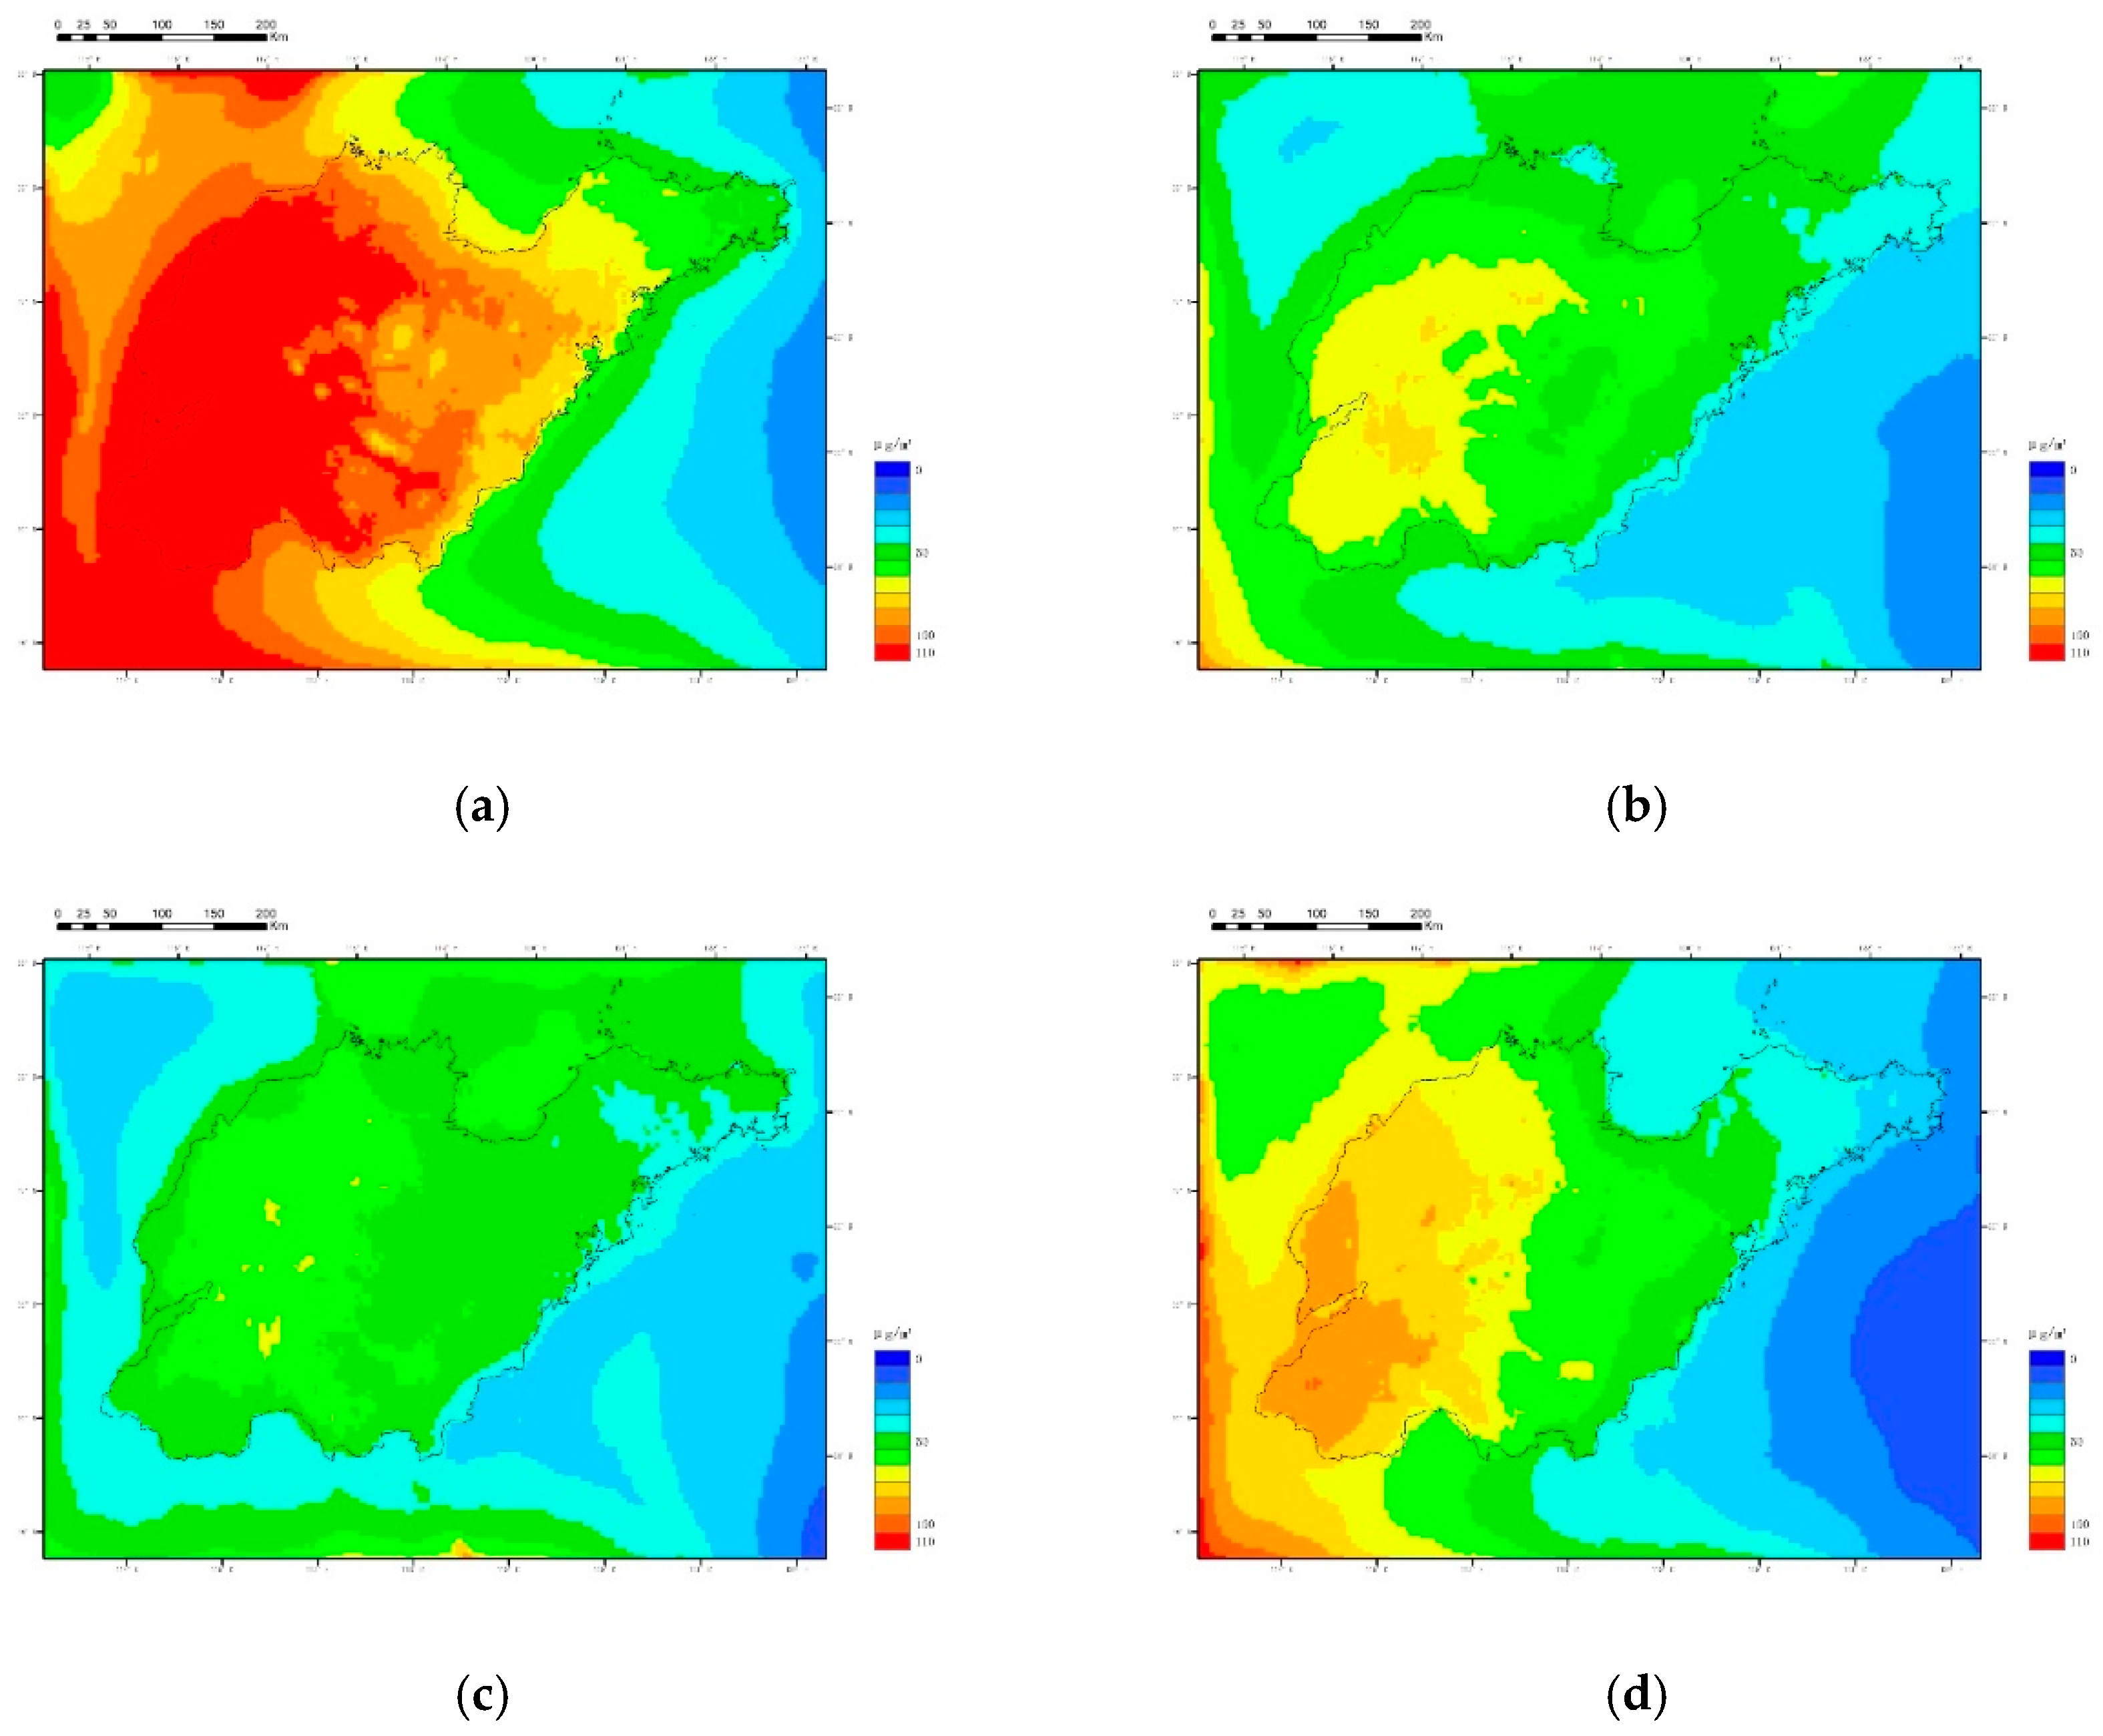
3.3.1. Distribution Characteristics of Atmospheric Pollutants in Different Seasons
3.3.2. Sources Analysis of Fine Particulate Matter in Shandong Province
3.4. Source Analysis of Fine Particulate Matter in the 2020 Emission Reduction Scenario
3.5. The Improving Effect of Control Policies on the Air Pollution Situation in Shandong Province under the 2020 Emission Reduction Scenario
3.5.1. Policies and Measures for Reducing the Emissions from Industry
3.5.2. Emission Reduction Policies and Measures for the Resident
4. Conclusions
Author Contributions
Funding
Conflicts of Interest
Appendix A


References
- Huang, H.; Jiang, Y.; Xu, X.; Cao, X. In vitro bioaccessibility and health risk assessment of heavy metals in atmospheric particulate matters from three different functional areas of Shanghai, China. Sci. Total Environ. 2018, 610–611, 546–554. [Google Scholar] [CrossRef]
- Nie, D.; Wu, Y.; Chen, M.; Liu, H.; Zhang, K.; Ge, P.; Yuan, Y.; Ge, X. Bioaccessibility and health risk of trace elements in fine particulate matter in different simulated body fluids. Atmos. Environ. 2018, 186, 1–8. [Google Scholar] [CrossRef]
- Wang, S.; Hao, J. Air quality management in China: Issues, challenges, and options. J. Environ. Sci. (China) 2012, 24, 2–13. [Google Scholar] [CrossRef]
- Hondroyiannis, G.; Lolos, S.; Papapetrou, E. Energy consumption and economic growth: Assessing the evidence from Greece. Energy Econ. 2002, 24, 319–336. [Google Scholar] [CrossRef]
- Poumanyvong, P.; Kaneko, S. Does urbanization lead to less energy use and lower CO2 emissions? A cross-country analysis. Ecol. Econ. 2010, 70, 434–444. [Google Scholar] [CrossRef]
- Leighty, W.; Ogden, J.M.; Yang, C. Modeling transitions in the California light-duty vehicles sector to achieve deep reductions in transportation greenhouse gas emissions. Energy Policy 2012, 44, 52–67. [Google Scholar] [CrossRef]
- Ates, S.A. Energy efficiency and CO2 mitigation potential of the Turkish iron and steel industry using the LEAP (long-range energy alternatives planning) system. Energy 2015, 90, 417–428. [Google Scholar] [CrossRef]
- Hao, H.; Geng, Y.; Li, W.; Guo, B. Energy consumption and GHG emissions from China’s freight transport sector: Scenarios through 2050. Energy Policy 2015, 85, 94–101. [Google Scholar] [CrossRef]
- Hong, S.; Chung, Y.; Kim, J.; Chun, D. Analysis on the level of contribution to the national greenhouse gas reduction target in Korean transportation sector using LEAP model. Renew. Sustain. Energy Rev. 2016, 60, 549–559. [Google Scholar] [CrossRef]
- An, W. Application of Scenario Analysis Method on Urban Air Pollutant Emission Total Prediction. Master’s Thesis, Xi’an University of Architectural Science and Technology, Xi’an, China, 2016. [Google Scholar]
- Cui, H.; Wei, P. Scenario study on energy saving and emission reduction policies in iron and steel industry-based on LEAP model. J. Beijing Univ. Technolog. (Soc. Sci. Ed.) 2016, 18, 1–9. [Google Scholar]
- Ajanovic, A.; Haas, R. The impact of energy policies in scenarios on GHG emission reduction in passenger car mobility in the EU-15. Renew. Sustain. Energy Rev. 2017, 68, 1088–1096. [Google Scholar] [CrossRef]
- Zhao, W.; Niu, D. Prediction of CO2 Emission in China’s Power Generation Industry with Gauss Optimized Cuckoo Search Algorithm and Wavelet Neural Network Based on STIRPAT model with Ridge Regression. Sustainability 2017, 9, 2377. [Google Scholar] [CrossRef]
- Zhang, M. Prediction of SO2 and NOX Emission Inventories in Mainland China in 2020 and 2050 under IPCC Scenario. Master’s Thesis, Xi’an University of Architecture and Technology, Xi’an, China, 2017. [Google Scholar]
- Bhuvanesh, A.; Jaya Christa, S.T.; Kannan, S.; Karuppasamy Pandiyan, M. Aiming towards pollution free future by high penetration of renewable energy sources in electricity generation expansion planning. Futures 2018, 104, 25–36. [Google Scholar] [CrossRef]
- Liya, C.; Jianfeng, G. Scenario analysis of CO2 emission abatement effect based on LEAP. Energy Procedia 2018, 152, 965–970. [Google Scholar] [CrossRef]
- Kadian, R.; Dahiya, R.P.; Garg, H.P. Energy-related emissions and mitigation opportunities from the household sector in Delhi. Energy Policy 2007, 35, 6195–6211. [Google Scholar] [CrossRef]
- Shabbir, R.; Ahmad, S.S. Monitoring urban transport air pollution and energy demand in Rawalpindi and Islamabad using leap model. Energy 2010, 35, 2323–2332. [Google Scholar] [CrossRef]
- Liu, L.; Wang, K.; Wang, S.; Zhang, R.; Tang, X. Assessing energy consumption, CO2 and pollutant emissions and health benefits from China’s transport sector through 2050. Energy Policy 2018, 116, 382–396. [Google Scholar] [CrossRef]
- Mengal, A.; Mirjat, N.H.; Das Walasai, G.; Khatri, S.A.; Harijan, K.; Uqaili, M.A. Modeling of Future Electricity Generation and Emissions Assessment for Pakistan. Processes 2019, 7, 212. [Google Scholar] [CrossRef]
- Ferreira, J.; Rodriguez, A.; Monteiro, A.; Miranda, A.I.; Dios, M.; Souto, J.A.; Yarwood, G.; Nopmongcol, U.; Borrego, C. Air quality simulations for North America—MM5–CAMx modelling performance for main gaseous pollutants. Atmos. Environ. 2012, 53, 212–224. [Google Scholar] [CrossRef]
- Tesche, T.W.; Morris, R.; Tonnesen, G.; McNally, D.; Boylan, J.; Brewer, P. CMAQ/CAMx annual 2002 performance evaluation over the eastern US. Atmos. Environ. 2006, 40, 4906–4919. [Google Scholar] [CrossRef]
- Wang, S.; Zhao, M.; Xing, J.; Wu, Y.; Zhou, Y.; Lei, Y.; He, K.; Fu, L.; Hao, J. Quantifying the Air Pollutants Emission Reduction during the 2008 Olympic Games in Beijing. Environ. Sci. Technol. 2010, 44, 2490–2496. [Google Scholar] [CrossRef] [PubMed]
- Zhang, H.; Chen, G.; Hu, J.; Chen, S.; Wiedinmyer, C.; Kleeman, M.; Ying, Q. Evaluation of a seven-year air quality simulation using the Weather Research and Forecasting (WRF)/Community Multiscale Air Quality (CMAQ) models in the eastern United States. Sci. Total Environ. 2014, 473–474, 275–285. [Google Scholar] [CrossRef] [PubMed]
- Li, L.; An, J.Y.; Zhou, M.; Yan, R.S.; Huang, C.; Lu, Q.; Lin, L.; Wang, Y.J.; Tao, S.K.; Qiao, L.P.; et al. Source apportionment of fine particles and its chemical components over the Yangtze River Delta, China during a heavy haze pollution episode. Atmos. Environ. 2015, 123, 415–429. [Google Scholar] [CrossRef]
- Hu, J.; Wu, L.; Zheng, B.; Zhang, Q.; He, K.; Chang, Q.; Li, X.; Yang, F.; Ying, Q.; Zhang, H. Source contributions and regional transport of primary particulate matter in China. Environ. Pollut. 2015, 207, 31–42. [Google Scholar] [CrossRef]
- Wang, Y.; Bao, S.; Wang, S.; Hu, Y.; Shi, X.; Wang, J.; Zhao, B.; Jiang, J.; Zheng, M.; Wu, M.; et al. Local and regional contributions to fine particulate matter in Beijing during heavy haze episodes. Sci. Total Environ. 2017, 580, 283–296. [Google Scholar] [CrossRef]
- Baykara, M.; Im, U.; Unal, A. Evaluation of impact of residential heating on air quality of megacity Istanbul by CMAQ. Sci. Total Environ. 2019, 651, 1688–1697. [Google Scholar] [CrossRef]
- Liu, H.; Zhang, M.; Han, X.; Li, J.; Chen, L. Episode analysis of regional contributions to tropospheric ozone in Beijing using a regional air quality model. Atmos. Environ. 2019, 199, 299–312. [Google Scholar] [CrossRef]
- Zheng, S.; Yi, H.; Li, H. The impacts of provincial energy and environmental policies on air pollution control in China. Renew. Sustain. Energy Rev. 2015, 49, 386–394. [Google Scholar] [CrossRef]
- Wang, L.; Jang, C.; Zhang, Y.; Wang, K.; Zhang, Q.; Streets, D.; Fu, J.; Lei, Y.; Schreifels, J.; He, K.; et al. Assessment of air quality benefits from national air pollution control policies in China. Part I: Background, emission scenarios and evaluation of meteorological predictions. Atmos. Environ. 2010, 44, 3442–3448. [Google Scholar] [CrossRef]
- Deng, T.; Huang, Y.; Li, Z.; Wang, N.; Wang, S.; Zou, Y.; Yin, C.; Fan, S. Numerical simulations for the sources apportionment and control strategies of PM 2.5 over Pearl River Delta, China, part II: Vertical distribution and emission reduction strategies. Sci. Total Environ. 2018, 634, 1645–1656. [Google Scholar] [CrossRef]
- Wang, S.; Xing, J.; Zhao, B.; Carey, J.; Hao, J. Effectiveness of national air pollution control policies on the air quality in metropolitan areas of China. J. Environ. Sci. 2014, 26, 13–22. [Google Scholar] [CrossRef]
- Zhao, B.; Wang, S.; Wang, J.; Fu, J.S.; Liu, T.; Xu, J.; Fu, X.; Hao, J. Impact of national NOX and SO2 control policies on particulate matter pollution in China. Atmos. Environ. 2013, 77, 453–463. [Google Scholar] [CrossRef]
- Che, W.; Zheng, J.; Wang, S.; Zhong, L.; Lau, A. Assessment of motor vehicle emission control policies using Model-3/CMAQ model for the Pearl River Delta region, China. Atmos. Environ. 2011, 45, 1740–1751. [Google Scholar] [CrossRef]
- Lu, X.; Chen, Y.; Huang, Y.; Lin, C.; Li, Z.; Fung, J.C.H.; Lau, A.K.H. Differences in concentration and source apportionment of PM2.5 between 2006 and 2015 over the PRD region in southern China. Sci Total Environ. 2019, 673, 708–718. [Google Scholar] [CrossRef] [PubMed]
- Yu, M.; Zhu, Y.; Lin, C.; Wang, S.; Xing, J.; Jang, C.; Huang, J.; Huang, J.; Jin, J.; Yu, L. Effects of air pollution control measures on air quality improvement in Guangzhou, China. J. Environ. Manag. 2019, 244, 127–137. [Google Scholar] [CrossRef]
- Wang, N.; Lyu, X.P.; Deng, X.J.; Guo, H.; Deng, T.; Li, Y.; Yin, C.Q.; Li, F.; Wang, S.Q. Assessment of regional air quality resulting from emission control in the Pearl River Delta region, southern China. Sci. Total Environ. 2016, 573, 1554–1565. [Google Scholar] [CrossRef]
- Wang, L.; Jang, C.; Zhang, Y.; Wang, K.; Zhang, Q.; Streets, D.; Fu, J.; Lei, Y.; Schreifels, J.; He, K.; et al. Assessment of air quality benefits from national air pollution control policies in China. Part II: Evaluation of air quality predictions and air quality benefits assessment. Atmos. Environ. 2010, 44, 3449–3457. [Google Scholar] [CrossRef]
- Wu, D.; Fung, J.C.H.; Yao, T.; Lau, A.K.H. A study of control policy in the Pearl River Delta region by using the particulate matter source apportionment method. Atmos. Environ. 2013, 76, 147–161. [Google Scholar] [CrossRef]
- Huang, Z.; Ou, J.; Zheng, J.; Yuan, Z.; Yin, S.; Chen, D.; Tan, H. Process Contributions to Secondary Inorganic Aerosols during Typical Pollution Episodes over the Pearl River Delta Region, China. Aerosol Air Qual. Res. 2016, 16, 2129–2144. [Google Scholar] [CrossRef]
- Allard, J.; Day, D.; Alleyne, M.; Griffin, R.; Pham, T.; Boonman, T.; Bonnet, S.; Garivait, S. Analysis of the Effects of the Thai Power Development Plan 2015 on Air Quality from 2016 to 2036. In Proceedings of the 2nd International Electronic Conference on Atmospheric Sciences, 16–31 July 2016; MDPI: Basel, Switzerland, 2016. [Google Scholar]
- Shahbazi, H.; Ganjiazad, R.; Hosseini, V.; Hamedi, M. Investigating the influence of traffic emission reduction plans on Tehran air quality using WRF/CAMx modeling tools. Transp. Res. Part D Transp. Environ. 2017, 57, 484–495. [Google Scholar] [CrossRef]
- Qiu, X.; Duan, L.; Cai, S.; Yu, Q.; Wang, S.; Chai, F.; Gao, J.; Li, Y.; Xu, Z. Effect of current emission abatement strategies on air quality improvement in China: A case study of Baotou, a typical industrial city in Inner Mongolia. J. Environ. Sci. China 2017, 57, 383–390. [Google Scholar] [CrossRef] [PubMed]
- Tan, J.; Fu, J.S.; Huang, K.; Yang, C.; Zhuang, G.; Sun, J. Effectiveness of SO2 emission control policy on power plants in the Yangtze River Delta, China—Post-assessment of the 11th Five-Year Plan. Environ. Sci. Pollut. Res. 2017, 24, 8243–8255. [Google Scholar] [CrossRef] [PubMed]
- Grabow, M.L.; Spak, S.N.; Holloway, T.; Stone, B.; Mednick, A.C.; Patz, J.A. Air quality and exercise-related health benefits from reduced car travel in the midwestern United States. Environ. Health Perspect. 2012, 120, 68–76. [Google Scholar] [CrossRef] [PubMed]
- Feng, R.; Wang, Q.; Huang, C.; Liang, J.; Luo, K.; Fan, J.; Cen, K. Investigation on air pollution control strategy in Hangzhou for post-G20/pre-Asian-games period (2018–2020). Atmos. Pollut. Res. 2019, 10, 197–208. [Google Scholar] [CrossRef]
- Guttikunda, S.K.; Jawahar, P. Atmospheric emissions and pollution from the coal-fired thermal power plants in India. Atmos. Environ. 2014, 92, 449–460. [Google Scholar] [CrossRef]
- Cheng, N.; Zhang, D.; Li, Y.; Xie, X.; Chen, Z.; Meng, F.; Gao, B.; He, B. Spatio-temporal variations of PM2.5 concentrations and the evaluation of emission reduction measures during two red air pollution alerts in Beijing. Sci. Rep. UK 2017, 7, 8220. [Google Scholar] [CrossRef]
- Cook, R.; Phillips, S.; Houyoux, M.; Dolwick, P.; Mason, R.; Yanca, C.; Zawacki, M.; Davidson, K.; Michaels, H.; Harvey, C.; et al. Air quality impacts of increased use of ethanol under the United States’ Energy Independence and Security Act. Atmos. Environ. 2011, 45, 7714–7724. [Google Scholar] [CrossRef]
- Tong, D.; Geng, G.; Jiang, K.; Cheng, J.; Zheng, Y.; Hong, C.; Yan, L.; Zhang, Y.; Chen, X.; Bo, Y.; et al. Energy and emission pathways towards PM2.5 air quality attainment in the Beijing-Tianjin-Hebei region by 2030. Sci. Total Environ. 2019, 692, 361–370. [Google Scholar] [CrossRef]
- Zhang, Y.; Liu, C.; Li, K.; Zhou, Y. Strategy on China’s regional coal consumption control: A case study of Shandong province. Energy Policy 2018, 112, 316–327. [Google Scholar] [CrossRef]
- Liu, J.; Kiesewetter, G.; Klimont, Z.; Cofala, J.; Heyes, C.; Schöpp, W.; Zhu, T.; Cao, G.; Gomez Sanabria, A.; Sander, R.; et al. Mitigation pathways of air pollution from residential emissions in the Beijing-Tianjin-Hebei region in China. Environ. Int. 2019, 125, 236–244. [Google Scholar] [CrossRef]
- Yao, Y.; He, C.; Li, S.; Ma, W.; Li, S.; Yu, Q.; Mi, N.; Yu, J.; Wang, W.; Yin, L.; et al. Properties of particulate matter and gaseous pollutants in Shandong, China: Daily fluctuation, influencing factors, and spatiotemporal distribution. Sci. Total Environ. 2019, 660, 384–394. [Google Scholar] [CrossRef] [PubMed]
- Ma, X.; Jia, H.; Sha, T.; An, J.; Tian, R. Spatial and seasonal characteristics of particulate matter and gaseous pollution in China: Implications for control policy. Environ. Pollut. 2019, 248, 421–428. [Google Scholar] [CrossRef] [PubMed]
- Shandong Statistical Bureau Statistical Yearbook in 2016. Available online: http://www.stats-sd.gov.cn/col/col6279/index.html (accessed on 16 April 2017).
- Wang, J.; Qiu, C.; Liu, H.; Cao, J.; Wang, D.; Dong, X. The relationship between air quality and meteorological factors in key cities of Shandong Province. J. Ecol. Environ. 2013, 22, 644–649. [Google Scholar]
- Wang, L.; Zhang, Q.; Hao, J.; He, K. Inventory of CO anthropogenic emissions from mainland China. J. Environ. Sci. 2005, 25, 8–13. [Google Scholar]
- Zhao, B.; Ma, J. Establishment of the Inventory of Atmospheric Pollution Sources in Tianjin. J. Environ. Sci. 2008, 28, 368–375. [Google Scholar]
- Huang, C.; Chen, C.; Li, L.; Chen, Z.; Wang, H.; Wang, Y.; Huang, H.; Zhang, G.; Chen, Y. Emission characteristics of atmospheric pollutants from anthropogenic sources in the Yangtze River Delta. J. Environ. Sci. 2011, 31, 1858–1871. [Google Scholar]
- Multi-Resolution Emission Inventory for China [Z/OL]. Available online: http://meicmodel.org/ (accessed on 29 October 2019).
- Yu, Z.; Zhang, S.; Huang, X.; Liu, J. Investigation on the Energy Status and Heating in Rural Areas of Shandong Province, China. Procedia Eng. 2017, 205, 1446–1453. [Google Scholar] [CrossRef]
- Kwok, R.H.F.; Baker, K.R.; Napelenok, S.L.; Tonnesen, G.S. Photochemical grid model implementation and application of VOC, NOX, and O3 source apportionment. Geosci. Model Dev. 2015, 8, 99–114. [Google Scholar] [CrossRef]
- Pan, X.; Ma, H. 2000–2016 Near-surface Atmospheric Driving Data of Heihe River Basin Based on WRF Model. Plateau Meteorol. 2019, 38, 206–216. [Google Scholar]
- Zhao, P.S.; Dong, F.; He, D.; Zhao, X.J.; Zhang, X.L.; Zhang, W.Z.; Yao, Q.; Liu, H.Y. Characteristics of concentrations and chemical compositions for PM2.5 in the region of Beijing, Tianjin, and Hebei, China. Atmos. Chem. Phys. 2013, 13, 4631–4644. [Google Scholar] [CrossRef]
- Xu, L.; Jiao, L.; Hong, Z.; Zhang, Y.; Du, W.; Wu, X.; Chen, Y.; Deng, J.; Hong, Y.; Chen, J. Source identification of PM 2.5 at a port and an adjacent urban site in a coastal city of China: Impact of ship emissions and port activities. Sci. Total Environ. 2018, 634, 1205–1213. [Google Scholar] [CrossRef] [PubMed]
- Li, R.; Cui, L.; Li, J.; Zhao, A.; Fu, H.; Wu, Y.; Zhang, L.; Kong, L.; Chen, J. Spatial and temporal variation of particulate matter and gaseous pollutants in China during 2014–2016. Atmos. Environ. 2017, 161, 235–246. [Google Scholar] [CrossRef]
- Ye, W.; Ma, Z.; Ha, X. Spatial-temporal patterns of PM2.5 concentrations for 338 Chinese cities. Sci. Total Environ. 2018, 631–632, 524–533. [Google Scholar] [CrossRef] [PubMed]
- Emery, C.; Tai, E.; Greg, Y. Enhanced Meteorological Modeling and Performance Evaluation for Two Texas Ozone Episodes; The Texas Natural Resource Conservation Commission, The Texas Natural Resource Conservation Commission: Austin, TX, USA, 2001.
- Liu, X. Analysis of Air Pollution Change Characteristics in Shandong Province from 2000 to 2005. Master’s Thesis, Shandong University, Jinan, China, 2008. [Google Scholar]
- Zhang, Y.; Xu, Y. 2005–2012 Analysis of Atmospheric Environmental Quality in Four Cities in South-central Shandong Province. J. Ludong Univ. (Nat. Sci. Ed.) 2014, 30, 73–77. [Google Scholar]
- Finardi, S.; Agrillo, G.; Baraldi, R.; Calori, G.; Carlucci, P.; Ciccioli, P.; D’Allura, A.; Gasbarra, D.; Gioli, B.; Magliulo, V.; et al. Atmospheric Dynamics and Ozone Cycle during Sea Breeze in a Mediterranean Complex Urbanized Coastal Site. J. Appl. Meteorol. Clim. 2018, 57, 1083–1099. [Google Scholar] [CrossRef]
- Li, H.; Wang, B.; Fang, X.; Zhu, W.; Fan, Q.; Liao, Z.; Liu, J.; Zhang, A.; Fan, S. Combined effect of boundary layer recirculation factor and stable energy on local air quality in the Pearl River Delta over southern China. J. Air Waste Manag. Assoc. 2018, 68, 685–699. [Google Scholar] [CrossRef]
- Wang, H.; Lyu, X.; Guo, H.; Wang, Y.; Zou, S.; Ling, Z.; Wang, X.; Jiang, F.; Zeren, Y.; Pan, W.; et al. Ozone pollution around a coastal region of South China Sea: Interaction between marine and continental air. Atmos. Chem. Phys. 2018, 18, 4277–4295. [Google Scholar] [CrossRef]
- Xu, L.; Chen, X.; Chen, J.; Zhang, F.; He, C.; Zhao, J.; Yin, L. Seasonal variations and chemical compositions of PM2.5 aerosol in the urban area of Fuzhou, China. Atmos. Res. 2012, 104–105, 264–272. [Google Scholar] [CrossRef]
- Betha, R.; Behera, S.N.; Balasubramanian, R. 2013 Southeast Asian Smoke Haze: Fractionation of Particulate-Bound Elements and Associated Health Risk. Environ. Sci. Technol. 2014, 48, 4327–4335. [Google Scholar] [CrossRef]
- Tao, J.; Zhang, L.; Ho, K.; Zhang, R.; Lin, Z.; Zhang, Z.; Lin, M.; Cao, J.; Liu, S.; Wang, G. Impact of PM2.5 chemical compositions on aerosol light scattering in Guangzhou—The largest megacity in South China. Atmos. Res. 2014, 135–136, 48–58. [Google Scholar] [CrossRef]
- Tao, J.; Gao, J.; Zhang, L.; Zhang, R.; Che, H.; Zhang, Z.; Lin, Z.; Jing, J.; Cao, J.; Hsu, S.C. PM2.5 pollution in a megacity of southwest China: Source apportionment and implication. Atmos. Chem. Phys. 2014, 14, 8679–8699. [Google Scholar] [CrossRef]
- Zhang, F.; Wang, Z.; Cheng, H.; Lv, X.; Gong, W.; Wang, X.; Zhang, G. Seasonal variations and chemical characteristics of PM2.5 in Wuhan, central China. Sci. Total. Environ. 2015, 518–519, 97–105. [Google Scholar] [CrossRef]
- Fu, X. Numerical Simulation of Secondary Inorganic Particulate Matter Pollution and Its Influence on Ammonia. Ph.D. Thesis, Tsinghua University, Beijing, China, 2016. [Google Scholar]
- Xausa, F. Study on the Impact of Ammonia Emissions on Fine Particulate Matter Pollution in China. Master’s Thesis, Tsinghua University, Beijing, China, 2014. [Google Scholar]
- Yin, S. Anthropogenic Source Ammonia Emission Inventory in the Pearl River Delta and Its Contribution to the Formation of Particulate Matter. Master’s Thesis, South China University of Technology, Guangzhou, China, 2011. [Google Scholar]
- Huang, X.; Fang, H.; Zhang, L.; Liu, J.; Zhang, L. Preliminary Analysis on the Different Heating Technologies in a Rural Area of Shandong Province, China. Procedia Eng. 2017, 205, 1461–1468. [Google Scholar] [CrossRef]
- Zhi, G.Z.; Yang, J.; Zhang, T.; Guan, J.; Du, J.; Xue, Z.; Meng, F. Investigation, emission estimation and policy implications of coal burning in rural areas in northern China. Environ. Sci. Res. 2015, 28, 1179–1185. [Google Scholar]
- Ge, H. Detection and Pollution Characteristic Analysis of Heavy Metals in PM2.5 of Tai’an City. Master’s Thesis, Shandong University, Jinan, China, 2016. [Google Scholar]
- Liu, Y.; Li, X.; Zhang, Y.; Lu, B.; Tang, G. Autumn and Winter Atmospheric Fine Particle Pollution Characteristics and Sources in Jinan City in Shandong Province. Environ. Chem. 2017, 36, 787–798. [Google Scholar]
- Zhang, J. Preliminary Study on Secondary Organic Aerosols in Winter Water Phase in Jinan City. Master’s Thesis, Shandong University, Jinan, China, 2018. [Google Scholar]
- Liu, Y.; Yin, B.; Wang, J.; Wang, X.; Hou, L.; Ma, Y.; Wang, J.; Zhao, X.; Jiang, Y. Changing Characteristics of Particulate Matter Components in Heavy Air Pollution Process of Jinan city in Shandong province in Winter. Environ. Chem. 2018, 37, 2749–2757. [Google Scholar]
- Yang, Y. Chemical Composition and Source Analysis of Atmospheric Particulates with Different Particle Sizes in Jinan City. Master’s Thesis, Shandong University, Jinan, China, 2017. [Google Scholar]
- Lu, Z.; Streets, D.G.; Zhang, Q.; Wang, S.; Carmichael, G.R.; Cheng, Y.F.; Wei, C.; Chin, M.; Diehl, T.; Tan, Q. Sulfur dioxide emissions in China and sulfur trends in East Asia since 2000. Atmos. Chem. Phys. 2010, 10, 6311–6331. [Google Scholar] [CrossRef]
- Yang, L. Characteristics and Sources of Atmospheric PM2.5 Pollution in Jinan City and Their Impact on Visibility. Ph.D. Thesis, Shandong University, Jinan, China, 2008. [Google Scholar]
- Xu, P.; Wang, W.; Yang, L.; Zhang, Q.; Gao, R.; Wang, X.; Nie, W.; Gao, X. Aerosol size distributions in urban Jinan: Seasonal characteristics and variations between weekdays and weekends in a heavily polluted atmosphere. Environ Monit. Assess 2011, 179, 443–456. [Google Scholar] [CrossRef]
- Gao, X.; Yang, L.; Cheng, S.; Gao, R.; Zhou, Y.; Xue, L.; Shou, Y.; Wang, J.; Wang, X.; Nie, W.; et al. Semi-continuous measurement of water-soluble ions in PM2.5 in Jinan, China: Temporal variations and source apportionments. Atmos. Environ. 2011, 45, 6048–6056. [Google Scholar] [CrossRef]
- Gu, J.; Du, S.; Han, D.; Hou, L.; Yi, J.; Xu, J.; Liu, G.; Han, B.; Yang, G.; Bai, Z. Major chemical compositions, possible sources, and mass closure analysis of PM2.5 in Jinan, China. Air Qual. Atmos. Health 2014, 7, 251–262. [Google Scholar] [CrossRef]
- Yao, L. Study on the Chemical Composition, Source and Secondary Generation of Atmospheric PM2.5 in Typical Areas of Shandong Province. Ph.D. Thesis, Shandong University, Jinan, China, 2016. [Google Scholar]
- Xue, W.; Xu, Y.; Wang, J.; Tang, X. The Impact of Atmospheric Pollutant Emissions from Thermal Power Industry on Air Quality. China Environ. Sci. 2016, 36, 1281–1288. [Google Scholar]
- Chen, B. Study on Emission Characteristics of Thermal Power Industry and Its Impact on Air Quality in Beijing-Tianjin-Hebei Region. Master’s Thesis, Zhejiang University, Hangzhou, China, 2016. [Google Scholar]
- Zhang, X. Research on Synchronous Emission Reduction of Atmospheric Particulate Matters and Greenhouse Gases in Tianjin Thermal Power Industry. Ph.D. Thesis, Nankai University, Tianjin, China, 2013. [Google Scholar]
- Chai, F.; Xue, Z.; Zhi, G.; Du, J.; Luo, Y.; Ren, Y.; Ye, J. Comprehensive Countermeasures for Combustion Pollution of Scattered Coal in Rural Residents. Environ. Prot. 2016, 44, 15–19. [Google Scholar]
- Li, Q.; Duan, L.; Jiang, J.; Wang, S.; Hao, J. Research on the emission reduction potential of primary coal-fired particulate matter in China. J. China Electr. Eng. 2016, 36, 4408–4414. [Google Scholar]


| Category | Sub-Category | Pollutant | References |
|---|---|---|---|
| Industry | key energy-related industries and other industries | CO | Wang et al., 2005 [58]; Zhao et al., 2008 [59]; Huang et al., 2011 [60] |
| PM2.5 | Technical Guidelines for Preparation of Primary Source Emission Inventory of Atmospheric Fine Particulates (Ministry of Environmental Protection of the People’s Republic of China, 2014) | ||
| PM10 | Technical Guidelines for the Preparation of Primary Source Emission Inventory of Inhalable Particulates in the Atmosphere (Ministry of Environmental Protection of the People’s Republic of China, 2014) | ||
| VOCs | Technical Guidelines for the Preparation of Atmospheric Volatile Organic Compound Emission Inventory (Ministry of Environmental Protection of the People’s Republic of China, 2014) | ||
| NH3 | Technical Guidelines for the Preparation of Atmospheric Ammonia Source Emission Inventory (Ministry of Environmental Protection of the People’s Republic of China, 2014) | ||
| Transportation | road dust | PM2.5 | Technical Guidelines for the Preparation of Air Pollutant Emission Inventory for Road Vehicles (Ministry of Environmental Protection of the People’s Republic of China, 2014) |
| PM10 | Technical Guidelines for the Preparation of Air Pollutant Emission Inventory for Road Vehicles (Ministry of Environmental Protection of the People’s Republic of China, 2014) | ||
| port terminal VOCs emission | VOCs | Technical Guidelines for the Preparation of Atmospheric Volatile Organic Compound Emission Inventory (Ministry of Environmental Protection of the People’s Republic of China, 2014) | |
| Resident | urban residents | CO | Wang et al., 2005 [59]; Zhao et al., 2008 [60]; Huang et al., 2011 [61] |
| PM2.5 | Technical Guidelines for Preparing Primary Source Emission Inventory of Atmospheric Fine Particulates (Ministry of Environmental Protection of the People’s Republic of China, 2014) | ||
| PM10 | Technical Guidelines for the Preparation of Primary Source Emission Inventory of Inhalable Particulates in the Atmosphere (Ministry of Environmental Protection of the People’s Republic of China, 2014) | ||
| VOCs | Technical Guidelines for the Preparation of Atmospheric Volatile Organic Compound Emission Inventory(Ministry of Environmental Protection of the People’s Republic of China, 2014) | ||
| NH3 | Technical Guidelines for the Preparation of Atmospheric Ammonia Source Emission Inventory (Ministry of Environmental Protection of the People’s Republic of China, 2014) | ||
| rural (suburban) residents | SO2 | Technical Guidelines for the Preparation of Air Pollutant Emission Inventory for Biomass Combustion Sources (Ministry of Environmental Protection of the People’s Republic of China, 2014), Technical Guidelines for the Preparation of Civil Coal Air Pollutant Emission Inventory (Ministry of Environmental Protection of the People’s Republic of China), 2016) | |
| NOX | |||
| CO | |||
| PM2.5 | |||
| PM10 | |||
| VOCs | |||
| NH3 |
| Category | Sub-Category | Policies | Measures | Plans |
|---|---|---|---|---|
| Industry | Thermal power | Eliminate backward production capacity | Prioritize the elimination of units below 200,000 kW, especially pure condensation units operating for 20 years and extraction condensation heat and power units operating for 25 years. | Medium and Long-Term Development Energy Plan of Shandong Province (Development and Reform Commission of Shandong Province, 2016) |
| Elimination of conventional coal-fired thermal power units with a capacity of less than 100,000 kW per unit and conventional coal-fired thermal power units with a capacity of less than 200,000 kW per unit at the end of their design life | Shandong Local Implementation Plan for Refining and Chemical Industry Transformation and Upgrading (Shandong Petrochemical Industry Association, Shandong Petroleum Refining and Chemical Association, 2014) | |||
| Elimination of conventional small fossil-fired power units with a single unit capacity of 50,000 kW or less and of oil-fired boilers and generators mainly for power generation | Shandong Province’s Elimination of Backward Capacity Coal Mines List (Shandong Coal Industry Bureau, 2016) | |||
| List of the First Batch of Coal and Electricity Industry Planned to Eliminate Backward Productivity Enterprises in Shandong Province | List of the First Batch of Coal and Electricity Industry Planned to Eliminate Backward Productivity Enterprises in Shandong Province in 2017 (Shandong Coal Industry Bureau, 2017) | |||
| Environmental protection reform of ultra-low emission | Implementation of ultra-low emission environmental protection renovation for HUANENG (Dezhou), GUODIAN (Shiheng), HUADIAN (Shiliquan, Weifang) and other nearly 55 million kilowatt coal-fired power units by 2017 | Implementation Opinions of the Shandong Provincial People’s Government on Implementing the Pilot Program for the Structural Adjustment of the Iron and Steel Industry in Shandong Province (Shandong Provincial People’s Government, 2012) | ||
| Energy-saving reforms have been carried out for nearly 33 million kilowatt coal-fired power units in GUODIAN (Liaocheng), DATANG (Huangdao), HUADIAN (Zouxian), HUARUN (Heze), etc. The coal consumption of the power supply has reached the advanced level of the same type of units. | Shandong Province’s Elimination of Backward Capacity Coal Mines List (Shandong Coal Industry Bureau, 2016) | |||
| In 2017, the province’s coal-fired units were fully implemented ultra-low emissions, so that the average coal consumption per kilowatt hour in all existing power plants was less than 310 grams of standard coal, and the average coal consumption per kilowatt hour in new power plants was less than 300 grams of standard coal. | Comprehensive Emission Standards of Regional Air Pollutants in Shandong Province (Shandong Environmental Protection Department, 2013) | |||
| steel | Eliminate backward production capacity | By the end of 2017, Qingdao city eliminated the backward production capacity of ironmaking by 3.6 million tons; Laiwu city eliminated the backward production capacity of ironmaking by 3.5 million tons. Elimination of coke ovens (with a capacity of 75,000 tons per year or less) with a carbonization chamber height of less than 4.3 meters (except tamping coke ovens with a capacity of 3.8 meters or more) occurred. | Notice on Implementing the Work of Eliminating Overcapacity and Realizing the Development of Overcoming Difficulties in Iron and Steel and Coal Industry (Shandong Economic and Information Commission, Shandong Development and Reform Commission, 2016) | |
| In 2017, besides total production capacity of the steelworks belong to Jinan Iron and Steel Group Company will be shutdown, and the province planned to reduce crude steel production capacity by 5.27 million tons and pig iron production capacity by 1.75 million tons. Among them: Weifang city reduced the crude steel production capacity by 2.2 million tons and reduced the pig iron production capacity by 550,000 tons. Laiwu city reduced the crude steel production capacity by 1.24 million tons; Binzhou city reduced crude steel production capacity to 1.83 million tons; Linyi city reduced pig iron production capacity to 1.2 million tons; | ||||
| List of enterprises in Shandong’s target plan for eliminating backward production capacity in 2015 | ||||
| Reducing energy consumption level | By 2020, the comprehensive energy consumption per ton of steel will be reduced to less than 570 kg of standard coal, the consumption of fresh water per ton of steel will be less than 2.95 tons, the emission of smoke and dust per ton of steel will be less than 0.8 kg, and the emission of SO2 per ton of steel will be less than 1.2 kg. | |||
| Chemical | Reducing energy consumption level | By 2020, the average comprehensive energy consumption of crude oil processing will be reduced to 60 kg/ton, which is 4.8% lower than that in 2017. | Comprehensive Emission Standards of Regional Air Pollutants in Shandong Province (Shandong Environmental Protection Department, 2013) | |
| Coal mining industry | Eliminate backward production capacity | List of Coal Mines with Backward Productivity in Shandong Province in 2015 (Shandong Coal Industry Bureau, 2017), | ||
| other | Establishment of strict industrial emission standards | Comprehensive Emission Standards of Regional Air Pollutants in Shandong Province (Shandong Environmental Protection Department, 2013) | ||
| By 2017, the intensity of atmospheric pollutant discharge in iron and steel, cement, and chemical industries, petrochemical industry, non-ferrous metal smelting, and other industries will be more than 30% lower than that in 2013. | Medium and Long-term Development Energy Plan of Shandong Province (Development and Reform Commission of Shandong Province, 2016) | |||
| Transportation | port terminal | New construction and extension of the terminal | New crude oil terminals (13), 38 oil and liquid chemical terminals, and 3 LNG terminals | Planning and Construction Plan for Oil and Gas Transportation Facilities in Shandong Province (2016–2020) (Shandong Development and Reform Commission, Shandong Economic and Information Commission, Shandong Transportation Department, 2015) |
| New construction and expansion of tank farms | New construction and expansion of tank farms | |||
| Resident | loose coal burning for winter | Increasing heating popularization rate | By 2020, the popularization rate of central heating 1 in urban areas reached more than 80%, and the household heating rate of distributed renewable energy 2 in rural areas reached more than 50%. | Medium and Long-term Development Energy Plan of Shandong Province (Development and Reform Commission of Shandong Province, 2016) |
| Coal to gas | By 2017, 7 transmission channel cities completed more than 50,000 gas-to-coal or electric-generation coal projects, and strive to reduce coal consumption by 1 million tons. | Clean Coal Treatment Work Plan of Shandong Province (People’s Government of Shandong Province, 2016) |
| Category | Sub-Category | Emission Source |
|---|---|---|
| Industry | key energy-related industries | thermal power |
| steel | ||
| chemical | ||
| coking | ||
| oil refining | ||
| other key energy-related industries | ||
| other industries | ||
| Resident | urban residents | |
| rural (suburban) residents | cooking in rural regions | |
| loose coal burning for winter heating | ||
| Transportation | -- | -- |
| Agriculture | -- | -- |
| Category | Sub-Category | SO2/t | NOX/t | CO/t | PM2.5/t | PM10/t | VOCs/t | NH3/t |
|---|---|---|---|---|---|---|---|---|
| Industry | key energy-related industries | 1,014,818 | 839,896 | 19,162,557 | 392,285 | 577,612 | 894,272 | 4,511 |
| other industries | 206,136 | 107,915 | 13,254 | 10,351 | 22,295 | 6,082 | 307 | |
| total | 1,220,954 | 947,811 | 19,175,811 | 402,636 | 599,907 | 900,354 | 4,818 | |
| Resident | urban residents | 304,515 | 71,517 | 279,315 | 13,398 | 18,781 | 4,829 | 3,115 |
| rural (suburban) residents 1 | 63,312 | 37,994 | 3,023,006 | 72,663 | 117,052 | 50,676 | 162 | |
| among: loose coal burning for winter heating | 21,885 | 11,195 | 948,786 | 31,912 | 41,020 | 19,472 | 0 | |
| total | 367,827 | 109,511 | 3,302,321 | 86,061 | 135,833 | 55,505 | 3,277 | |
| Transportation | on-road mobile | 23,155 | 405,839 | 1,722,778 | 57,703 | 59,065 | 180,837 | 2,551 |
| road dust | 0 | 0 | 0 | 1,399 | 5,504 | 0 | 0 | |
| port terminal VOCs emission | 0 | 0 | 0 | 0 | 0 | 191,483 | 0 | |
| total | 23,155 | 405,839 | 1,722,778 | 59,102 | 64,569 | 372,320 | 2,551 | |
| Agriculture | 0 | 0 | 0 | 0 | 0 | 0 | 652,291 | |
| Total | 1,611,936 | 1,463,161 | 24,200,910 | 547,799 | 800,309 | 1,328,179 | 662,937 |
| Category | Sub-Category | SO2/t | NOX/t | CO/t | PM2.5/t | PM10/t | VOCs/t | NH3/t |
|---|---|---|---|---|---|---|---|---|
| Industry | key energy-related industries | 442,991 | 378,865 | 12,666,057 | 182,330 | 314,964 | 643,681 | 4,157 |
| other industries | 118,524 | 65,163 | 9,277 | 7,773 | 16,648 | 10,902 | 216 | |
| total | 561,515 | 444,028 | 12,675,334 | 190,103 | 331,612 | 654,583 | 4,373 | |
| Resident | urban residents | 306,718 | 72,633 | 278,513 | 13,360 | 18,727 | 4,816 | 3,106 |
| rural (suburban) residents 1 | 22,048 | 16,933 | 1,264,369 | 19,023 | 47,315 | 14,963 | 162 | |
| among: loose coal burning for winter heating | 9,899 | 5,052 | 424,982 | 14,432 | 18,620 | 8,853 | 0 | |
| total | 328,766 | 89,566 | 1,542,882 | 32,383 | 66,042 | 19,779 | 3,268 | |
| Transportation | on-road mobile | 23,155 | 405,839 | 1,722,778 | 57,703 | 59,065 | 180,837 | 2,551 |
| road dust | 0 | 0 | 0 | 1,294 | 5,349 | 0 | 0 | |
| port terminal VOCs emission | 0 | 0 | 0 | 0 | 0 | 467,428 | 0 | |
| total | 23,155 | 405,839 | 1,722,778 | 58,997 | 64,414 | 648,265 | 2,551 | |
| Agriculture | 0 | 0 | 0 | 0 | 0 | 0 | 652,291 | |
| Total | 913,436 | 939,433 | 15,940,994 | 281,483 | 462,068 | 1,322,627 | 662,483 |
| Variables | MB | MAGE | RMSE | IOA | r |
|---|---|---|---|---|---|
| Wind speed | −0.06 m/s (≤±0.5 m/s) | - | 0.95 m/s (≤2 m/s) | 0.56 (≥0.6) | 0.61 |
| Wind direction | 3.10 deg (≤±10 deg) | 46.84 deg (≤30 deg) | - | - | 0.63 |
| Temperature(2 m) | 0.34 K (≤±0.5 K) | 1.54 K (≤2 K) | - | 0.74 (≥0.8) | 0.81 |
| Humidity | −0.92 g/kg (≤±1 g/kg) | 0.95 g/kg (≤2 g/kg) | - | 0.82 (≥0.6) | 0.83 |
| Pollutant | Station | JN | QD | LC | ZZ | WH | Average |
|---|---|---|---|---|---|---|---|
| SO2 (μg/m3) | MB | −4.6 | −10.3 | −2 | −11.9 | 2.6 | −5.3 |
| MAGE | 5.6 | 11.2 | 3.4 | 12.8 | 3.6 | 7.3 | |
| RMSE | 8.3 | 14.8 | 8.8 | 15.6 | 7.8 | 11.1 | |
| IOA | 0.73 | 0.68 | 0.71 | 0.75 | 0.74 | 0.72 | |
| r | 0.72 | 0.73 | 0.74 | 0.72 | 0.68 | 0.72 | |
| NO2 (μg/m3) | MB | −19 | −19.7 | −10.4 | −16.9 | −15.4 | −16.3 |
| MAGE | 21.2 | 20.8 | 12.4 | 18.8 | 17.1 | 18.1 | |
| RMSE | 28 | 32.2 | 12.4 | 18.9 | 17.3 | 21.8 | |
| IOA | 0.58 | 0.56 | 0.66 | 0.62 | 0.61 | 0.61 | |
| r | 0.59 | 0.58 | 0.63 | 0.63 | 0.59 | 0.6 | |
| PM2.5 (μg/m3) | MB | −6.3 | −6.6 | −8 | −6.3 | −5.9 | −6.6 |
| MAGE | 7.2 | 8.9 | 10.8 | 8.1 | 7.4 | 8.5 | |
| RMSE | 16.9 | 13.6 | 12.4 | 10.4 | 11.7 | 13 | |
| IOA | 0.76 | 0.72 | 0.71 | 0.78 | 0.81 | 0.76 | |
| r | 0.74 | 0.75 | 0.73 | 0.72 | 0.76 | 0.74 | |
| PM10 (μg/m3) | MB | −76.7 | −30 | −70 | −72.6 | −21.8 | −54.2 |
| MAGE | 77.1 | 32.1 | 71.7 | 74.1 | 22.6 | 55.5 | |
| RMSE | 78.8 | 34.6 | 73.3 | 75.2 | 24.4 | 57.3 | |
| IOA | 0.42 | 0.54 | 0.44 | 0.41 | 0.54 | 0.47 | |
| r | 0.43 | 0.52 | 0.45 | 0.42 | 0.53 | 0.47 |
| Station | SO2 (μg/m3) | NO2 (μg/m3) | PM2.5 (μg/m3) | PM10 (μg/m3) | ||||
|---|---|---|---|---|---|---|---|---|
| Obsmean | Simmean | Obsmean | Simmean | Obsmean | Simmean | Obsmean | Simmean | |
| JN | 57 | 52 | 62 | 43 | 93 | 87 | 159 | 82 |
| QD | 27 | 17 | 36 | 16 | 55 | 48 | 92 | 62 |
| LC | 50 | 48 | 41 | 31 | 98 | 90 | 168 | 98 |
| ZZ | 72 | 60 | 38 | 22 | 90 | 84 | 165 | 92 |
| WH | 17 | 20 | 30 | 14 | 42 | 36 | 70 | 48 |
| Average | 45 | 39.5 | 41 | 25.2 | 76 | 68.9 | 131 | 76.5 |
| Category | Sub-Category | January | April | July | October | Average 2 |
|---|---|---|---|---|---|---|
| Industry | key energy-related industries | 18.40% | 33.90% | 39.60% | 26.20% | 29.50% |
| other industries | 5.10% | 4.70% | 5.60% | 5.20% | 5.20% | |
| total | 23.50% | 38.60% | 45.30% | 31.40% | 34.70% | |
| Resident | urban residents | 13.00% | 15.90% | 11.30% | 17.60% | 14.50% |
| rural (suburban) residents | 28.30% | 5.60% | 4.90% | 8.30% | 11.80% | |
| Among: loose coal burning for winter heating | 19.40% | 0.00% | 0.00% | 0.00% | 4.90% | |
| total | 41.30% | 21.70% | 16.20% | 25.90% | 26.30% | |
| Transportation | 13.30% | 16.10% | 13.50% | 17.70% | 15.20% | |
| Agriculture | 5.30% | 8.70% | 6.90% | 8.30% | 7.30% | |
| Outside 1 | 16.60% | 14.90% | 18.20% | 16.70% | 16.60% | |
| Total | 100.00% | 100.00% | 100.00% | 100.00% | 100.00% | 100.00% |
| Category | January | April | July | October | Average 1 |
|---|---|---|---|---|---|
| Thermal Power | 12.80% | 24.20% | 27.00% | 17.60% | 20.40% |
| Steel | 2.30% | 4.00% | 5.10% | 3.40% | 3.70% |
| Chemical | 1.30% | 3.10% | 4.00% | 2.70% | 2.80% |
| Oil Refining | 0.30% | 1.00% | 1.30% | 0.90% | 0.80% |
| Other Key Energy-Related Industries | 0.60% | 0.50% | 0.60% | 0.60% | 0.60% |
| Total | 18.40% | 33.90% | 39.60% | 26.20% | 29.50% |
| Category | Sub-Category | January | April | July | October | Average 2 |
|---|---|---|---|---|---|---|
| Industry | key energy-related industries | 13.39% | 13.80% | 17.40% | 12.52% | 14.28% |
| other industries | 2.91% | 2.94% | 2.95% | 2.82% | 2.91% | |
| total | 16.29% | 16.74% | 20.36% | 15.34% | 17.18% | |
| Resident | urban residents | 5.75% | 5.43% | 7.11% | 5.48% | 5.94% |
| rural (suburban) residents | 7.44% | 1.07% | 1.18% | 1.32% | 2.75% | |
| among: loose coal burning for winter heating | 6.03% | 0.00% | 0.00% | 0.00% | 1.51% | |
| total | 13.19% | 6.50% | 8.29% | 6.80% | 8.69% | |
| Transportation | 7.63% | 8.31% | 8.30% | 8.21% | 8.11% | |
| Agriculture | 15.22% | 22.20% | 13.06% | 13.94% | 16.10% | |
| Outside 1 | 47.67% | 46.26% | 49.99% | 55.70% | 49.90% | |
| Total | 100% | 100% | 100% | 100% | 100.00% | |
| Category | January | April | July | October | Average 1 |
|---|---|---|---|---|---|
| thermal power | 1.62% | 1.82% | 2.06% | 1.49% | 1.75% |
| steel | 0.85% | 0.72% | 0.87% | 0.68% | 0.78% |
| chemical | 1.58% | 1.73% | 2.00% | 1.45% | 1.69% |
| coking | 0.42% | 0.46% | 0.71% | 0.42% | 0.50% |
| oil refining | 0.72% | 0.85% | 1.12% | 0.73% | 0.86% |
| other key energy-related industries | 8.19% | 8.21% | 10.65% | 7.76% | 8.70% |
| total | 13.39% | 13.80% | 17.40% | 12.52% | 14.28% |
| Pollutant | Average Emissions(kt) | Reduction Rates | |
|---|---|---|---|
| Base Year | 2020 | 2020 | |
| SO2 | 1611.94 | 913.44 | 43% |
| NO2 | 1463.16 | 939.43 | 36% |
| PM2.5 | 547.8 | 281.48 | 42% |
| PM10 | 800.31 | 462.07 | 49% |
| VOCs | 1328.18 | 1322.63 | 0.40% |
| NH3 | 662.94 | 662.48 | 0.10% |
| CO | 24,200.91 | 15,940.99 | 34% |
| Pollutant | Simulated Concentration 1 (μg/m3) | Decrease Rates 3 | |||||
|---|---|---|---|---|---|---|---|
| Year | January | April | July | October | Average 2 | ||
| SO2 | 2015 | 68.22 | 37.25 | 27.06 | 36.91 | 42.36 | 30% |
| 2020 | 46.45 | 29.58 | 20.41 | 21.45 | 29.47 | ||
| NO2 | 2015 | 32.89 | 23.13 | 22.73 | 25.49 | 26.06 | 24% |
| 2020 | 25.12 | 18.65 | 17.32 | 17.98 | 19.77 | ||
| PM2.5 | 2015 | 103.35 | 66.97 | 53.49 | 72.80 | 74.15 | 46% |
| 2020 | 56.82 | 36.49 | 27.14 | 39.56 | 40.00 | ||
| PM10 | 2015 | 105.43 | 72.59 | 68.78 | 82.81 | 82.40 | 46% |
| 2020 | 58.36 | 39.21 | 35.69 | 46.07 | 44.83 | ||
© 2019 by the authors. Licensee MDPI, Basel, Switzerland. This article is an open access article distributed under the terms and conditions of the Creative Commons Attribution (CC BY) license (http://creativecommons.org/licenses/by/4.0/).
Share and Cite
Luo, R.; He, C.; Yu, Q.; He, L.; Zhang, Y.; Ma, W. Investigating the Influence of the Implementation of an Energy Development Plan on Air Quality Using WRF-CAMx Modeling Tools: A Case Study of Shandong Province in China. Atmosphere 2019, 10, 660. https://doi.org/10.3390/atmos10110660
Luo R, He C, Yu Q, He L, Zhang Y, Ma W. Investigating the Influence of the Implementation of an Energy Development Plan on Air Quality Using WRF-CAMx Modeling Tools: A Case Study of Shandong Province in China. Atmosphere. 2019; 10(11):660. https://doi.org/10.3390/atmos10110660
Chicago/Turabian StyleLuo, Ruoting, Cheng He, Qi Yu, Li He, Yan Zhang, and Weichun Ma. 2019. "Investigating the Influence of the Implementation of an Energy Development Plan on Air Quality Using WRF-CAMx Modeling Tools: A Case Study of Shandong Province in China" Atmosphere 10, no. 11: 660. https://doi.org/10.3390/atmos10110660
APA StyleLuo, R., He, C., Yu, Q., He, L., Zhang, Y., & Ma, W. (2019). Investigating the Influence of the Implementation of an Energy Development Plan on Air Quality Using WRF-CAMx Modeling Tools: A Case Study of Shandong Province in China. Atmosphere, 10(11), 660. https://doi.org/10.3390/atmos10110660