Article

Temporal and Spatial Distribution Characteristics of Atmospheric Particulate Matter (PM10 and PM2.5) in Changchun and Analysis of Its Influencing Factors

College of New Energy and Environment, Jilin University, Changchun 130012, China
*
Author to whom correspondence should be addressed.
Atmosphere 2019, 10(11), 651; https://doi.org/10.3390/atmos10110651
Submission received: 27 September 2019 / Revised: 17 October 2019 / Accepted: 24 October 2019 / Published: 28 October 2019
(This article belongs to the Section Air Quality)

Abstract

:
With Changchun’s economic development, atmospheric particulate pollution has become a significant challenge in Changchun. The spatiotemporal patterns of particulate matter emissions are an inherent characteristic for particulate matter emissions. By using hourly PM (particulate matter) mass concentration measured at 10 atmospheric automatic monitoring stations and meteorological parameters, the spatiotemporal distribution characteristics of particulate matter (PM10 and PM2.5) and its relationship with meteorological parameters of Changchun have been analyzed. Pollution pathways and source distribution were investigated using HYSPLIT (Hybrid Single Particle Lagrangian Integrated Trajectory) model and cluster analysis. Results indicated that the quarterly average PM2.5 and PM10 mass concentrations in Changchun were higher in the first quarter and the fourth quarter. PM concentrations observed in all seasons generally exhibited two peaks, at 07:00–10:00 and 21:00–23:00, with the exception of PM10 in spring. PM pollution was concentrated mainly in the central, northern, and western areas of Changchun in most seasons, mainly due to anthropogenic activities and soil dust transported outside the region. PM concentrations were negatively correlated with relative humidity and temperature. PM2.5 concentrations were negatively correlated with wind speed, while PM10 concentrations were positively correlated with wind speed. The results of backward trajectory clustered showed that the northwest airflow had the greatest impact on PM of Changchun, except summer.

1. Introduction

Recently, substantial growth in China’s energy consumption and the rapid economic development have led to a series of heavy air pollution episodes—particularly those caused by atmospheric PM (particulate matter) [1,2,3]. The primary atmospheric pollutants in more than 70% of the national key detection cities were PM10 and PM2.5 [4]. PM pollution affects urban and regional air quality [5,6,7] and visibility [8,9,10], and even plays an important role in global climate change [11,12,13]. PM at high concentrations can significantly increase the incidence of human respiratory and cardiovascular diseases and mortality [14,15,16]. Because of the harm of PM pollution, people have drawn significant attention to it in recent years [17,18]. Many efforts have been made to investigate the physical [19,20,21], chemical [22,23,24] and optical properties [25,26] of atmospheric PM as well as its relationship with meteorological parameters [27,28,29], which are important for understanding the variation and formation in aerosols.
Changchun City is considered a natural geographical center of Northeast China and the hinterland of the Northeast Plain. It has vast farmlands with an area of 2.36 × 10⁵ ha around the city. Changchun is also an industrial city that has the largest number of automobile manufacturers in China. As a typical northeastern city, it has a long heating period in winter. These factors lead to the significant atmospheric PM pollution in Changchun in recent years and the incidence of haze is increasing. The annual average of PM2.5 concentration in 2017 was 47 μg m−3, which was 34.3% higher than the national secondary standard of ambient air quality (35 μg m−3) and the annual average of PM10 was 81 μg m−3, which was 15.71% higher than the national secondary air quality standard (70 μg m−3). The above results indicate that the pollution of particulate matter in Changchun is very serious and needs to be taken seriously. In the past, the researches on the particulate matter of Changchun were mainly focused on the composition analysis [30] and the source apportionment [31] of particulate matter. However, there are very limited studies on the spatiotemporal characteristics of particulate matter pollution in Changchun and its influencing factors. In this study, we investigated the temporal variation and spatial distribution of PM10 and PM2.5 average concentrations in Changchun as well as the effects of meteorological parameters on atmospheric particles and use the Hysplit model to determine the main source of particulate matter in Changchun.

2. Materials and Methods

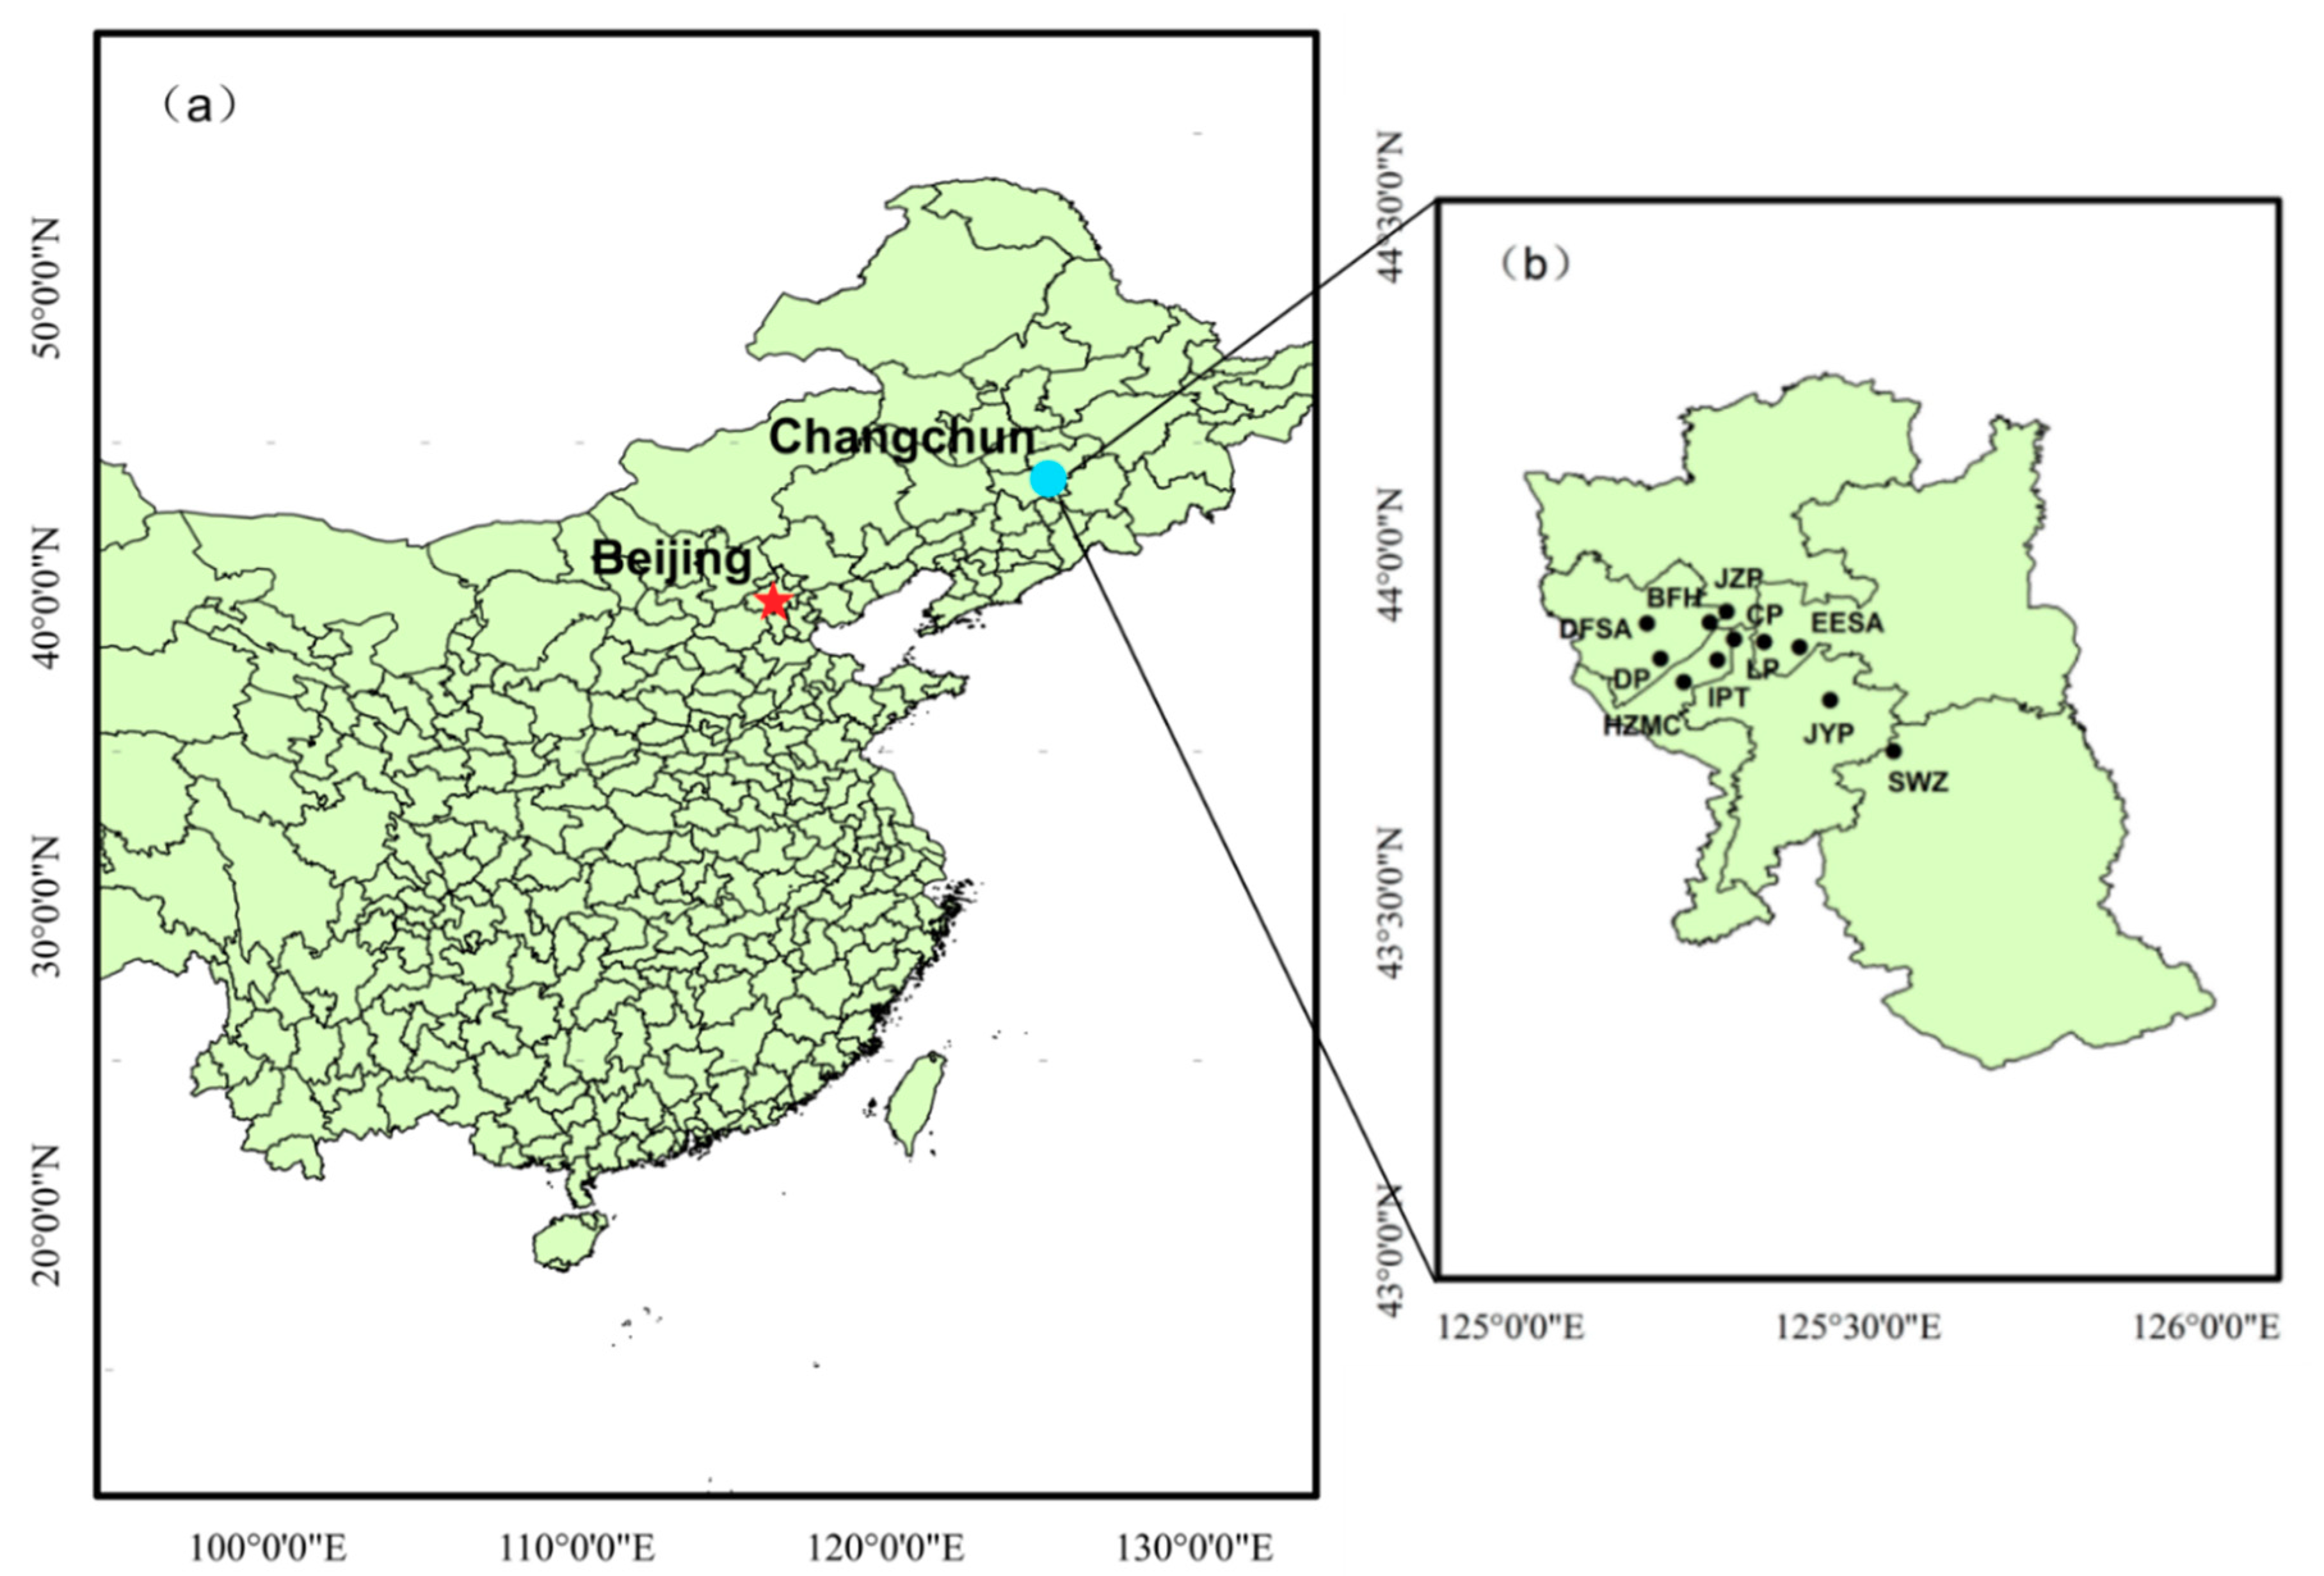
2.1. Sampling Sites and Data

Changchun is located in the mid-latitude zone of the Northern Hemisphere, the hinterland of the Northeast Plain of China (Figure 1a). A total of 10 air quality monitoring stations were located in different districts of Changchun (Figure 1b). Nine of the 10 sites are located in the built-up area of Changchun: Daishan Park (DP), High-Tech Zone Management Committee (HZMC), Economic Development Zone Environment Sanitary Administration (EESA), Jingyue Park (JYP), Bus Factory Hospital (BFH), Labour Park (LP), Children’s Park (CP), Institute of Posts and Telecommunications (IPT), Junzilan Park (JZP), and one clean control station named Shuaiwanzi (SWZ), which is located in the Shuangyang district of Changchun. Table 1 shows the details of the above sampling stations.
The hourly PM concentrations for all 10 sites in 2017 were from 10 atmospheric environment automatic monitoring stations in Changchun. The hourly meteorological parameters in 2017, including wind speed, direction, temperature and relative humidity, were obtained from the Dafangshan Airport (DFSA) meteorological station (43.90 N, 125.20 E) in Changchun (Figure 1b), which was obtained from the website (http://www.wunderground.com). The percentages of valid data for PM2.5, PM10 and meteorological parameters are 98.59%, 98.47% and 100%, respectively. Daily and monthly averaged PM concentrations and meteorological parameters were calculated from their hourly data, which were then used to characterize their properties based on statistical analyses.

2.2. HYSPLIT Model and Backward Trajectory

The HYSPLIT (Hybrid Single Particle Lagrangian Integrated Trajectory) model developed by the National Center for Marine Atmospheric Research (NOAA) is a specialized model for calculating and analyzing the transport and diffusion trajectories of atmospheric pollutants [32,33]. The HYSPLIT model is widely used in the field of atmospheric science to analyze the transport and diffusion of air pollutants [34,35]. In order to study the PM transmission characteristics of Changchun, this study simulates one backward trajectory per hour and the simulation starting height is 100 m a.g.l. [36], which can not only represent the flow of the near-surface wind, reflecting the regional flow characteristics of the airflow, but also reduce the influence of near-surface friction. The vertical motion method used for the model is the default “model vertical velocity” which will use the vertical velocity field from the meteorological data. The backward time scale is 48 h [37] to cover the life cycle of secondary pollutants.

2.3. Trajectory Clustering Analysis

In order to analyze the transport path of atmospheric particulate matter in Changchun, the SCA (Stepwise Cluster Analysis) algorithm is adopted in this study to cluster the backward trajectories.
In the calculation process of SCA, the spatial similarity between backward trajectories on the same spatial location at different time is taken as the clustering criterion. All backward trajectory groups are merged. The merged results are iteratively grouped and merged again, and finally a small number of representative cluster trajectories are obtained. All backward trajectory groups are merged, and the combined results are iteratively grouped and merged again. Finally, a small number of representative cluster trajectories are obtained.
The specific calculation formula of SCA is:
D = j = 0 t d j 2 ,
SPVAR = i = 1 x j = 0 t d i j 2 ,
TSV = S P V A R ,
where, i: backward trajectory number, I = 1,…,8760; j: stop point number; t: trajectory transmission time; D: the distance between any two backward trajectories; dij: the spatial distance from the j–th stop point in the i–th backward trajectory to the corresponding stop point of the average trajectory; dj: the spatial distance between the j–th stop points of the two trajectories; x: the number of trajectories in the cluster; SPVAR: space variation of each group of trajectories; TSV: total space variation
The calculating principle is as follows: it is assumed that the data of any two groups in N groups are merged into one group, and the average trajectory of each two initial trajectories is obtained according to the latitude and longitude of each stop point in the two group of trajectories. In this case, the spatial dissimilarity between each group of original trajectories to the average trajectories is calculated, and the two groups of trajectories with the least dissimilarity are selected to be combined into one. Repeat the calculation and merge, and finally several average trajectories with significant features and representativeness are obtained.

3. Result and Discussion

3.1. Temporal Characteristics of Atmospheric PM in Changchun

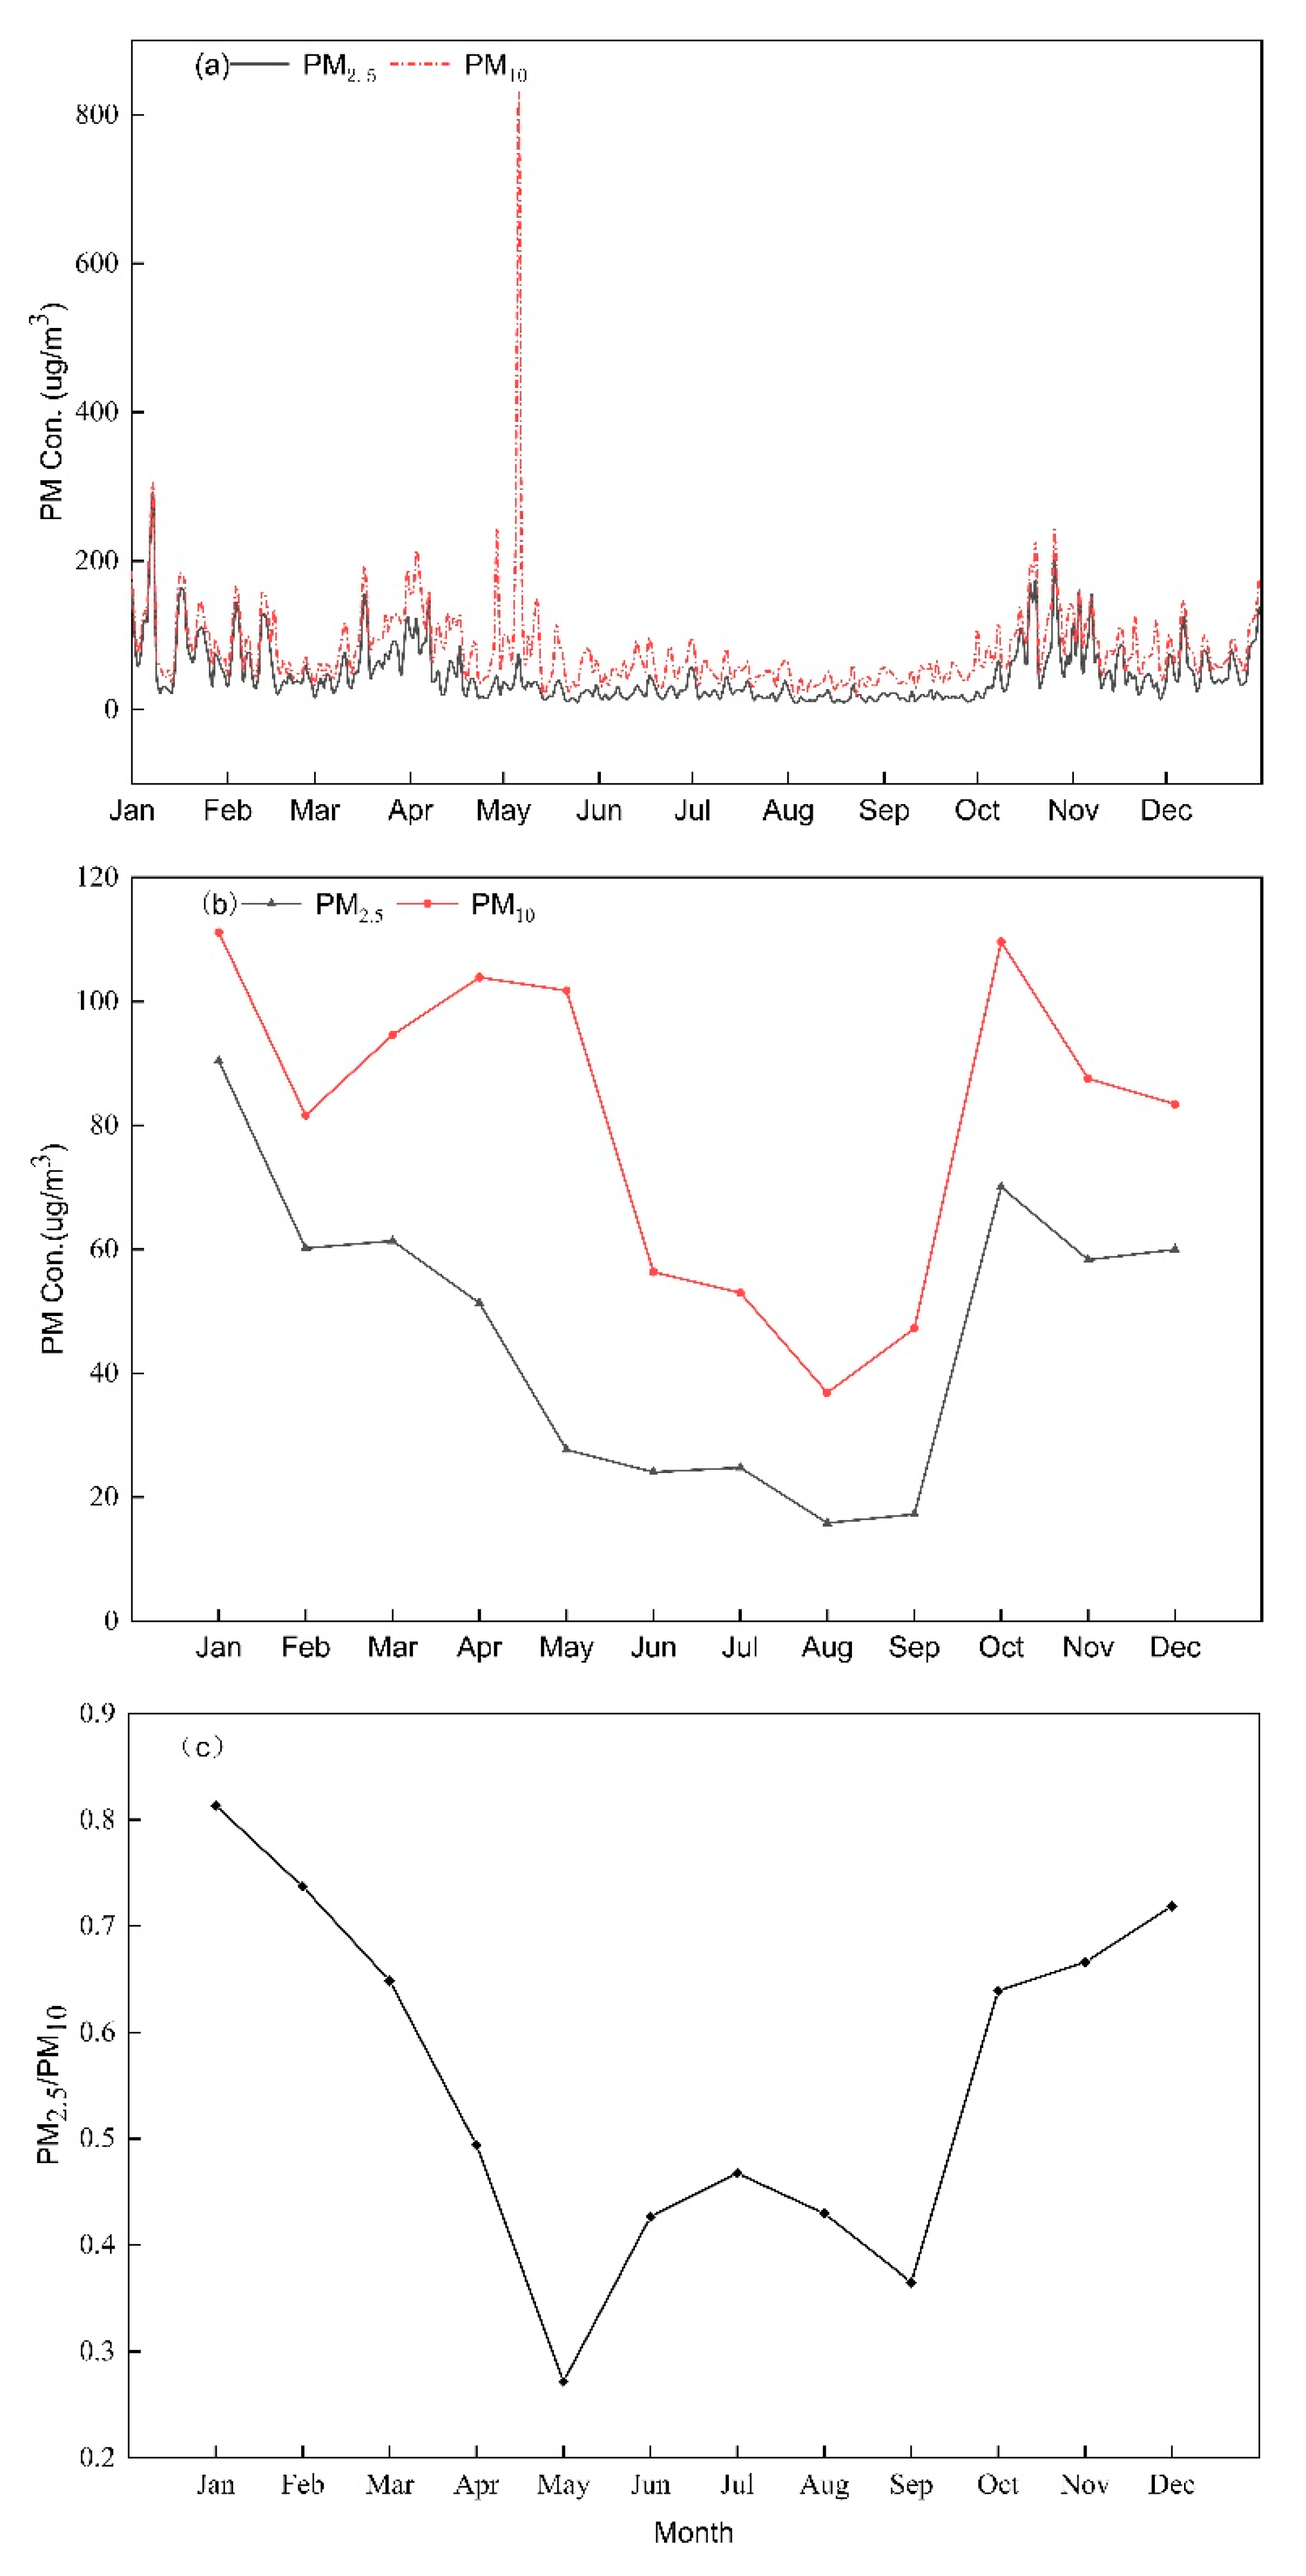
3.1.1. Quarterly and Monthly Variations in PM Mass Concentrations

Figure 2 shows the daily and monthly variation in PM2.5 and PM10 mass concentrations and the monthly ratio of PM2.5 to PM10 (PM2.5/PM10) averaged from 10 stations of Changchun in 2017. As shown in Figure 2a, PM2.5 and PM10 concentrations showed similar change over time. Daily mean PM2.5 and PM10 concentrations were normally below 200 and 300 μg m−3, respectively. Three distinct peaks in daily PM concentrations were observed during the study period. The first peak occurred in January, and the maximum daily mean concentrations of PM2.5 and PM10 were 284 and 302 μg m−3, respectively. There were 16 days under good air quality in January, which was mainly caused by meteorological condition and coal heating in winter. During the period of exceeding the standard, there were eight days with quiet wind and the average wind speed was 2.18 m s−1, and lower wind speed was not conducive to the diffusion of PM. The average temperature in January was −13.5 °C, which was relatively low, so there was a large demand for coal-fired heating. According to the research results of our research group, coal combustion is the primary pollution source of PM2.5 in winter of Changchun, with a contribution rate of 23.94%. The second peak with higher PM10 concentrations in May was due to dust activities with the ratio of PM2.5/PM10 suddenly decreasing to less than 30%. Since May 4, Changchun has experienced sand-dust weather for several days and a PM10 concentration that exceeded 800 μg m−3 on May 6. This dust storm originated from Inner Mongolia Plateau, which was widely reported on the Internet (http://jl.sina.com.cn/news/m/2017-05-09/detail-ifyeycfp9380012.shtml). The third peak with PM2.5 concentrations exceeding 200 μg m−3, was caused by the straw burning, which is a traditional agricultural activity and normally occurs in October or November in the widespread agricultural regions of northeast China. The total amount of straw resources in Jilin Province is relatively large, and the straw resources in the central region such as Changchun account for about 63% of the total. The amount of straw resources collected in Jilin Province is about 40 million tons, and the amount of straw resources burned by farmers accounts for about 20% of the total collection.
Monthly averaged PM2.5 concentrations in Changchun during 2017 ranged from 17.24 to 90.40 μg m−3, while PM10 varied between 36.85 and 111.14 μg m−3, and both showed a typical V-shaped pattern with a peak observed in January and October and trough observed in August, as shown as Figure 2b. A V-shaped distribution was also found for monthly PM2.5 and PM10 concentrations in Sichuan Basin, with peak and trough values occurring in January and September [38].
In Changchun, the highest PM2.5 concentrations were observed in in the first quarter (71 μg m−3), followed by the fourth quarter (63 μg m−3), the second quarter ( 34 μg m−3),and the third quarter (19 μg m−3); PM10 exhibited the same trend: the first quarter (96 μg m−3) > the fourth quarter (94 μg m−3) > the second quarter (87 μg m−3) > the third quarter (46 μg m−3). Table 2 summarizes the quarterly and annual average concentrations of PM2.5 and PM10 observed over different large cities in China. The results show that the quarterly and annual PM concentrations in Changchun are much higher than those in other cities except Beijing, demonstrating the severity of PM pollution in Changchun, particularly in the first quarter and the fourth quarter.
From Table 2, we can see the PM2.5/PM10 ratios were relatively high during the first quarter and the fourth quarter, with the maximum value of 0.81 occurring in January, corresponding to the residential heating period. The value was at the medium level compared with the cities in the Table 2 (Shenzhen: 0.71, Xiamen :0.68, Beijing: 0.90, Shanghai: 0.90, Guangzhou: 0.71). In residential heating period, the burning of fossil fuels produced a large number of precursors, and the proportion of PM2.5 increased significantly. The PM2.5/PM10 ratios were relatively small in the second quarter, with the minimum value of 0.27 occurring in May (Figure 2c). The value was very low compared with the cities in the Table 2 (Shenzhen: 0.55, Xiamen: 0.50, Beijing: 0.46, Shanghai: 0.51, Guangzhou: 0.51). In the second quarter, frequent dust weather and strong winds resulted in the frequent release of coarse particles and the increased proportion of PM10 in the atmospheric.

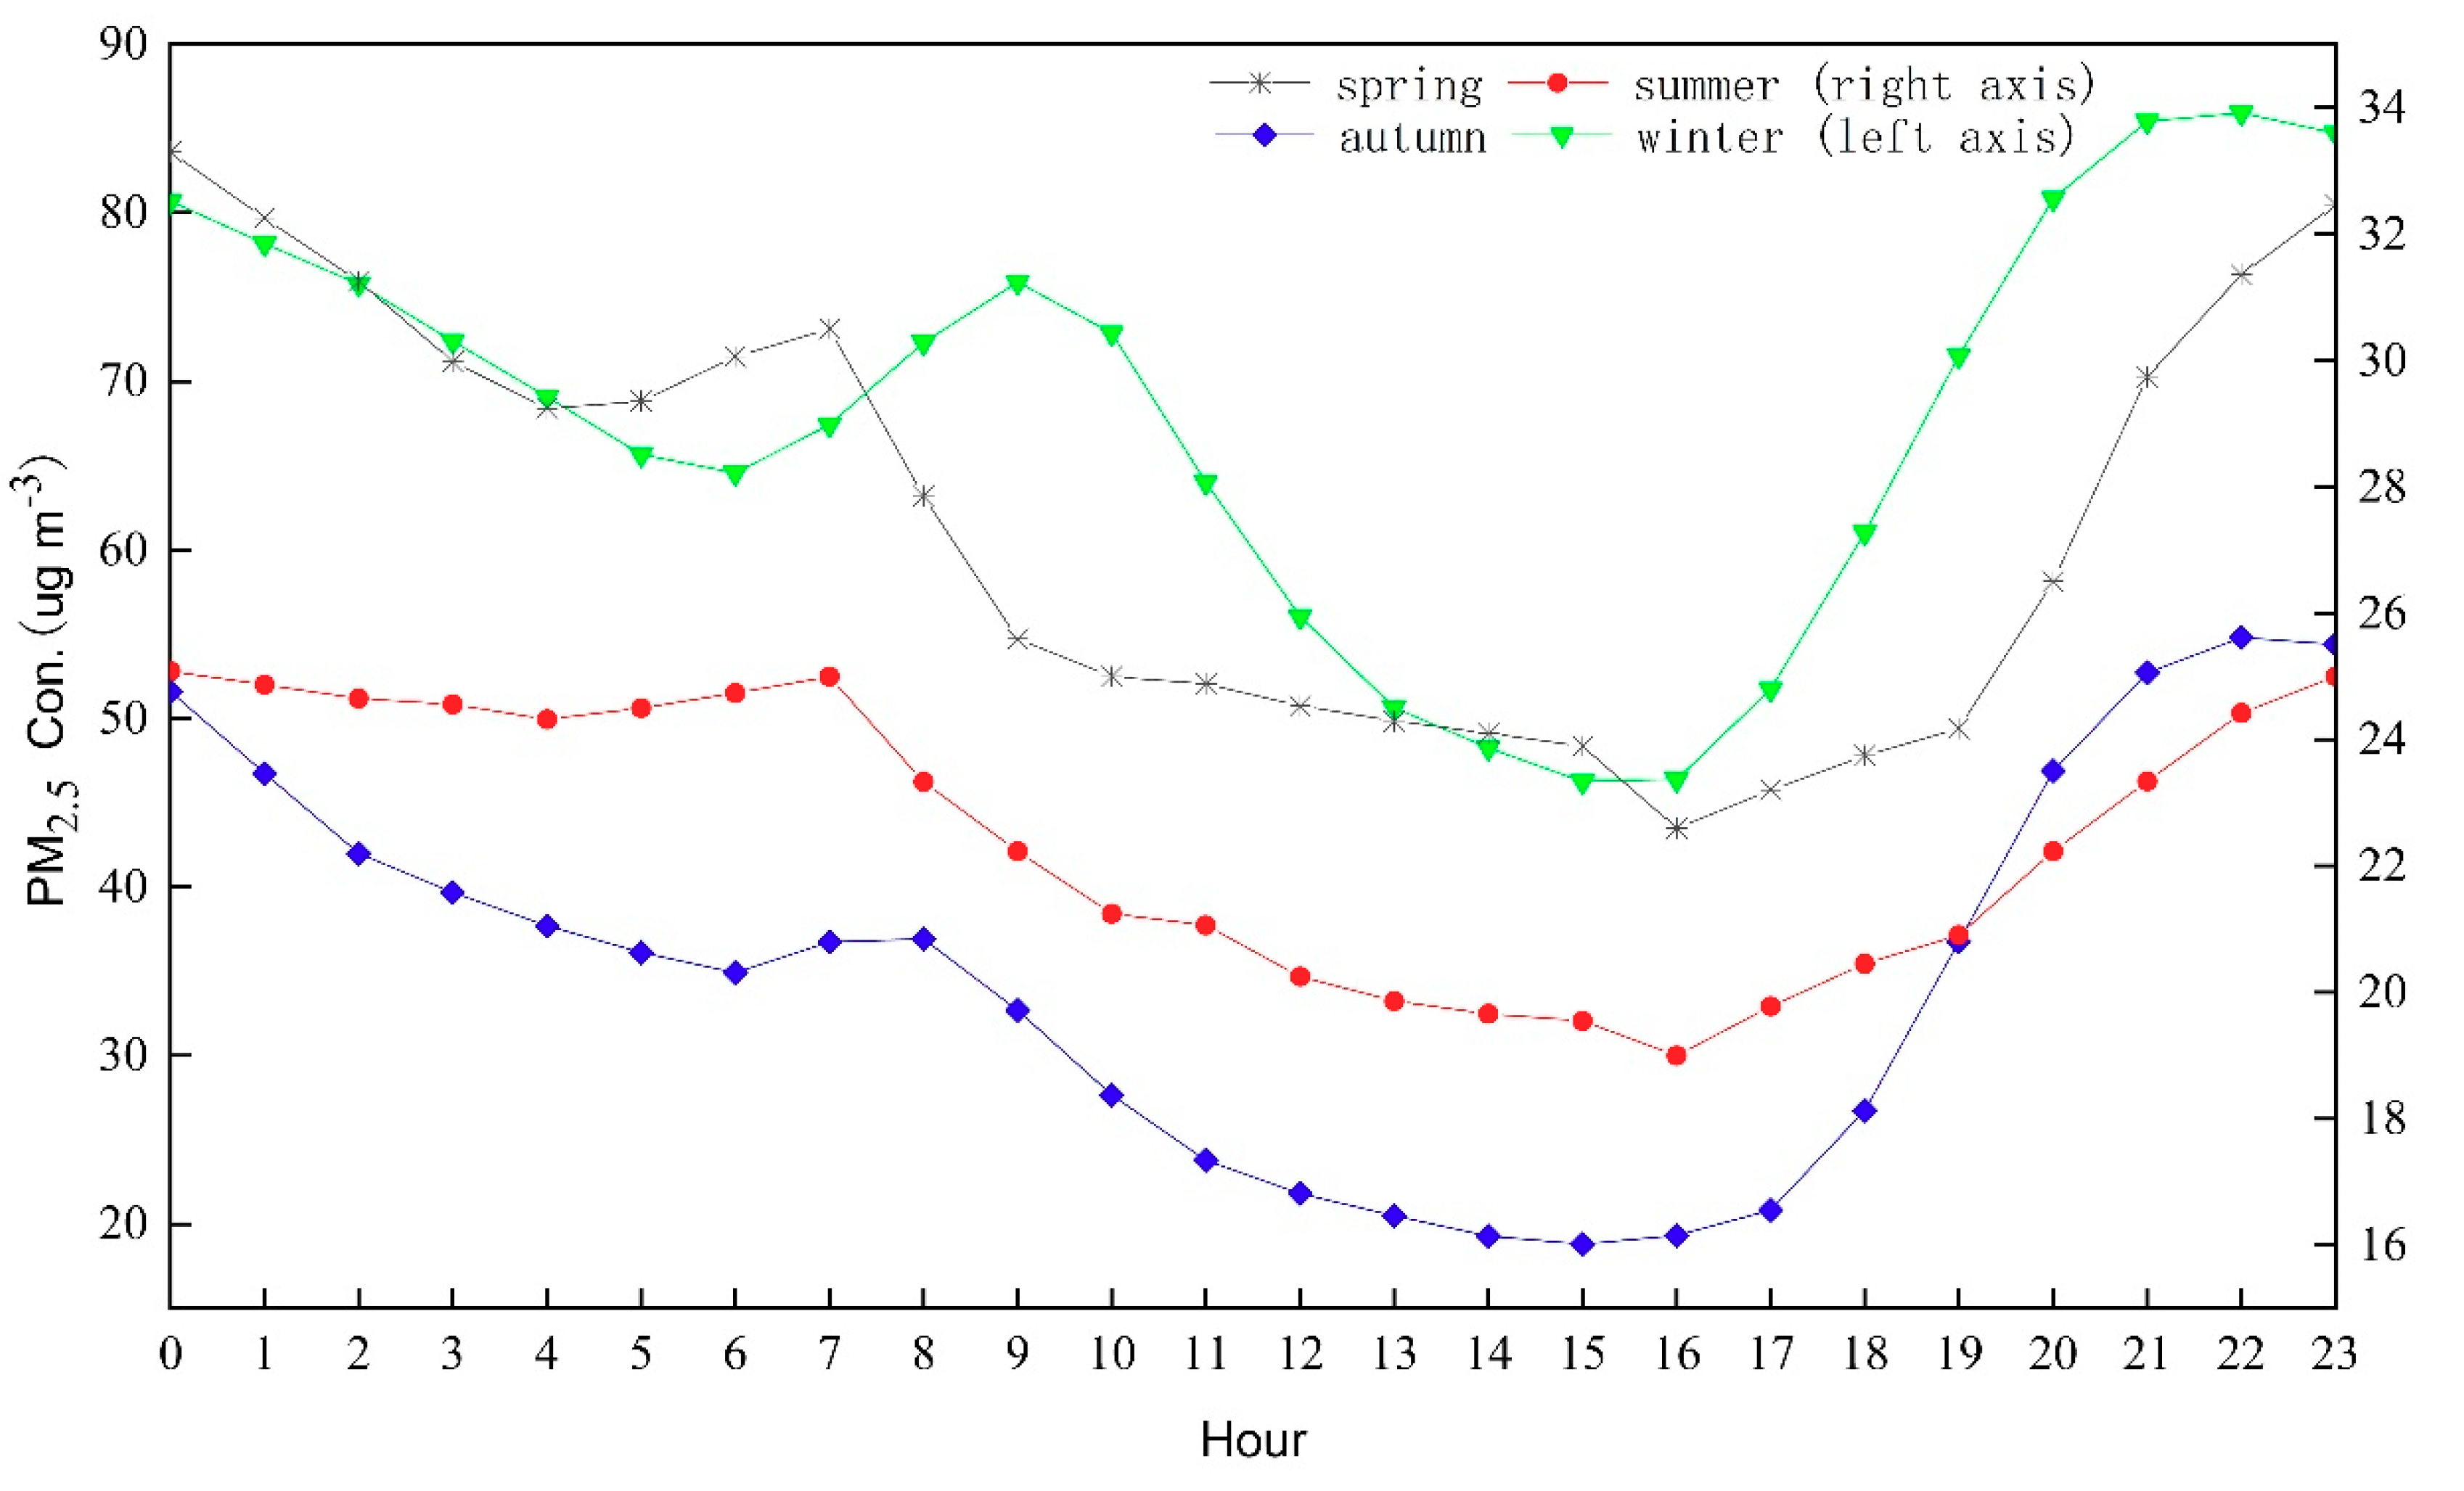
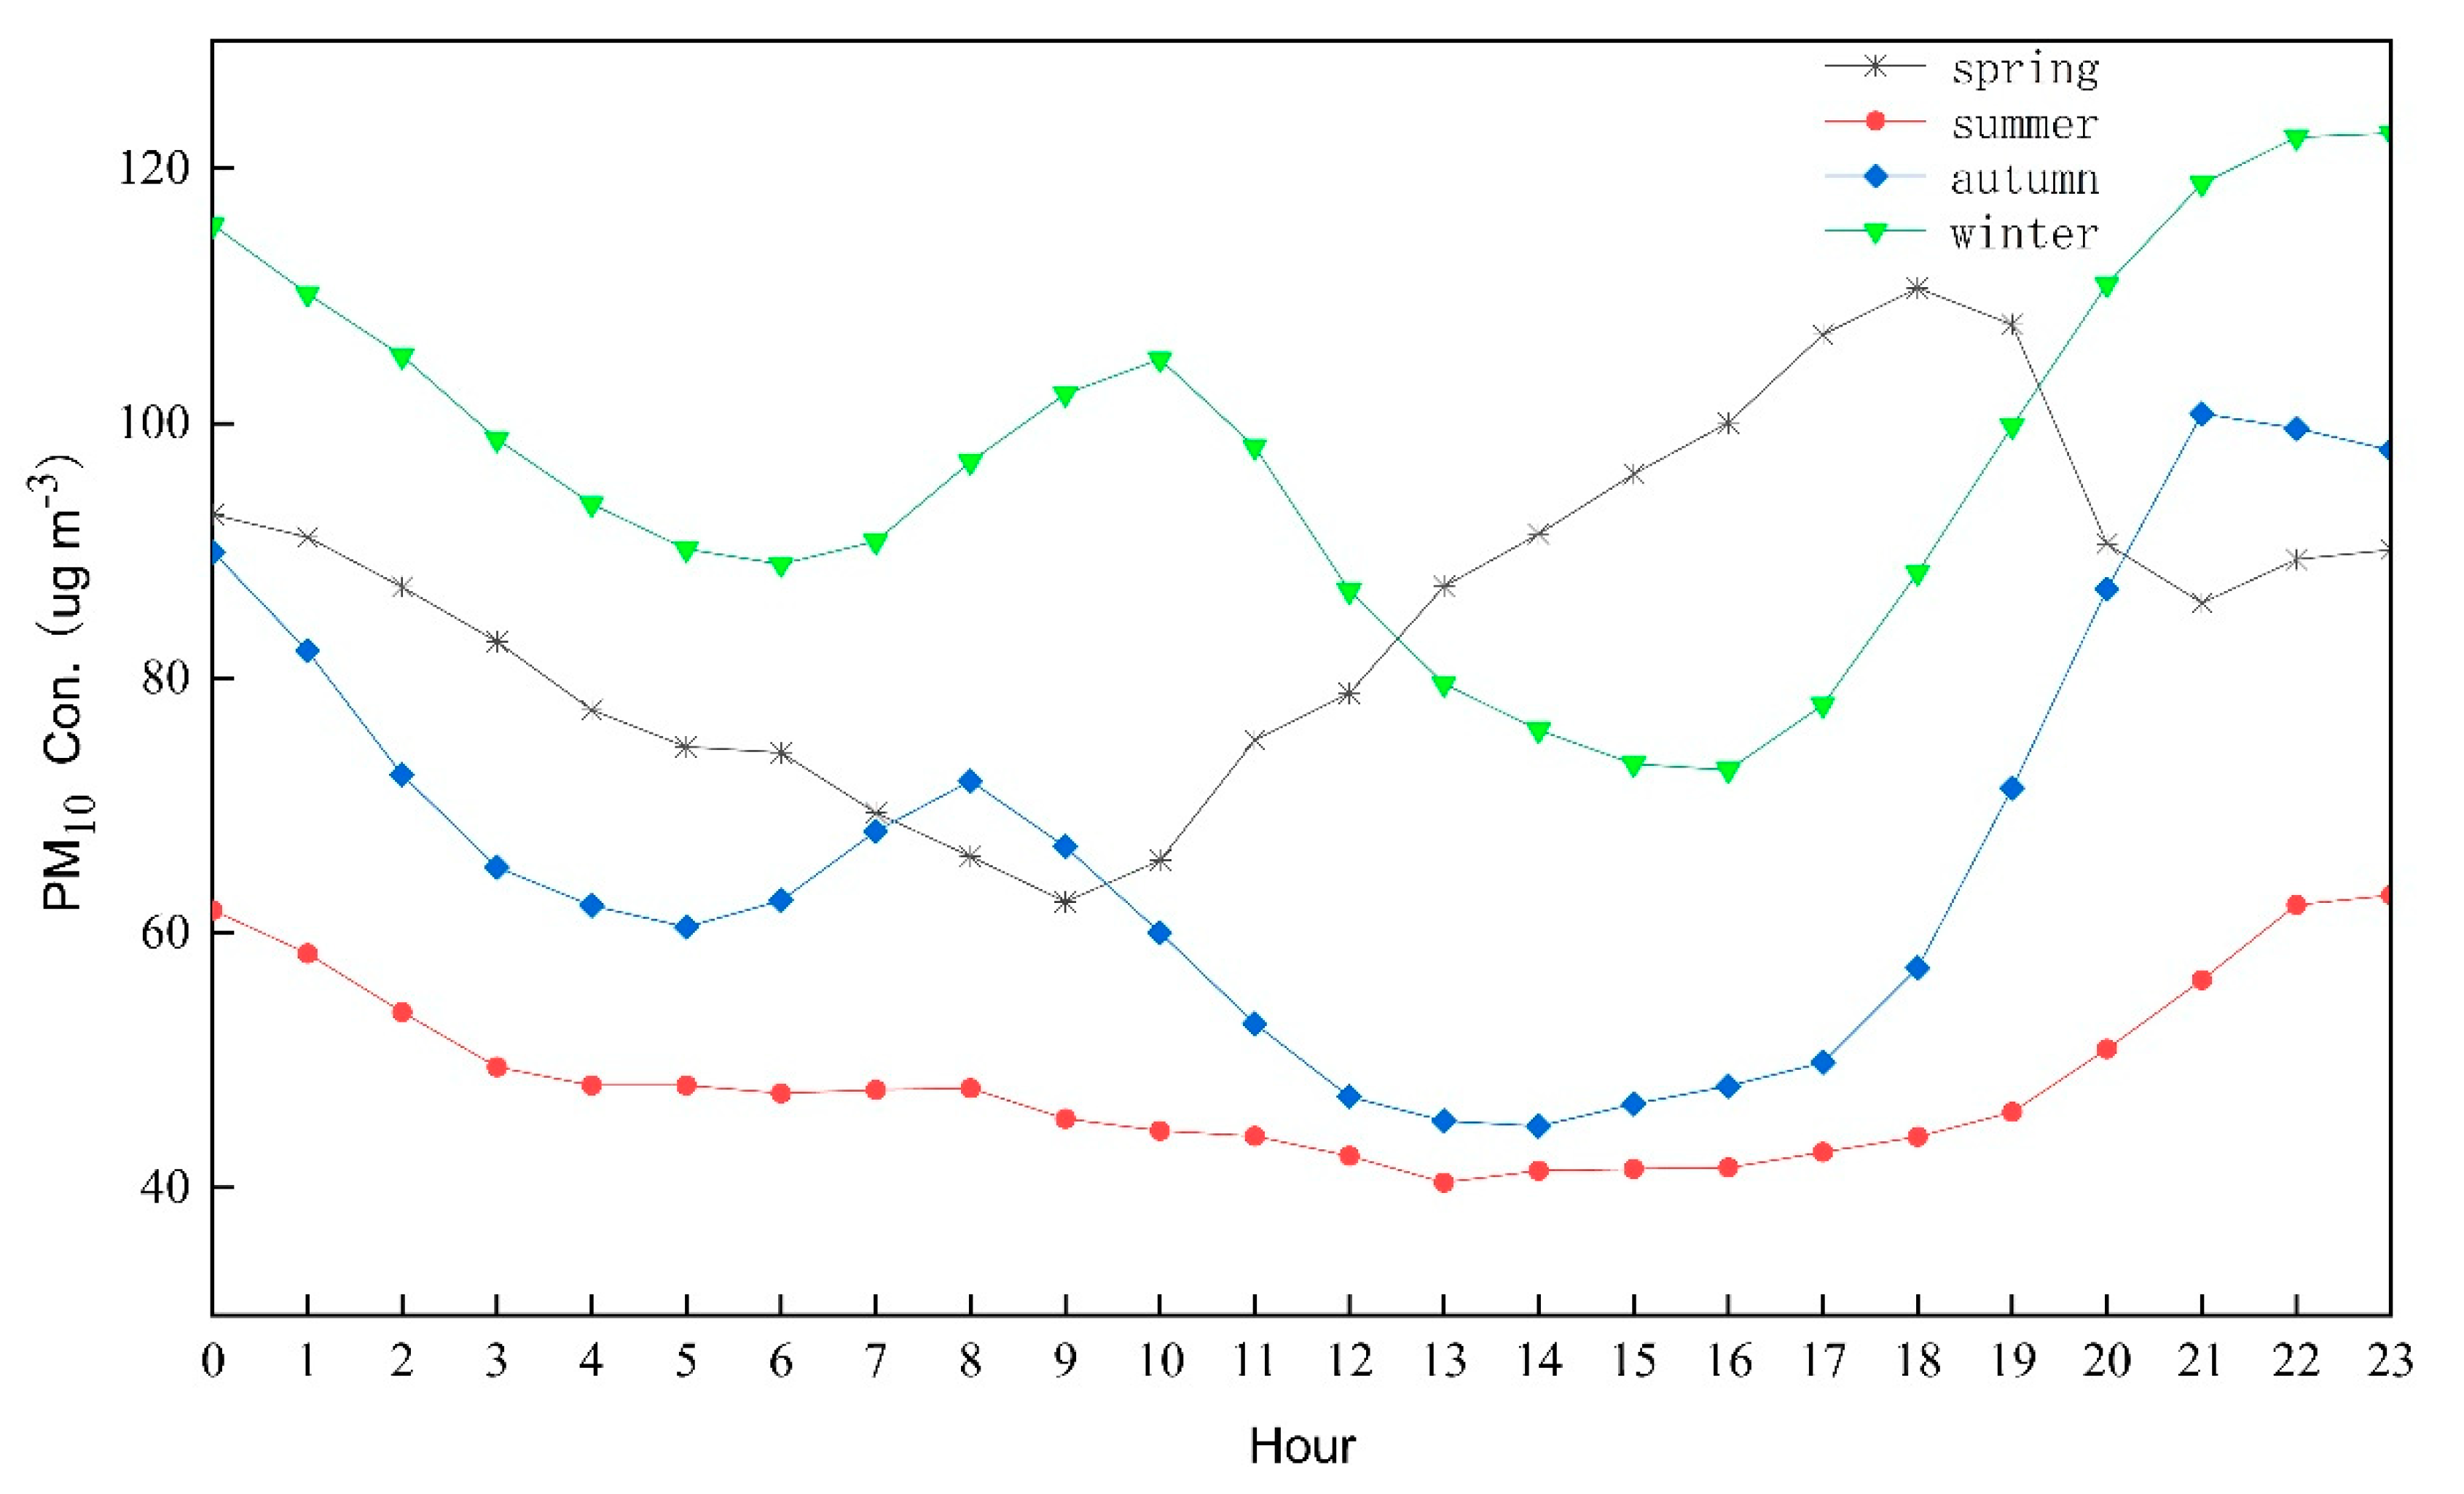
3.1.2. Diurnal Variation in PM Concentrations

According to the seasonal division rules of climate-temperature method, the whole year is divided into four seasons: spring (April 15–June 14), summer (June 15–August 24), autumn (August 25–October 24), winter (January–April 14, October 25–December 31).
Figure 3 shows the diurnal variation in PM2.5 concentrations of Changchun and the PM2.5 profiles exhibited two peaks in all seasons. The first peak occurred in the period 07:00–09:00 Chinese Standard Time (CST), which was caused by the enhanced anthropogenic activity during rush hour and stability of the atmosphere [39]. After the peak, the concentration dropped until around 16:00 CST. The minimum of PM2.5 concentrations in a day was found at 16:00 CST because the high wind speed and boundary layer height lead to better dispersion and dilution [40]. After 16:00 CST, the arrival of the evening rush hour and the prevailing barbecue at summer night, the frequent straw burning in autumn evening and the night coal heating in winter, caused the PM2.5 concentration to rise again at night and produced the nighttime peak around 22:00–23:00 CST. Moreover, PM2.5 concentrations were still relatively high from night to early morning, which was most likely caused by cargo transportation across cities. According to the results of the target source apportionment of PM2.5 in the atmosphere of Changchun from our research group, vehicle emission is a major pollution source of PM2.5 in Changchun, with a contribution rate of 20.96%. Emission factors of heavy-duty vehicles are six times than those from light-duty vehicles and these vehicles are allowed only during nighttime [41].
The pattern of diurnal variation in PM10 concentration was similar to PM2.5, as shown in Figure 4, which shows a bimodal pattern except spring. The first peak occurred in 08:00–10:00 CST and the secondary peak occurred in 21:00–23:00 CST. The minimum of PM10 concentration in a day was found in 13:00–15:00 CST because the strong thermal turbulence within the boundary layer in the afternoon favored the emission and vertical transport of dust particles [42]. In spring, PM10 concentrations remained high for most of the day. Sandstorm activity is more frequent in spring of Changchun, which increases the soil dust concentration. With the influence of inversion weather in spring, pollutants gather in the near-surface layer, which results in PM10 concentration increasing.

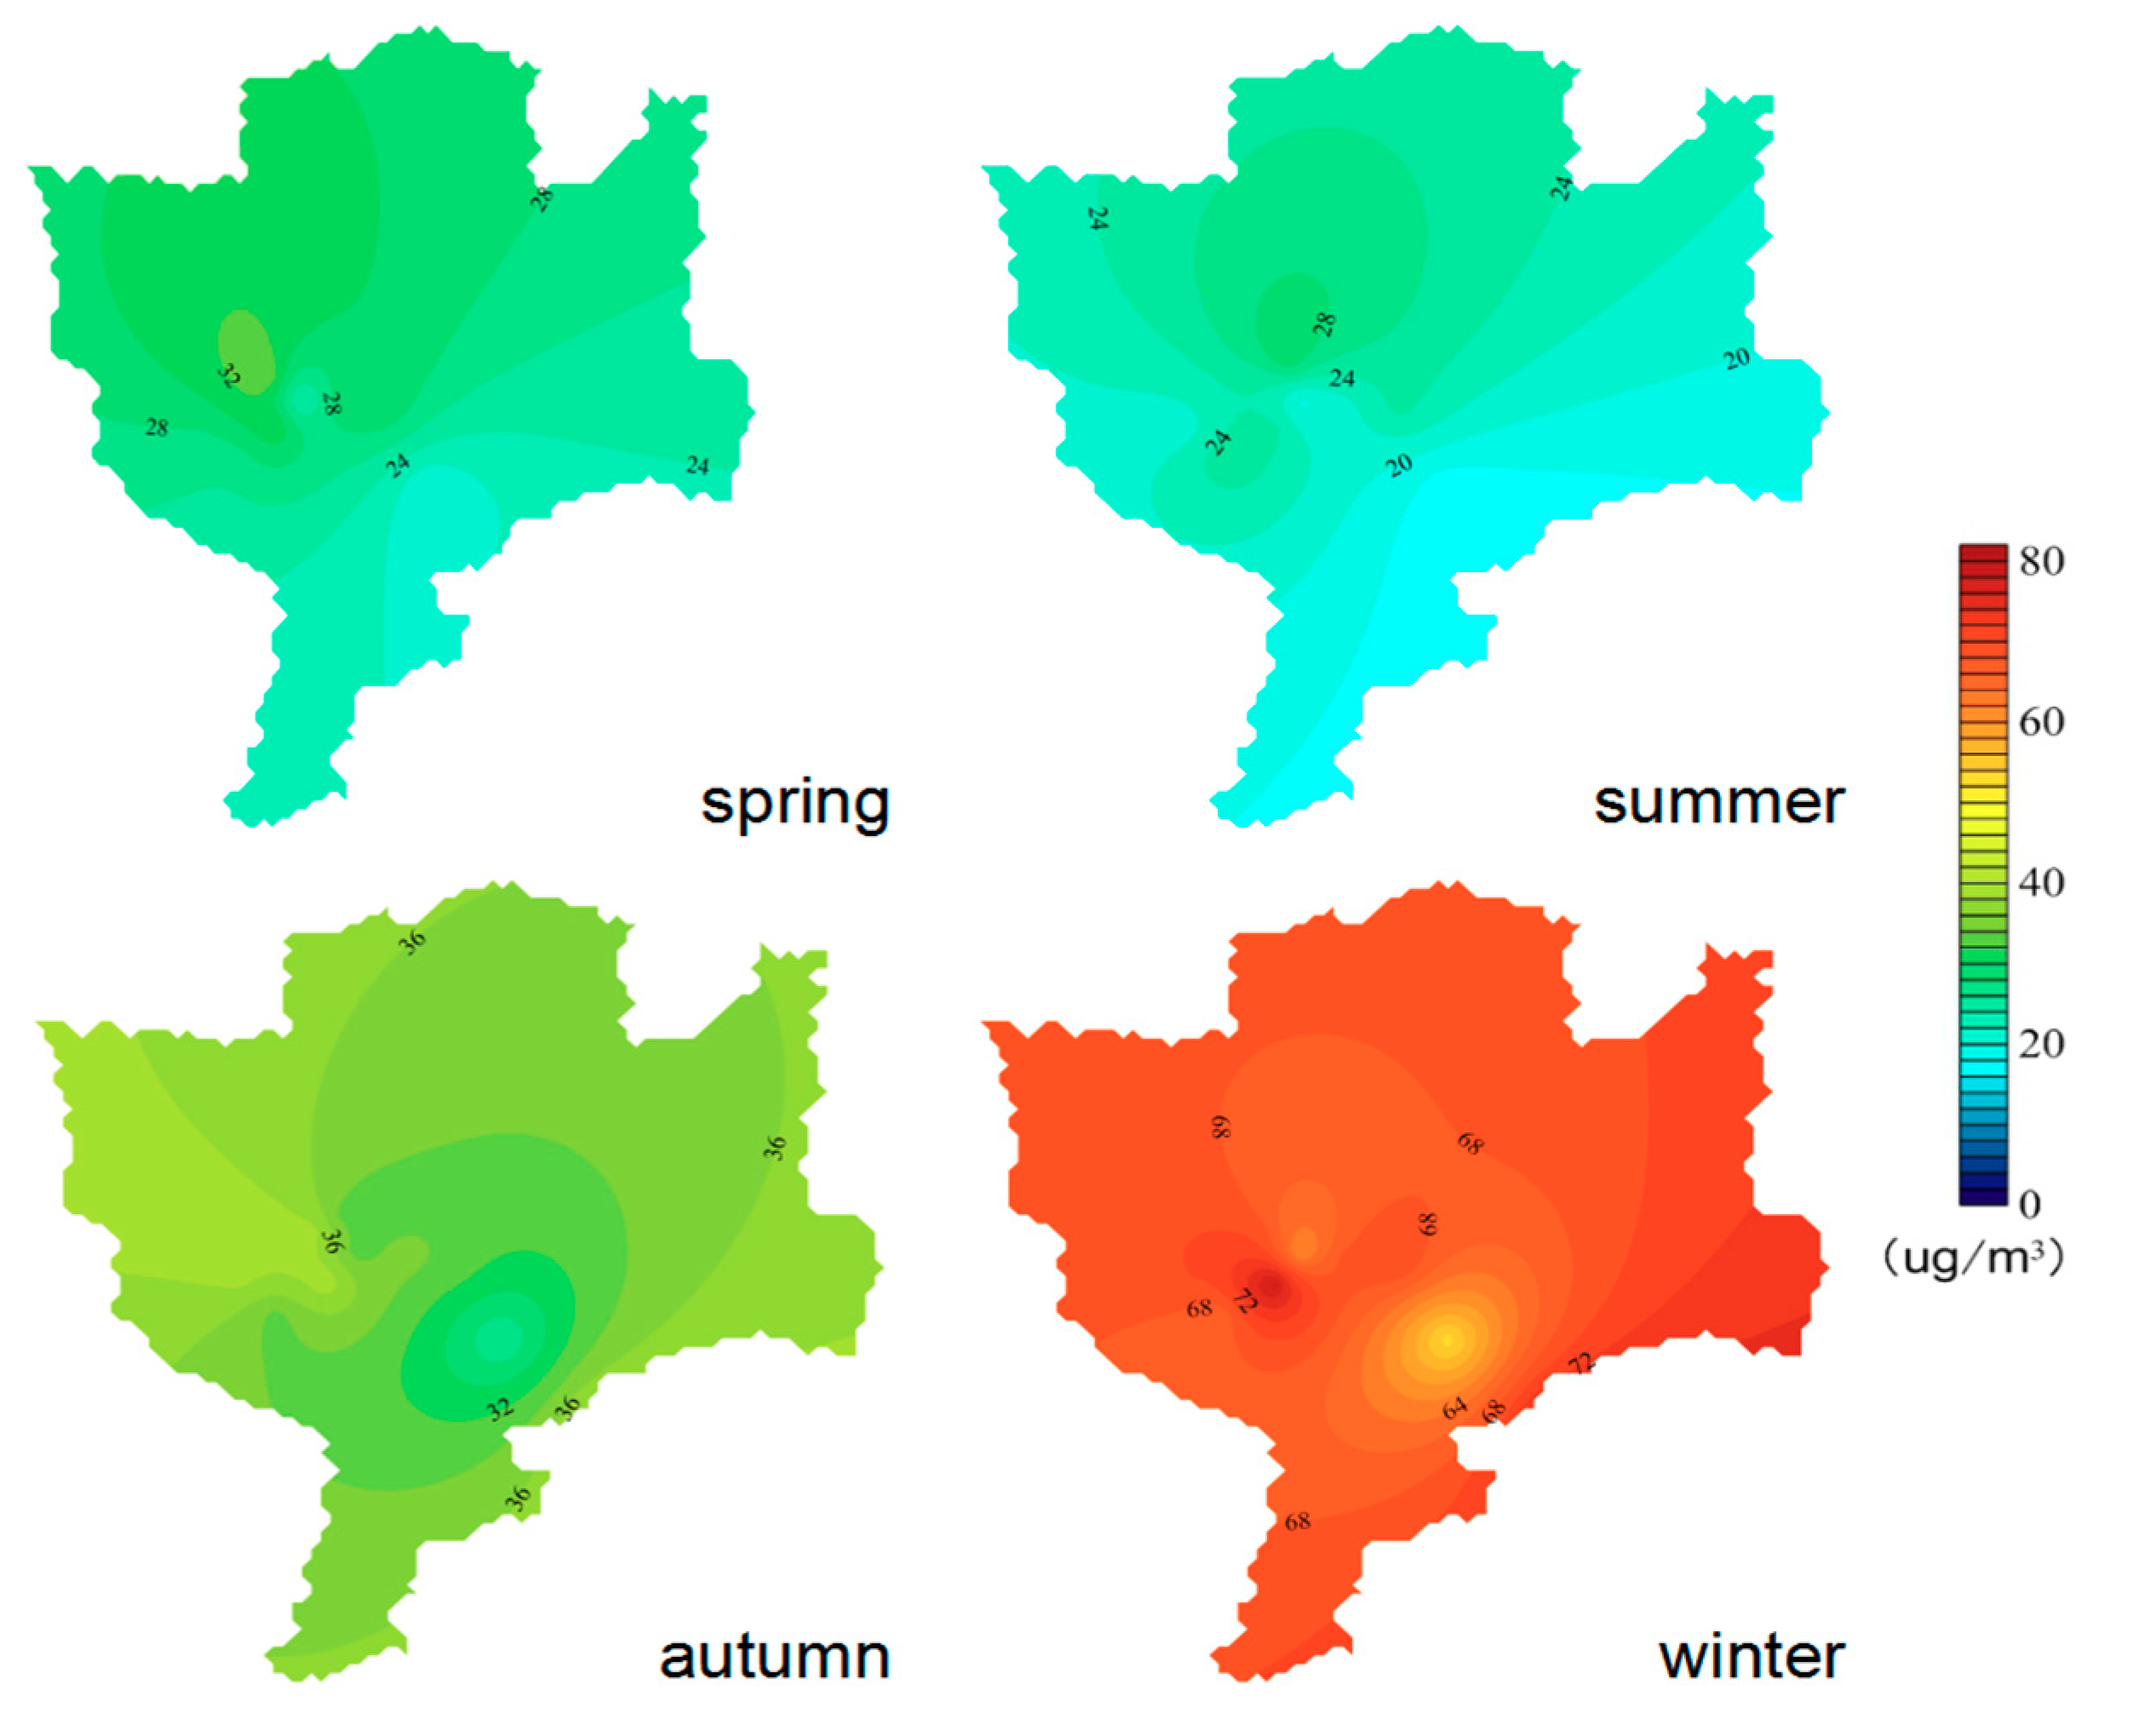
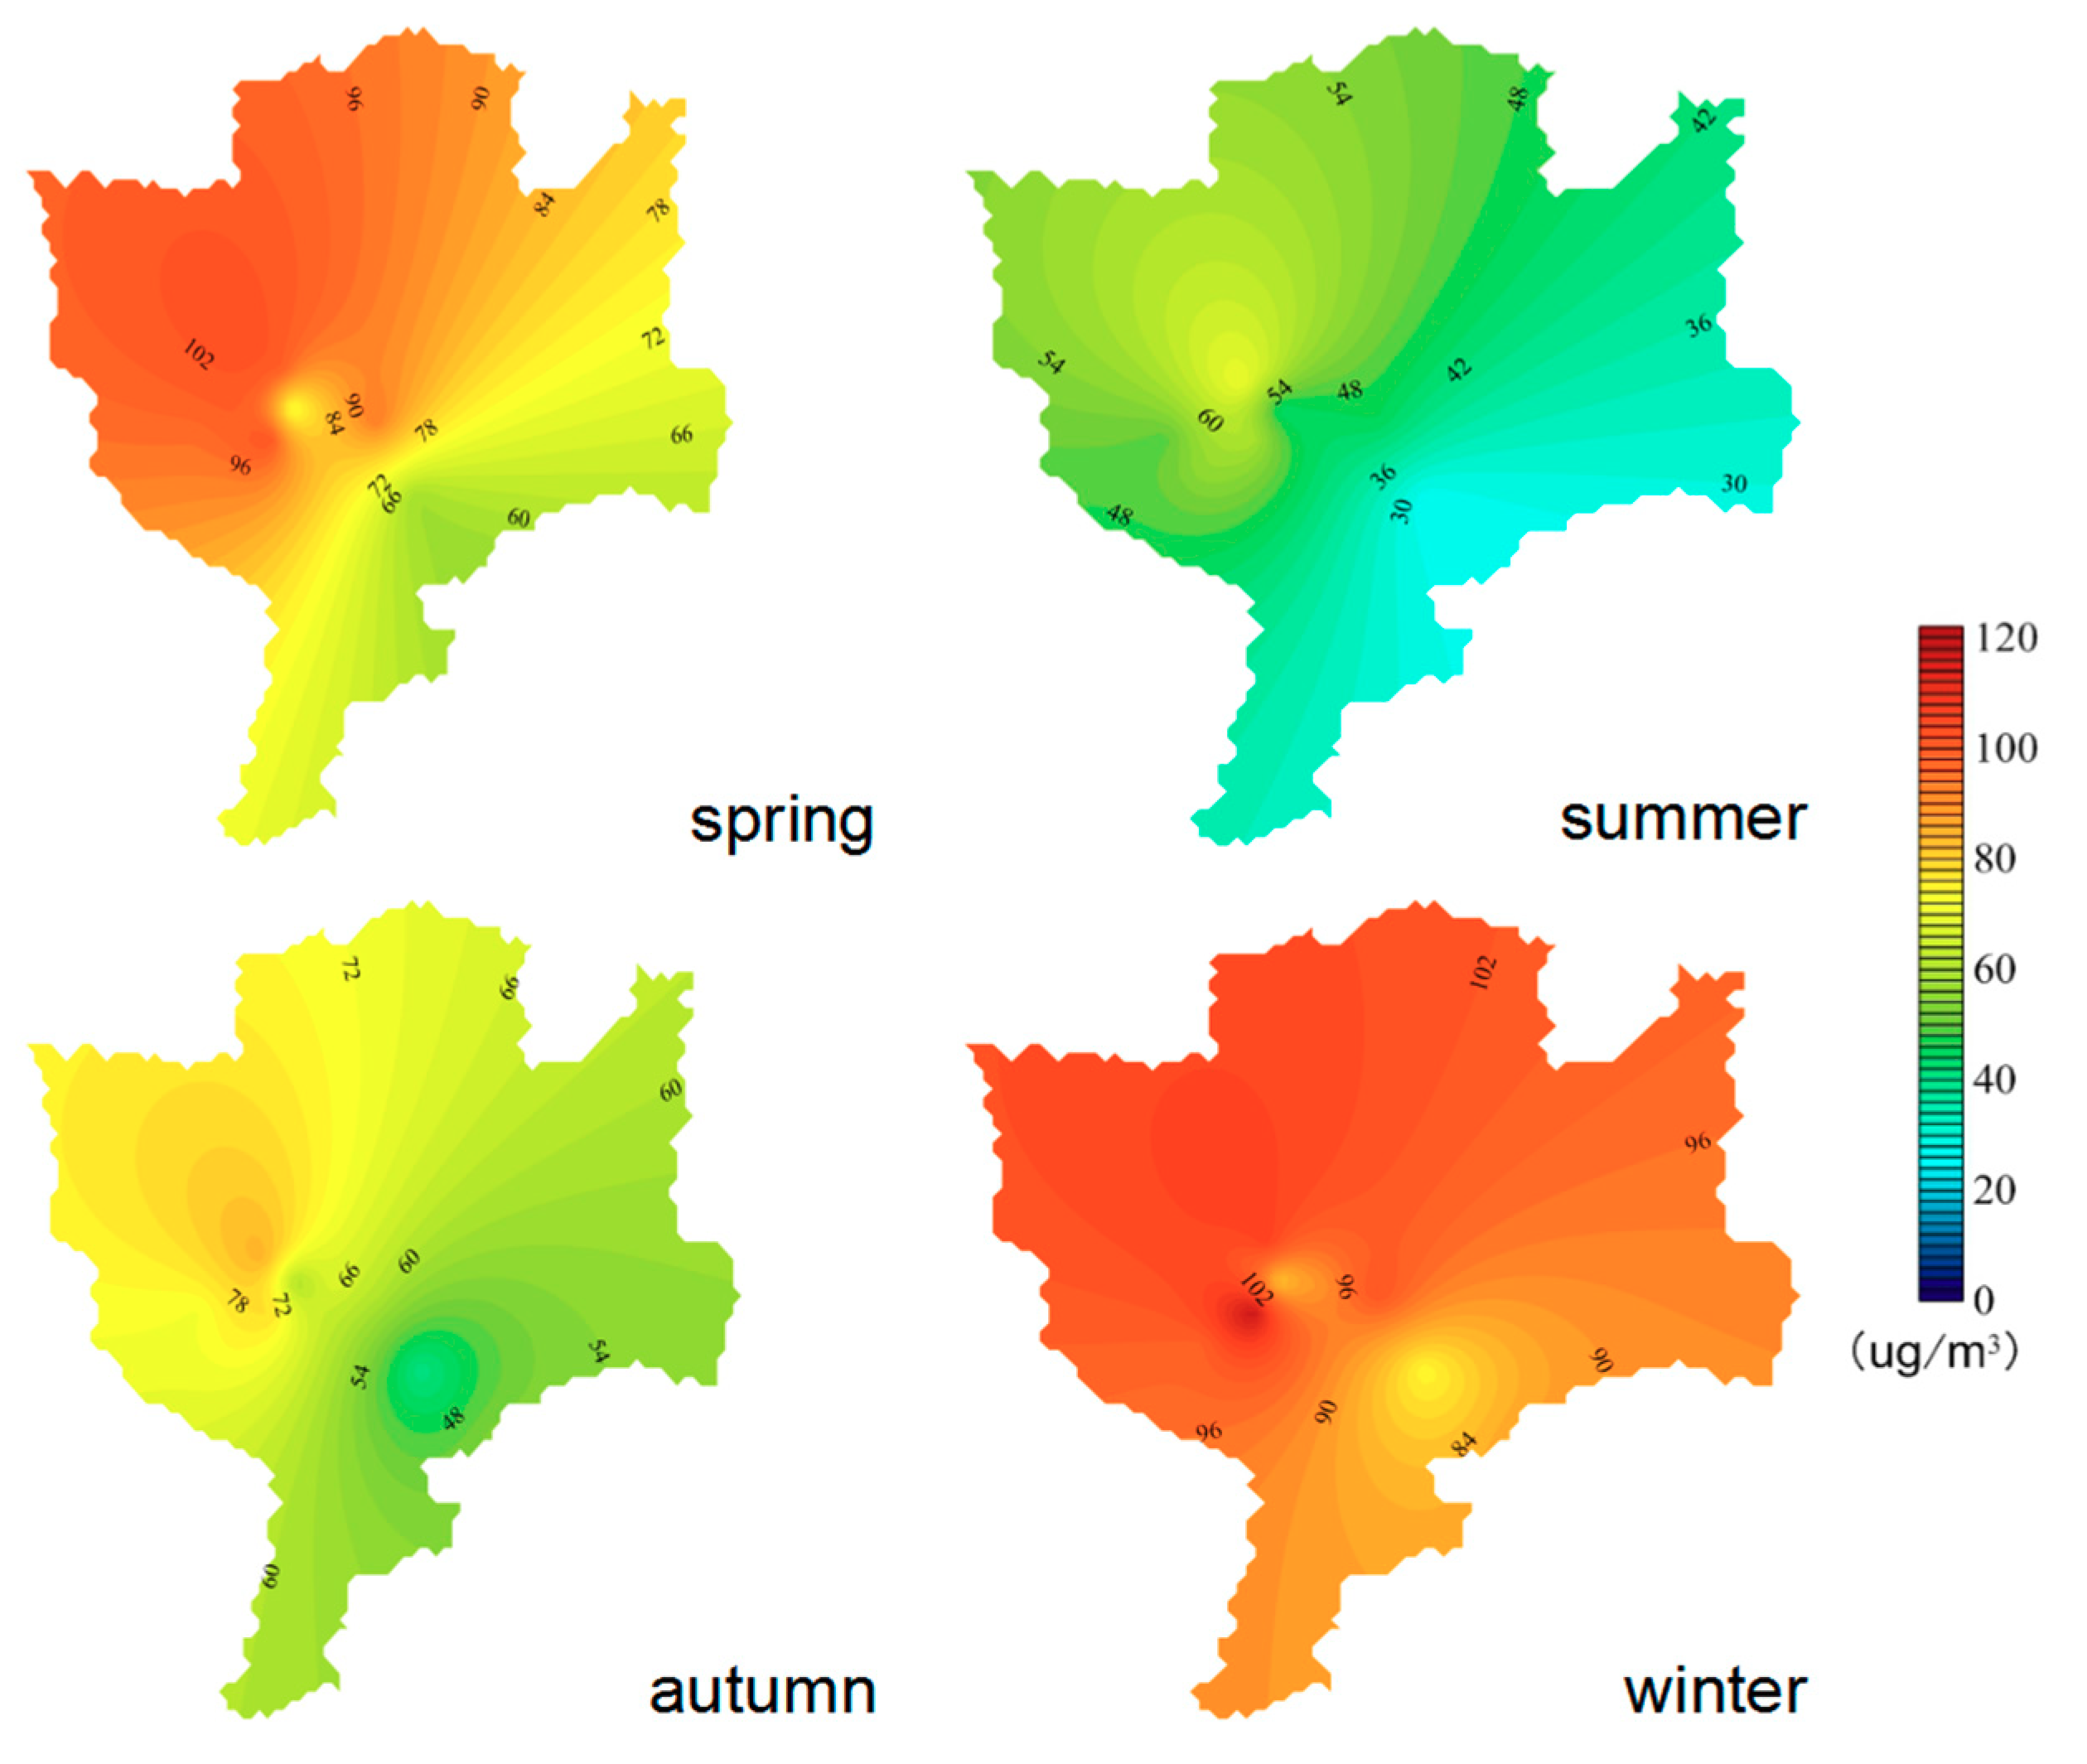
3.2. Spatial Distribution of PM Mass Concentrations

The spatial distribution of the PM2.5 and PM10 concentrations in four seasons of Changchun was obtained by the Kriging interpolation method. Although inadequate site interpolation may lead to inaccurate values, this information could still represent the PM mass concentrations spatial distribution of the city as a whole. The results are shown in Figure 5 and Figure 6. The concentrations of PM2.5 and PM10 in Changchun were both high in winter, but generally low in summer. PM concentrations were higher in the north and west. There was an obvious boundary of high and low PM mass concentrations values between urban (mainly located inside the fourth ring road) and suburban areas. In all seasons except autumn, the PM2.5 concentrations in the central urban area were higher than that in most surrounding areas. This was most likely due to the high contribution from vehicles and more population in the central urban area, combined with the density of high-rise buildings, which result in slower wind speeds and hinder the dispersion of air pollutants. However, the PM2.5 concentrations were higher in the suburbs but lower in the central urban area in autumn, which was related to the open burning of crop residues in the suburbs of Changchun in autumn.
The concentrations of PM10 in Changchun were higher in the northwest but lower in the southeast, which was related to land use types. The southeast area of Changchun has a high forest coverage rate, which reduces the soil dust concentration. With urban development, the area for land construction in suburban areas has had an obvious increase during recent years. Many construction sites in the northern suburban generate the construction dust and increase the concentration of PM by strong winds. In addition, the results of the backward trajectory indicate that the northeastern region of Inner Mongolia is considered as the main source of PM10 pollution in Changchun. A lot of coarse sand/dust particles can be transported to the northwest of Changchun by the northwesterly flows, resulting in high PM10 concentration in the northwest region, especially in spring.
The distribution of PM in Changchun basically showed higher concentrations in the west and north. The Kuancheng district is located in the north of Changchun and the Luyuan district is located in the west of Changchun. The Luyuan district and Kuancheng district are the two districts with the largest annual coal consumption in the main urban area of Changchun, with 4,483,731.00 and 2,711,861.00 tons, respectively. Particulate matter formed by coal combustion has a great influence on PM concentration of Changchun. Meanwhile, there was a region in the southeast of Changchun where PM concentrations were very low in the whole year. This is because the area is close to Jingyuetan scenic spot, which has high vegetation coverage, low traffic volume and no pollution sources nearby.

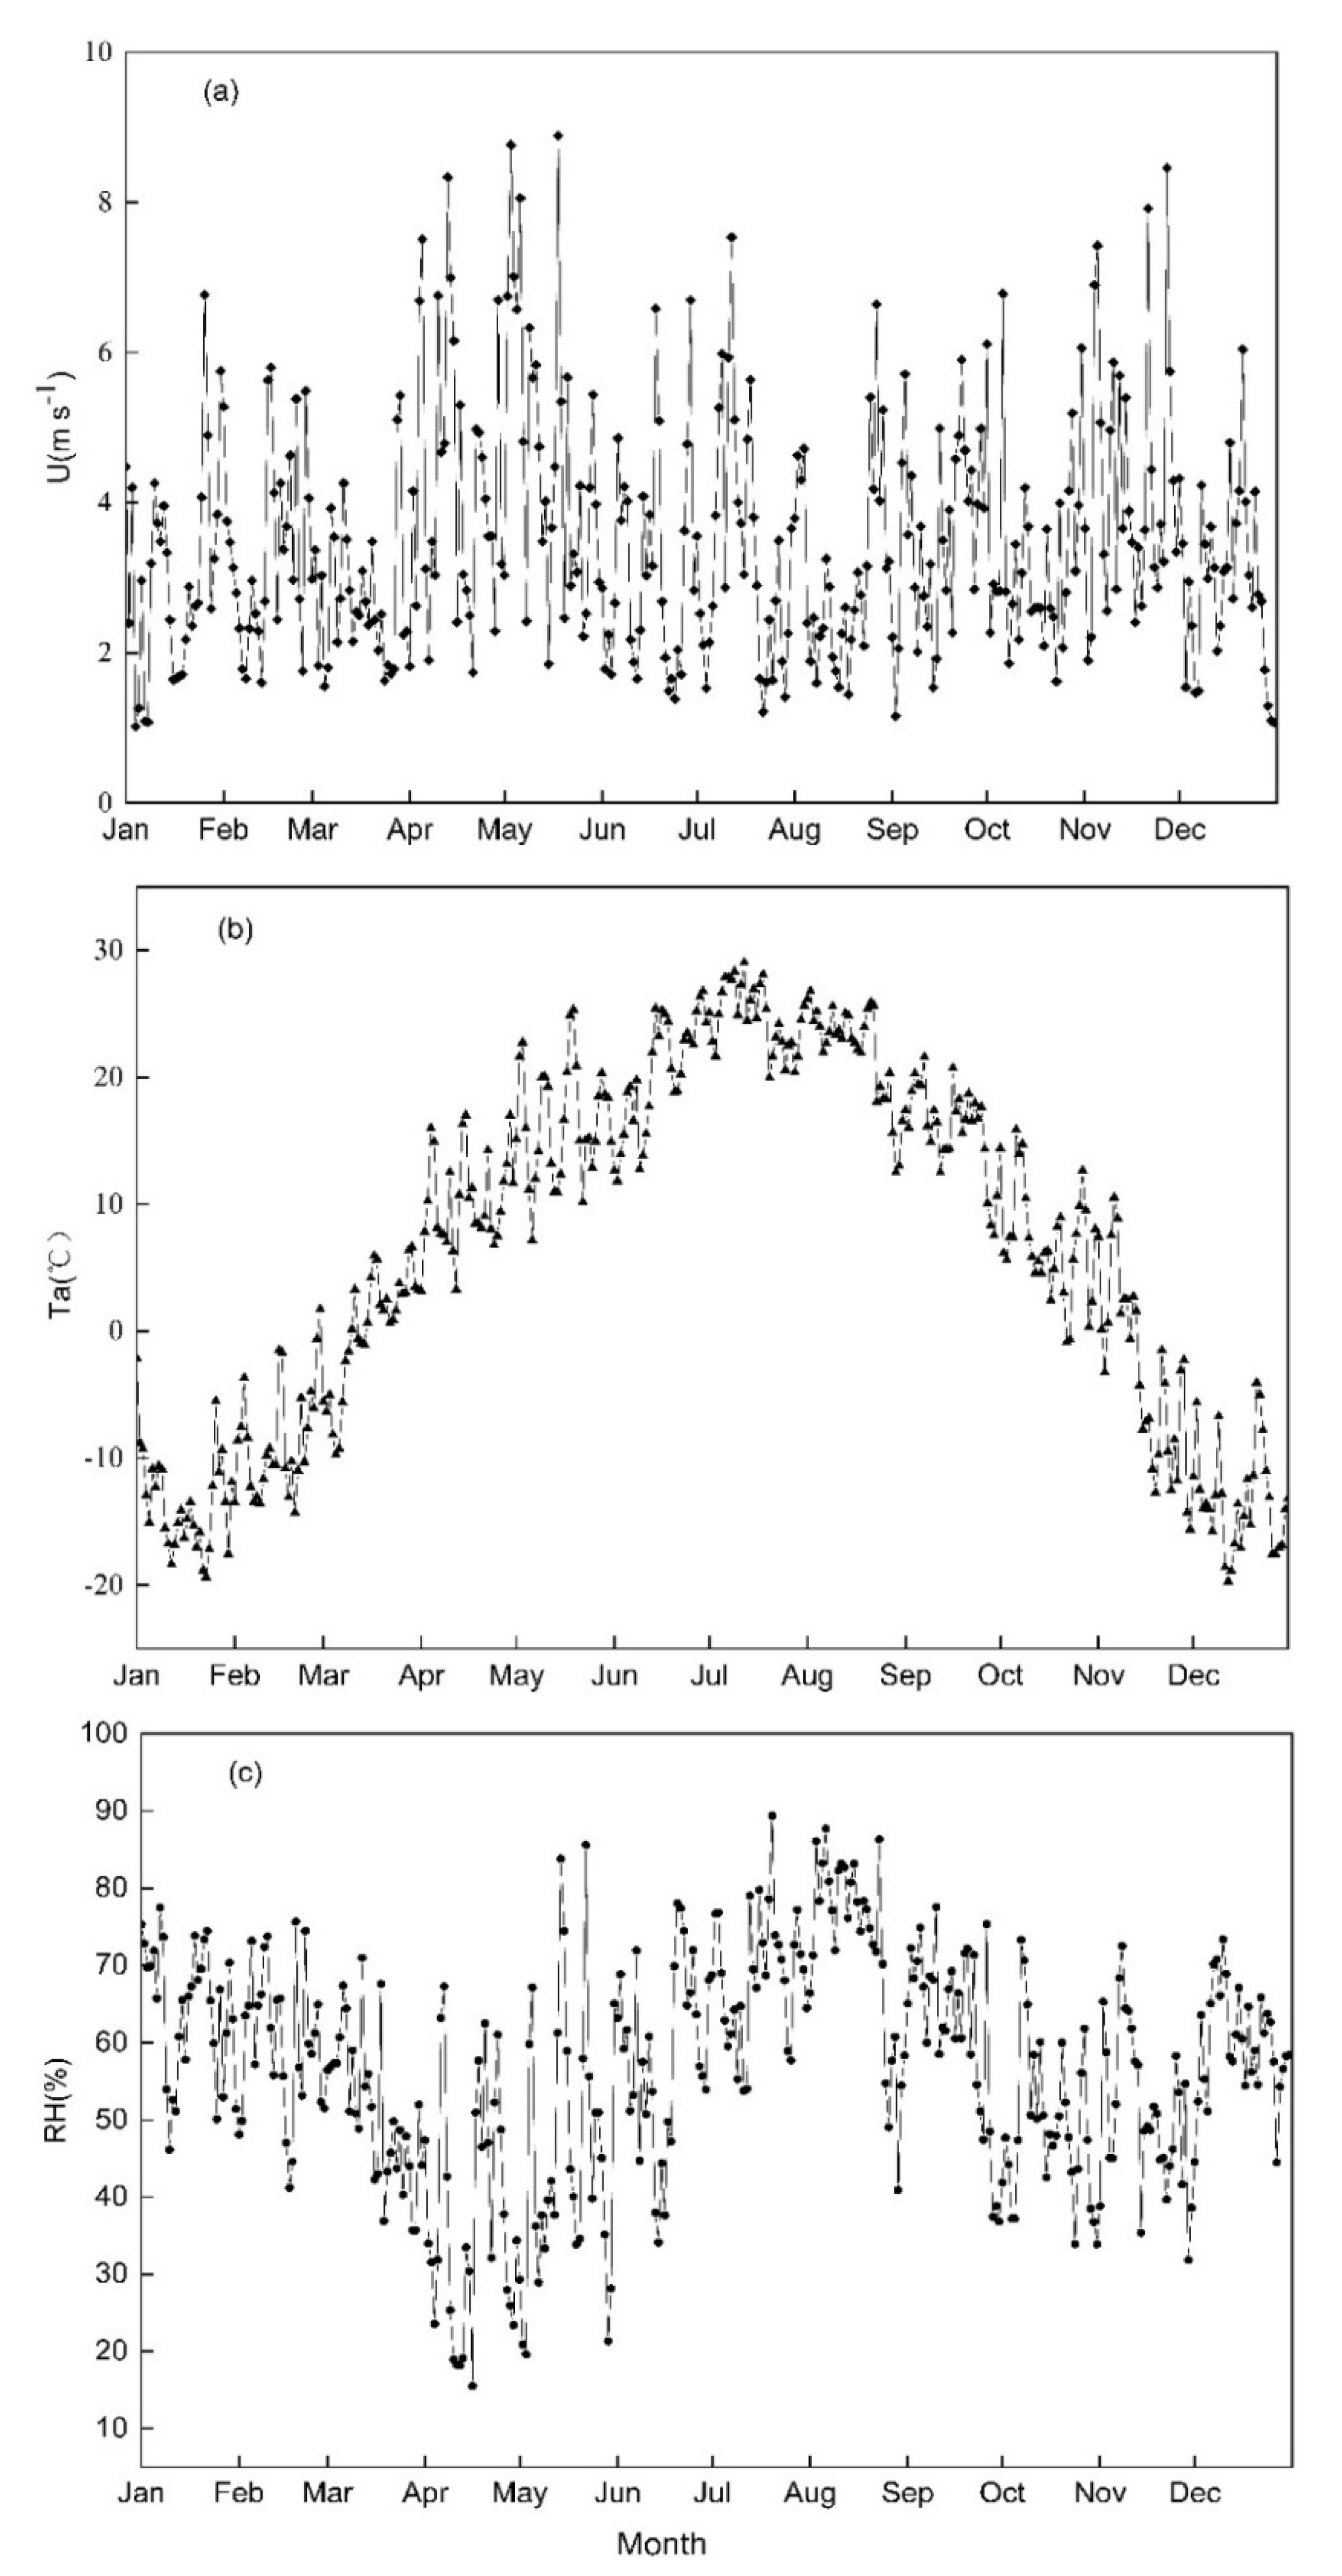
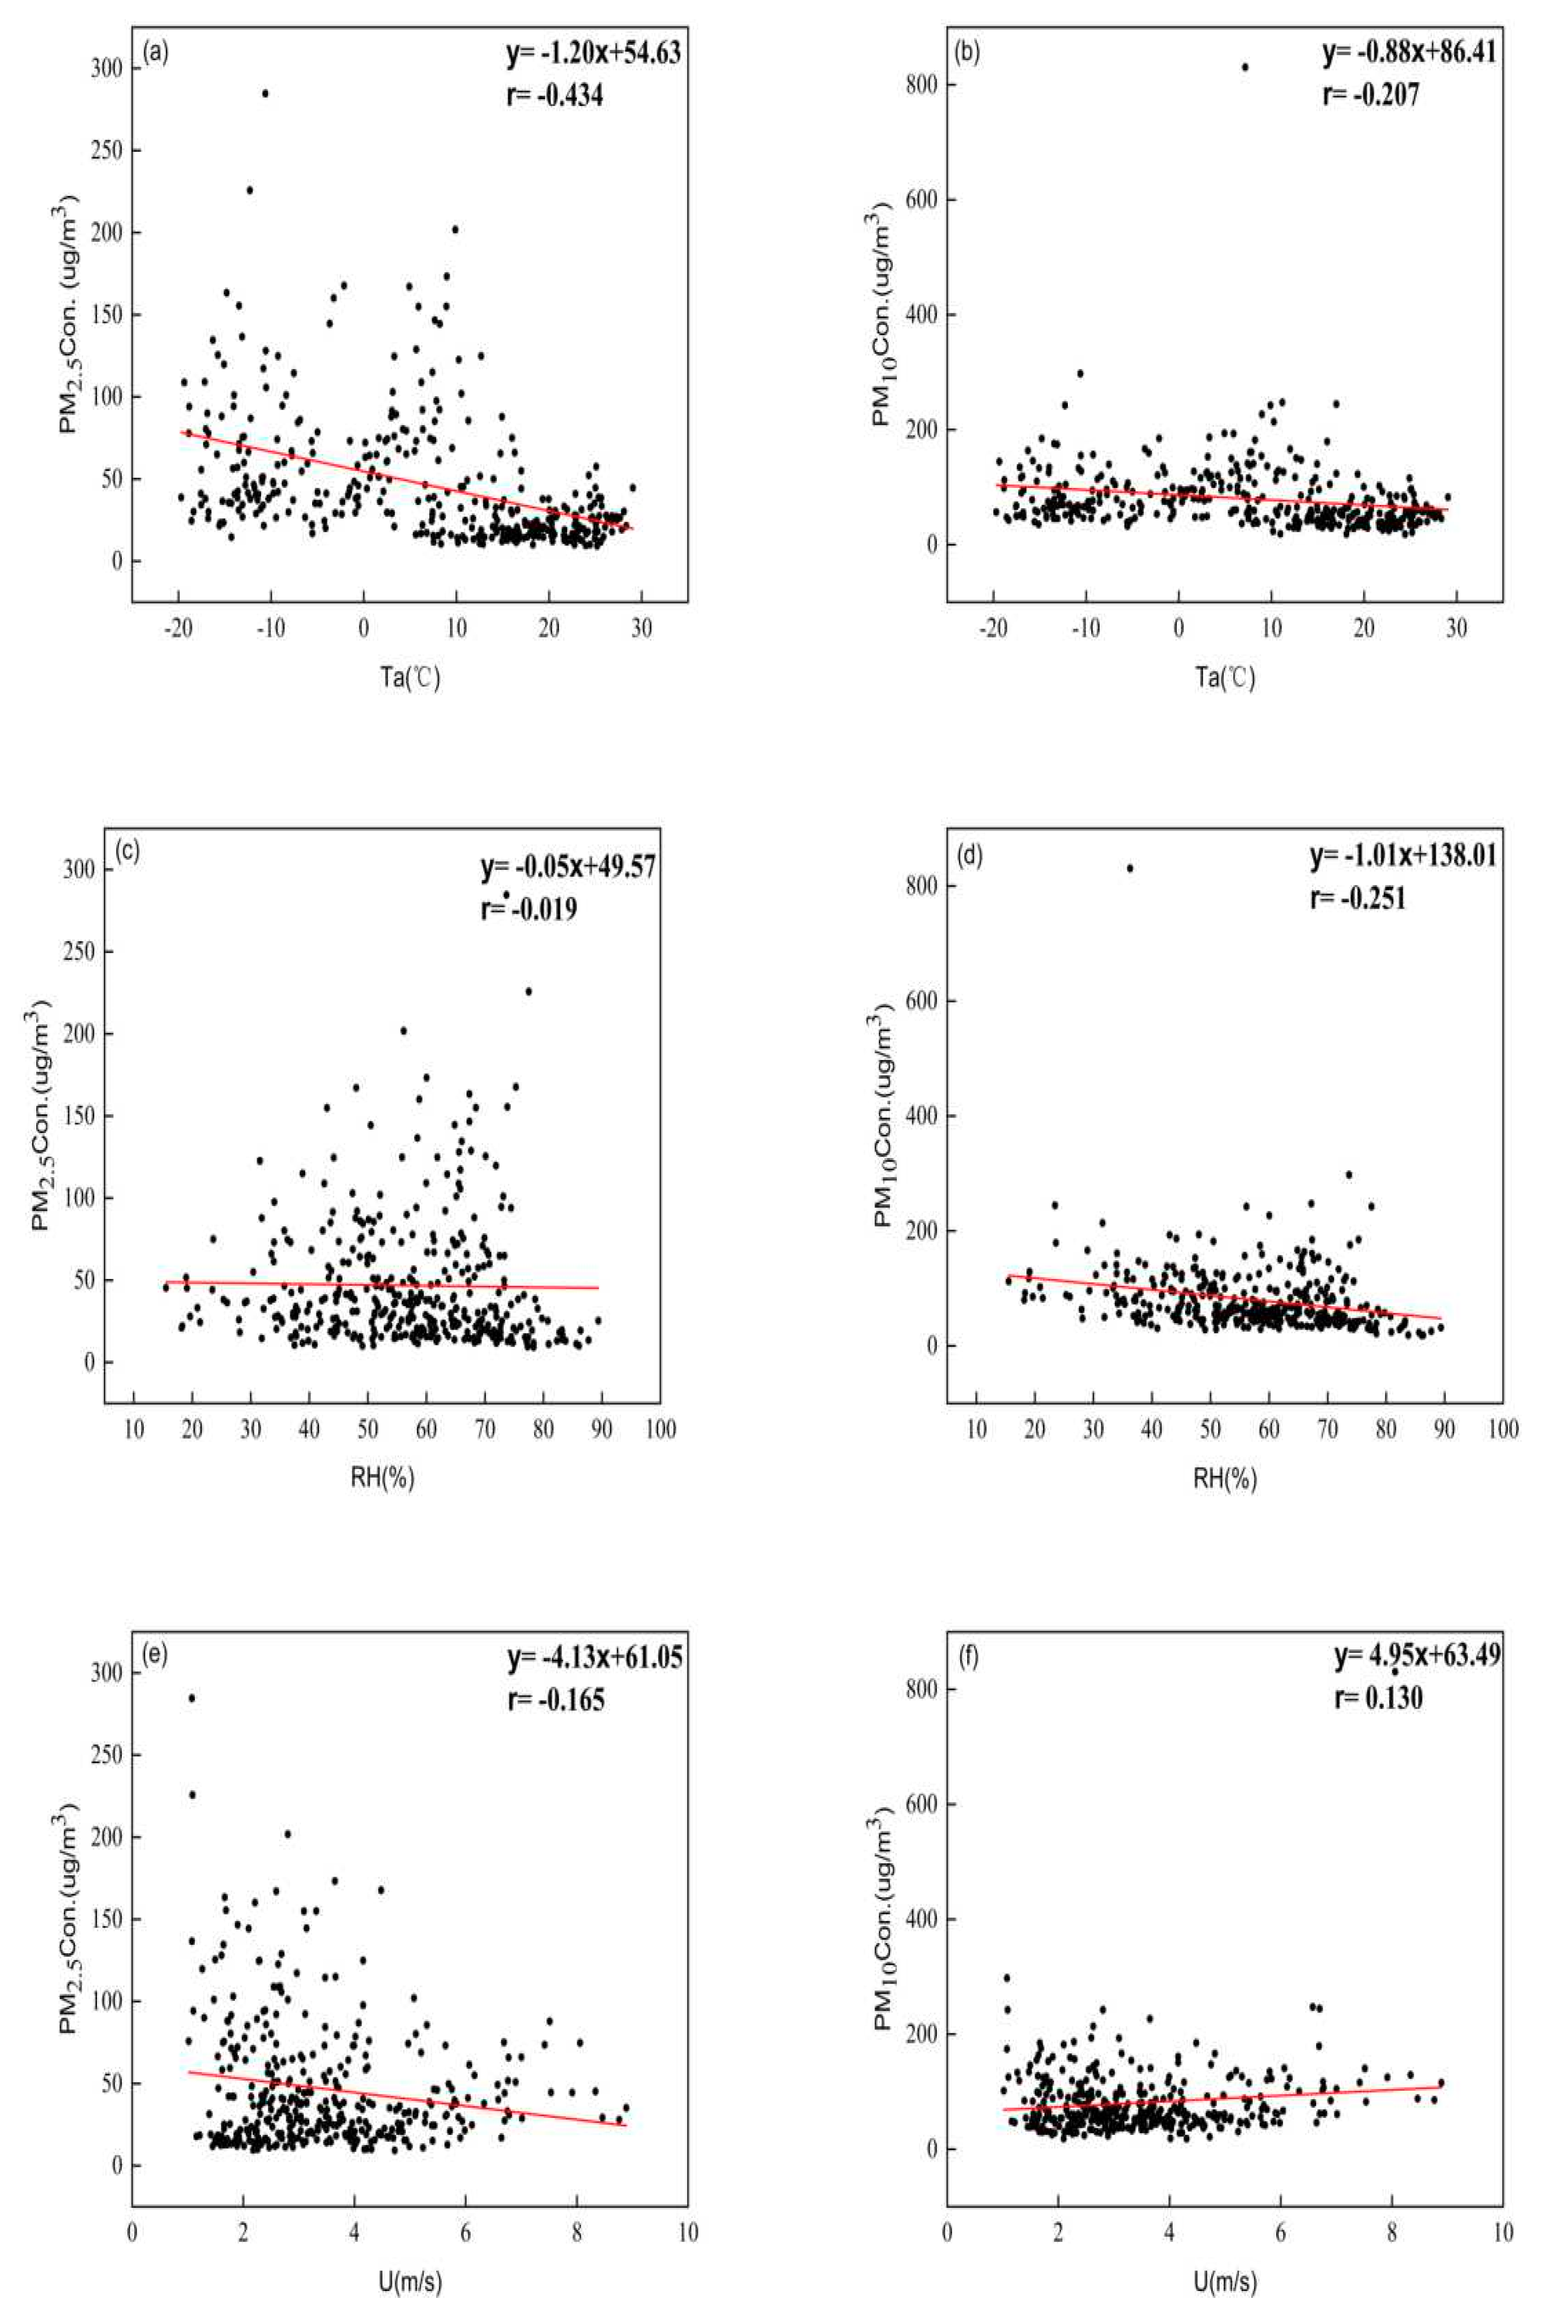
3.3. Relationship between PM Concentrations and Some Meteorological Parameters

PM mass concentration is closely related to meteorological parameters, which will affect the diffusion, deposition and dilution of PM. Figure 7 showed the daily mean changes of wind speed, temperature and relative humidity during the study period. The daily mean wind speed was 3.46 m s−1. The daily mean temperature ranged from −13.50 °C (January) to 24.74 °C (July) (Figure 7b) and the daily mean values of relative humidity varied from 16% to 89% (Figure 7c). To understand the parameters affecting PM, we calculated the spearman correlation between the average daily concentration of PM and meteorological parameters, as shown in Figure 8 and Table 3.
Table 3 showed that PM concentrations were negatively correlated with relative humidity. Particulate matter easily absorbs moisture and settles when relative humidity is high, and there are precipitation events on most days of high relative humidity. The rainfall scouring process significantly reduced the mass concentration of particulate matter [43]. There was a negative relationship between PM concentrations and temperature. High temperatures may lead to the efficient vertical dispersion of pollutants, which results in an inverse relationship between temperature and PM concentrations [44]. PM2.5 concentrations were negatively correlated with wind speed but PM10 concentrations were positively correlated with wind speed. With the increase of wind speed, the horizontal dispersion ability of pollutants increases, which reduces the mass concentration of PM2.5 [45]. PM10 is mainly distributed near the ground because of its large particle size. Strong winds are more likely to cause secondary road dust from the ground surface [46].

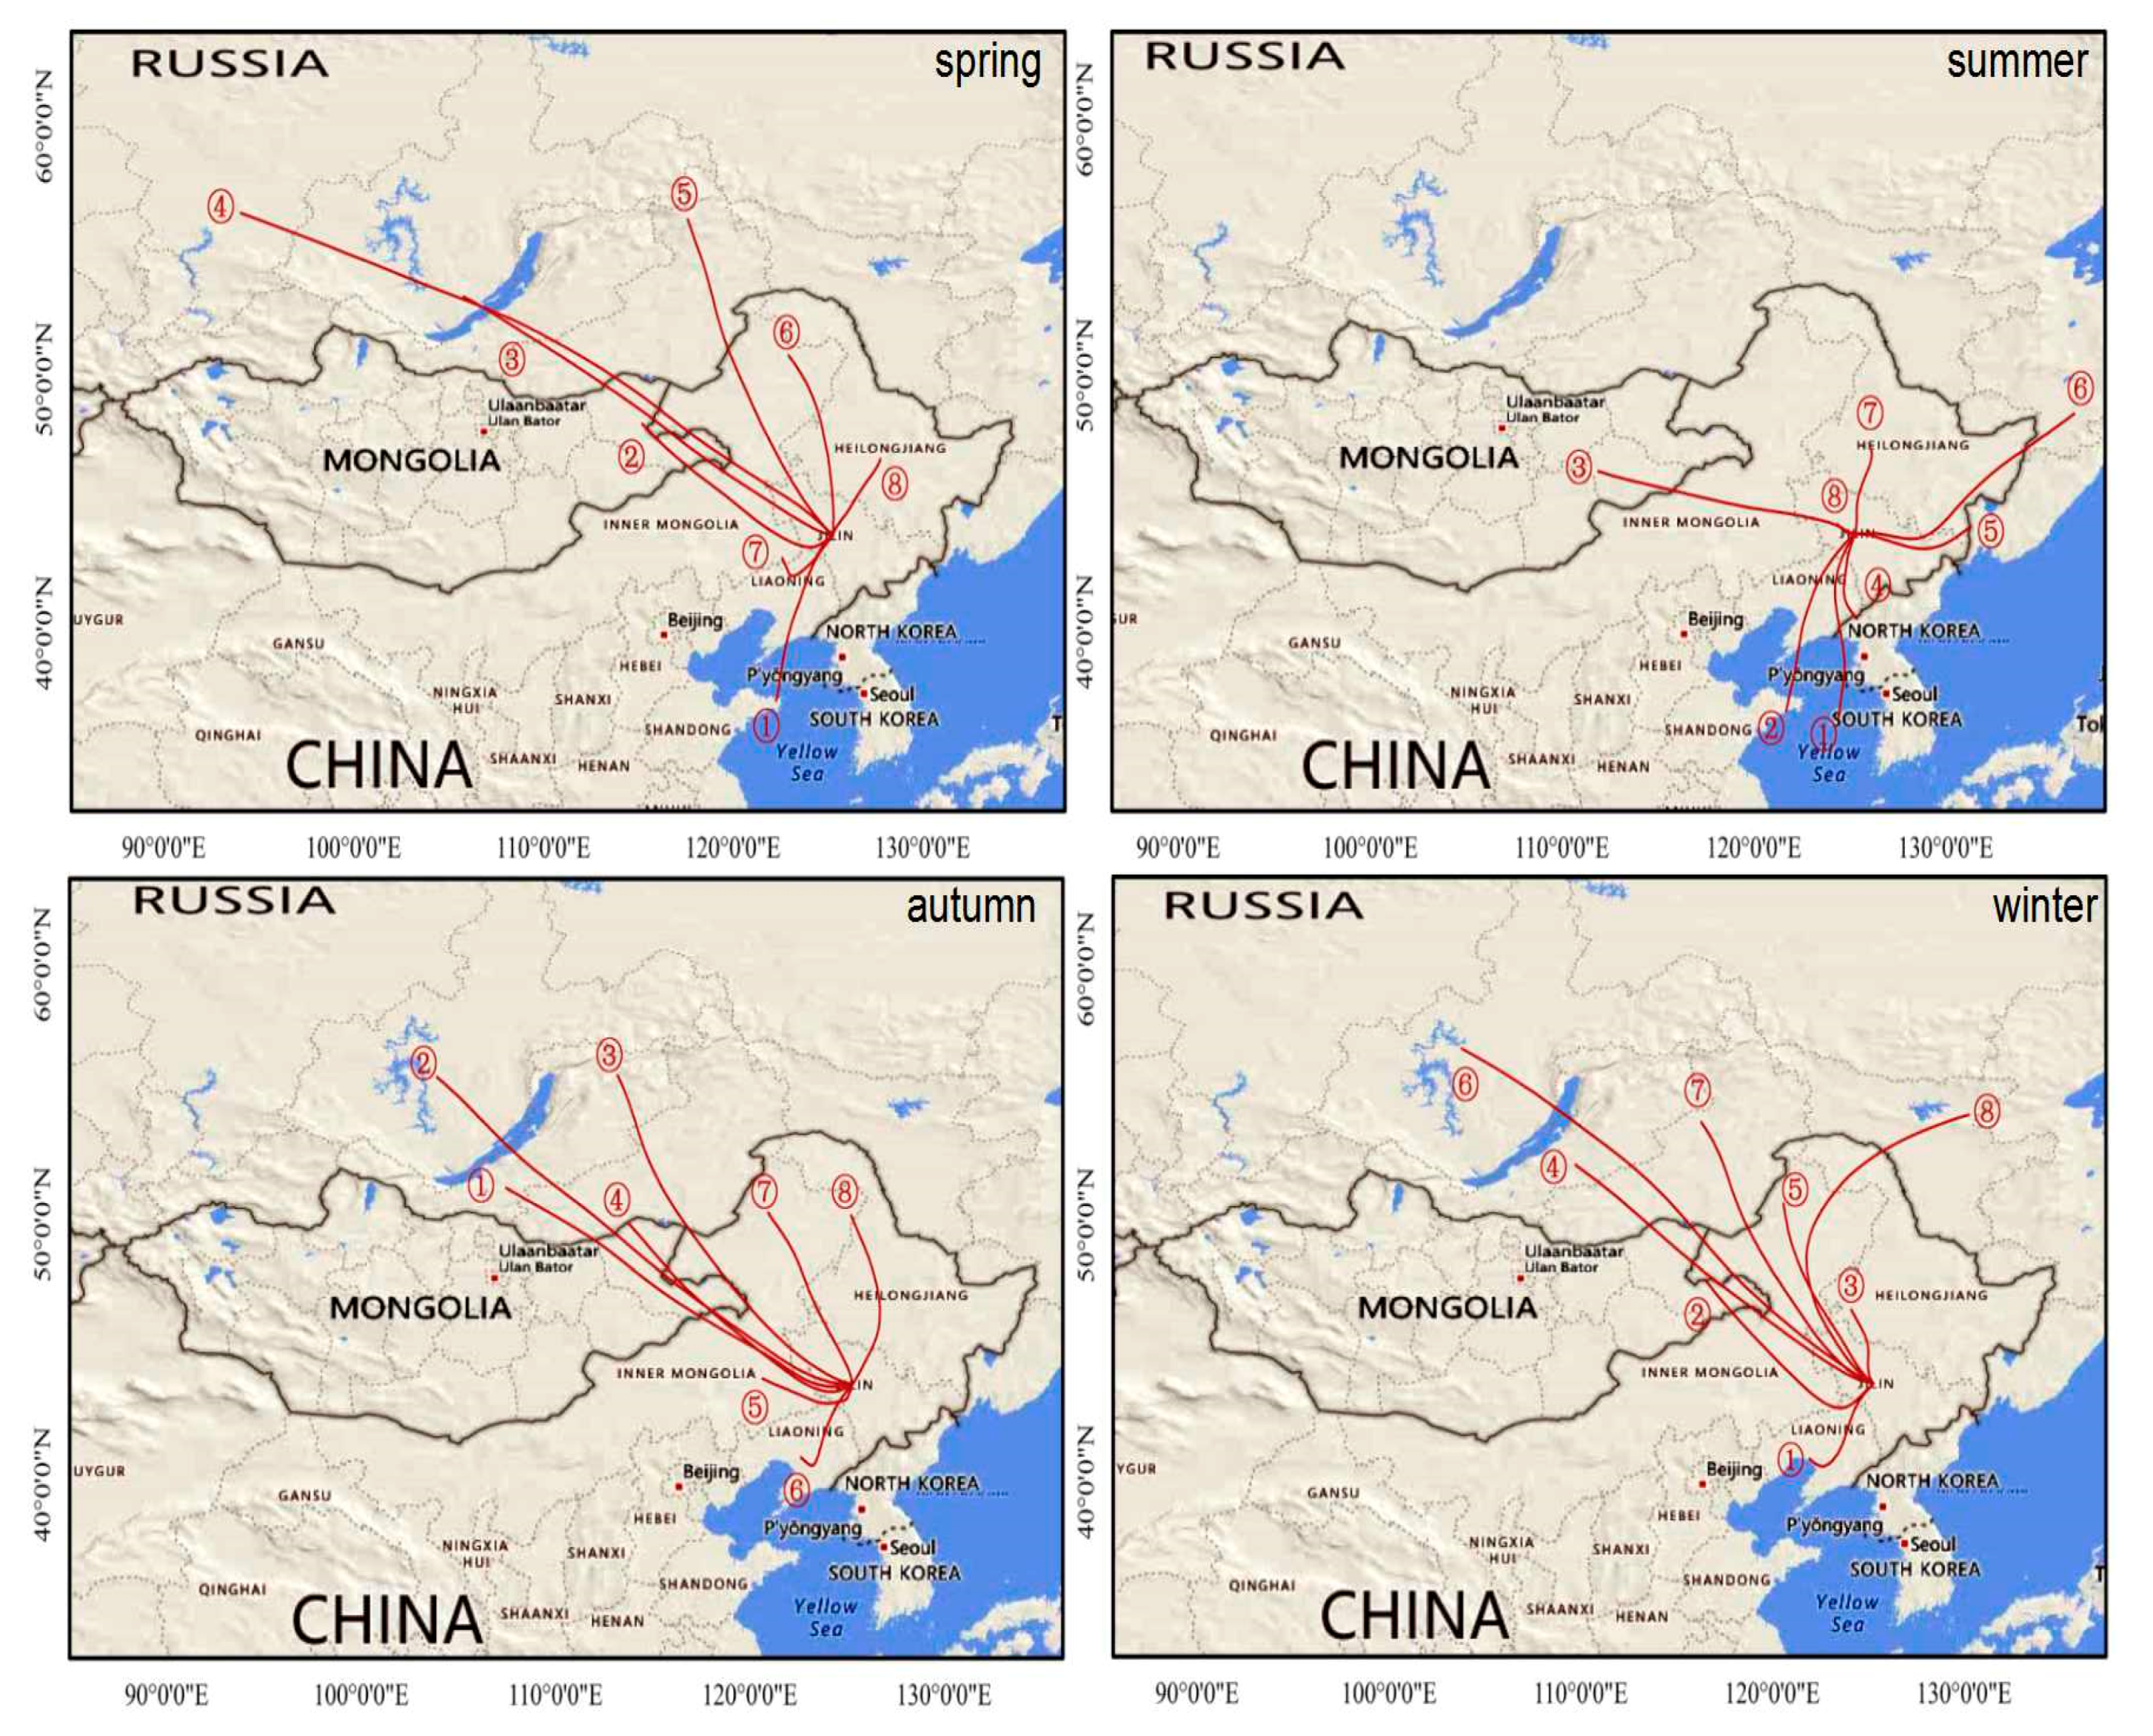
3.4. Backward Trajectory Clustering Analysis

The backward trajectories of Changchun in 2017 were clustered according to seasons and the trajectories of each season were clustered into eight categories, as shown in Figure 9. Based on the backward track clustering results, the length of each track and the corresponding PM2.5 and PM10 concentrations (Table 4) were calculated to analyze the influence of each track on the PM of four seasons in Changchun.
It can be seen from Table 4 that the northwest direction trajectories have the largest proportion in spring, autumn and winter, accounting for 56.96%, 72.2% and 76.7%, respectively, and the southwest direction trajectories have the largest proportion, accounting for 58.33% in summer. The polluted airflows of PM10 in spring, autumn and winter were mainly affected by cold and high pressure in Mongolia, passing through the northeast region of Inner Mongolia (Xing’anmeng, Tongliao). The above areas are close to deserts and rich in dust aerosols, which are transmitted to Changchun by northwest airflow. The polluted airflows of PM10 in summer and the polluted airflow of PM2.5 in spring and summer were southwest trajectories passing through east Shandong province, Liaoning province, and southwest Jilin province, which belonged to long-distance transportation. The wind speed was relatively high, which was easy to cause dust on the ground, resulting in increasing the concentration of coarse particles. Moreover, the above areas are densely populated, industrially developed and have more man-made pollution sources. The polluted airflows of PM2.5 in autumn and winter were southwest trajectories passing through northeast Inner Mongolia and Jilin province. Agriculture in these areas is more developed and a large amount of crop residues will be left after the autumn harvest period around October. Normally, farmers burn the crop residues directly outdoors. Meanwhile, the above areas are cold in winter, using coal burning for heating. Fine particles formed by coal heating and burning of crop residues were transported to Changchun by northwest airflow.

4. Conclusions

Based on hourly PM concentrations from 10 automatic atmospheric monitoring stations, this paper analyzed the temporal and spatial distribution characteristics of PM2.5 and PM10 mass concentrations of Changchun in 2017, as well as their relationships with meteorological parameters. Meanwhile, pollution pathways and source distribution were analyzed using the HYSPLIT model and cluster analysis.
The monthly averaged mass concentrations of PM2.5 and PM10 of Changchun in 2017 ranged from 17.24 to 90.40 μg m−3 and 36.85 to 111.14 μg m−3, respectively. The PM concentrations were observed largest in the first quarter, followed by the fourth quarter, the second quarter, and the third quarter, which was most likely caused by coal heating in the first and fourth quarters and the frequent sandstorm activity in the second quarter.
The distribution of PM in Changchun essentially showed higher concentrations in the west and north because of the coal combustion. In all seasons except autumn, the PM2.5 concentrations in the central urban area were high due to the high contribution from vehicles and a higher population in the central urban area. The PM2.5 concentrations were high in the suburbs in autumn, which was related to the open burning of crop residues. The concentrations of PM10 were high in the northwest but low in the southeast, which was related to land types and anthropogenic activity. The forest coverage rate in the southeast of Changchun is high and many construction sites in the northern suburban generate the construction dust. PM concentration has two peaks at 07:00–10:00 CST and 21:00–23:00 CST because of the influence of morning and evening rush hour and meteorological conditions in all seasons, except for PM10 in spring.
Observed PM2.5 and PM10 concentrations showed clear negative relationships with temperature and relative humidity. PM2.5 concentrations were negatively correlated with wind speed, while PM10 concentrations were positively correlated with wind speed.
The backward trajectories results showed that the northwest direction trajectories had the largest proportion in spring, autumn and winter and the southwest direction trajectories had the largest proportion in summer. The polluted airflows of PM10 in spring, autumn and winter and airflows of PM2.5 in autumn and winter mainly passed through the northeast region of Inner Mongolia and Jilin province. The polluted airflows of PM10 in summer and the polluted airflow of PM2.5 in spring and summer mainly passed through east Shandong province, Liaoning province and southwest Jilin province.

Author Contributions

Methodology, J.W.; formal analysis, X.X.; curation, J.W.; writing—original draft preparation, X.X.; project administration, C.F.

Funding

This research was funded by 2 projects of Ecology and Environment Department of Jilin Province. The project numbers are 2018-19 and 2019-08.

Conflicts of Interest

The authors declare no conflict of interest.

References

  1. Han, L.; Zhou, W.; Li, W.; Li, L. Impact of urbanization level on urban air quality: A case of fine particles (PM2.5) in Chinese cities. Environ. Pollut. 2014, 194, 163–170. [Google Scholar] [CrossRef] [PubMed]
  2. Du, Y.; Sun, T.; Peng, J. Direct and spillover effects of urbanization on PM2.5 concentrations in China’s top three urban agglomerations. J. Clean Prod. 2018, 190, 72–83. [Google Scholar] [CrossRef]
  3. Chen, Z.; Barros, C.P.; Gil-Alana, L.A. The persistence of air pollution in four mega-cities of China. Habitat Int. 2016, 56, 103–108. [Google Scholar] [CrossRef] [Green Version]
  4. Qing, G.; Fu, L.; Li, Y. Spatial-temporal variations and mineral dust fractions in particulate matter mass concentrations in an urban area of northwestern China. J. Environ. Manag. 2018, 222, 95–103. [Google Scholar]
  5. Zhang, X.P.; Gong, Z.Z. Spatiotemporal characteristics of urban air quality in China and geographic detection of their determinants. J. Geogr. Sci. 2018, 28, 563–578. [Google Scholar] [CrossRef] [Green Version]
  6. Sun, Z.; Zhan, D.S. Spatio-temporal Characteristics and Geographical Determinants of Air Quality in Cities at the Prefecture Level and Above in China. Chin. Geogr. Sci. 2019, 29, 316–324. [Google Scholar] [CrossRef]
  7. Wang, Z.B.; Fang, C.L. Spatial-temporal characteristics and determinants of PM2.5 in the Bohai Rim Urban Agglomeration. Chemosphere 2016, 148, 148–162. [Google Scholar] [CrossRef]
  8. Zhao, H.J.; Che, H.Z.; Ma, Y.J. Temporal variability of the visibility, particulate matter mass concentration and aerosol optical properties over an urban site in Northeast China. Atmos. Res. 2015, 166, 204–212. [Google Scholar] [CrossRef]
  9. Wang, J.L.; Zhang, Y.H.; Shao, M.; Liu, X.L. Quantitative relationship between visibility and mass concentration of PM2.5 in Beijing. J. Environ. Sci. 2006, 18, 475–481. [Google Scholar]
  10. Wu, J.; Cheng, W.; Lu, H.J. The Effect of Particulate Matter on Visibility in Hangzhou, China. J. Environ. Sci. Manag. 2018, 21, 100–109. [Google Scholar]
  11. Huang, J.P.; Wang, T.H.; Wang, W.C. Climate effects of dust aerosols over East Asian arid and semiarid regions. J. Geophys. Res. Atmos. 2014, 119, 11398–11416. [Google Scholar] [CrossRef]
  12. Tainio, M.; Juda-Rezler, K.; Reizer, M. Future climate and adverse health effects caused by fine particulate matter air pollution: Case study for Poland. Reg. Environ. Chang. 2013, 13, 705–715. [Google Scholar] [CrossRef]
  13. Pienkosz, B.D.; Saari, R.K.; Monier, E. Natural Variability in Projections of Climate Change Impacts on Fine Particulate Matter Pollution. Earth’s Future 2019, 7, 762–770. [Google Scholar] [CrossRef] [Green Version]
  14. Tian, Y.H.; Xiang, X.; Juan, J. Short-term effects of ambient fine particulate matter pollution on hospital visits for chronic obstructive pulmonary disease in Beijing, China. Environ. Health 2018, 17, 21. [Google Scholar] [CrossRef]
  15. Xu, Q.; Li, X.; Wang, S. Fine Particulate Air Pollution and Hospital Emergency Room Visits for Respiratory Disease in Urban Areas in Beijing, China, in 2013. PLoS ONE 2016, 11, e0153099. [Google Scholar] [CrossRef]
  16. Li, G.; Huang, J.; Xu, G. The short term burden of ambient fine particulate matter on chronic obstructive pulmonary disease in Ningbo, China. Environ. Health 2017, 16, 54. [Google Scholar] [CrossRef] [Green Version]
  17. Clements, N.; Hannigan, M.P.; Miller, S.L. Comparisons of urban and rural PM10–2.5 and PM2.5 mass concentrations and semi-volatile fractions in northeastern Colorado. Atmos. Chem. Phys. 2016, 16, 7469–7484. [Google Scholar] [CrossRef]
  18. Tiwari, S.; Bisht, D.S.; Srivastava, A.K. Variability in atmospheric particulates and meteorological effects on their mass concentrations over Delhi, India. Atmos. Res. 2014, 145, 45–56. [Google Scholar] [CrossRef]
  19. Tuan, V.V.; Jakub, O.; Vladimir, Z. Physical properties and lung deposition of particles emitted from five major indoor sources. Air Qual. Atmos. Health 2016, 10, 1–14. [Google Scholar] [Green Version]
  20. Song, Y.S.; Tao, Y. Transmission Electron Microscope Study on the Physical and Chemical Characteristics of Atmospheric Particulate Matter PM1.0 in Heavily Polluted Weather. Acta Microsc. 2019, 28, 726–732. [Google Scholar]
  21. Li, J.; Qi, Z.; Li, M. Physical and Chemical Characteristics of Condensable Particulate Matter from an Ultralow-Emission Coal-Fired Power Plant. Energy Fuels 2017, 31, 1778–1785. [Google Scholar] [CrossRef]
  22. Li, H.; Wang, Q.; Yang, M. Chemical characterization and source apportionment of PM2.5 aerosols in a megacity of Southeast China. Atmos. Res. 2016, 181, 288–299. [Google Scholar] [CrossRef]
  23. Liang, Z.; Zhao, X.; Chen, J. Seasonal characteristics of chemical compositions and sources identification of PM2.5 in Zhuhai, China. Environ. Geochem. Health 2018, 41, 715–728. [Google Scholar] [CrossRef] [PubMed]
  24. Li, T.C.; Yuan, C.S.; Lo, K.C.; Hung, C.H.; Wu, S.P.; Tong, C. Seasonal Variation and Chemical Characteristics of Atmospheric Particles at Three Islands in the Taiwan Strait. Aerosol Air Qual. Res. 2015, 15, 2277–2290. [Google Scholar] [CrossRef] [Green Version]
  25. Nam, J.; Kim, S.W.; Park, R.J. Changes in column aerosol optical depth and ground-level particulate matter concentration over East Asia. Air Qual. Atmos. Health 2018, 11, 49–60. [Google Scholar] [CrossRef]
  26. Tiwari, S.; Hopke, P.K. Variability in optical properties of atmospheric aerosols and their frequency distribution over a mega city “New Delhi,” India. Environ. Sci. Pollut. Res. 2016, 23, 8781–8793. [Google Scholar] [CrossRef]
  27. Zhang, H.L.; Wang, Y.G.; Hu, J.L. Relationships between meteorological parameters and criteria air pollutants in three megacities in China. Environ. Res. 2015, 140, 242–254. [Google Scholar] [CrossRef]
  28. Kliengchuay, W.; Meeyai, A.C.; Worakhunpiset, S. Relationships between Meteorological Parameters and Particulate Matter in Mae Hong Son Province, Thailand. Int. J. Environ. Res. Public Health 2018, 15, 2801. [Google Scholar] [CrossRef]
  29. Trivedi, D.K.; Ali, K.; Beig, G. Impact of meteorological parameters on the development of fine and coarse particles over Delhi. Sci. Total Environ. 2014, 478, 175–183. [Google Scholar] [CrossRef]
  30. Fang, C.; Zhang, Z.; Jin, M. Pollution Characteristics of PM2.5 Aerosol during Haze Periods in Changchun, China. Aerosol Air Qual. Res. 2017, 17, 888–895. [Google Scholar] [CrossRef]
  31. Wang, J.; Yang, L.; Ma, T. Source apportionment research of fine particulate matter in the atmosphere by PAHs. Chem. Res. Chin. Univ. 2016, 32, 746–753. [Google Scholar] [CrossRef]
  32. Stein, A.F.; Draxler, R.R.; Rolph, G.D. NOAA’s HYSPLIT atmospheric transport and dispersion modeling system. Bull. Am. Meteorol. Soc. 2015, 96, 2059–2077. [Google Scholar] [CrossRef]
  33. Chai, T.; Crawford, A.; Stunder, B. Improving volcanic ash predictions with the HYSPLIT dispersion model by assimilating MODIS satellite retrievals. Atmos. Chem. Phys. Discuss. 2016, 17, 2865–2879. [Google Scholar] [CrossRef]
  34. Ashrafi, K.; Shafiepour-Motlagh, M.; Aslemand, A. Dust storm simulation over Iran using HYSPLIT. J. Environ. Health Sci. Eng. 2014, 12, 9. [Google Scholar] [CrossRef]
  35. Rashki, A.; Kaskaoutis, D.G.; Francois, P. Dust-storm dynamics over Sistan region, Iran: Seasonality, transport characteristics and affected areas. Aeolian Res. 2015, 16, 35–48. [Google Scholar] [CrossRef]
  36. Qiusheng, H.; Wendi, G.; Guixiang, Z. Characteristics and Seasonal Variations of Carbonaceous Species in PM2.5 in Taiyuan, China. Atmosphere 2015, 6, 850–862. [Google Scholar]
  37. Wang, X.; Wei, W.; Cheng, S. Characteristics and classification of PM2.5, pollution episodes in Beijing from 2013 to 2015. Sci. Total Environ. 2018, 612, 170–179. [Google Scholar] [CrossRef]
  38. Li, Y.; Chen, Q.; Zhao, H.; Wang, L.; Tao, R. Variations in PM10, PM2.5 and PM1.0 in an urban area of the Sichuan Basin and their relation to meteorological factors. Atmosphere 2015, 6, 150–163. [Google Scholar] [CrossRef]
  39. Tang, G.; Zhang, J.; Zhu, X. Mixing layer height and its implications for air pollution in Beijing, China. Atmos. Chem. Phys. 2016, 16, 2459–2475. [Google Scholar] [CrossRef]
  40. Zhao, S.; Yu, Y.; Yin, D. Annual and diurnal variations of gaseous and particulate pollutants in 31 provincial capital cities based on in situ air quality monitoring data from China National Environmental Monitoring Center. Environ. Int. 2016, 86, 92–106. [Google Scholar] [CrossRef]
  41. Westerdahl, D.; Wang, X.; Pan, X. Characterization of on-road vehicle emission factors and microenvironmental air quality in Beijing, China. Atmos. Environ. 2009, 43, 697–705. [Google Scholar] [CrossRef]
  42. Li, X.L.; Klose, M.; Shao, Y. Convective turbulent dust emission (CTDE) observed over Horqin Sandy Land area and validation of a CTDE scheme. J. Geophys. Res. Atmos. 2014, 119, 9980–9992. [Google Scholar] [CrossRef]
  43. Li, H.; Hai, L.Z.; Xin, X. Precipitation and Its Effects on Atmospheric Pollutants in a Representative Region of Beijing in Summer. Environ. Sci. 2017, 38, 2211–2217. [Google Scholar]
  44. Zhao, H.; Che, H.; Zhang, X. Characteristics of visibility and particulate matter (PM) in an urban area of Northeast China. Atmos. Pollut. Res. 2013, 4, 427–434. [Google Scholar] [CrossRef] [Green Version]
  45. Li, X.; Ma, Y.; Wang, Y. Temporal and spatial analyses of particulate matter (PM10 and PM2.5) and its relationship with meteorological parameters over an urban city in northeast China. Atmos. Res. 2017, 198, 185–193. [Google Scholar] [CrossRef]
  46. Li, X.; Zhang, H. Seasonal variations in dust concentration and dust emission observed over Horqin Sandy Land area in China from December 2010 to November 2011. Atmos. Environ. 2012, 61, 56–65. [Google Scholar] [CrossRef]
Figure 1. (a) Geographical position of Changchun, and (b) locations of air quality monitoring stations and meteorological station in Changchun.
Atmosphere 10 00651 g001
Figure 2. Temporal variations in (a) daily and (b) monthly mean PM2.5 and PM10 mass concentrations, and (c) PM2.5/PM10 monthly averages in Changchun in 2017.
Atmosphere 10 00651 g002
Figure 3. Diurnal variation in PM2.5 concentrations in Changchun.
Atmosphere 10 00651 g003
Figure 4. Diurnal variation in PM10 concentrations in Changchun.
Atmosphere 10 00651 g004
Figure 5. Spatial distribution of seasonal average concentrations of PM2.5.
Atmosphere 10 00651 g005
Figure 6. Spatial distribution of seasonal average concentrations of PM10.
Atmosphere 10 00651 g006
Figure 7. Temporal variations in daily mean (a) wind speed, (b) temperature, (c) relative humidity during 2017 in Changchun.
Atmosphere 10 00651 g007
Figure 8. The relationship between PM2.5 concentrations and meteorological conditions (a) temperature, (b) temperature, (c) relative humidity, (d) relative humidity, (e) wind speed and the relationship between PM10 concentrations and meteorological conditions, (f) wind speed.
Atmosphere 10 00651 g008
Figure 9. Backward trajectories clustering of Changchun in 2017.
Atmosphere 10 00651 g009
Table 1. Nature of air quality monitoring stations in Changchun.
NameEnvironmental Air Quality Functional AreaMajor Source of Pollution (Area)Wind Direction
Children’s Park (CP)IIUrban and ruralUpwind
Bus Factory Hospital (BFH)IIIndustrial dischargeUpwind
Institute of Posts and Telecommunications (IPT)IIDensely populatedUpwind
Labour Park (LP)IIDensely populatedDownwind
High-Tech Zone Management Committee (HZMC)IIUrban and ruralUpwind
Daishan Park (DP)IIIndustrial dischargeUpwind
Jingyue Park (JYP)INatural reserveSide wind
Economic Development Zone Environment Sanitary Administration (EESA)IIDensely populatedDownwind
Junzilan Park (JZP)IIVehicle emissionDownwind
Shuaiwanzi (SWZ)IBackgroundSide wind
Table 2. Quarterly and annual variations in concentrations and ratios of PM2.5 and PM10 in major cities (μg m−3).
Site 1234Annual
ChangchunPM2.57134196347
PM109687469481
PM2.5/PM100.740.390.410.670.58
ShenzhenPM2.53422193828
PM105036316145
PM2.5/PM100.680.610.610.620.62
XiamenPM2.53824192727
PM106145335348
PM2.5/PM100.620.530.580.510.56
BeijingPM2.58352494958
PM10100103766887
PM2.5/PM100.830.500.640.720.67
ShanghaiPM2.54638304039
PM105758486256
PM2.5/PM100.810.660.630.650.70
GuangzhouPM2.54629264135
PM106851436156
PM2.5/PM100.680.570.600.670.63
Table 3. Correlation coefficients between daily PM10 and PM2.5 concentrations and meteorological parameters.
TaRHU
PM2.5−0.434 **−0.019−0.165 **
PM10−0.207 **−0.251 **0.130 *
Note: Ta = temperature; RH = relative humidity; U = wind speed. * means significance of p < 0.05, the ** means significance of p < 0.01.
Table 4. Results of back-trajectory clustering with eight clusters.
SeasonCluster No.DirectionAreas of PathwaysPercentage of Total Trajectory (%)Trajectory Length (km)PM2.5 (μg m−3)PM10 (μg m−3)
spring1SWeastern Shandong, Bohai, Liaoning, southwestern Jilin18.10776.8835.15100.55
2NWeastern Mongolia, northeastern Inner Mongolia, southwestern Jilin10.311004.0522.2268.17
3NWsouthern Russia, northeastern Mongolia, northeastern Inner Mongolia, western Jilin9.631794.1926.87113.89
4NWsouthern Russia, northeastern Mongolia, northeastern Inner Mongolia, northwestern Jilin2.052641.1029.34124.56
5NWsoutheastern Russia, northeastern Inner Mongolia, northwestern Jilin9.021512.8133.61207.05
6NWnortheastern Inner Mongolia, southwestern Heilongjiang, northwestern Jilin13.93818.1323.8959.33
7NWeastern Inner Mongolia, central and northern Liaoning, southwestern Jilin12.02348.6028.6371.75
8NEsouthwestern Heilongjiang, northern Jilin24.93388.6422.5152.07
summer1SWYellow Sea, Liaoning southwestern Jilin14.91823.1526.9353.90
2SWeastern Shandong, Bohai Liaoning, southwest Jilin10.50845.6634.6064.29
3NWeastern Mongolia, northeastern Inner Mongolia, western Jilin2.991094.9222.2944.06
4SWnorthwestern north Korea, eastern Liaoning, southwestern Jilin32.92391.5520.7546.01
5Esoutheastern Russia, southeastern Heilongjiang, eastern Jilin8.86525.8316.1443.55
6NEsoutheastern Russia, southeastern Heilongjiang, eastern Jilin2.411106.4214.1836.61
7NESouthwestern Heilongjiang, northern Jilin13.09374.0216.1743.84
8NWnorthwestern Jilin14.32116.4620.0350.83
autumn1NWsouthern Russia, northeastern Mongolia, northeastern Inner Mongolia, western Jilin5.871624.8413.0636.07
2NWsouthern Russia, northeastern Mongolia, northeastern Inner Mongolia, western Jilin10.112088.9016.3745.28
3NWsouthern Russia, eastern Mongolia, northeastern Inner Mongolia, northwestern Jilin9.701656.8816.9057.40
4NWnortheastern Mongolia, northeastern Inner Mongolia, western Jilin9.431196.6244.1174.95
5NWeastern Inner Mongolia, northern Liaoning, western Jilin10.79441.6661.0698.06
6SWnorth-central Liaoning, western Jilin27.80452.1237.0467.40
7NWnortheastern Inner Mongolia, western Heilongjiang northwestern Jilin16.26805.6038.1267.08
8NWnortheastern Inner Mongolia, Heilongjiang, northwestern Jilin10.04761.1640.8374.57
winter1SWnorth Central Liaoning, Jilin18.90502.3582.75115.95
2NWnortheastern Mongolia, northeastern Inner Mongolia, northern Liaoning, western Jilin13.42975.3866.2093.83
3NWsouthwestern Heilongjiang, northwestern Jilin23.26339.3889.35114.67
4NWsouthern Russia, northeastern Mongolia, northeastern Inner Mongolia, northwestern Jilin13.201516.9345.1874.89
5NWNortheastern Inner Mongolia, northwestern Jilin11.68870.7472.6098.37
6NWsouthern Russia, northeastern Mongolia, northeastern Inner Mongolia, northwestern Jilin5.382123.2925.3765.69
7NWsoutheastern Russia, northeastern Inner Mongolia, northwestern Jilin9.761349.2750.1278.67
8NEsoutheastern Russia, northwestern Heilongjiang, northeastern Inner Mongolia, northwestern Jilin4.411522.0435.0254.83

