Preliminary Dual-Satellite Observations of Atmospheric Gravity Waves in Airglow

 , ,
, ,  ,
,
Abstract
1. Introduction
2. Instrumentation
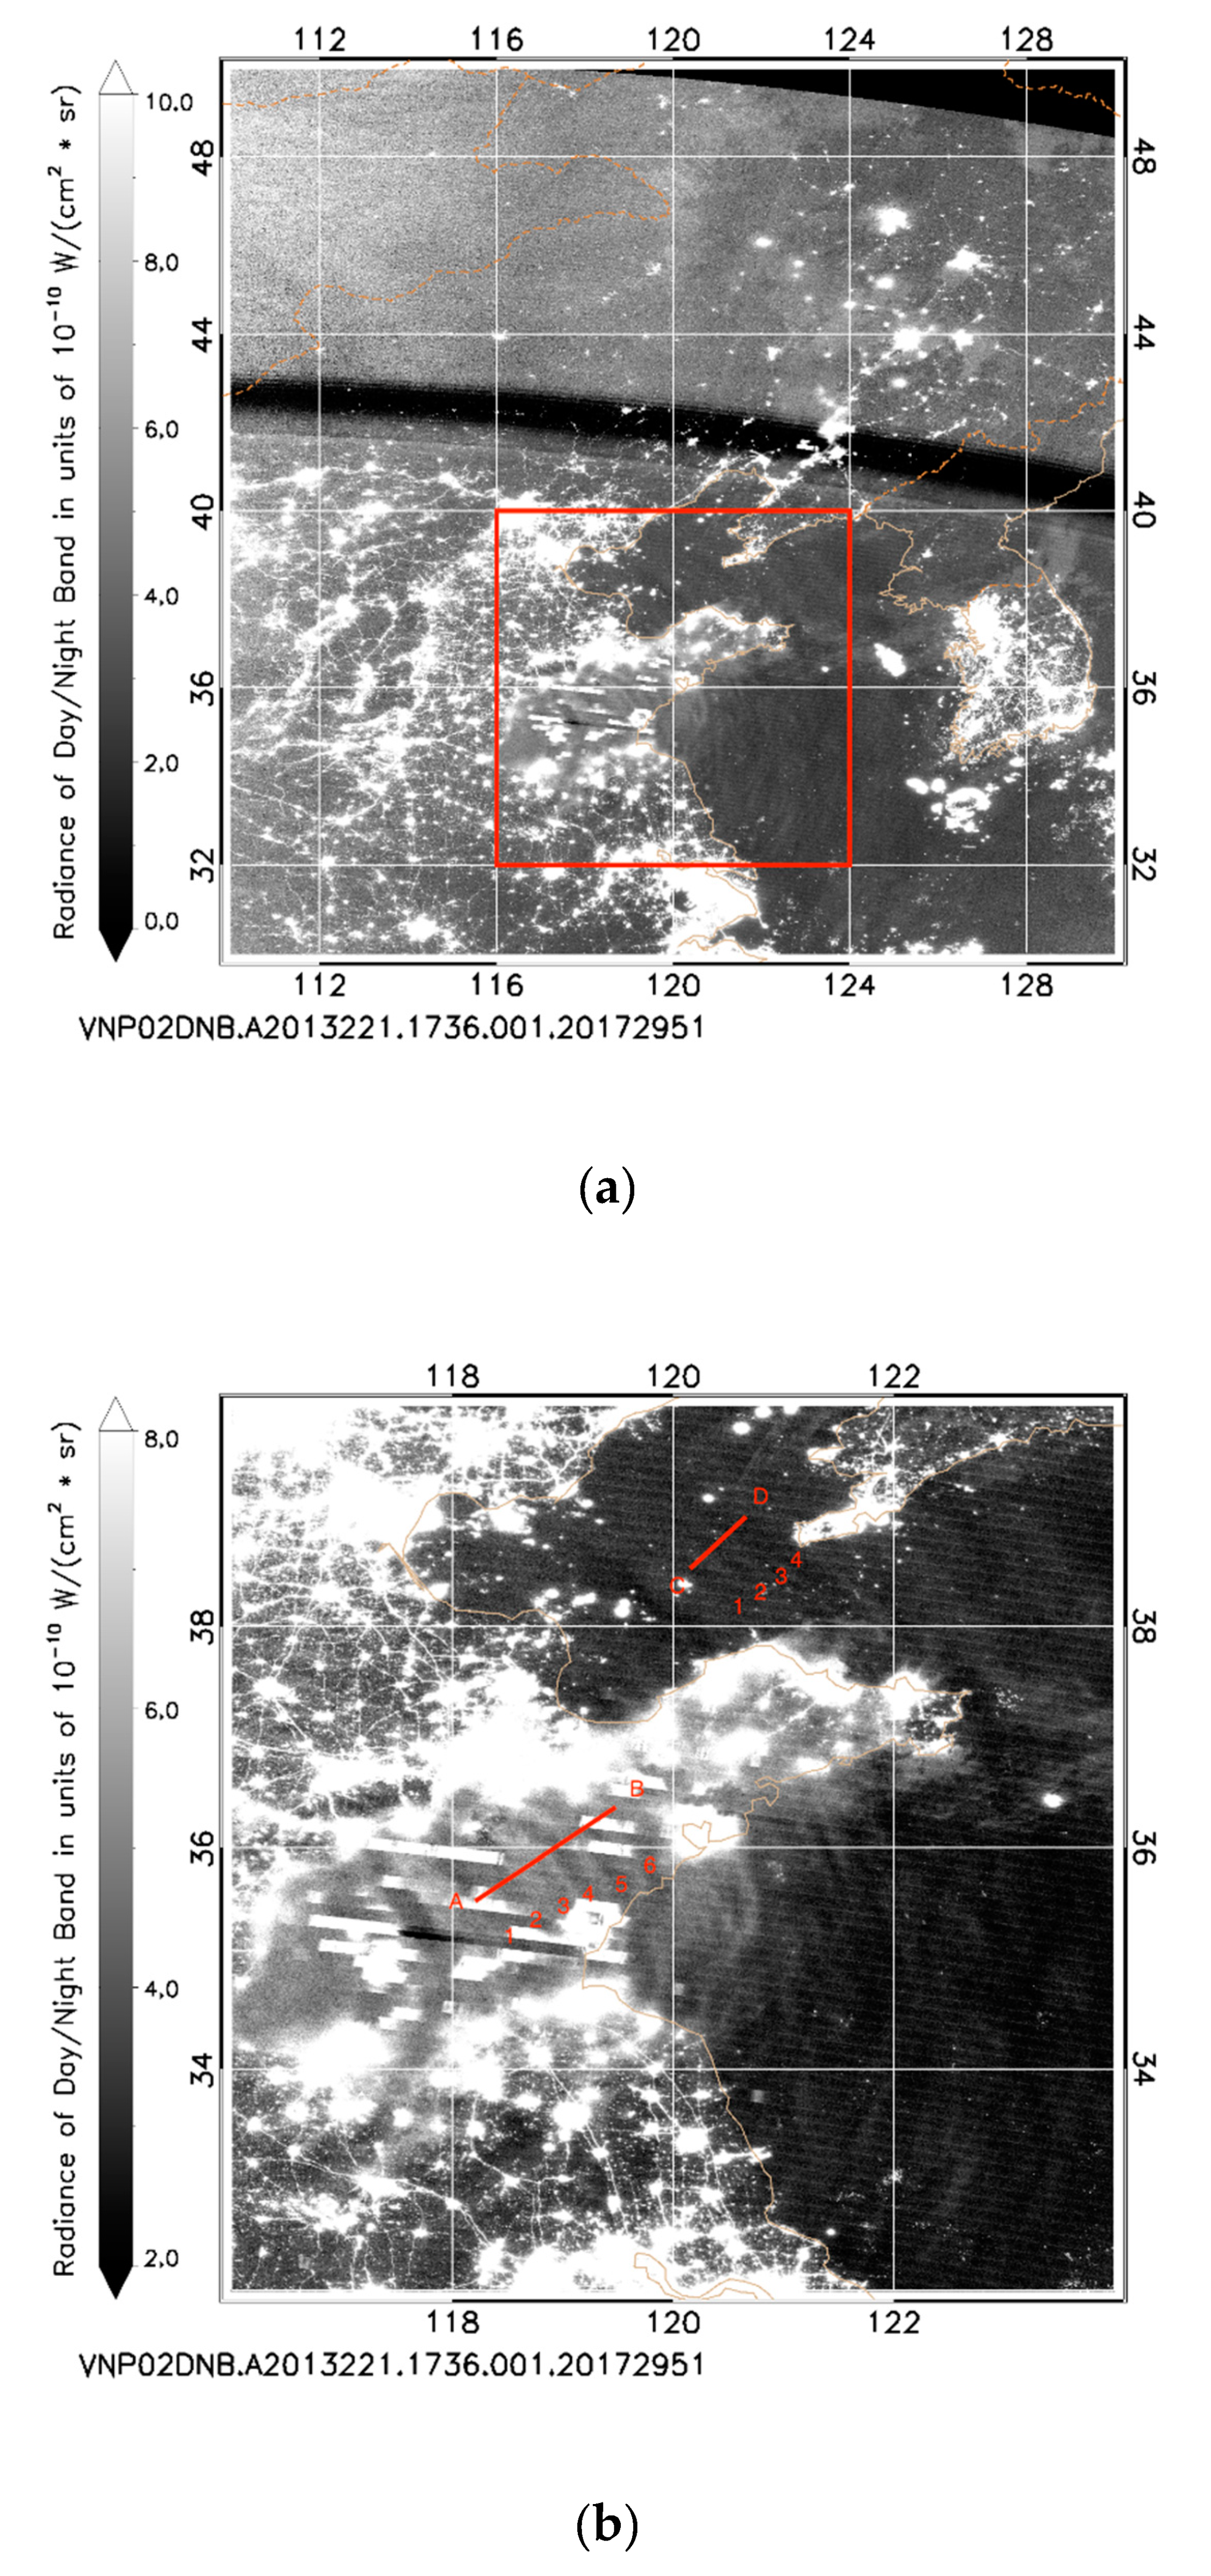
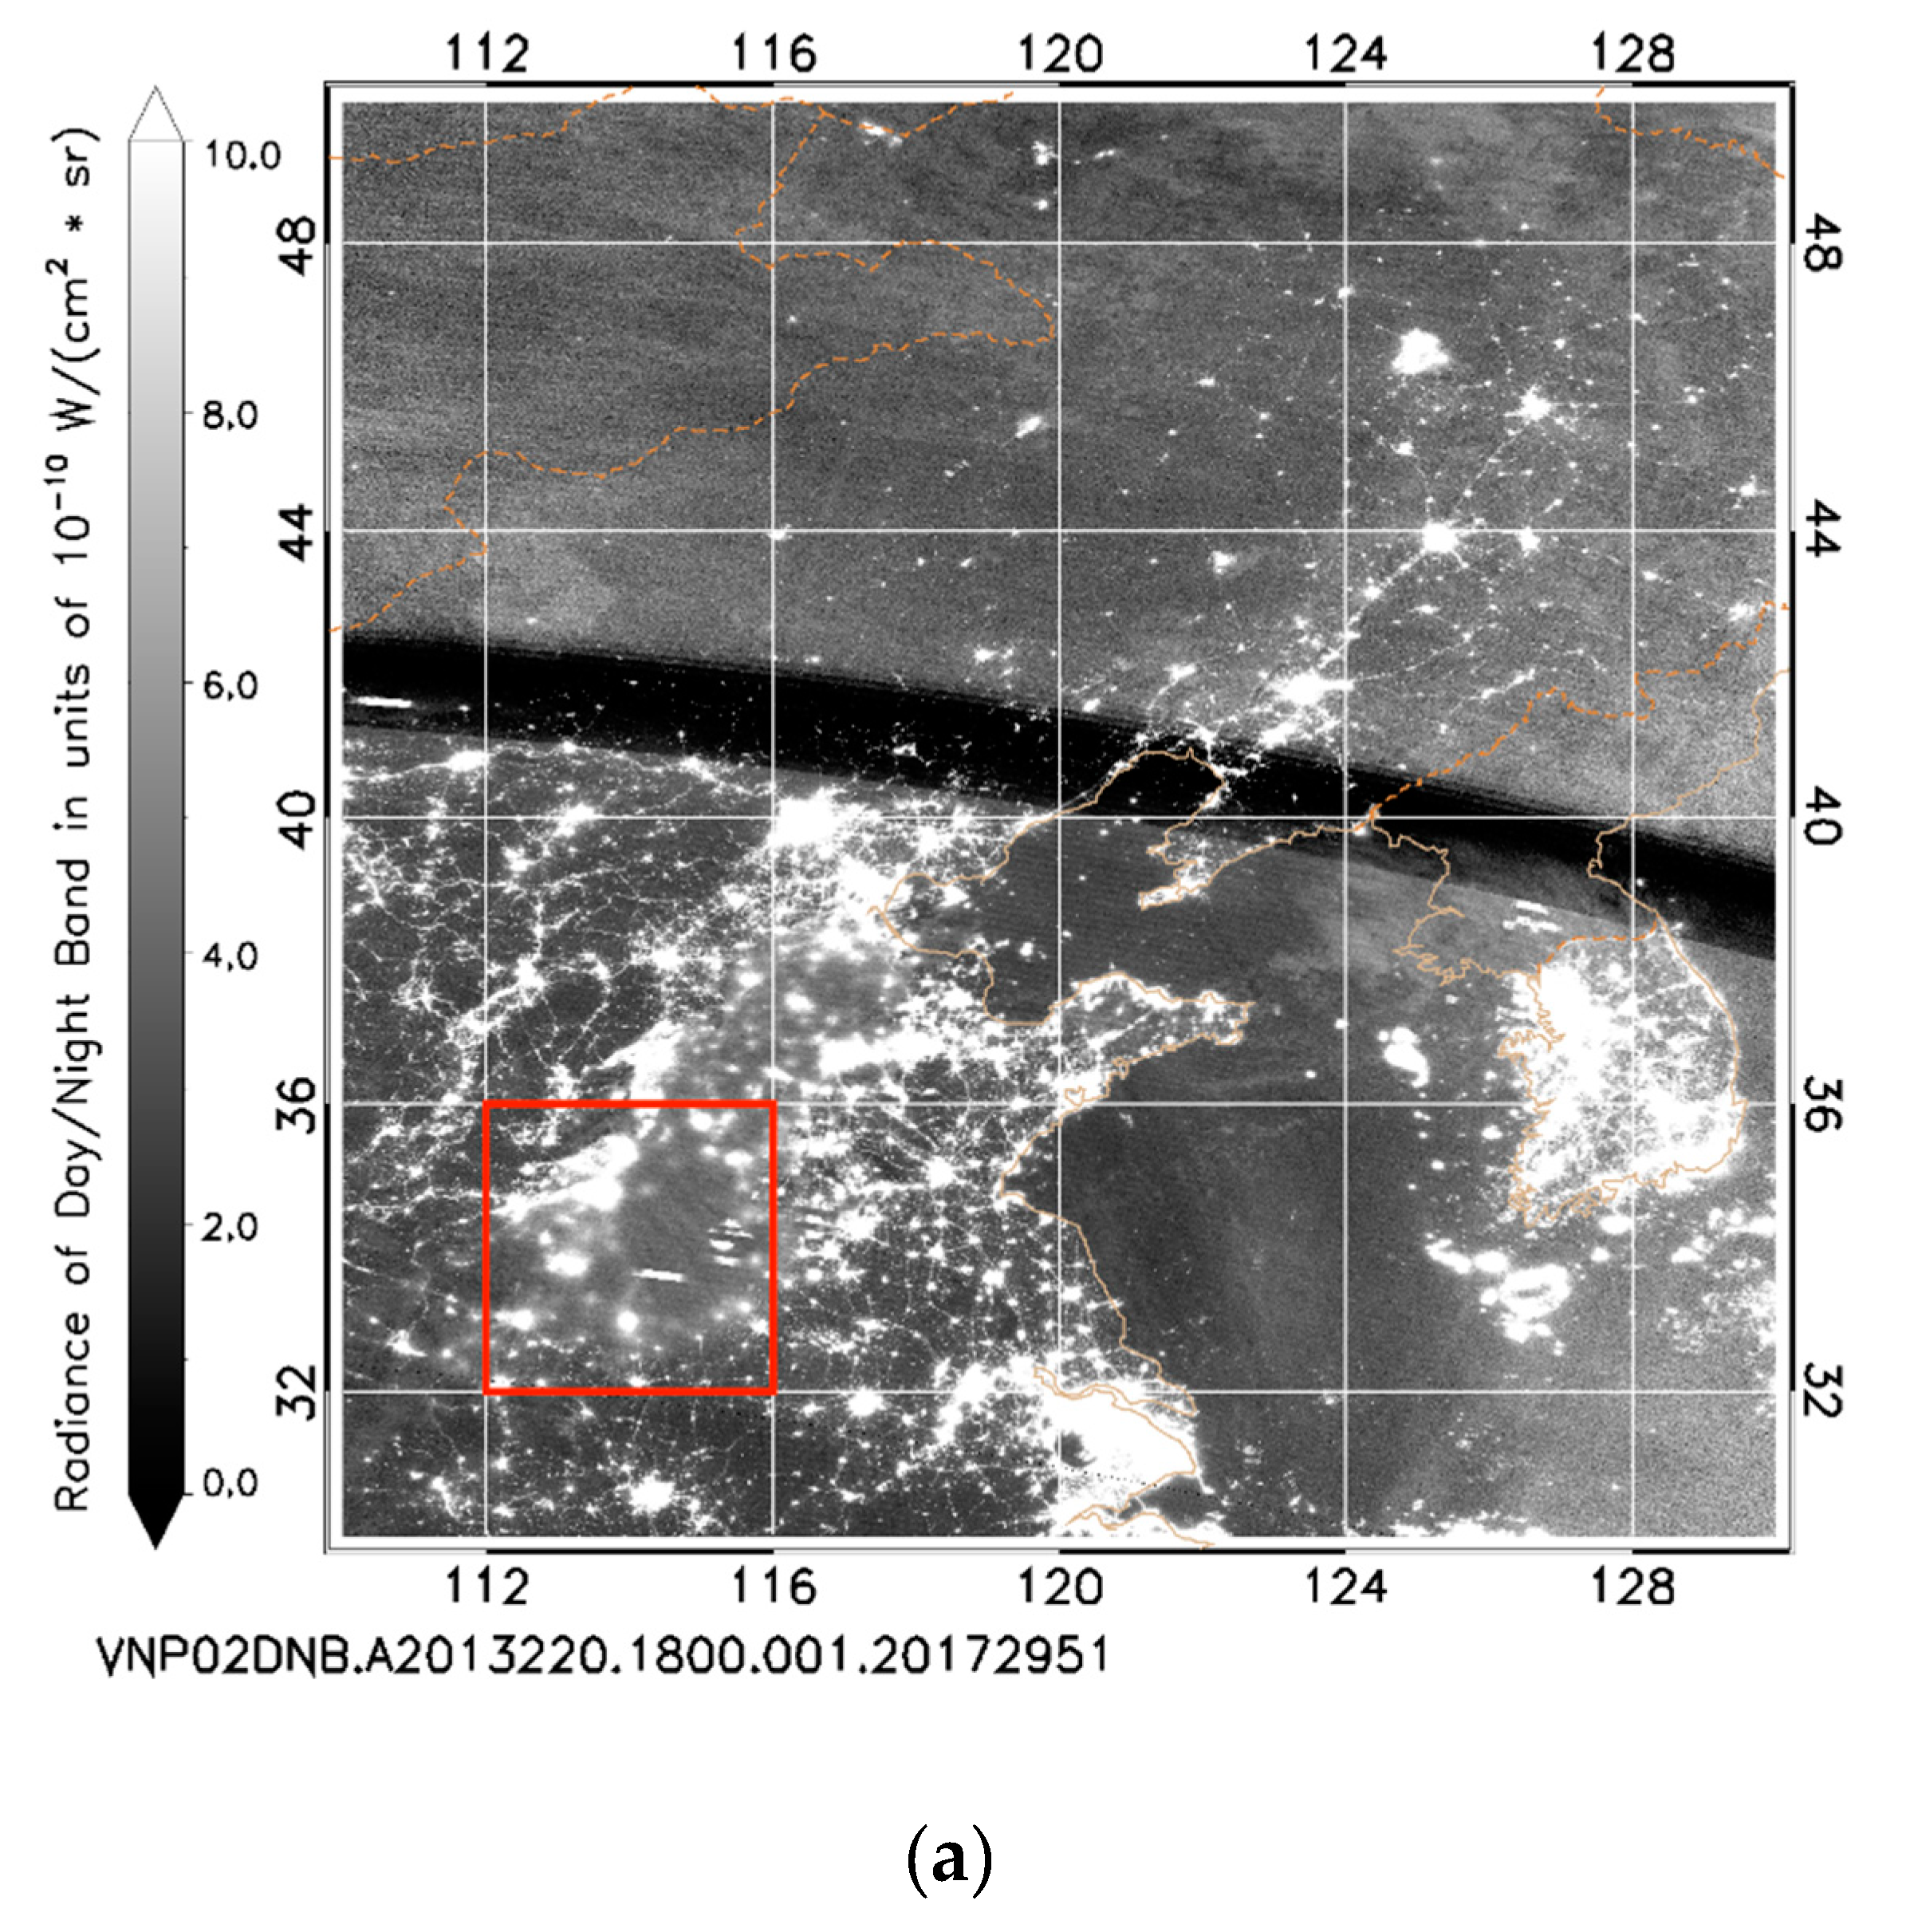
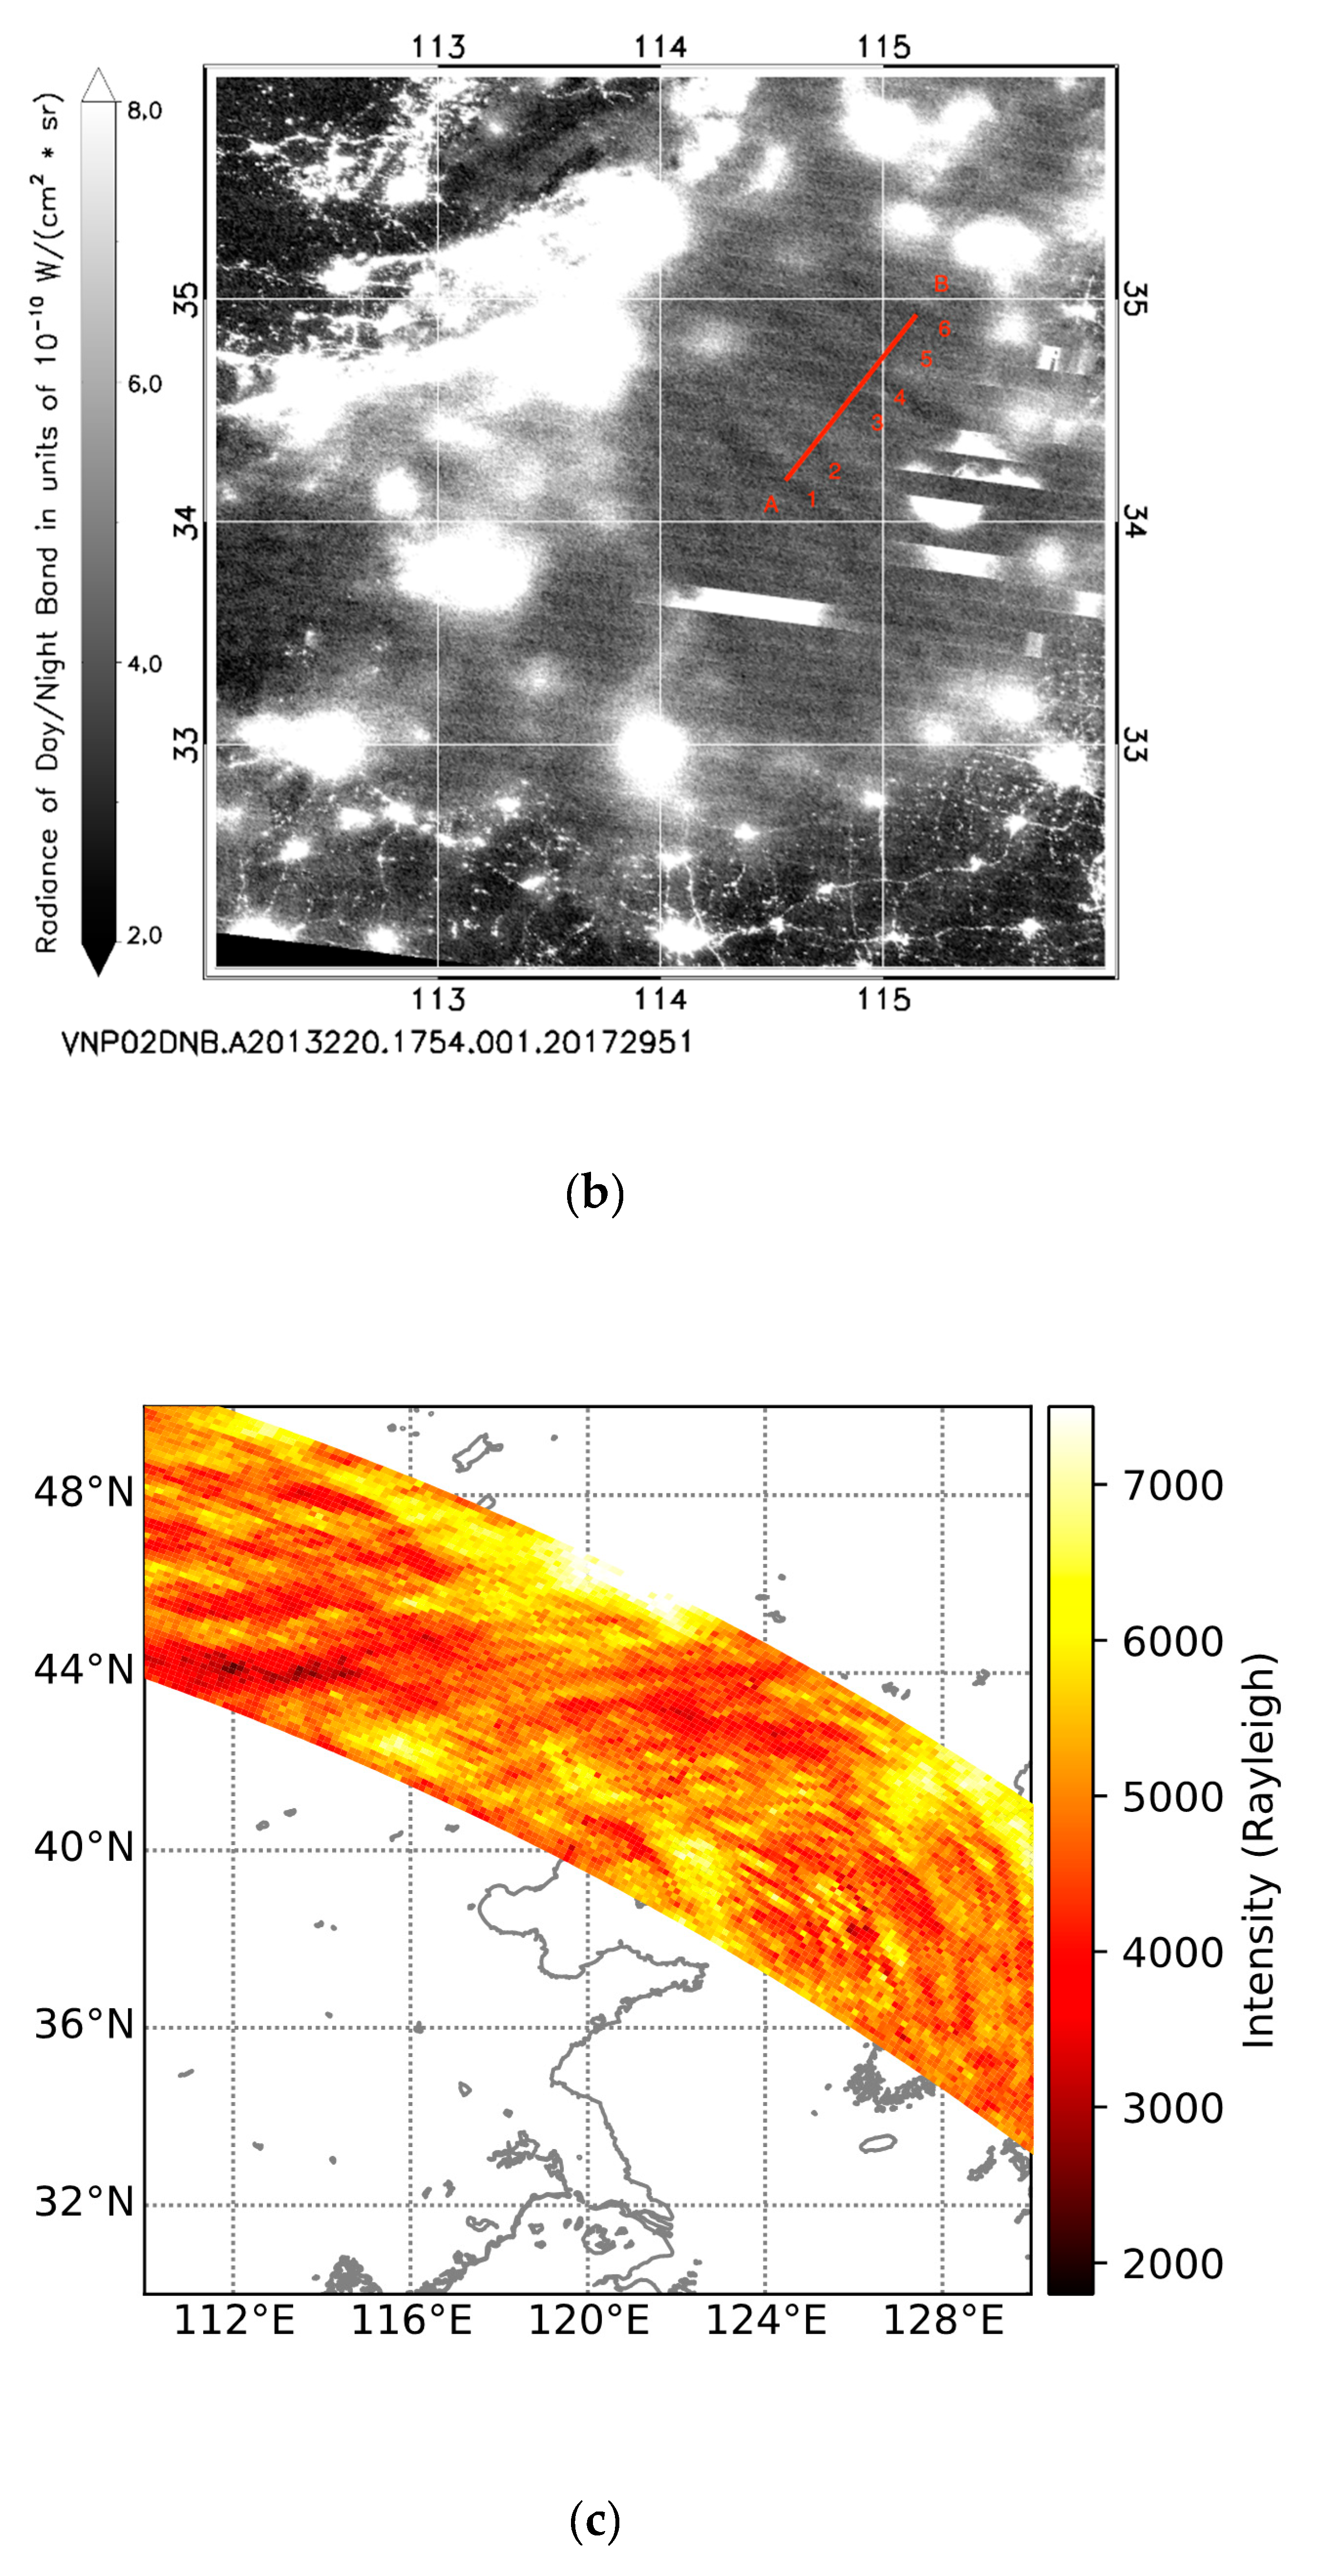
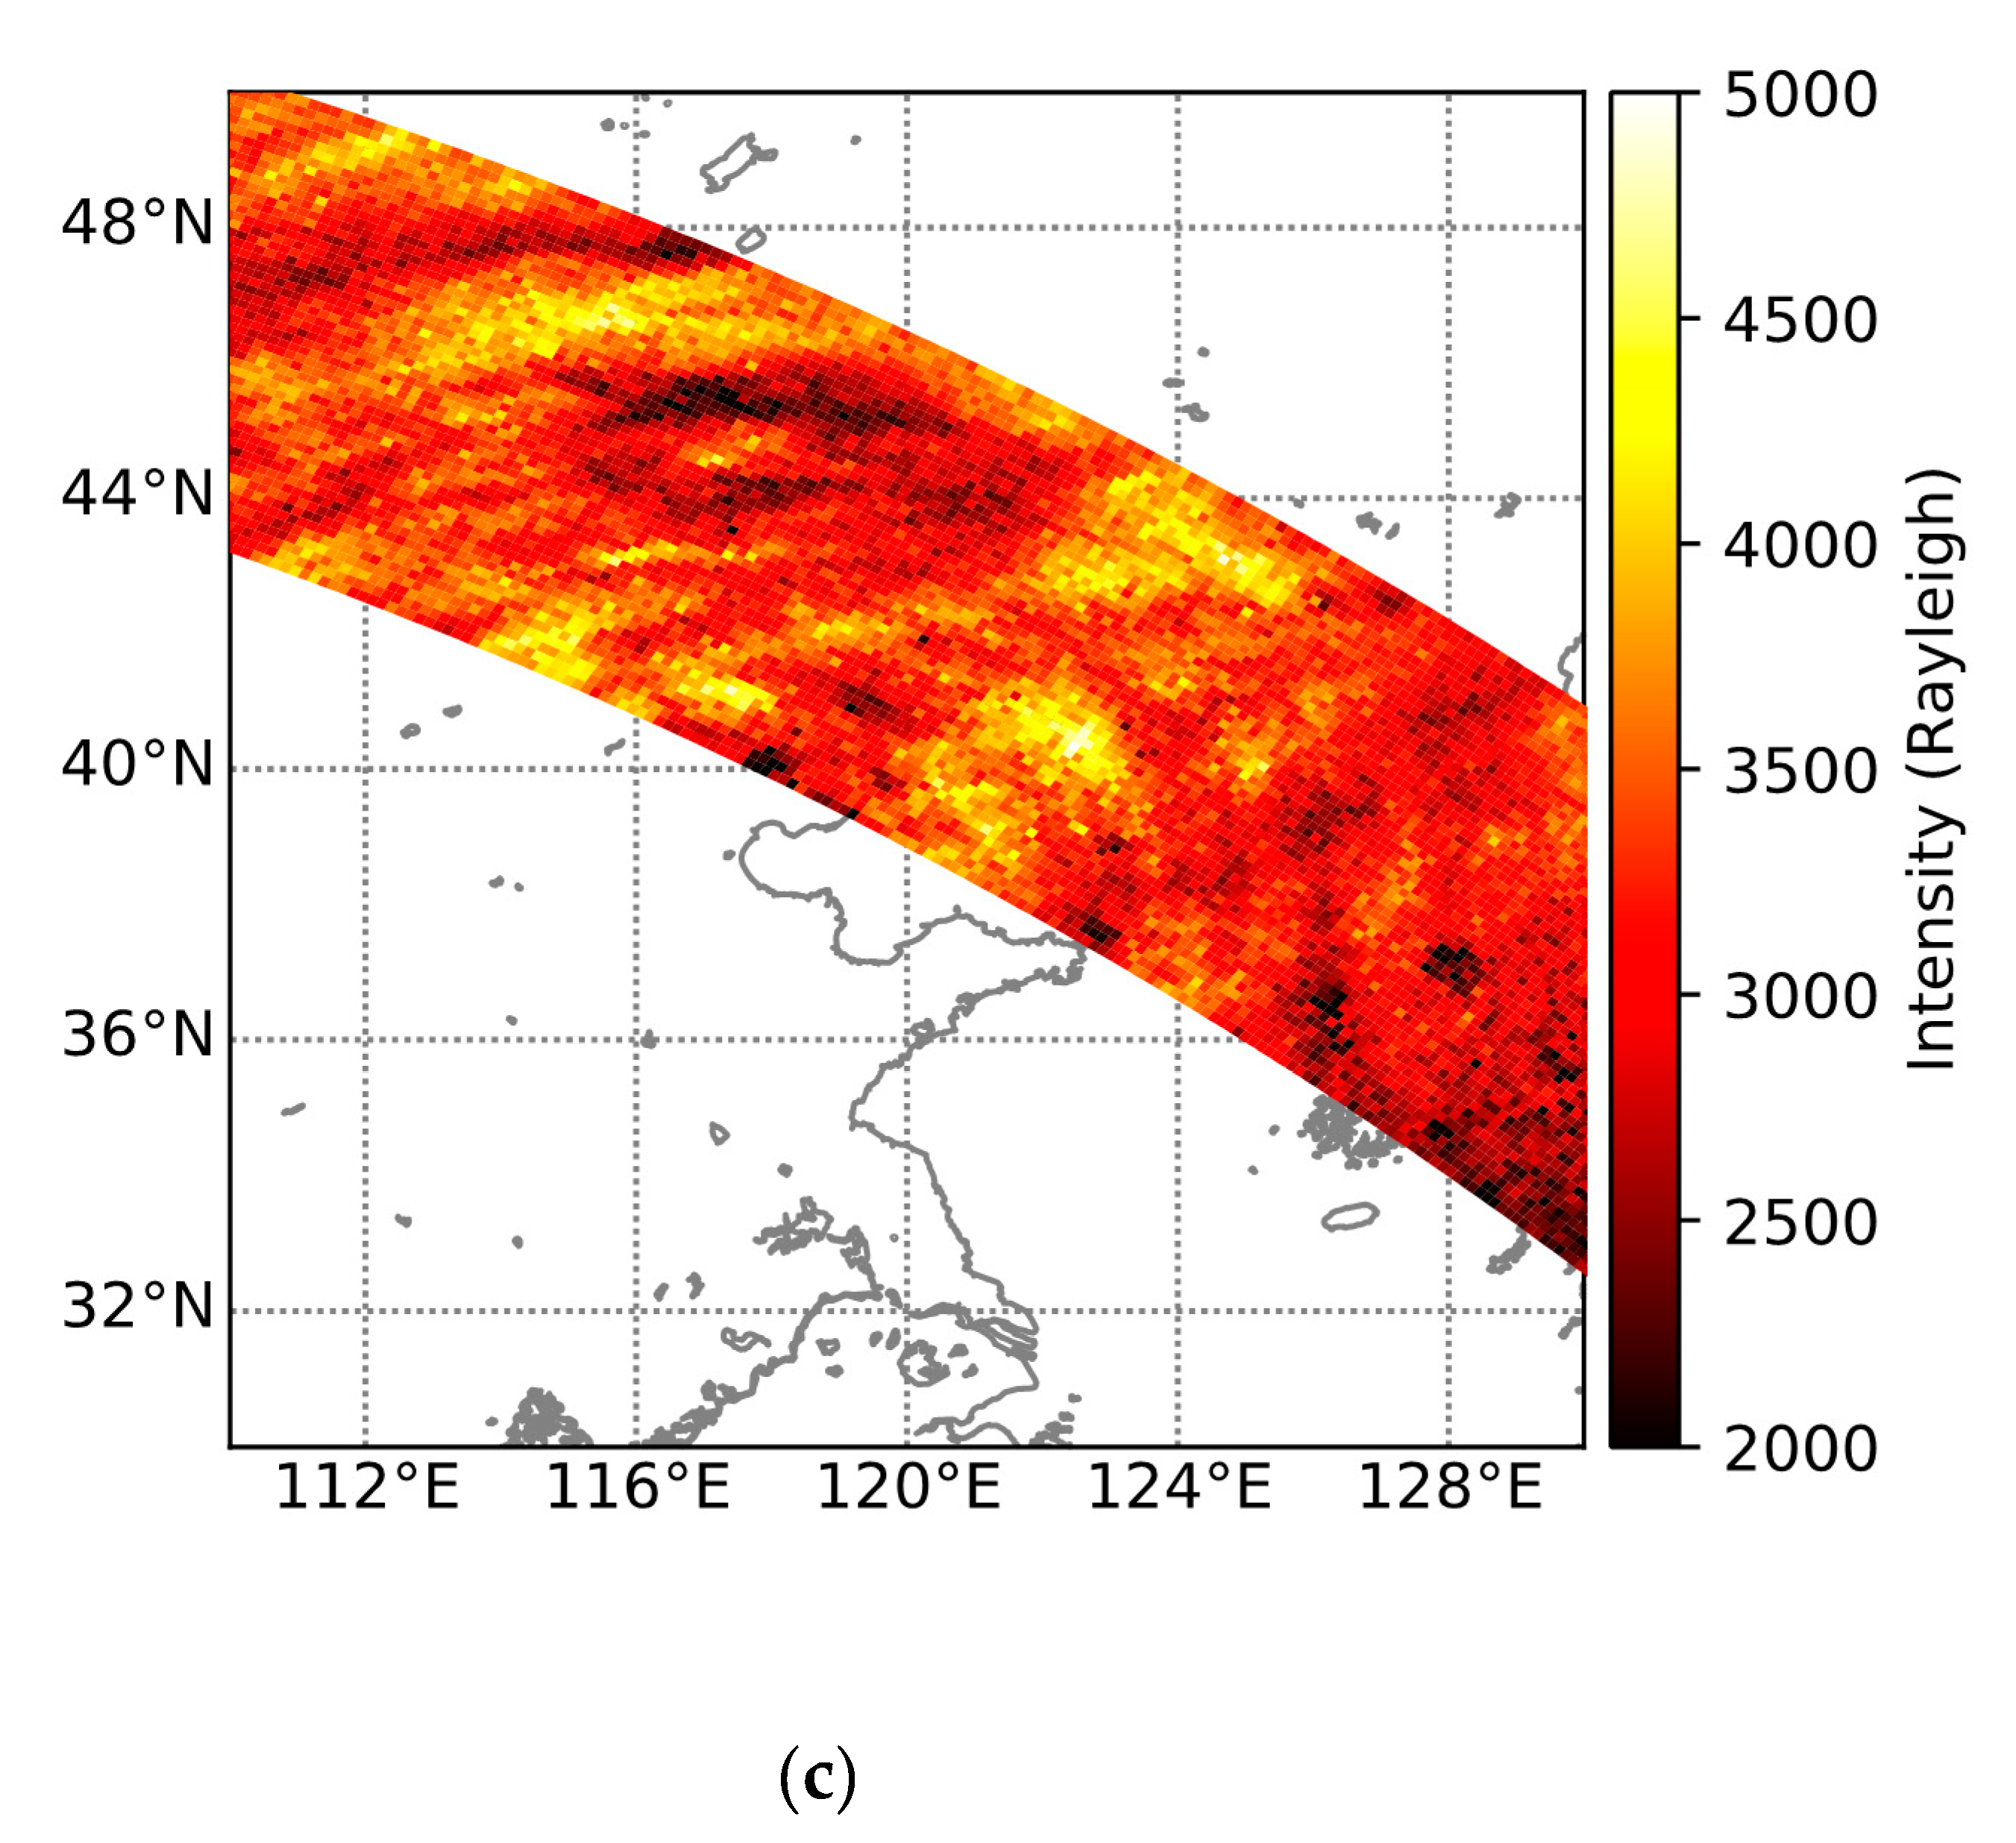
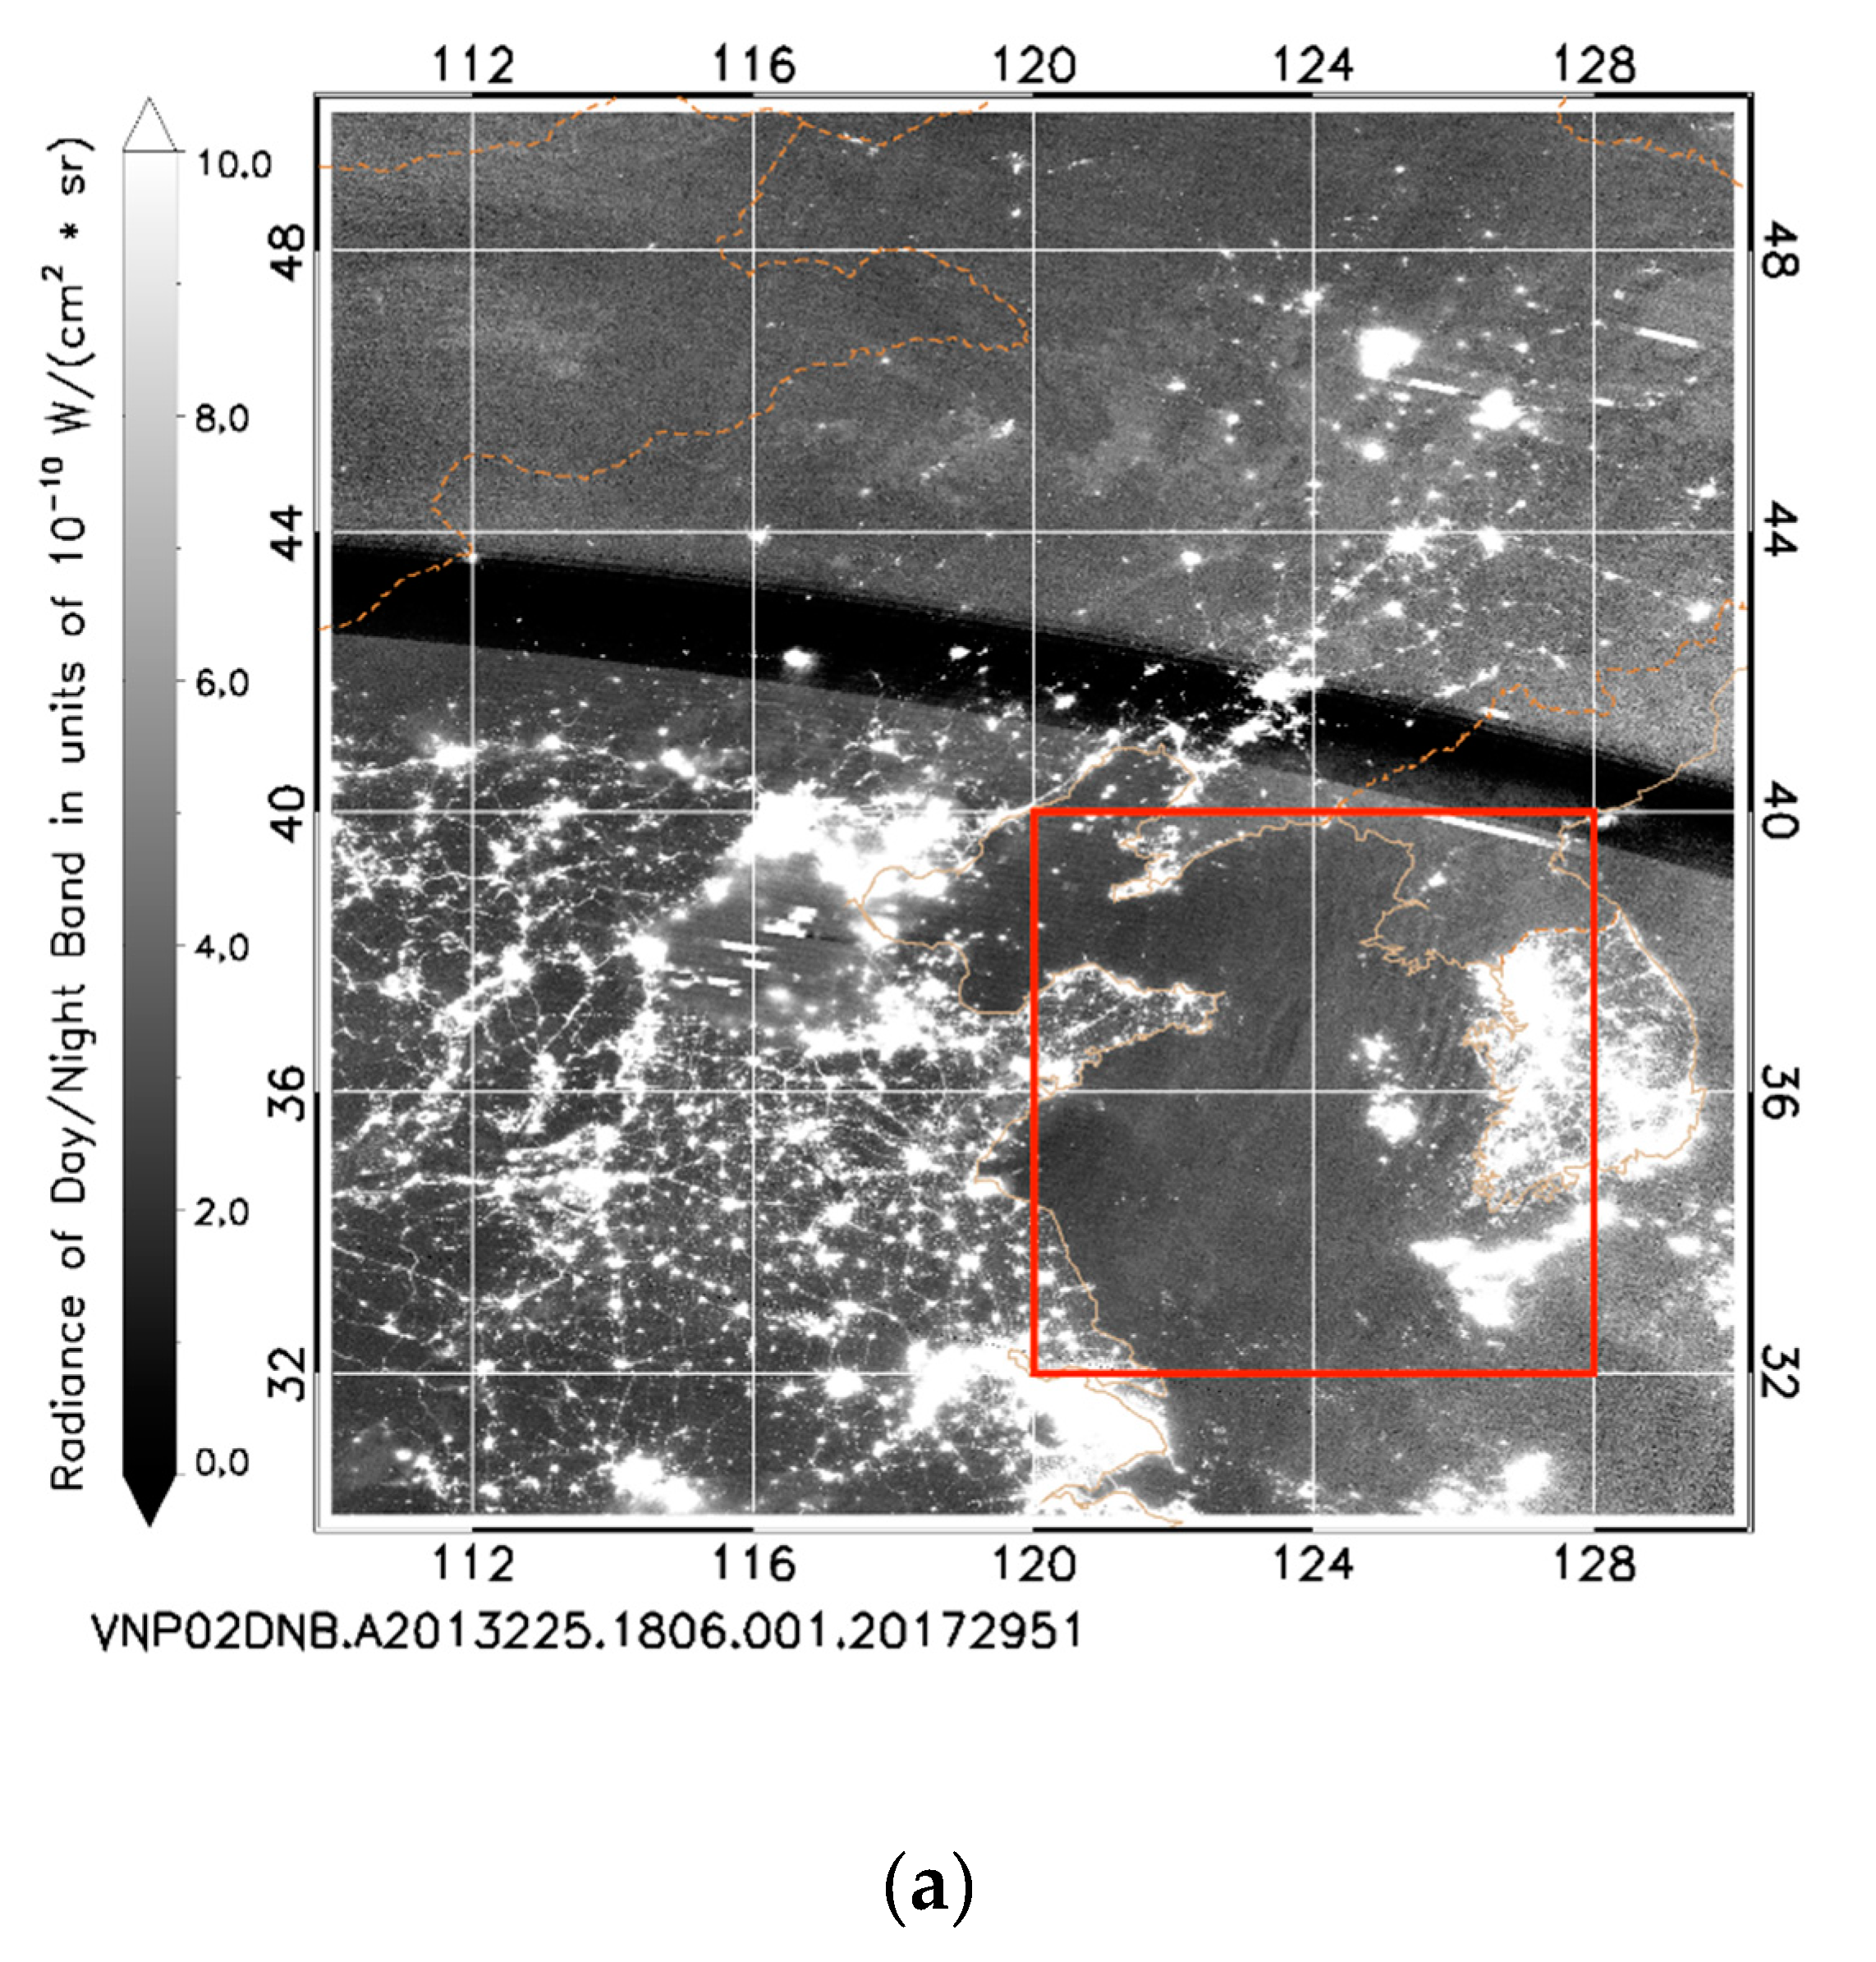
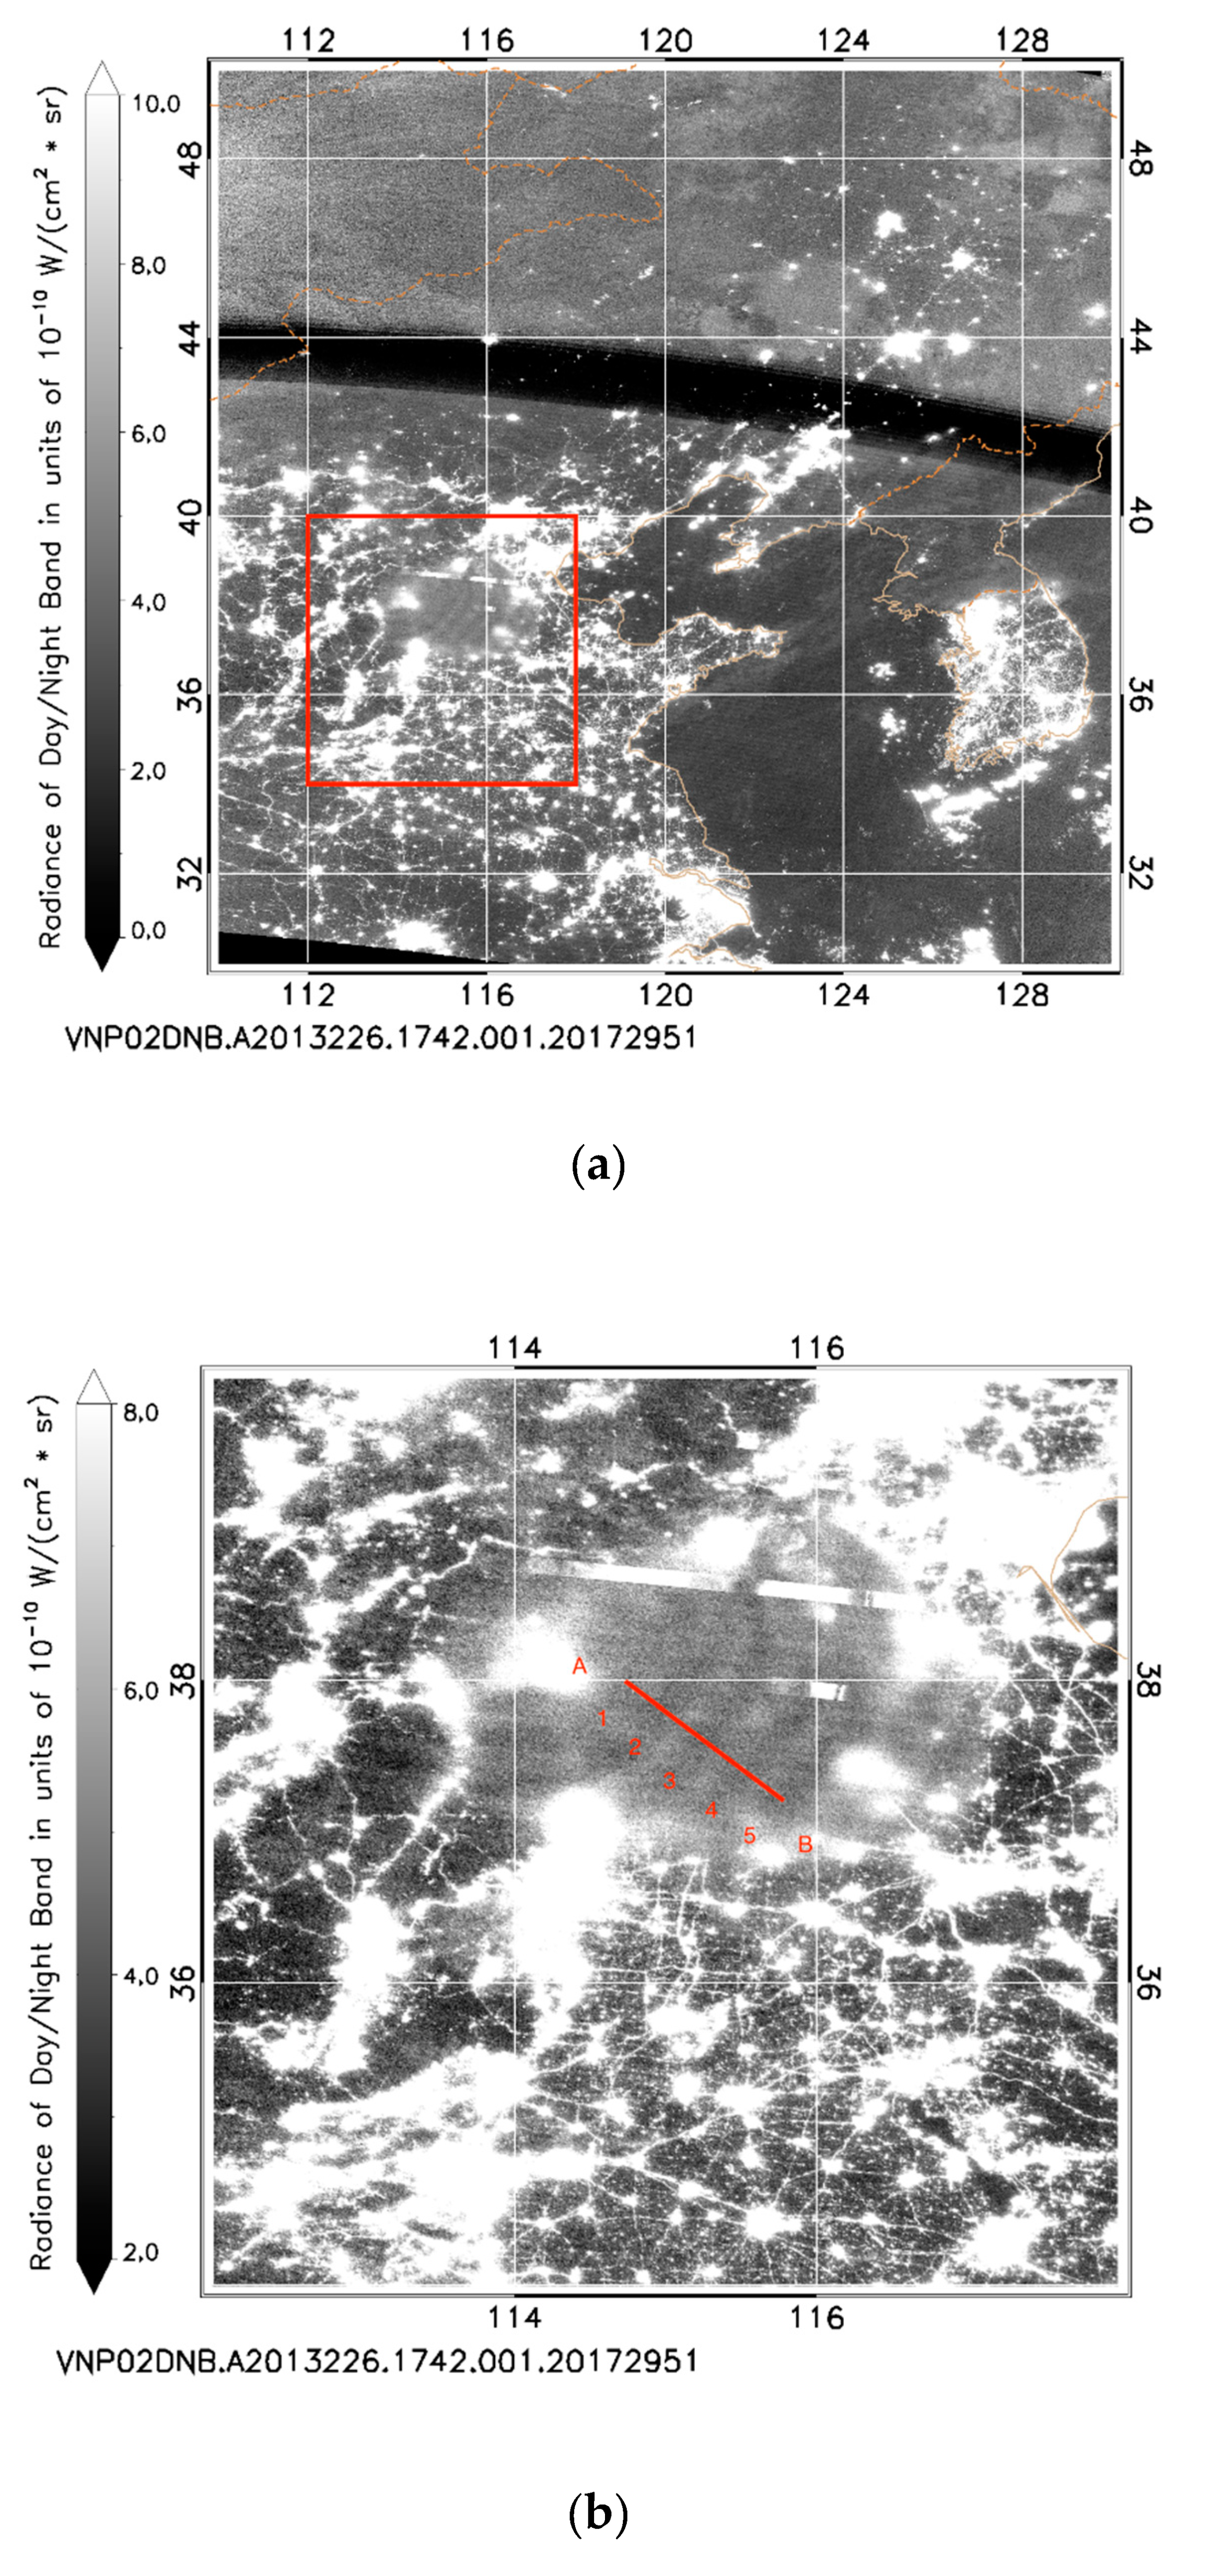
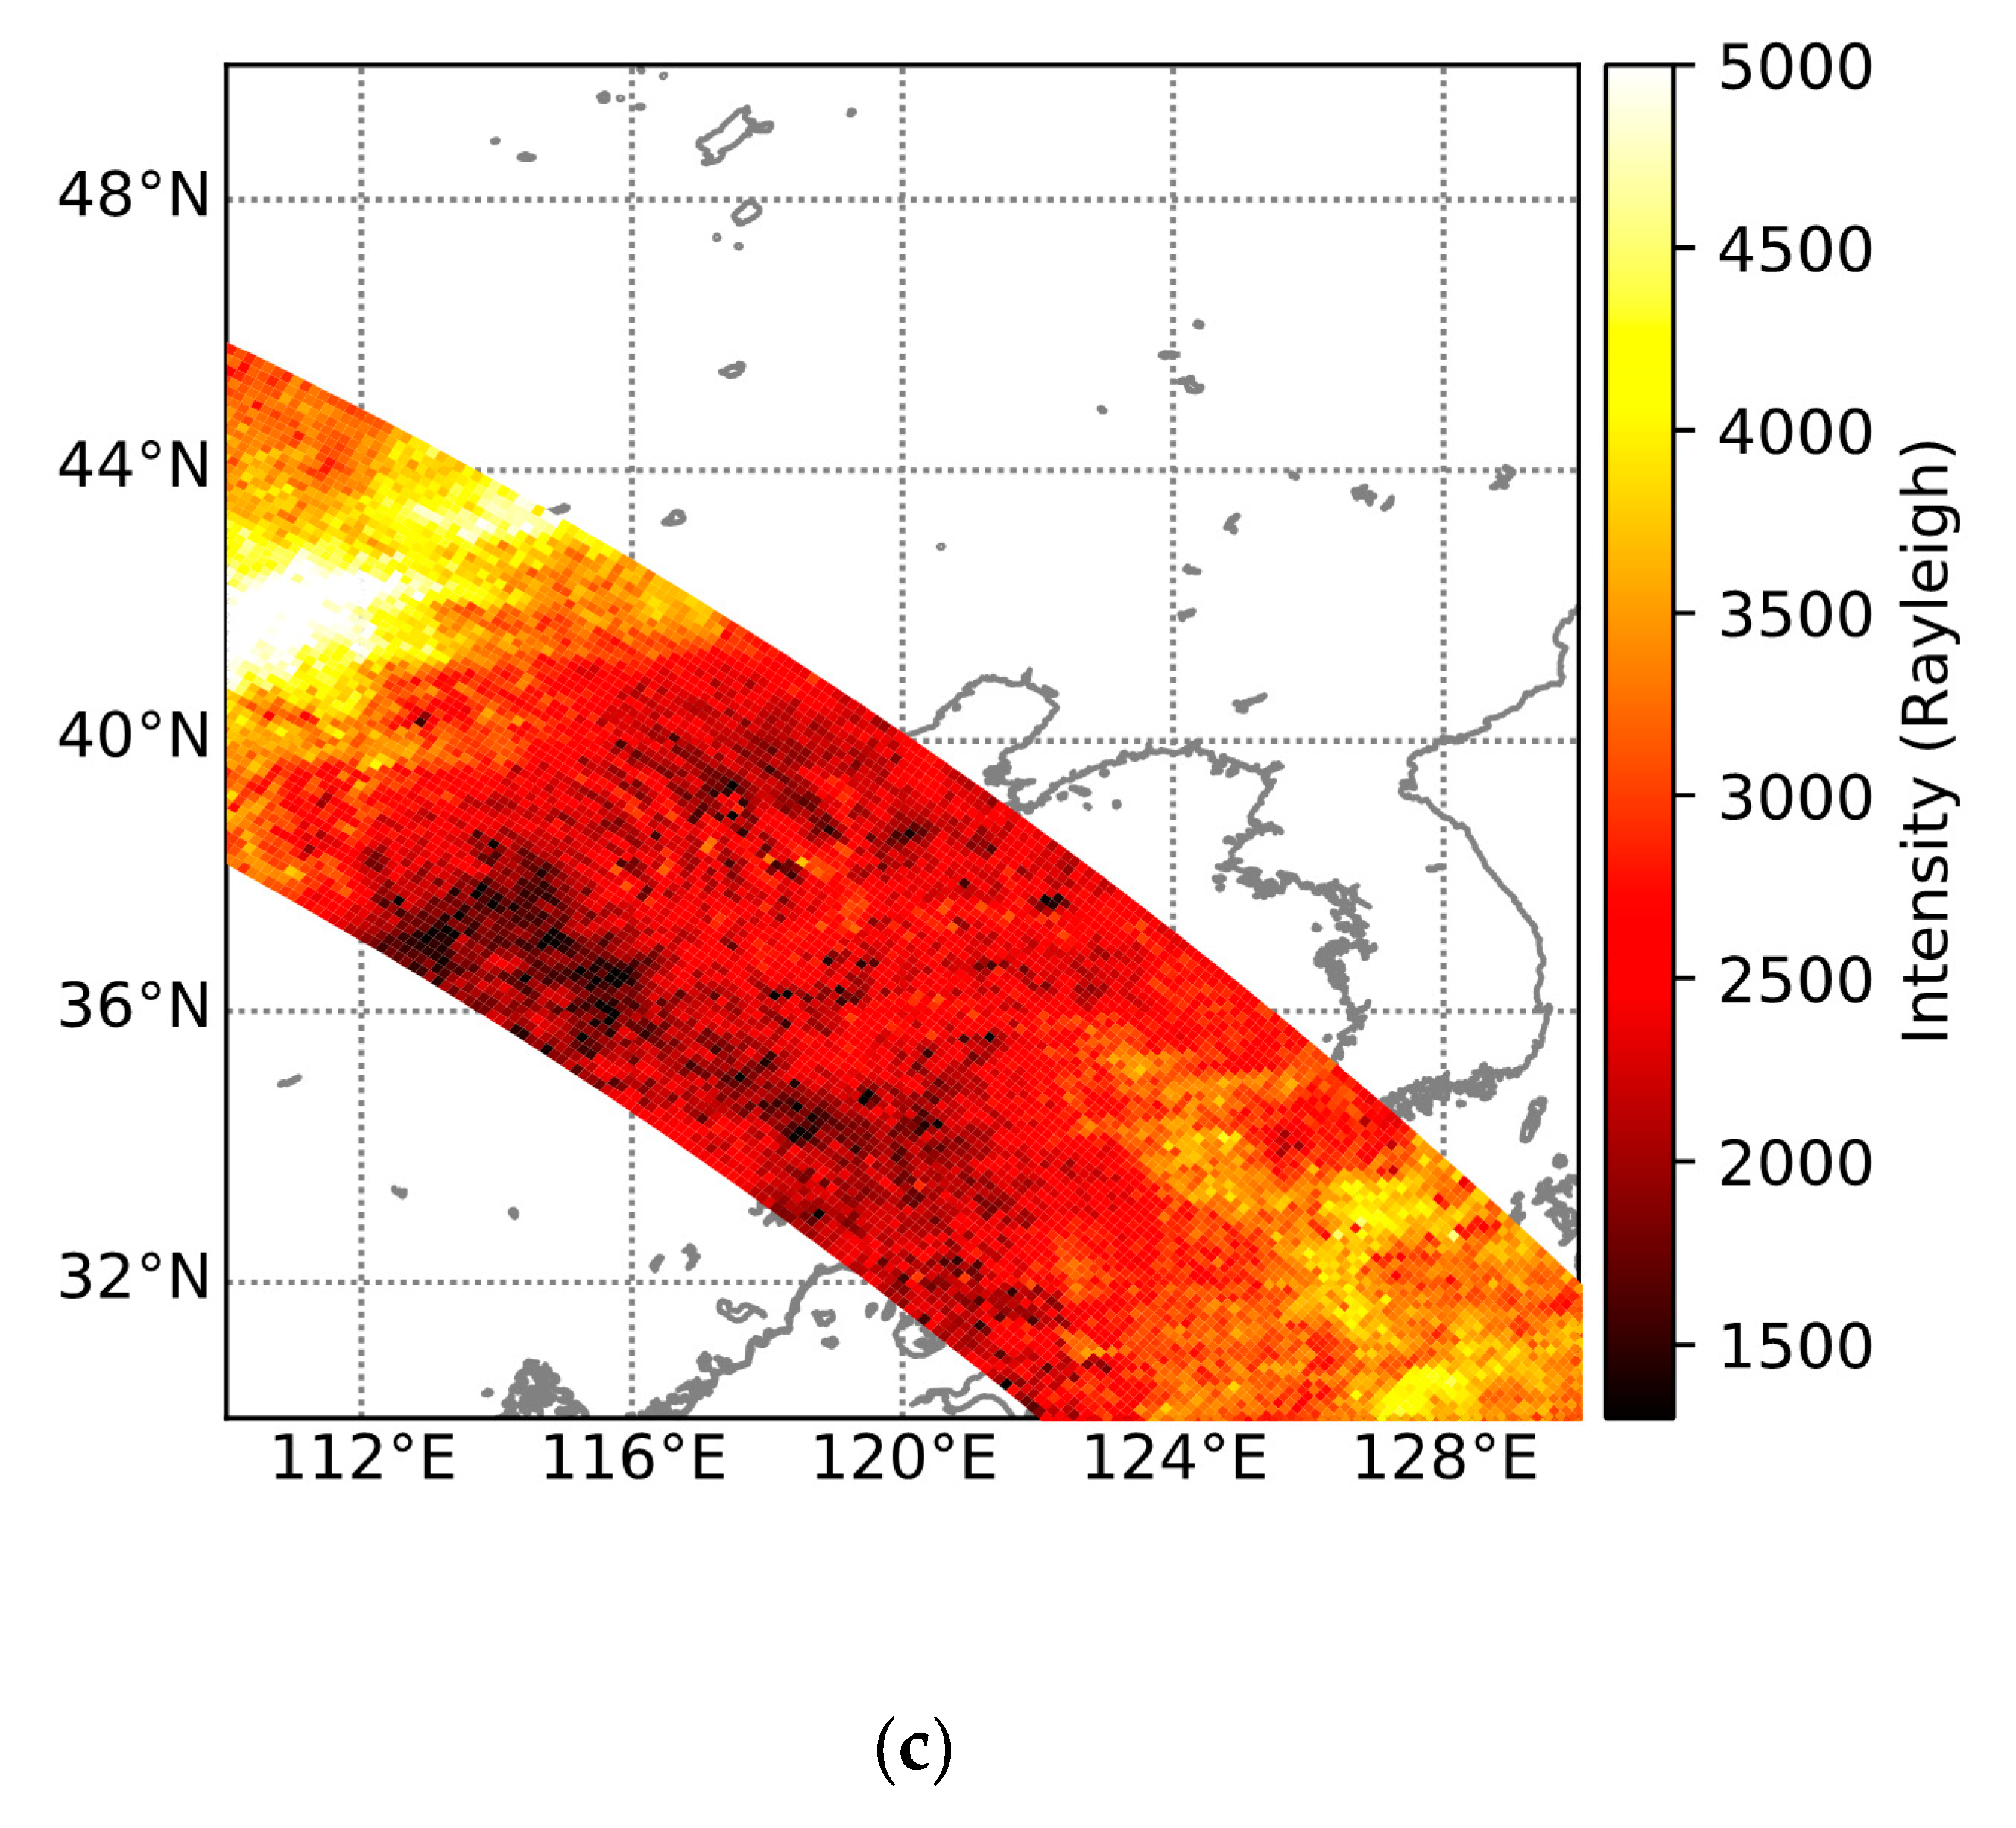
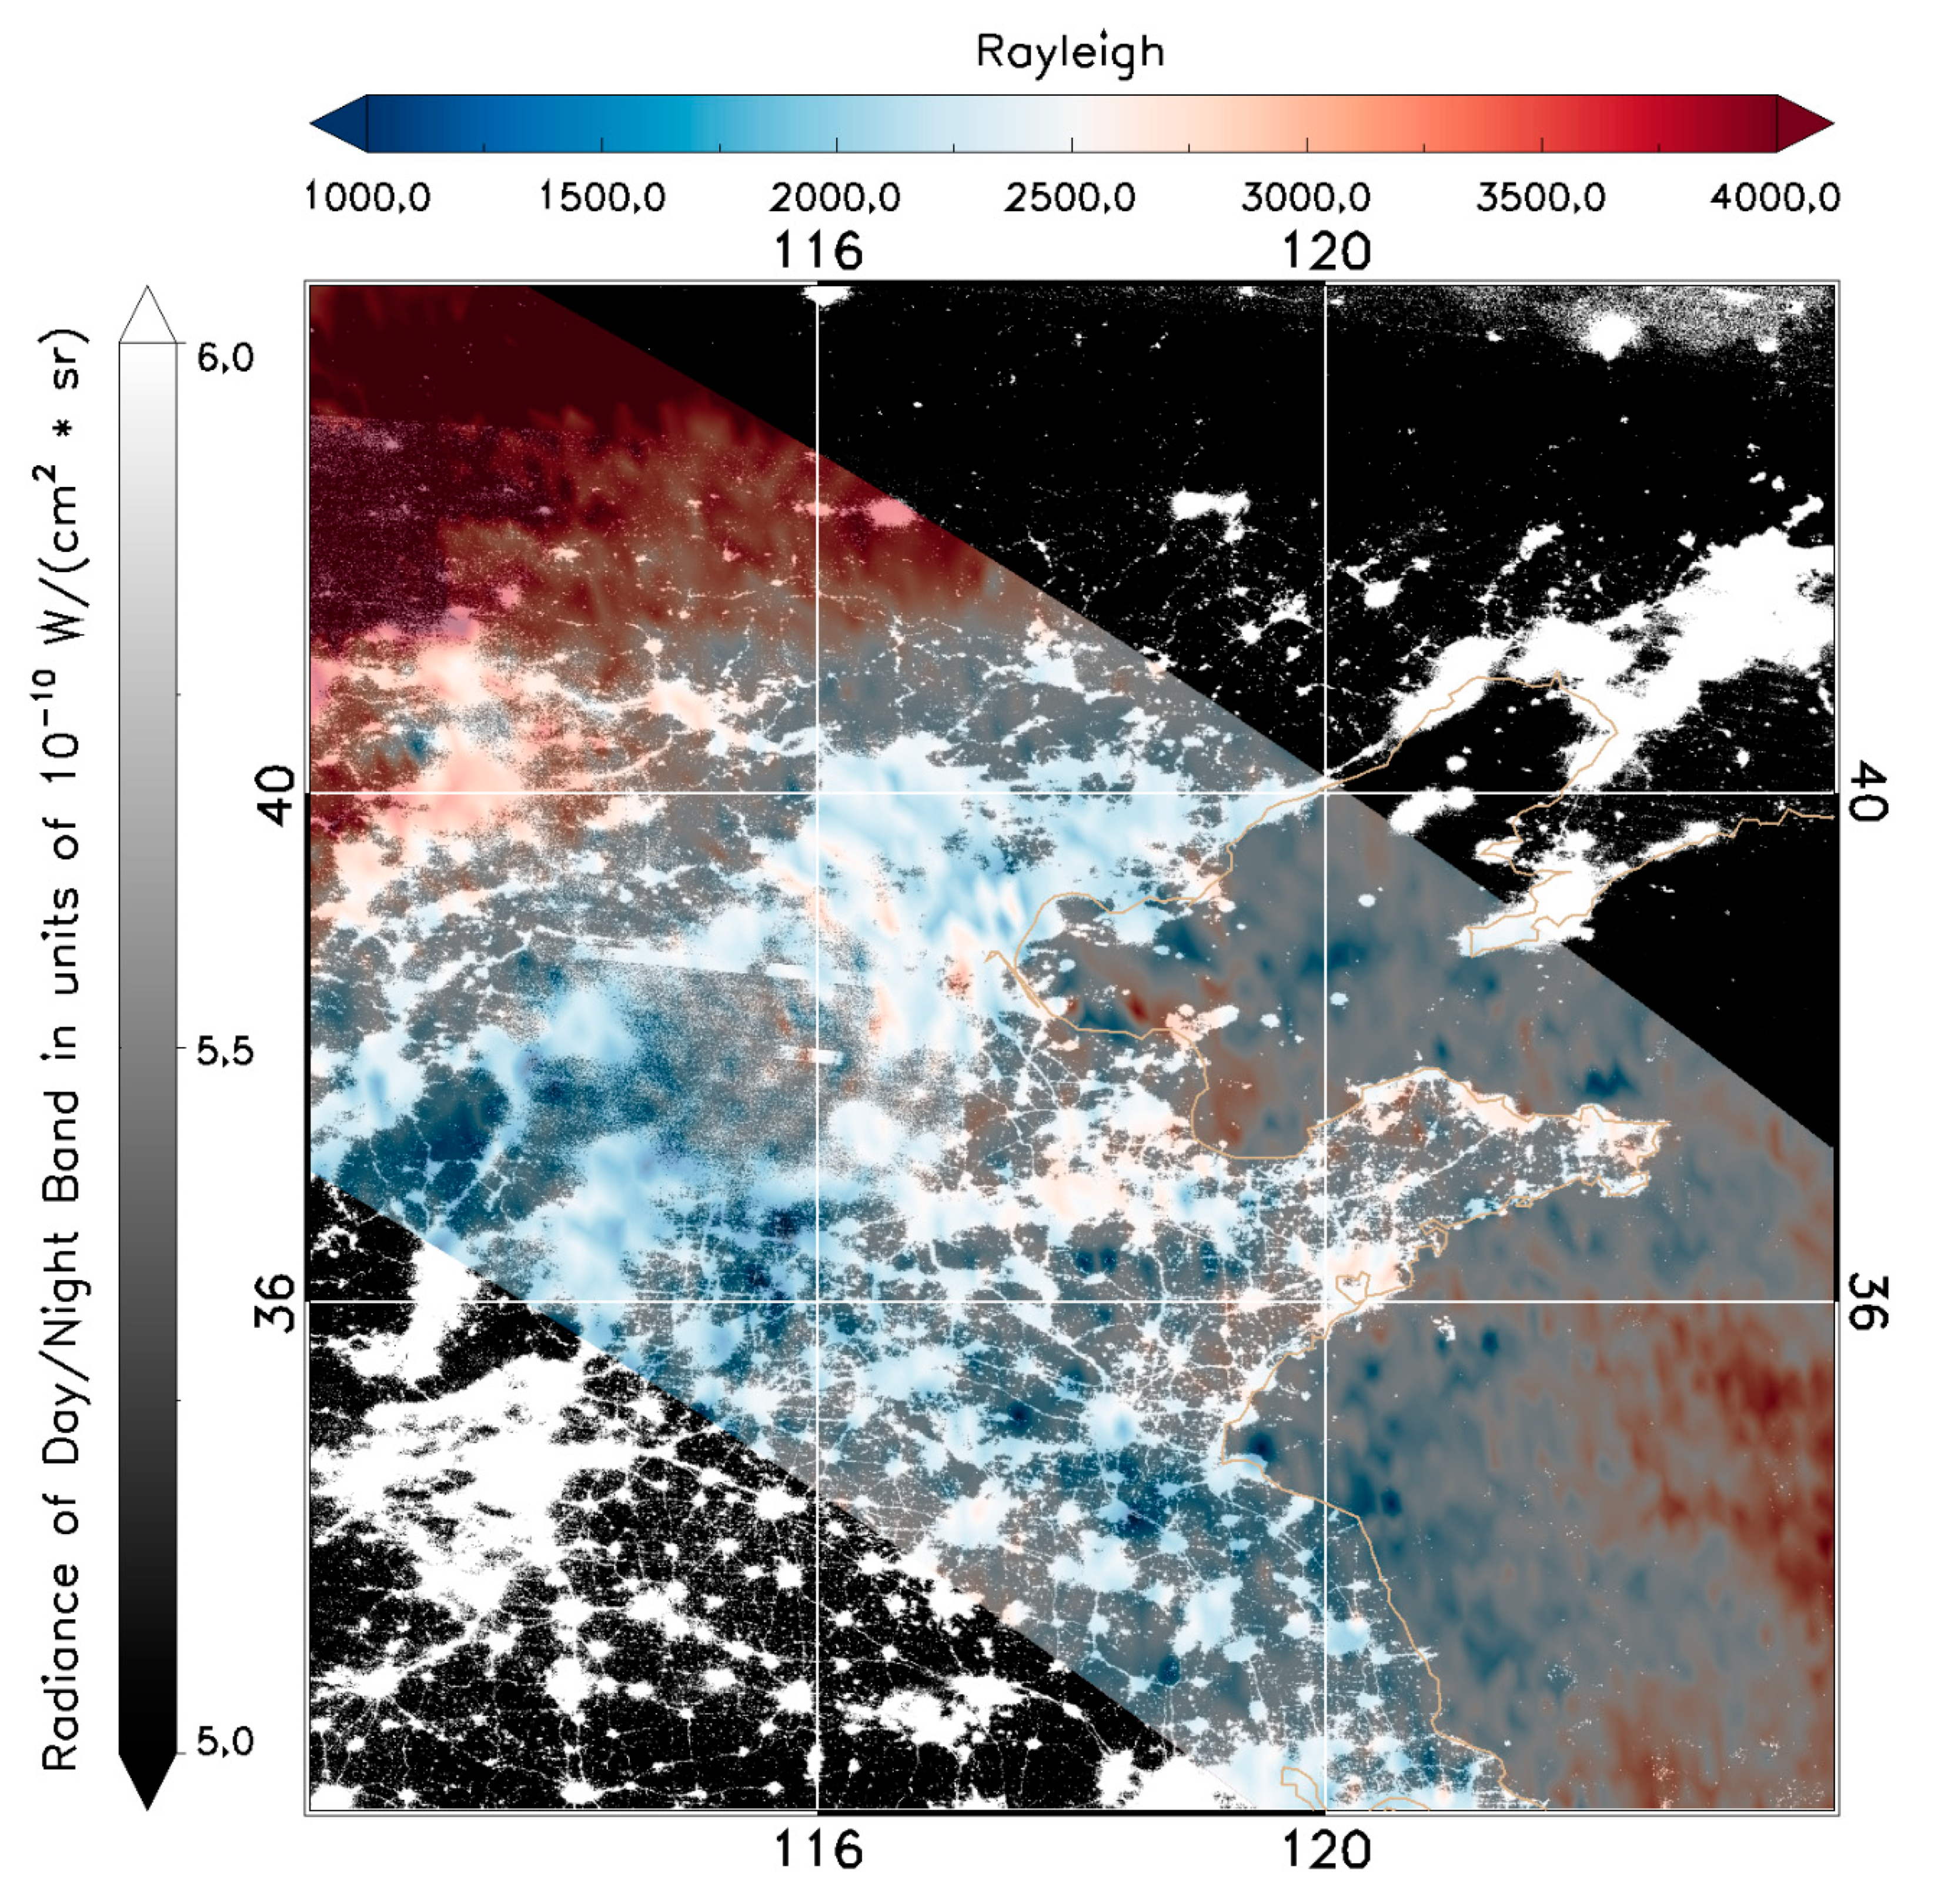
3. AGW Observations
4. Discussions and Conclusion
5. Declarations
Availability of Data and Material
Author Contributions
Funding
Acknowledgments
Conflicts of Interest
References
- Holton, J.R. An Introduction to Dynamic Meteorology, 3rd ed.; Academic Press: San Diego, CA, USA, 1992; p. 511. [Google Scholar]
- Nappo, C. An Introduction to Atmospheric Gravity Waves; Academic Press: Cambridge, MA, USA, 2002. [Google Scholar]
- Fritts, D.C.; Alexander, M.J. Gravity wave dynamics and effects in the middle atmosphere. Rev. Geophys. 2003, 41, 1. [Google Scholar] [CrossRef]
- Lindzen, R.S. Turbulence and stress owing to gravity wave and tidal breakdown. J. Geophys. Res. 1981, 86, 9707–9714. [Google Scholar] [CrossRef]
- Holton, J.R. The Role of Gravity Wave Induced Drag and Diffusion in the Momentum Budget of the Mesosphere. J. Atmos. Sci. 1982, 39, 791–799. [Google Scholar] [CrossRef]
- Holton, J.R. The influence of gravity wave breaking on the general circulation of the middle atmosphere. J. Atmos. Sci. 1983, 40, 2497–2507. [Google Scholar] [CrossRef]
- Qian, L.; Burns, A.; Yue, J. Evidence of the lower thermospheric winter-to-summer circulation from SABER CO2 observation. Geophys. Res. Lett. 2017, 44, 10,100–10,107. [Google Scholar] [CrossRef]
- Qian, L.; Solomon, S.C.; Kane, T.J. Seasonal variation of thermospheric density and composition. J. Geophys. Res. 2009, 114, A01312. [Google Scholar] [CrossRef]
- Qian, L.; Burns, A.G.; Solomon, S.C.; Wang, W. Annual/semiannual variation of the ionosphere. Geophys. Res. Lett. 2013, 40, 1928–1933. [Google Scholar] [CrossRef]
- Hines, C.O. Internal gravity waves at ionospheric heights. Can. J. Phys. 1960, 38, 1441–1481. [Google Scholar] [CrossRef]
- Vadas, S.L.; Liu, H. The Generation of Large-Scale Gravity Waves and Neutral Winds in the Thermosphere From the Dissipation of Convectively-Generated Gravity Waves. J. Geophys. Res. 2009, 114, A10310. [Google Scholar] [CrossRef]
- Azeem, I.; Yue, J.; Hoffmann, L.; Miller, S.D.; Straka, W.C., III; Crowley, G. Multi-sensor profiling of a concentric gravity wave event propagating from the troposphere to the ionosphere. Geophys. Res. Lett. 2015, 24, 7874–7880. [Google Scholar] [CrossRef]
- Vadas, S.L.; Becker, E. Numerical modeling of the Excitation, propagation, and dissipation of primary and secondary gravity waves during wintertime at McMurdo Station in the Antarctic. J. Geophys. Res. Atmos. 2018, 123, 9326–9369. [Google Scholar] [CrossRef]
- Meinel, A.B. OH emission bands in the spectrum of the night sky. Astrophys. J. 1950, 111, 555. [Google Scholar] [CrossRef]
- Chamberlain, J.W. Physics of the Aurora and Airglow; Academic Press: New York, NY, USA, 1961; p. 704. [Google Scholar]
- Ingham, M.F. The light of the night sky and the interplanetary medium. Rep. Prog. Phys. 1971, 34, 875–912. [Google Scholar] [CrossRef]
- Peterson, A.W. Airglow events visible to the naked eye. Appl. Opt. 1979, 18, 3390. [Google Scholar] [CrossRef] [PubMed]
- Peterson, A.W.; Kieffaber, L.M. Infrared photography of OH airglow structures. Nature 1973, 244, 92. [Google Scholar] [CrossRef]
- Krassovsky, V.I.; Kuzmin, K.I.; Piterskaya, N.A.; Semenov, A.I.; Shagaev, M.V.; Shefov, N.N.; Torloshelidze, T.I. Results of some airglow observations of internal gravitational waves. Planet. Space Sci. 1975, 23, 896. [Google Scholar] [CrossRef]
- Krassovsky, V.I.; Shagaev, V. On the nature of internal gravity waves observed from hydroxyl emission. Planet. Space Sci. 1977, 25, 200. [Google Scholar] [CrossRef]
- Freund, J.T.; Jacka, F. Structure in the 557.7 nm (OI) airglow. J. Atmos. Terr. Phys. 1979, 41, 25. [Google Scholar] [CrossRef]
- Armstrong, E.B. The association of visible airglow features with a gravity wave. J. Atmos. Terr. Phys. 1982, 44, 325. [Google Scholar] [CrossRef]
- Gavrilov, N.M.; Shved, G.M. Study of internal gravity waves in the lower thermosphere form observations of the nocturnal sky airglow [OI] 5577 A in Ashhabbad. Ann. Geophys. 1982, 38, 789. [Google Scholar]
- Hapgood, M.A.; Taylor, M.J. Analysis of airglow image data. Ann. Geophys. 1982, 38, 805. [Google Scholar]
- Taylor, M.J.; Hapgood, M.A.; Rothwell, P. Observations of gravity wave propagation in the OI (557.7 nm), Na (589.2 nm) and the near infra-red OH nightglow emissions. Planet Space Sci. 1987, 35, 413. [Google Scholar] [CrossRef]
- Wu, Q.; Killeen, T.L. Seasonal dependence of mesospheric gravity waves (<100 km) at Peach Mountain Observatory, Michigan. Geophys. Res. Lett. 1996, 23, 2211–2214. [Google Scholar] [CrossRef]
- Nakamura, T.; Higashikawa, A.; Tsuda, T.; Matsushita, Y. Seasonal variations of gravity wave structures in OH airglow with a CCD imager at Shigaraki. Earth Planets Space 1999, 51, 897–906. [Google Scholar] [CrossRef]
- Hecht, J.H.; Walterscheid, R.L.; Hickey, M.P.; Franke, S.J. Climatology and modeling of quasi-monochromatic atmospheric gravity waves observed over Urbana, Illinois. J. Geophys. Res. 2001, 106, 5181–5195. [Google Scholar] [CrossRef]
- Ejiri, M.K.; Shiokawa, K.; Ogawa, T.; Igarashi, K.; Nakamura, T.; Tsuda, T. Statistical study of short-period gravity waves in OH and OI nightglow images at two separated sites. J. Geophys. Res. 2003, 108, 4679. [Google Scholar] [CrossRef]
- Suzuki, S.; Shiokawa, K.; Hosokawa, K.; Nakamura, K.; Hocking, W.K. Statistical characteristics of polar cap mesospheric gravity waves observed by an all-sky airglow imager at Resolute Bay. Can. J. Geophys. Res. 2009, 114, A01311. [Google Scholar] [CrossRef]
- Nielsen, K.; Taylor, M.J.; Hibbins, R.E.; Jarvis, M.J. Climatology of short-period mesospheric gravity waves over Halley, Antarctica (76° S, 27° W). J. Atmos. Sol. Terr. Phys. 2009, 71, 991–1000. [Google Scholar] [CrossRef]
- Yue, J.; Nakamura, T.; She, C.-Y.; Weber, M.; Lyons, W.; Li, T. Seasonal and local time variability of ripples from airglow imager observations in US and Japan. Ann. Geophys. 2010, 28, 1401–1408. [Google Scholar] [CrossRef]
- Narayanan, V.L.; Gurubaran, S. Statistical characteristics of high frequency gravity waves observed by OH airglow imaging from Tirunelveli (8.7° N). J. Atmos. Sol. Terr. Phys. 2013, 92, 43–50. [Google Scholar] [CrossRef]
- Li, Q.; Xu, J.; Liu, X.; Yuan, W.; Chen, J. Characteristics of mesospheric gravity waves over the southeastern Tibetan Plateau region. J. Geophys. Res. Space Phys. 2016, 121, 9204–9221. [Google Scholar] [CrossRef]
- Taylor, M.J.; Hapgood, M.A. Identification of a thunderstorm as a source of short period gravity waves in the upper atmospheric night-glow emissions. Planet. Space Sci. 1988, 36, 975–985. [Google Scholar] [CrossRef]
- Sentman, D.D.; Wescott, E.M.; Picard, R.H.; Winick, J.R.; Nielsen, H.C.S.; Dewan, E.M.; Moudry, D.R.; Sabbas, F.T.S.; Heavner, M.J.; Morrill, J. Simultaneous observations of mesospheric gravity waves and sprites generated by a midwesterm thunderstorm. J. Atmos. Terr. Phys. 2003, 65, 537–550. [Google Scholar] [CrossRef]
- Suzuki, S.; Shiokawa, K.; Otsuka, Y.; Ogawa, T.; Nakamura, K.; Nakamura, T. A concentric gravity wave structure in the mesospheric airglow images. J. Geophys. Res. 2007, 112, D02102. [Google Scholar] [CrossRef]
- Yue, J.; Vadas, S.L.; She, C.-Y.; Nakamura, T.; Reising, S.C.; Liu, H.-L.; Stamus, P.; Krueger, D.A.; Lyons, W.; Li, T. Concentric gravity waves in the mesosphere generated by deep convective plumes in the lower atmosphere near Fort Collins, Colorado. J. Geophys. Res. 2009, 114, D06104. [Google Scholar] [CrossRef]
- Vadas, S.; Yue, J.; Nakamura, T. Mesospheric concentric gravity waves generated by multiple convection storms over the North America Great Plain. J. Geophys. Res. Atmos. 2012, 117, D07113. [Google Scholar] [CrossRef]
- Xu, J.; Li, Q.; Yue, J.; Hoffmann, L.; Straka, W.C., III; Wang, C.; Liu, M.; Yuan, W.; Han, S.; Miller, S.D.; et al. Concentric gravity waves over northern China observed by an airglow imager network and satellites. J. Geophys. Res. Atmos. 2015, 120, 11058–11078. [Google Scholar] [CrossRef]
- Smith, S.; Baumgardner, J.; Mendillo, M. Evidence of mesospheric gravity–waves generated by orographic forcing in the troposphere. Geophys. Res. Lett. 2009, 36, 8. [Google Scholar] [CrossRef]
- Suzuki, S.; Vadas, S.L.; Shiokawa, K.; Otsuka, Y.; Kawamura, S.; Murayama, Y. Typhoon-induced concentric airglow structures in the mesopause region. Geophys. Res. Lett. 2013, 40, 5983–5987. [Google Scholar] [CrossRef]
- Miller, S.D.; Straka, W., III; Mills, S.P.; Elvidge, C.D.; Lee, T.F.; Solbrig, J.; Walther, A.; Heidinger, A.K.; Weiss, S.C. Illuminating the capabilities of the Suomi NPP VIIRS Day/Night Band. Remote Sens. 2013, 5, 6717–6766. [Google Scholar] [CrossRef]
- Miller, S.D.; Mills, S.P.; Elvidge, C.D.; Lindsey, D.T.; Lee, T.F.; Hawkins, J.D. Suomi satellite brings to light a unique frontier of nighttime environmental sensing capabilities. Proc. Nat. Acad. Sci. USA 2012, 109, 15706–15711. [Google Scholar] [CrossRef] [PubMed]
- Miller, S.D.; Straka, W.C.; Yue, J.; Smith, S.M.; Alexander, M.J.; Hoffmann, L.; Setvak, M.; Partain, P.T. Upper atmospheric gravity wave details revealed in nightglow satellite imagery. Proc. Nat. Acad. Sci. USA 2015, 112, E6728–E6735. [Google Scholar] [CrossRef] [PubMed]
- Yue, J.; Miller, S.; Hoffmann, L.; Straka, W.C., III. Stratospheric and mesospheric concentric gravity waves over tropical cyclone Mahasen: Joint AIRS and VIIRS satellite observations. J. Atmos. Solar Terra. Phys. 2014, 119, 83–90. [Google Scholar] [CrossRef]
- Lai, C.; Yue, J.; Xu, J.; Straka, W.; Miller, S., III; Liu, X. Suomi NPP VIIRS/DNB imagery of nightglow gravity waves from various sources over China. Adv. Space Res. 2017, 59, 1951–1961. [Google Scholar] [CrossRef]
- Miller, S.D.; Straka, W., III; Yue, J.; Seaman, C.; Xu, S.; Elvidge, C.; Hoffmann, L.; Azeem, I. The Dark Side of Hurricane Matthew—Unique Perspectives from the Day/Night Band. Bull. Am. Meteorol. Soc. 2018, 99, 2561–2574. [Google Scholar] [CrossRef]
- Xu, S.; Yue, J.; Xue, X.; Vadas, S.; Miller, S.; Azeem, I.; Straka, W.; Hoffmann, L.; Zhang, S. Dynamical coupling between Hurricane Matthew and the Middle to Upper Atmosphere via gravity waves. J. Geophys. Res. Space 2019, 124. [Google Scholar] [CrossRef]
- Su, Y.; Yue, J.; Liu, X.; Miller, S.D.; Straka, W.C.; Smith, S.; Guo, D.; Guo, S. Mesospheric bore observations using Suomi NPP VIIRS DNB during 2013–2017. Remote Sens. 2018, 10, 1935. [Google Scholar] [CrossRef]
- Li, Q.; Xu, J.; Yue, J.; Liu, X.; Yuan, W. Evolution of a mesospheric bore in a duct observed by ground-based double-layer imagers and satellite observations over the Tibetan Plateau Region. J. Geophys. Res. Space 2019, 124, 1377–1388. [Google Scholar] [CrossRef]
- Sakanoi, T.; Akiya, Y.; Yamazaki, A.; Otsuka, Y.; Saito, A.; Yoshikawa, I. Imaging observation of the Earth’s mesosphere, thermosphere and ionosphere by VISI of ISS-IMAP on the international space station. IEEJ Trans. Fundam. Mat. 2011, 131, 983–988. [Google Scholar] [CrossRef]
- Akiya, Y.; Saito, A.; Sakanoi, T.; Hozumi, Y.; Yamazaki, A.; Otsuka, Y.; Nishioka, M.; Tsugawa, T. First spaceborne observation of the entire concentric airglow structure caused by tropospheric disturbance. Geophys. Res. Lett. 2014, 41, 6943–6948. [Google Scholar] [CrossRef]
- Perwitasari, S.; Sakanoi, T.; Yamazaki, A.; Otsuka, Y.; Hozumi, Y.; Akiya, Y.; Saito, A.; Shiokawa, K.; Kawamura, S. Coordinated airglow observations between IMAP/VISI and a ground-based all-sky imager on concentric gravity wave in the mesopause. J. Geophys. Res. Space Phys. 2015, 120, 9706–9721. [Google Scholar] [CrossRef]
- Perwitasari, S.; Sakanoi, T.; Nakamura, T.; Ejiri, M.K.; Tsutsumi, M.; Tomikawa, Y.; Otsuka, Y.; Yamazaki, A.; Saito, A. Three years of concentric gravity wave variability in the mesopause as observed by IMAP/VISI. Geophys. Res. Lett. 2016, 43, 11–528. [Google Scholar] [CrossRef]
- Hozumi, Y.; Saito, A.; Sakanoi, T.; Yamazaki, A.; Hosokawa, K. Mesospheric bores at southern midlatitudes observed by ISS-IMAP/VISI: A first report of an undulating wave front. Atmos. Chem. Phys. 2018, 18, 16399–16407. [Google Scholar] [CrossRef]
- Hozumi, Y.; Saito, A.; Sakanoi, T.; Yamazaki, A.; Hosokawa, K.; Nakamura, T. Geographical and seasonal variability of mesospheric bores observed from the International Space Station. J. Geophys. Res. Space Phys. 2019, 124, 3775–3785. [Google Scholar] [CrossRef]
- Alexander, M.J.; Holton, J.R.; Durran, D.R. The gravity wave response above deep convection in a squall line simulation. J. Atmos. Sci. 1995, 52, 2212–2226. [Google Scholar] [CrossRef]
- Bankert, R.L.; Solbrig, J.E.; Lee, T.F.; Miller, S.D. Automated lightning flash detection in nighttime visible satellite data. Weather Forecast. 2011, 26, 399–408. [Google Scholar] [CrossRef]


| Technique | Dates | Spectrum | Horizontal Resolution | Swath Width | Latitude Range | |
|---|---|---|---|---|---|---|
| VISI | Imaging spectrograph | 9/2012–8/2015 | 630–762 nm | 14–16 km | 600 km | 54° S–54° N |
| VIIRS/DNB | Radiometer | 11/2011–present | 505–890 nm | 0.75 km | 3000 km | 90° S–90° N |
| 8 August 2013 | 9 August 2013 | 12 August 2013 | 13 August 2013 | 14 August 2013 | |
|---|---|---|---|---|---|
| VISI | 40 km | 52 km | 68 km | 47 km | 53 km |
| DNB | 20 km | 22–30 km | 33 km | 22 km | 21 km |
© 2019 by the authors. Licensee MDPI, Basel, Switzerland. This article is an open access article distributed under the terms and conditions of the Creative Commons Attribution (CC BY) license (http://creativecommons.org/licenses/by/4.0/).
Share and Cite
Yue, J.; Perwitasari, S.; Xu, S.; Hozumi, Y.; Nakamura, T.; Sakanoi, T.; Saito, A.; Miller, S.D.; Straka, W.; Rong, P. Preliminary Dual-Satellite Observations of Atmospheric Gravity Waves in Airglow. Atmosphere 2019, 10, 650. https://doi.org/10.3390/atmos10110650
Yue J, Perwitasari S, Xu S, Hozumi Y, Nakamura T, Sakanoi T, Saito A, Miller SD, Straka W, Rong P. Preliminary Dual-Satellite Observations of Atmospheric Gravity Waves in Airglow. Atmosphere. 2019; 10(11):650. https://doi.org/10.3390/atmos10110650
Chicago/Turabian StyleYue, Jia, Septi Perwitasari, Shuang Xu, Yuta Hozumi, Takuji Nakamura, Takeshi Sakanoi, Akinori Saito, Steven D. Miller, William Straka, and Pingping Rong. 2019. "Preliminary Dual-Satellite Observations of Atmospheric Gravity Waves in Airglow" Atmosphere 10, no. 11: 650. https://doi.org/10.3390/atmos10110650
APA StyleYue, J., Perwitasari, S., Xu, S., Hozumi, Y., Nakamura, T., Sakanoi, T., Saito, A., Miller, S. D., Straka, W., & Rong, P. (2019). Preliminary Dual-Satellite Observations of Atmospheric Gravity Waves in Airglow. Atmosphere, 10(11), 650. https://doi.org/10.3390/atmos10110650