Article

Characterization of Multitermination CG Flashes Using a 3D Lightning Mapping System (FALMA)

Department of Electrical, Electronic and Computer Engineering, Gifu University, Gifu 5011193, Japan
*
Author to whom correspondence should be addressed.
Atmosphere 2019, 10(10), 625; https://doi.org/10.3390/atmos10100625
Submission received: 10 September 2019 / Revised: 11 October 2019 / Accepted: 14 October 2019 / Published: 16 October 2019
(This article belongs to the Section Meteorology)

Abstract

:
We characterized 205 multiple-termination negative cloud-to-ground (CG) lightning flashes that were imaged by the Fast Antenna Lightning Mapping Array (FALMA) in Japan during the summer of 2017. The parameters we used included termination number, termination distance, fork height, return stroke (RS) number, the interval between the first RS of each termination, the shortest time difference between the strokes at different terminations, and the first RS intensities separated by termination occurrence orders. It was found that the multiple-termination flashes (MTFs) had a termination number ranging from 2 to 5, with the majority (148/205) at 2. The termination distance (with high probability) was between 2 and 4 km, with 10 out of 359 MTF termination distances being longer than 10 km. For most MTFs (146/205), their leader forks for different terminations occurred at a height between 4 and 6 km, indicating that the fork process mainly occurred inside the cloud. The RS number of the MTFs ranged from 2 to 18, with an arithmetic mean (AM) value of 5.8. The interval between the first RS of each termination in the MTFs ranged from 0.5 to 965.3 ms, with an AM value of 225.6 ms, while the shortest time difference between the strokes at different terminations had an AM value of 189.6 ms. The intensity of the first stroke in each termination tended to decrease with increasing termination occurrence orders.

1. Introduction

It has been known from the early days of lightning research that a significant fraction of cloud-to-ground (CG) flashes could produce multiple terminations on the ground [1,2,3,4,5,6]. If such multiple terminations all hit on an electrically connected system (e.g., an electric power grid), they could collectively cause additional problems for lightning protection. To achieve better lightning protection for widely distributed but electrically connected systems, it is necessary to understand the characteristics of CG flashes with multiple terminations. So far, CG flashes with multiple terminations have been documented in the literature either using optical observation systems such as still cameras and ordinary and high-speed video cameras [7] or using lightning location systems such as the National Lightning Detection Network [8,9]. Optical observation systems have the advantage of recording two-dimensional images of lightning channels, but they also have the following limitations: (1) only the lightning channel below the cloud base can be imaged; (2) the distances between multiple ground terminations are usually unknown; and (3) the time resolution is not good unless a high-speed video with a particularly high frame rate is used. Lightning location systems have the advantage of huge datasets and good time resolution. However, since conventional lightning location systems usually have a location error larger than a few hundred meters, multiple ground terminations with a distance less than a few hundred meters cannot be identified. Recently, using an array of fast antennas, we developed a three-dimensional (3D) lightning mapping system called the Fast Antenna Lightning Mapping Array (FALMA) [10], which allowed us to locate lightning termination points with an accuracy of about 20 m [10]. From FALMA data, we were able to not only estimate the distance between multiple ground terminations but also study how the leaders of different ground terminations are formed even inside the cloud. Using these advantages, we performed a study on 205 negative multiple-termination flashes (MTFs). In this paper, we report on our results and compare them to those published in the literature.

2. Observations and Data Processing
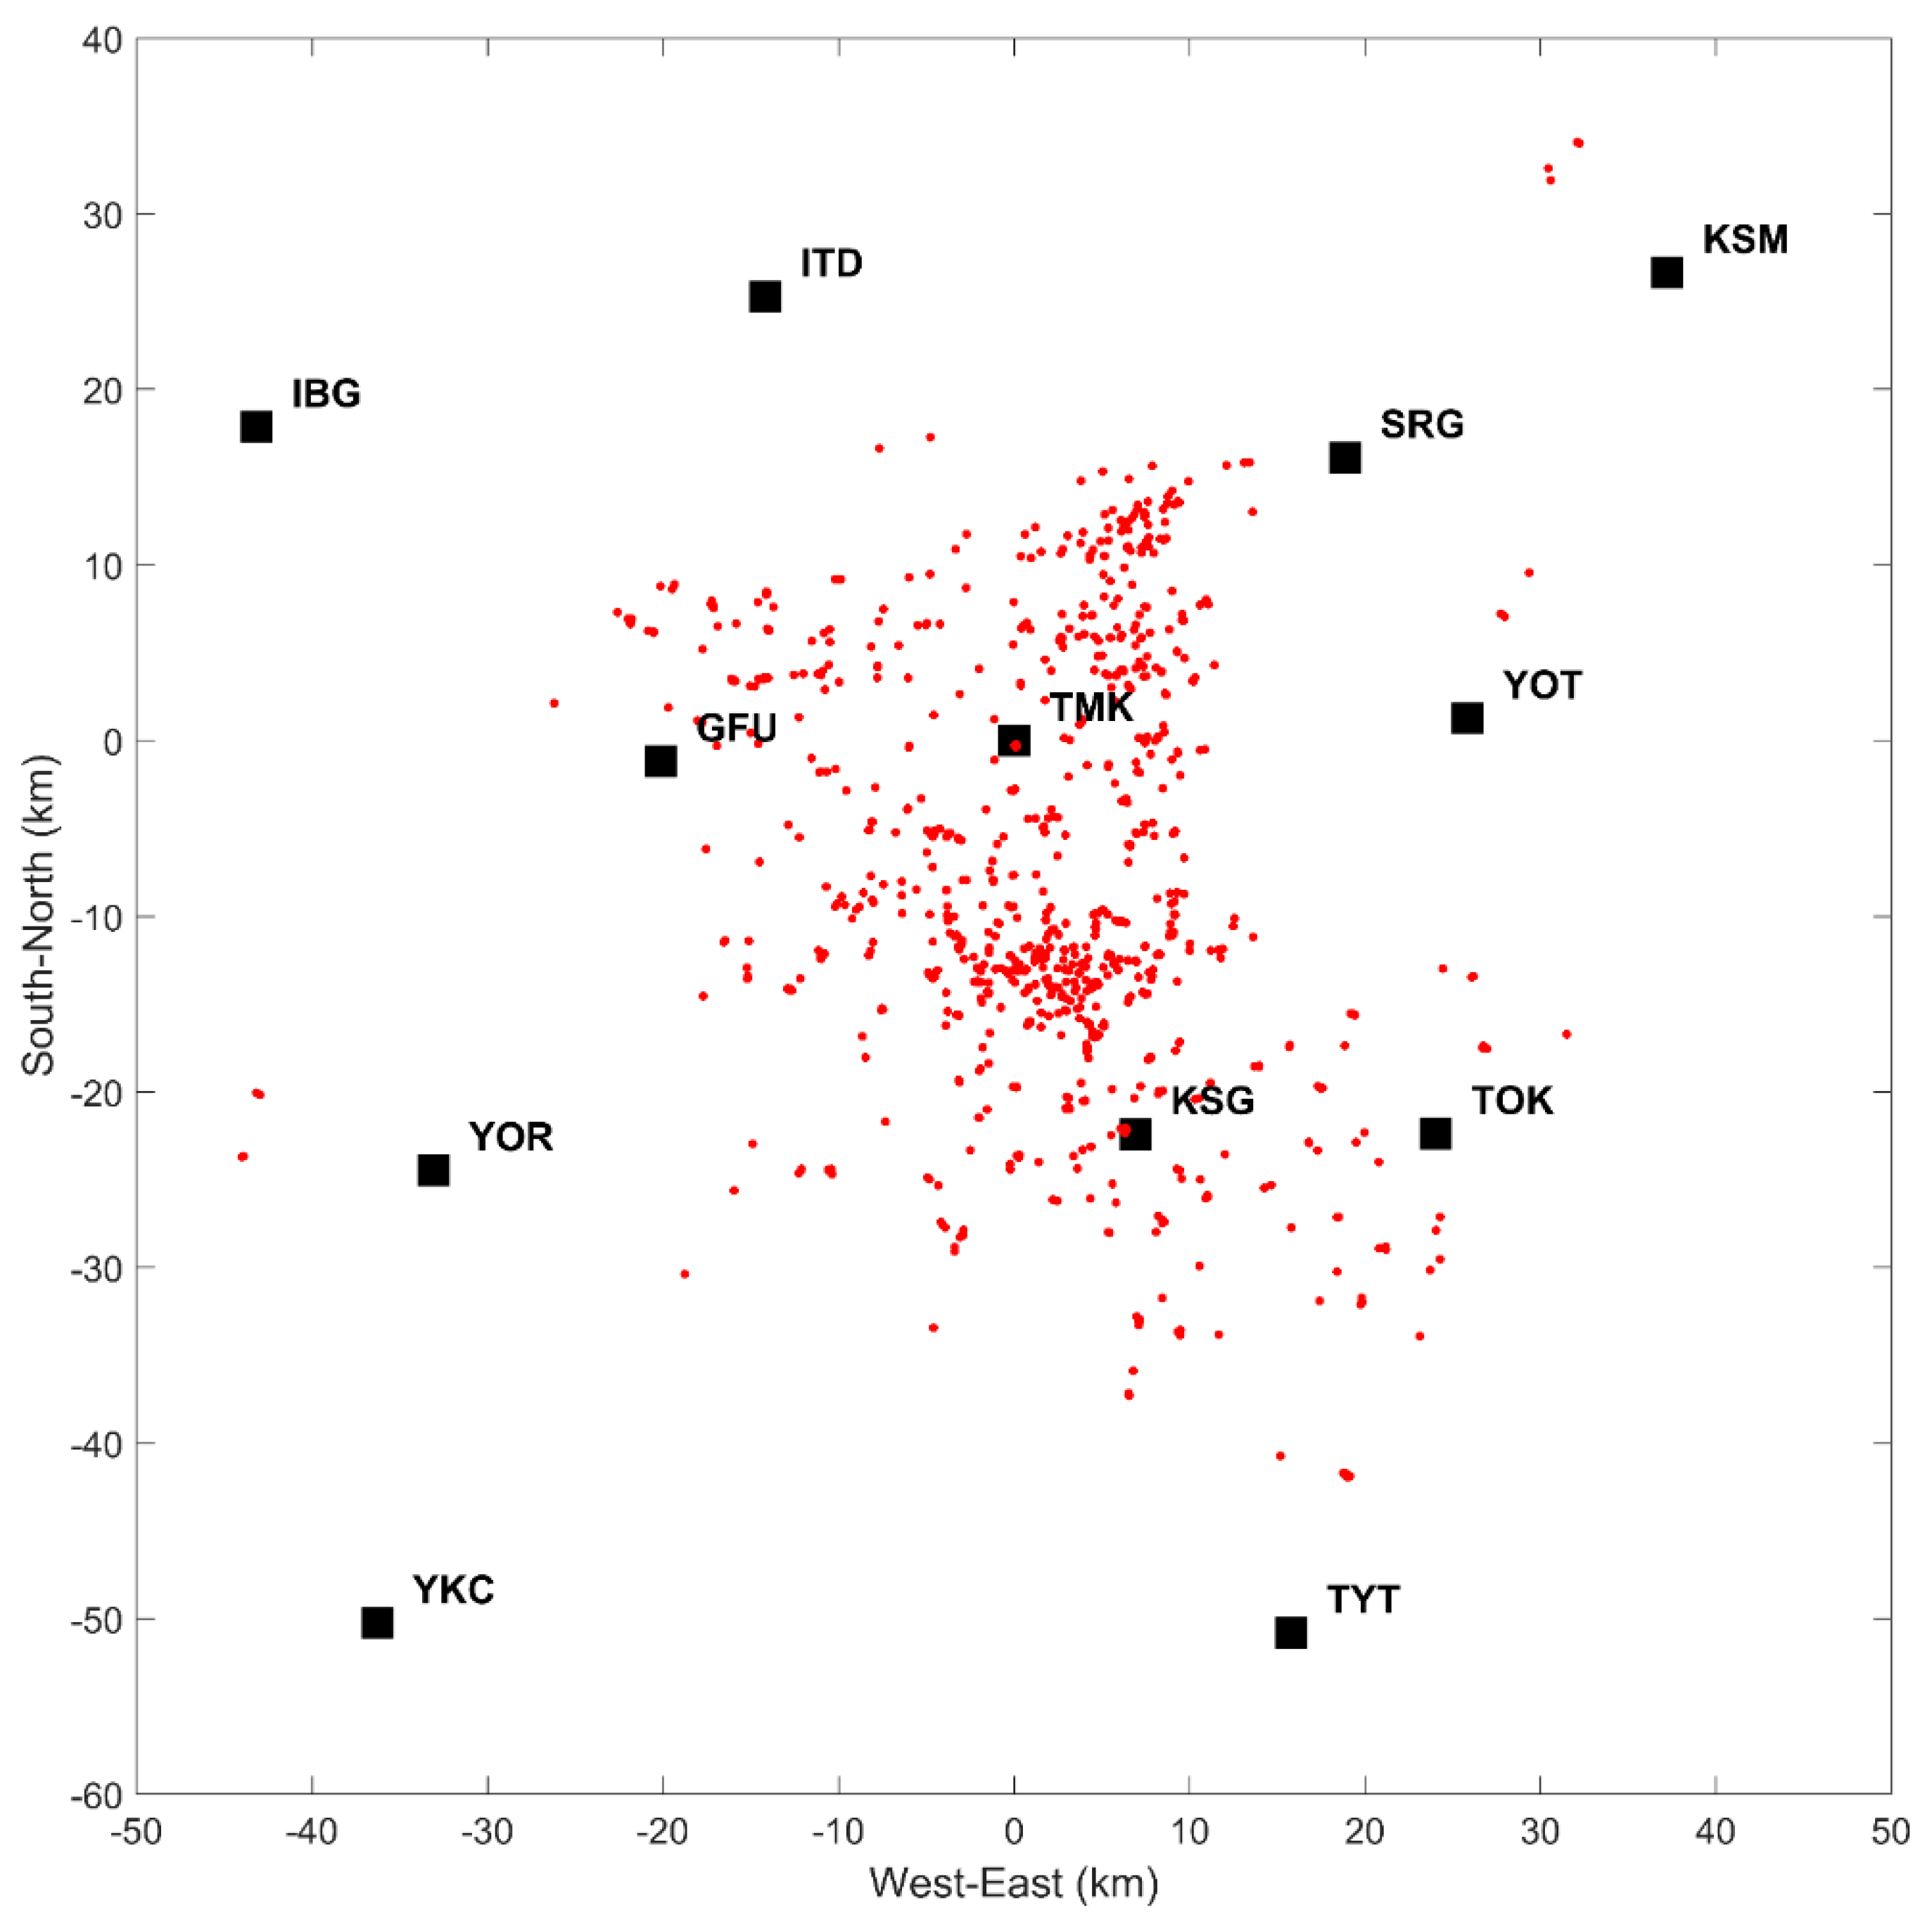
2.1. Observations

Data in this study were obtained in 2017 using a 3D lightning mapping system called FALMA [10]. In the summer of 2017, FALMA consisted of 12 sites covering an area of about 90 km × 90 km in the central part of Japan, as shown in Figure 1. Each site was equipped with a fast antenna and a data-acquiring system. The fast antennas had a time constant of about 200 μs and received radio waves in the frequency range of about 500 Hz to 500 kHz. In the data acquiring system, a commercially available analog-to-digital converter was used. In order to achieve a high timing accuracy, the converter sampling rate was set at 25 megasamples per second (MS/s). The time-of-arrival technique was applied for locating the pulses on the electric field change (E-change) waveforms (obtained with the 12 fast antennas). As shown in Reference [10], using FALMA, we could do 3D mapping for all lightning occurring inside a network, and the estimated horizontal location accuracy for locating return strokes (RSs) was around 20 m. So far, the data obtained by FALMA in 2017 have been used for several scientific studies [11,12,13].

2.2. Data Processing

As shown in Reference [14], the phenomena of multiple terminations can be roughly grouped into two cases. In the first case, the multiple terminations are produced by different strokes contained in a flash. This kind of flash is usually termed a multiple-termination flash. In the second case, the multiple terminations are associated with only one RS whose E-change waveform contains multiple sharply rising pulses. This kind of stroke is usually termed a multiple termination stroke. Given that the time difference between multiple pulses in one RS can be less than 1 µs [15], FALMA might be incapable of resolving these pulses temporally. In this study, we intentionally avoided the second case. To do so, we first identified RSs from the E-change waveforms using a time window of 100 μs and a certain combination of RS pulse parameters (e.g., rise time, half-peak width, and fall time). Consequently, we could not separate two or more RS pulses, if any, occurring within a time of 100 μs. Then, based on the RS locations, we roughly selected CG flashes with possible multiple terminations. These two processes were similar to the method in Reference [16], where multiple RSs within 500 ms and 10 km were grouped into one multiple-termination CG flash. According to our experience, although some multiple terminations were grouped into one flash, they were actually produced by different flashes. To reduce errors, we further examined whether or not their leaders shared the same discharge channel in the cloud. Finally, out of about 2662 negative CG flashes occurring over four thunderstorm days, we identified 205 MTFs that contained a total of 1180 RSs. The locations of these RSs are shown by red dots in Figure 1.
Figure 2 presents an example of an identified MTF that had two ground terminations (marked with a triangle and squares). Figure 2a is its E-change waveform recorded at the site named TOK. As can be identified from this E-change waveform, this flash contained seven RSs. Figure 2b is the pulse-located height with time. The color of the dots represents the time. As seen in Figure 2b, this flash started at a height of about 9 km above sea level and lasted about 2.3 s. From the pulse locations shown in Figure 2c–f, the first stroke terminated at one place (marked by a triangle), and the remaining six strokes terminated at another place (marked by a square). Correspondingly, the first stroke and each of the remaining six strokes in the time sequence plots of Figure 2a,b are marked by a triangle and a square, respectively. There was a horizontal distance of about 6 km between the two termination points. As seen in Figure 2c, the leaders leading to the two terminations forked at a height of about 7 km.
To characterize the 205 MTFs, we chose the following seven parameters, with four (parameters 1–4) of them having previously been used by other authors and the remaining three (parameters 5–7) being counted for the first time in this study. We believe that the new parameters are important to properly address the issues of MTFs:
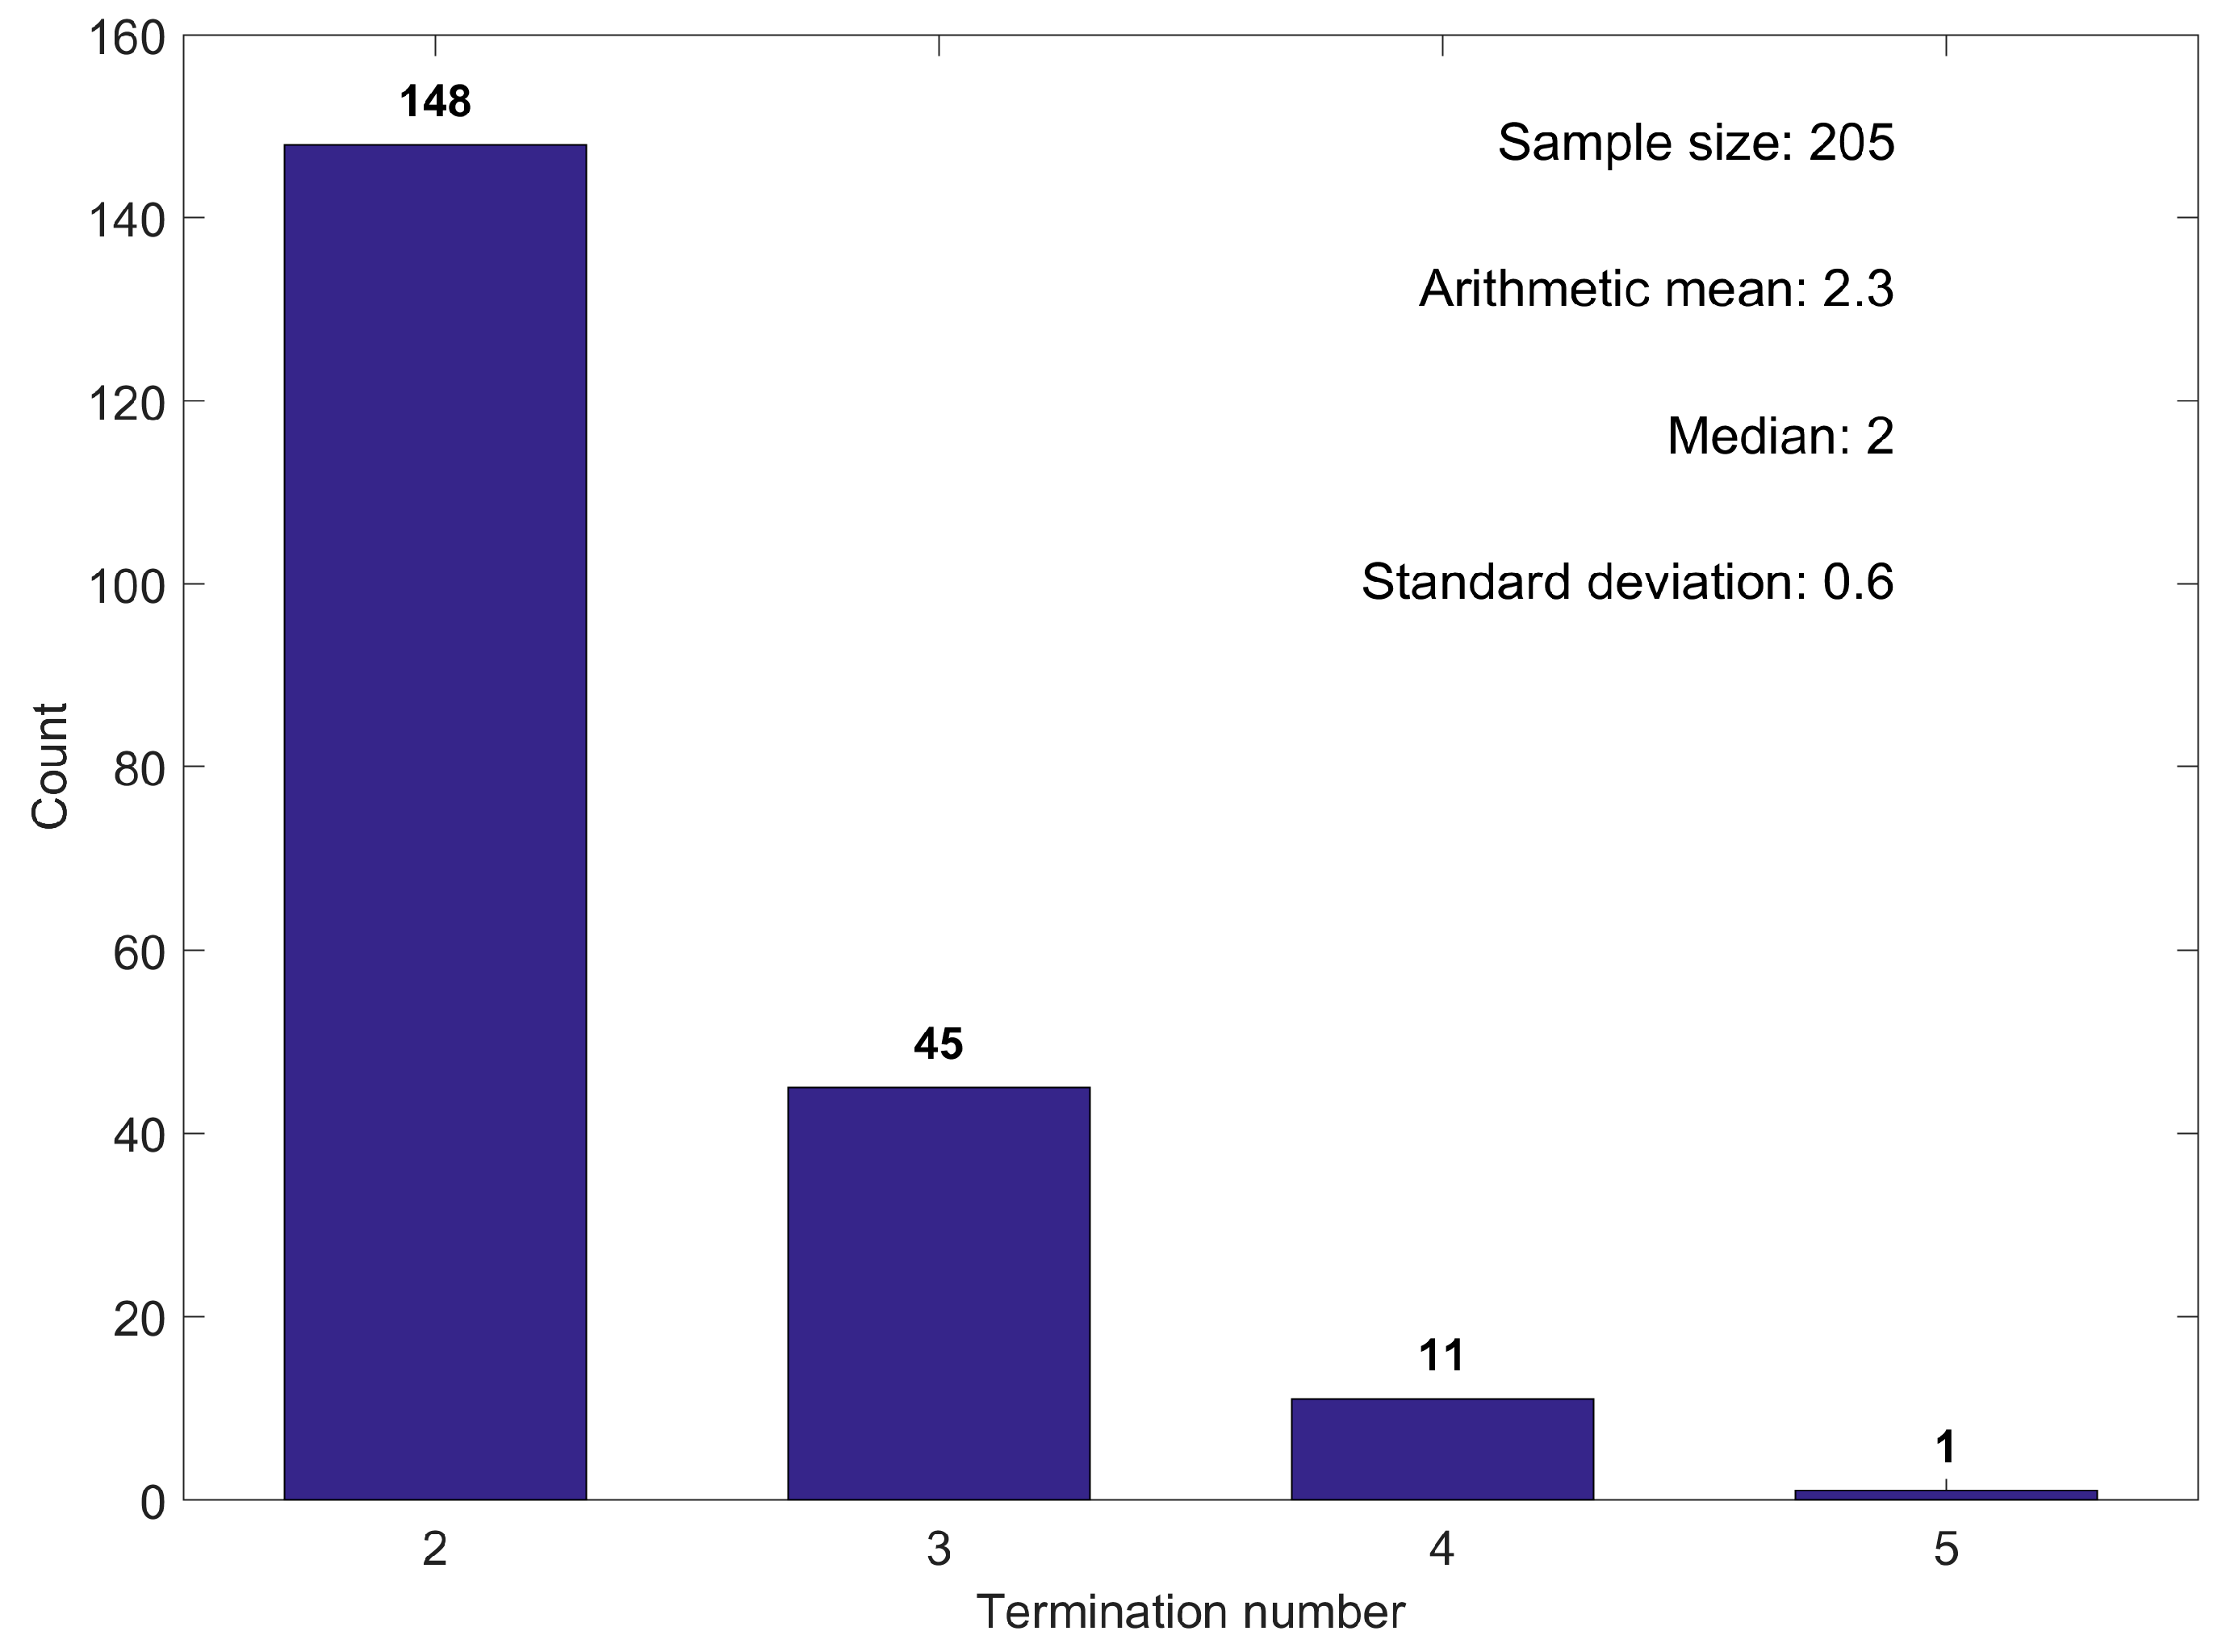
  • Termination number: the number of terminations produced by each MTF;
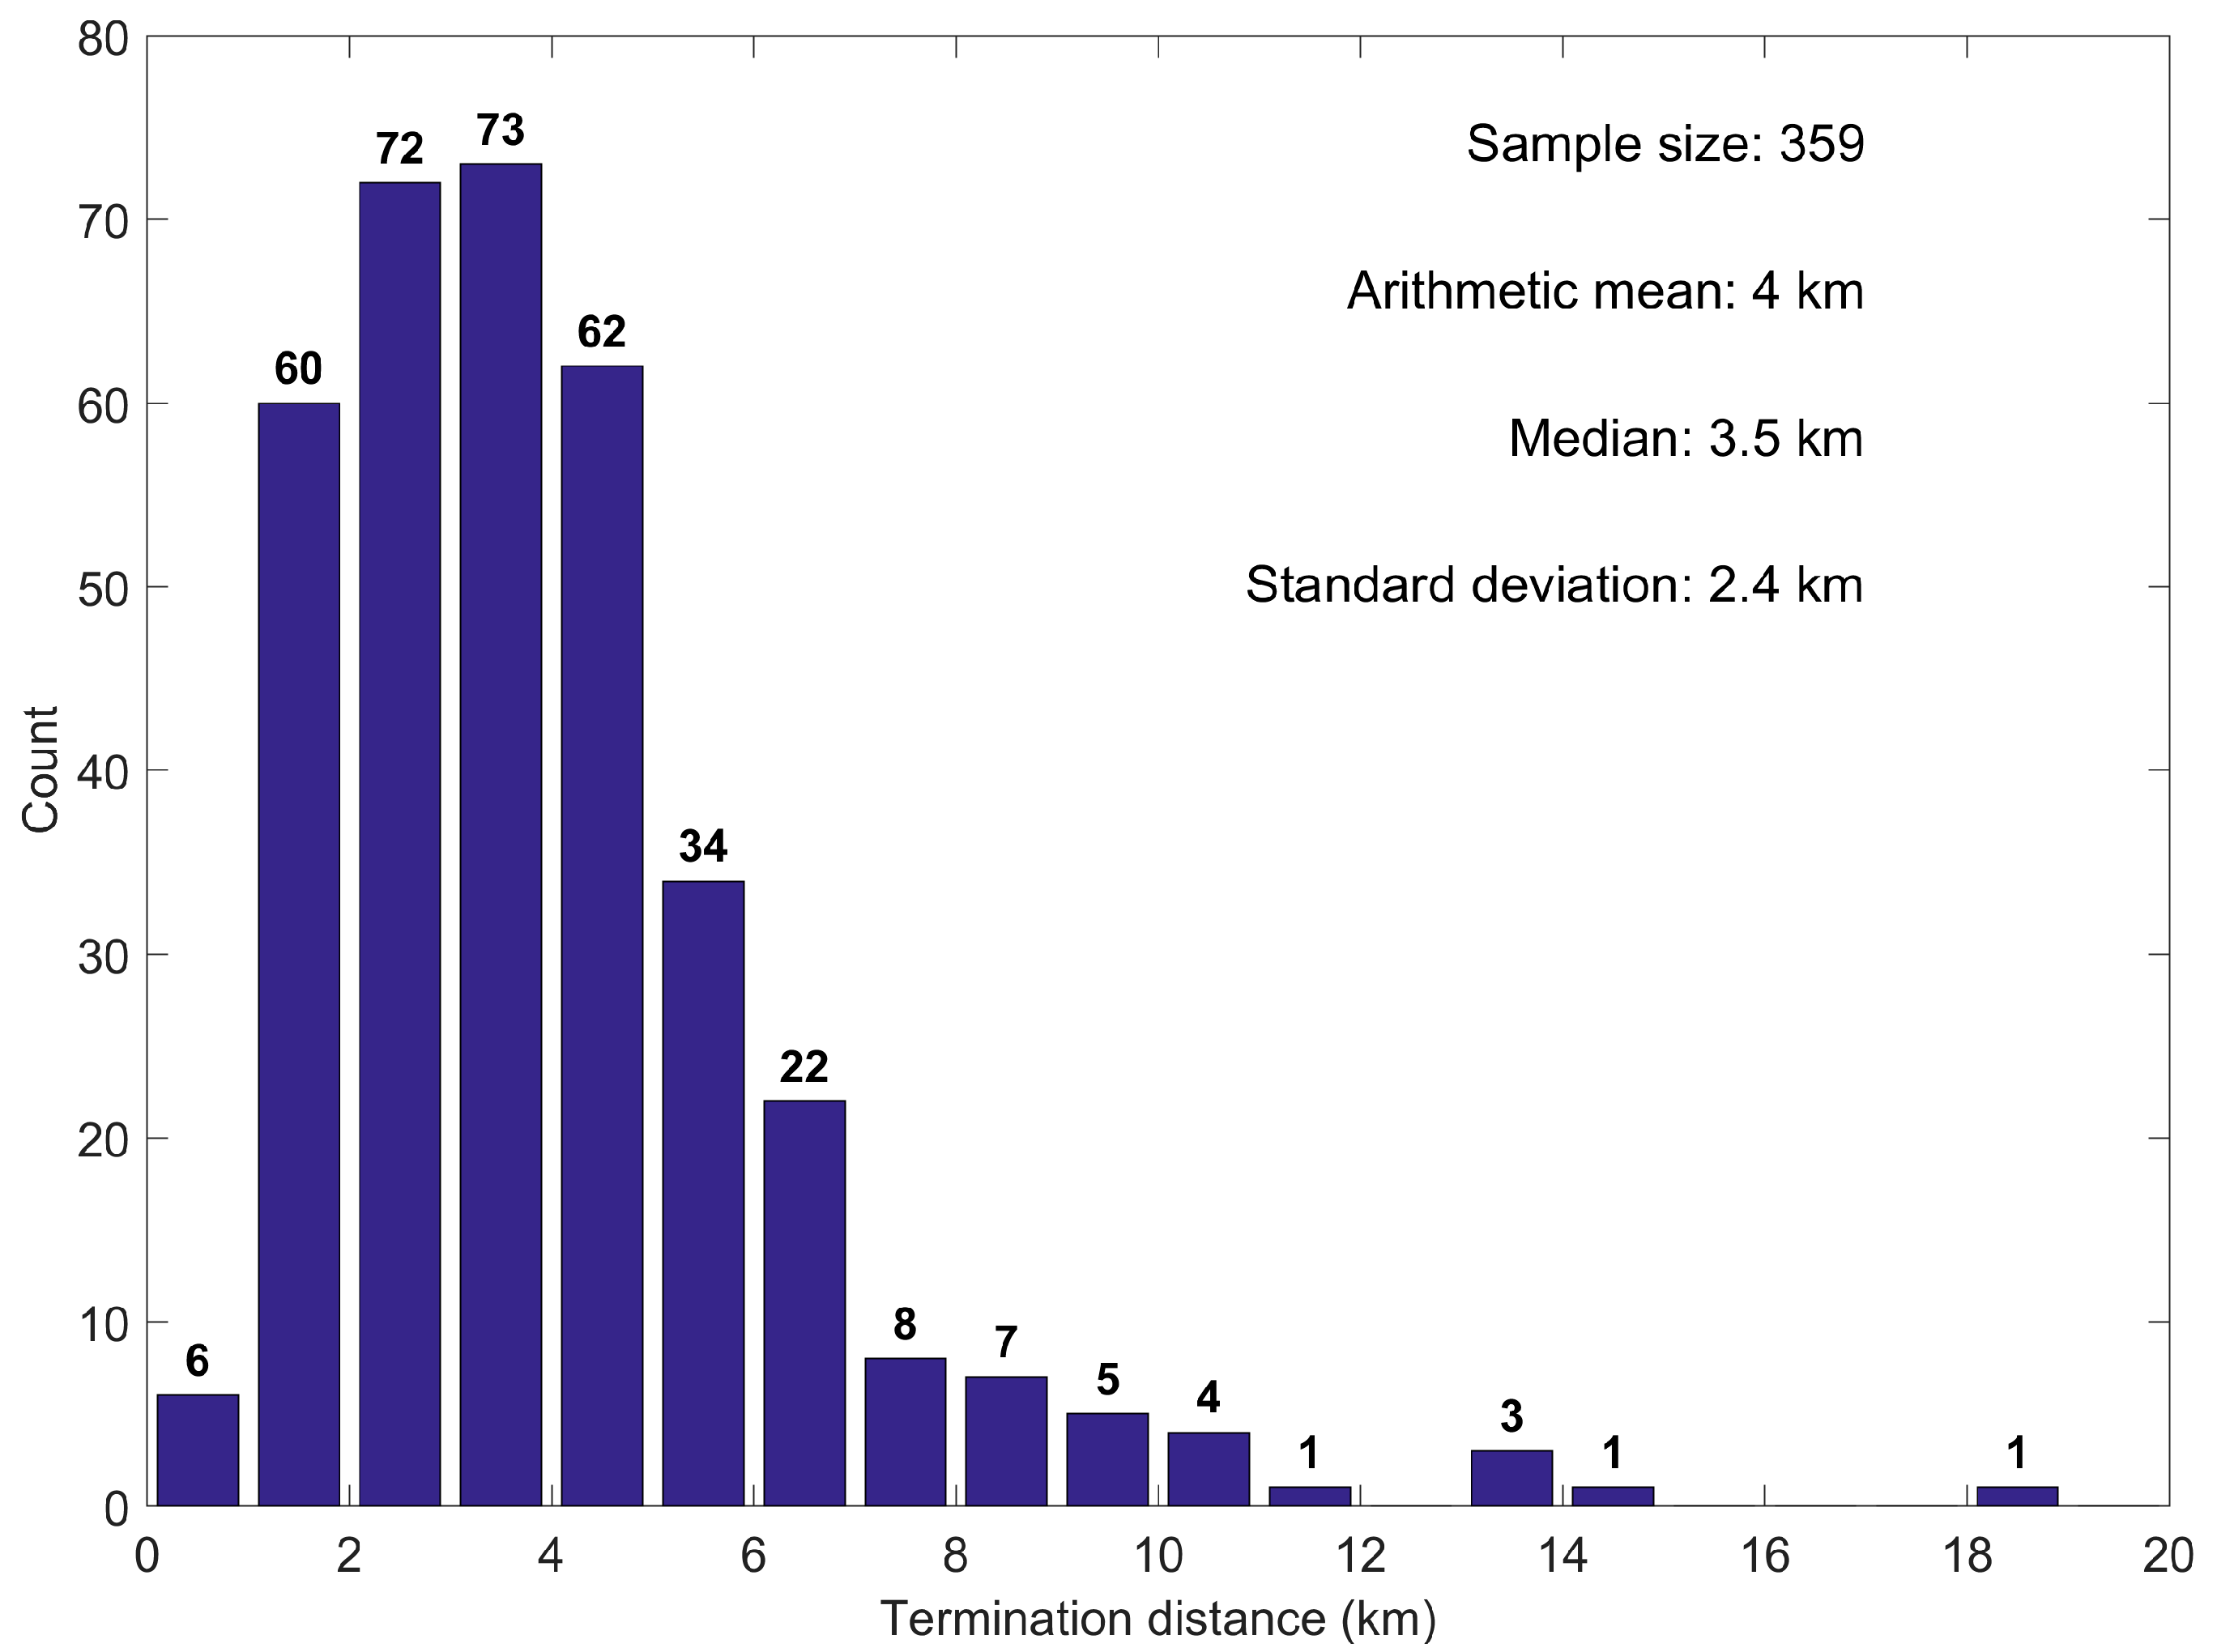
  • Termination distance: the horizontal distance between any two terminations in each MTF;
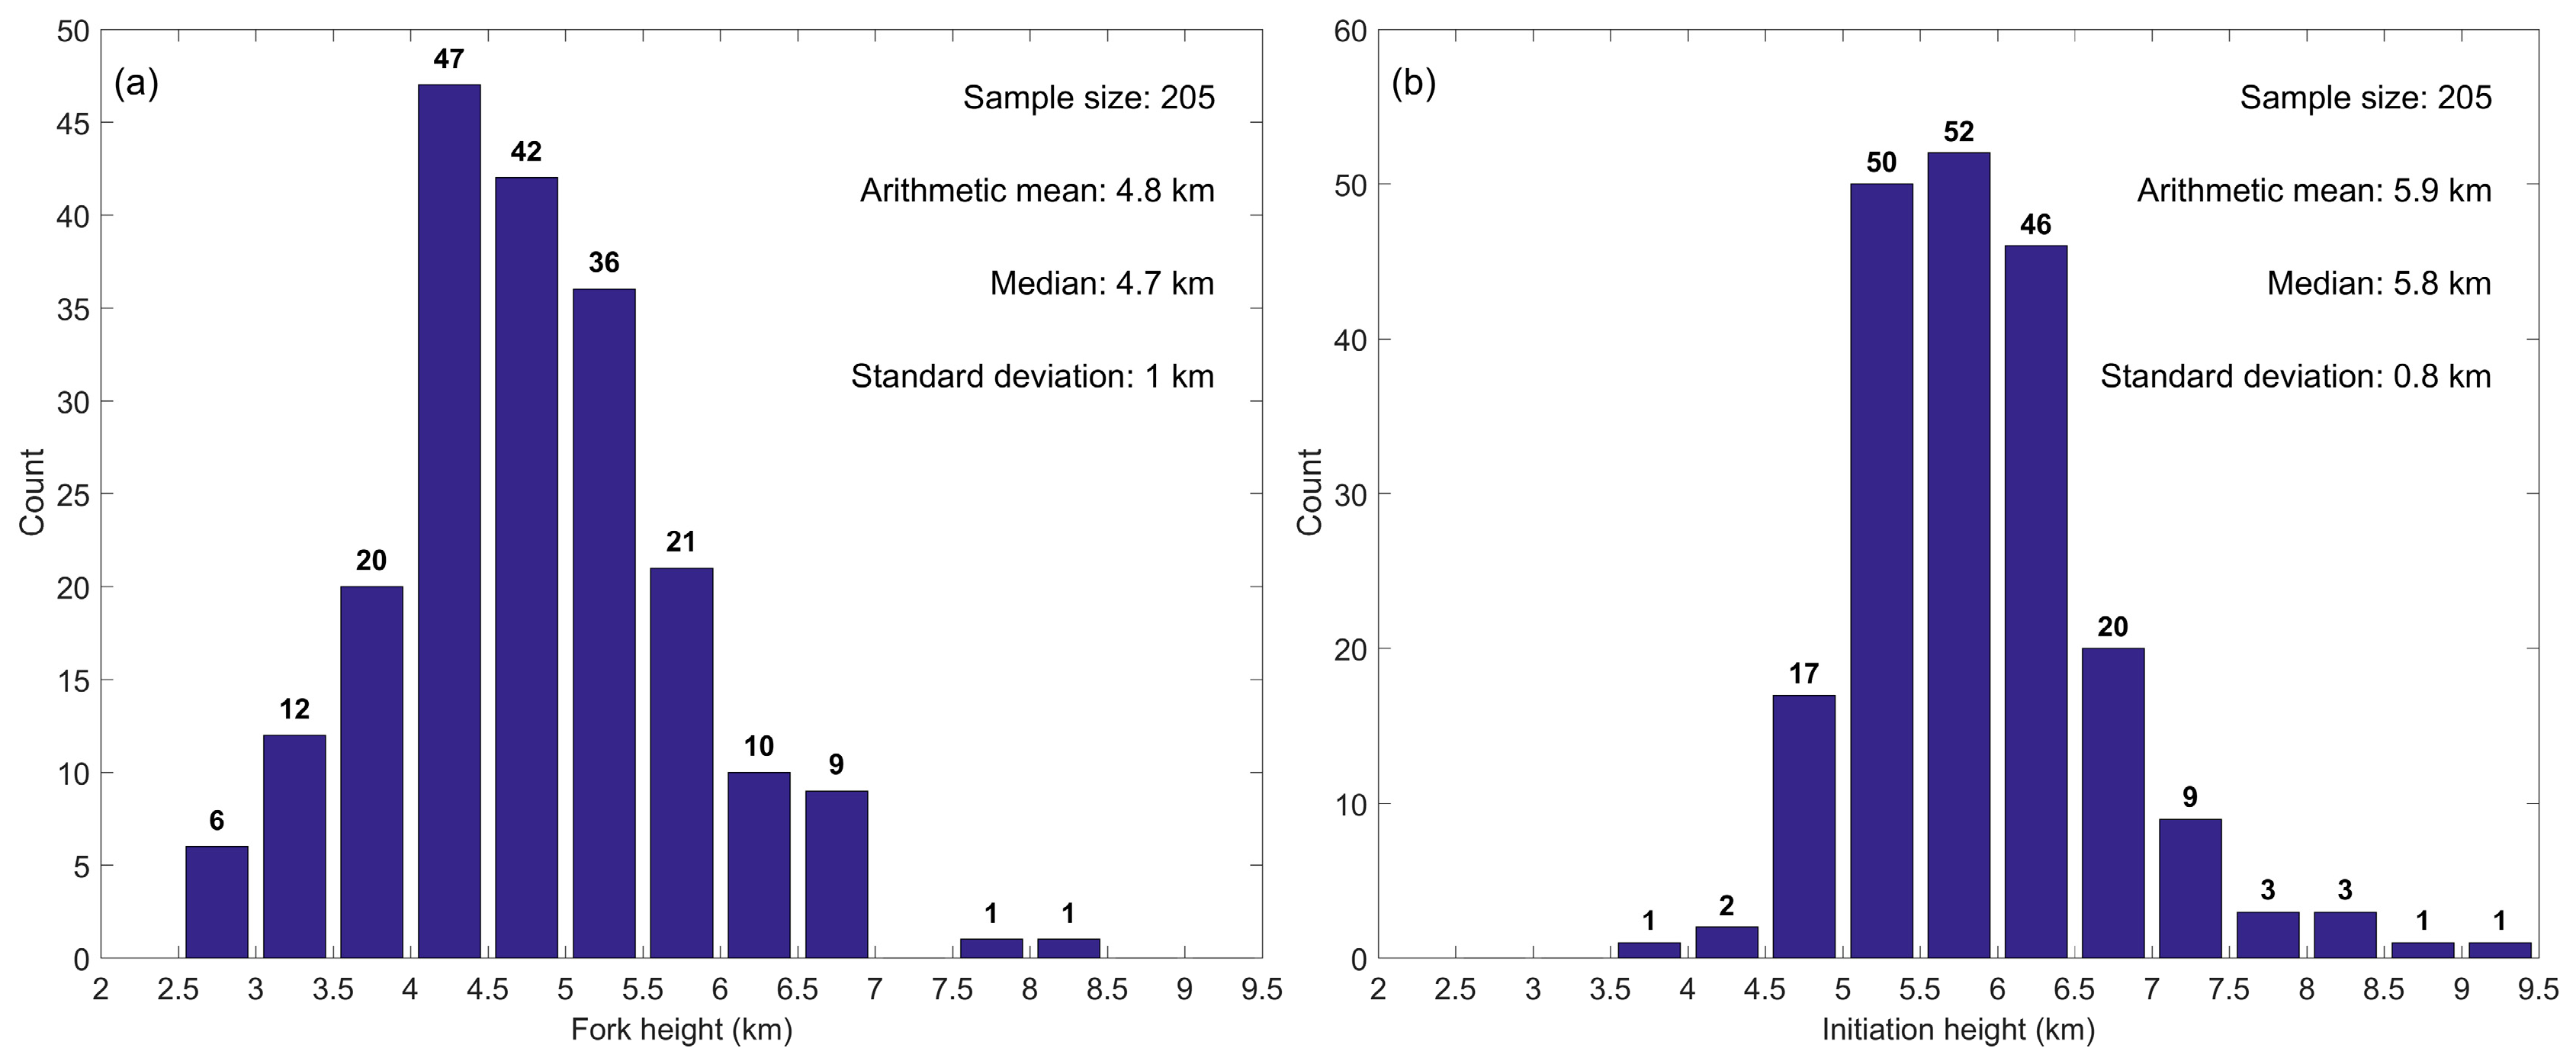
  • Fork height: the altitude where the leader forked into different channels and eventually formed the different terminations;
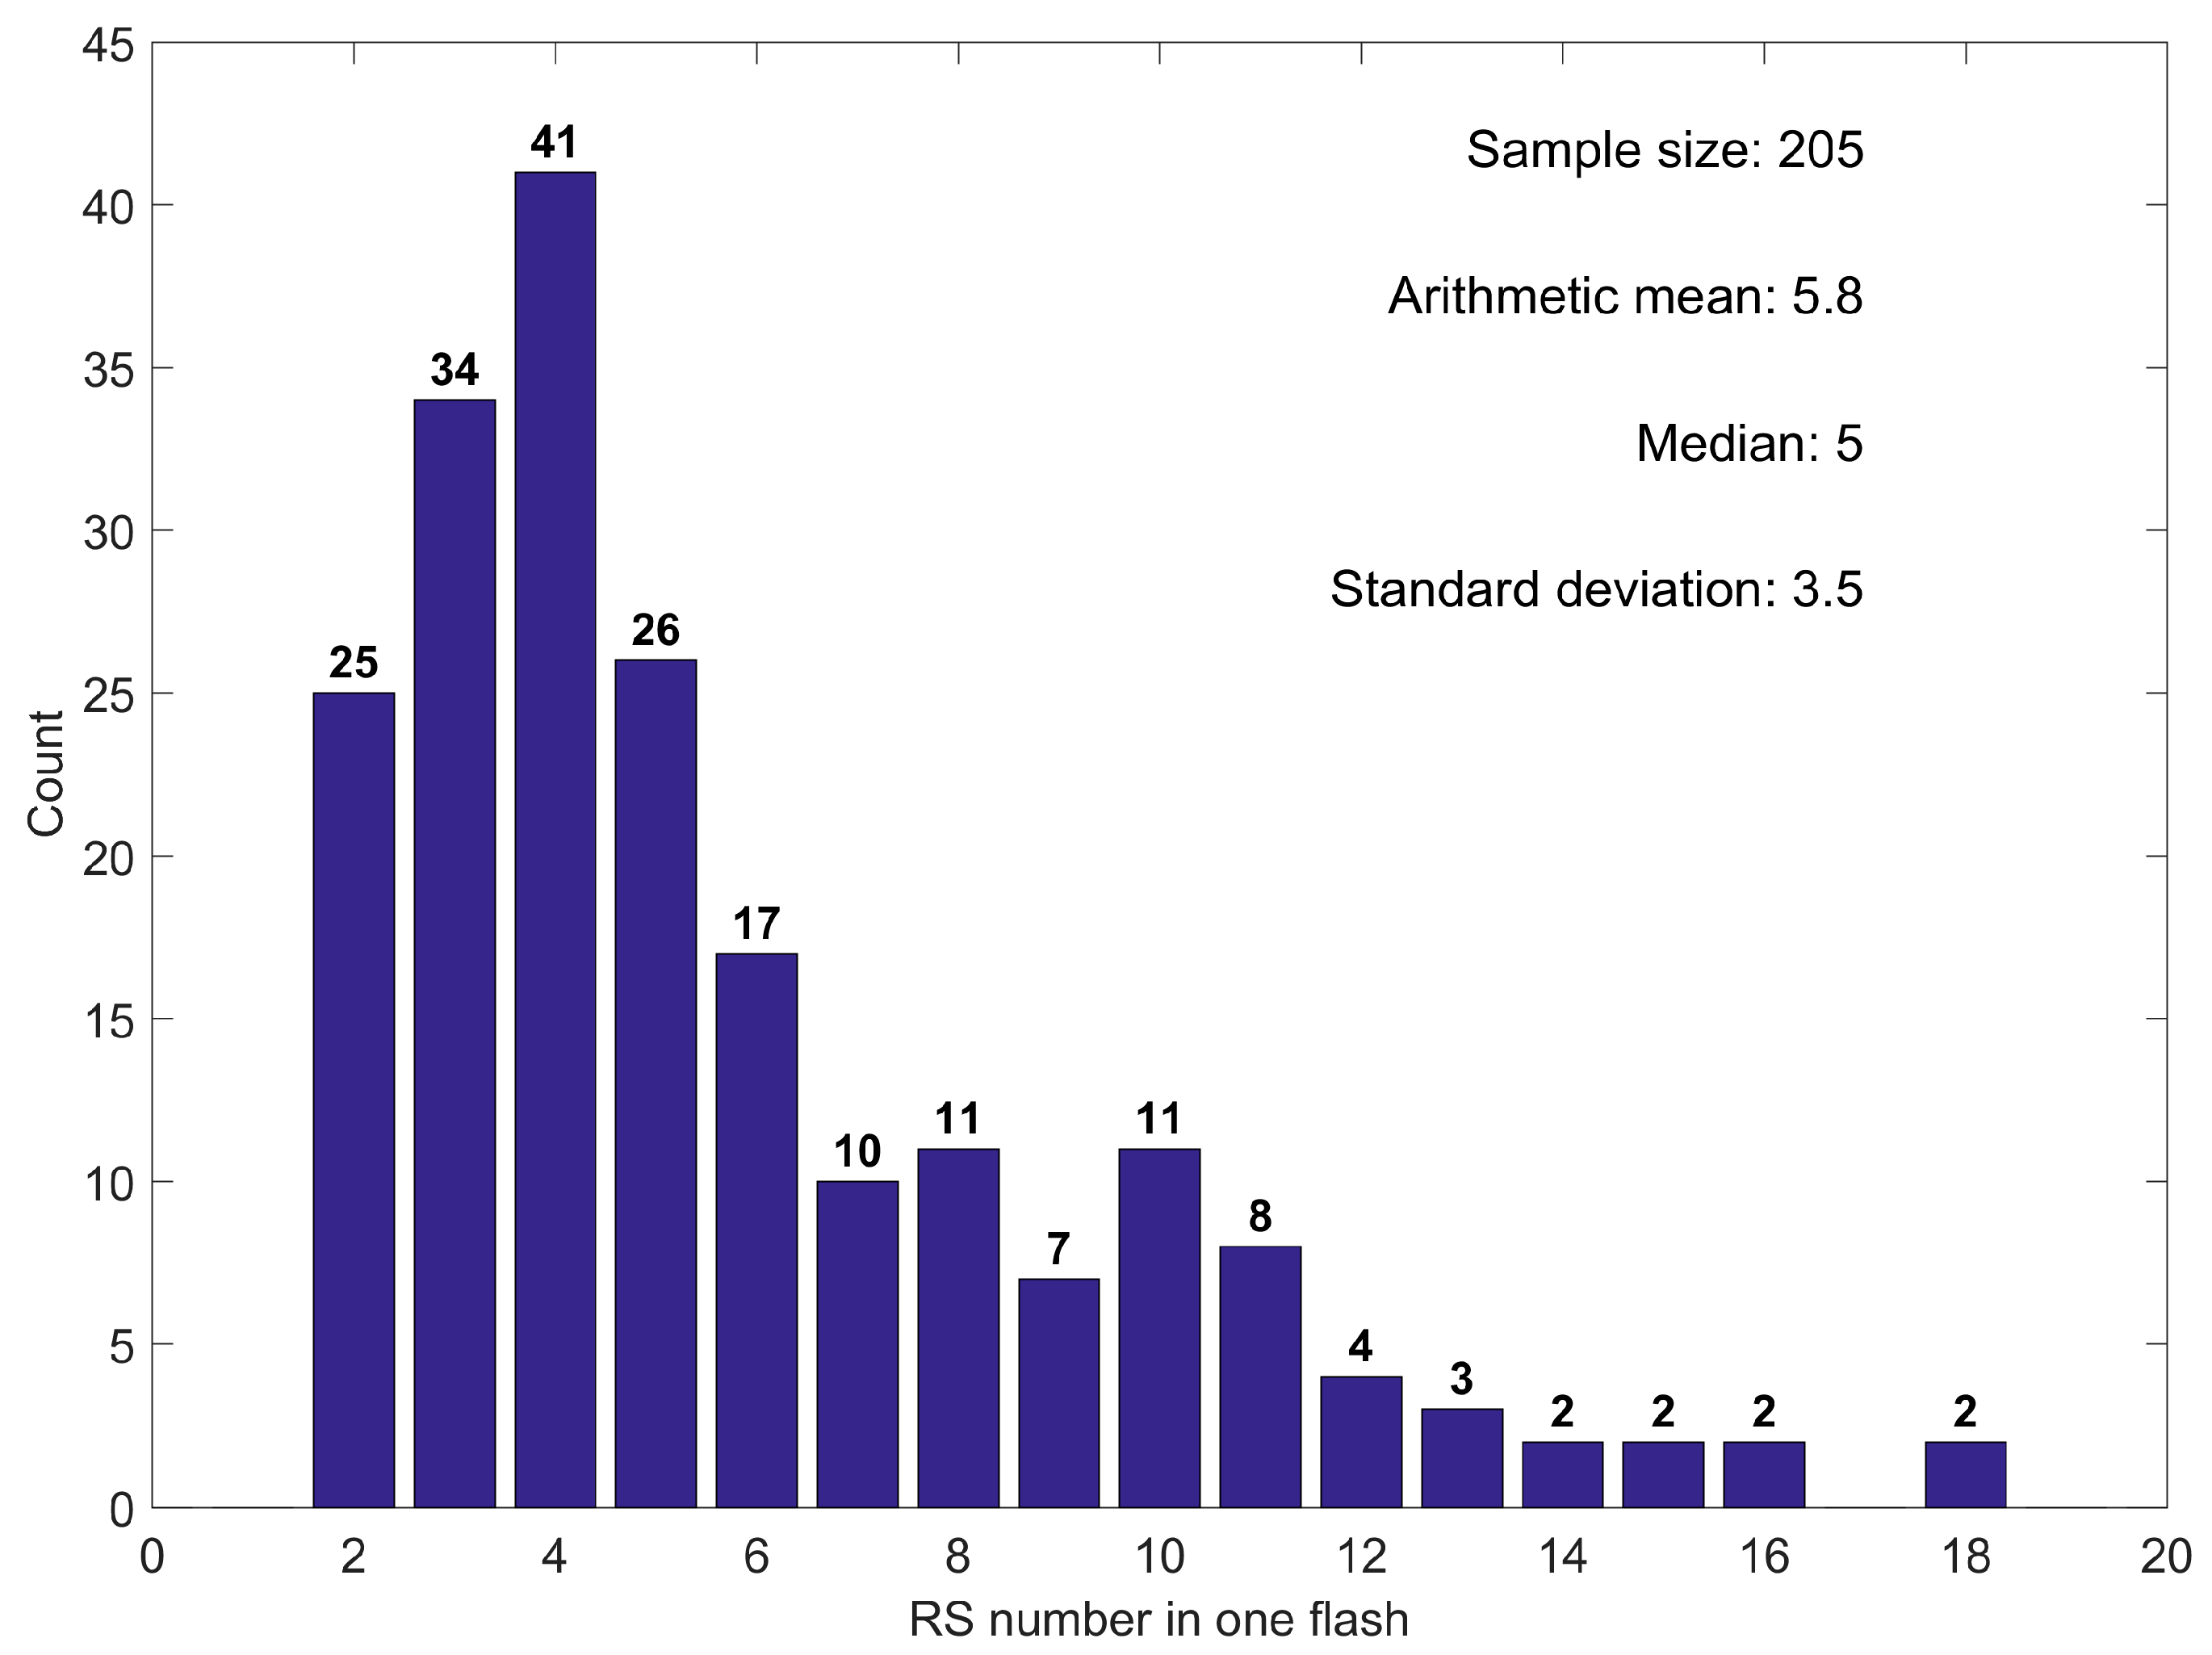
  • RS number: the number of RSs produced by each MTF;
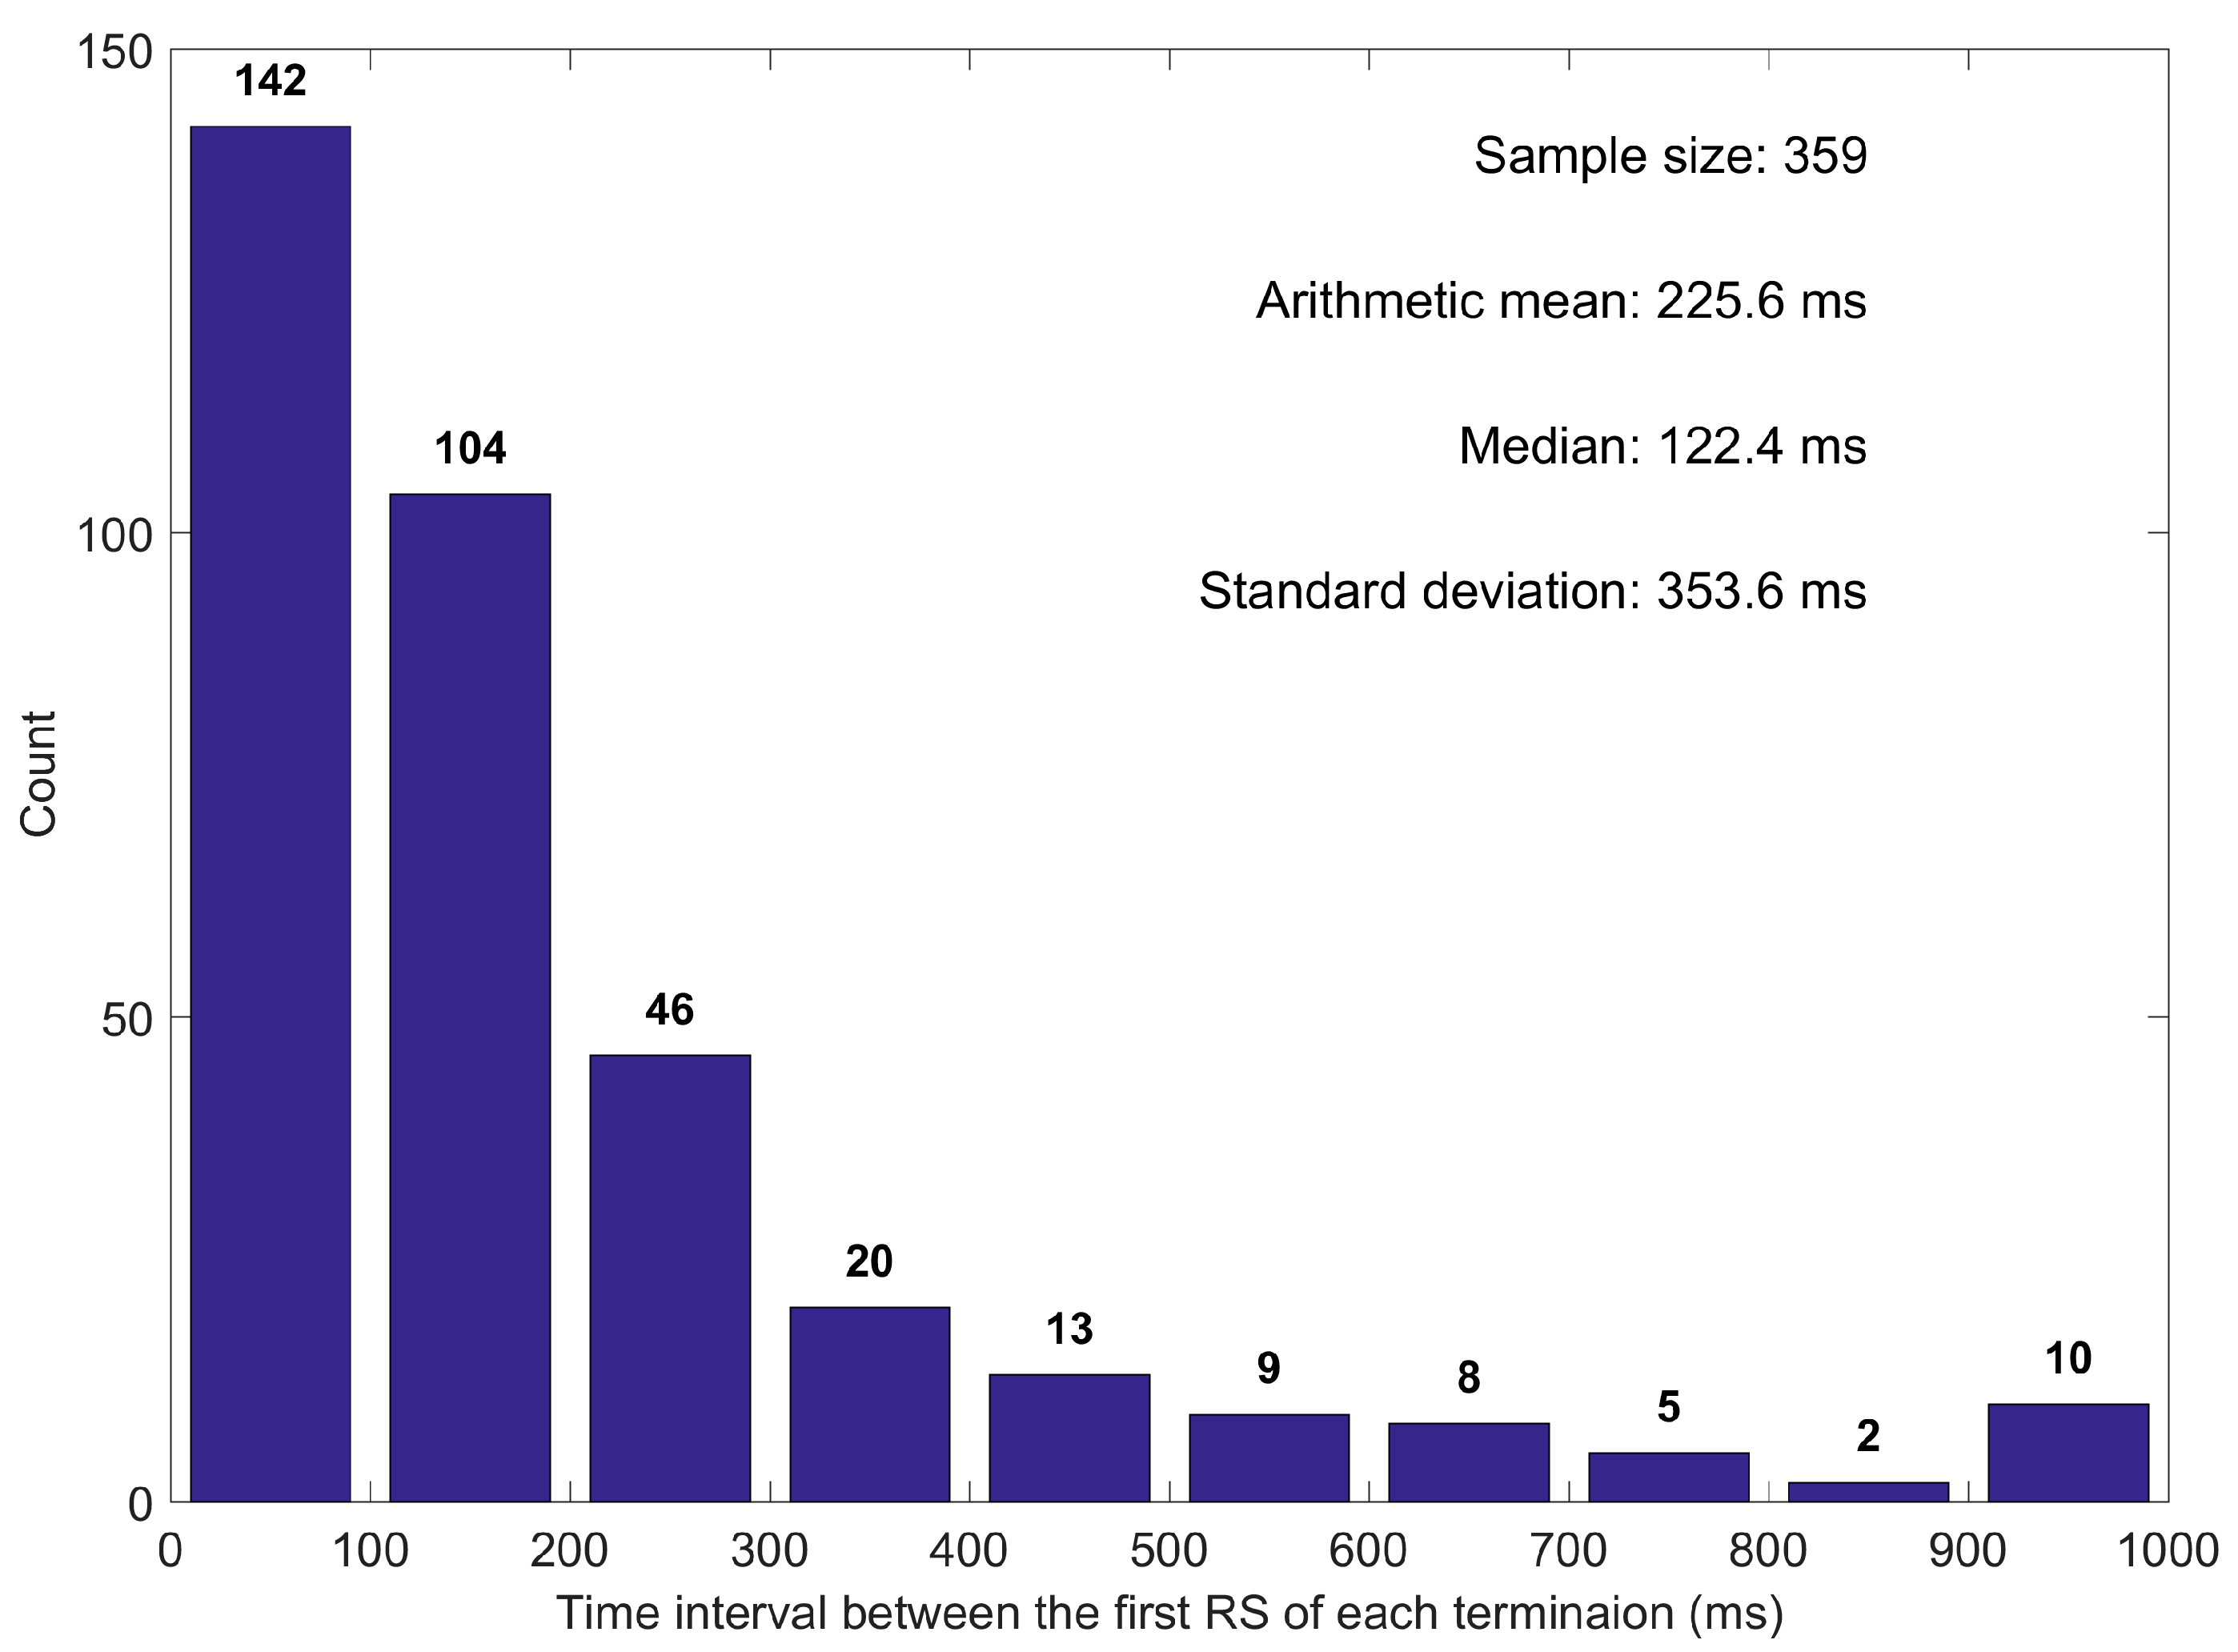
  • Time interval between the first strokes of each termination: the time difference between the first strokes of each termination;
  • The shortest time difference between the strokes at different terminations: the shortest time interval between the strokes at different terminations;
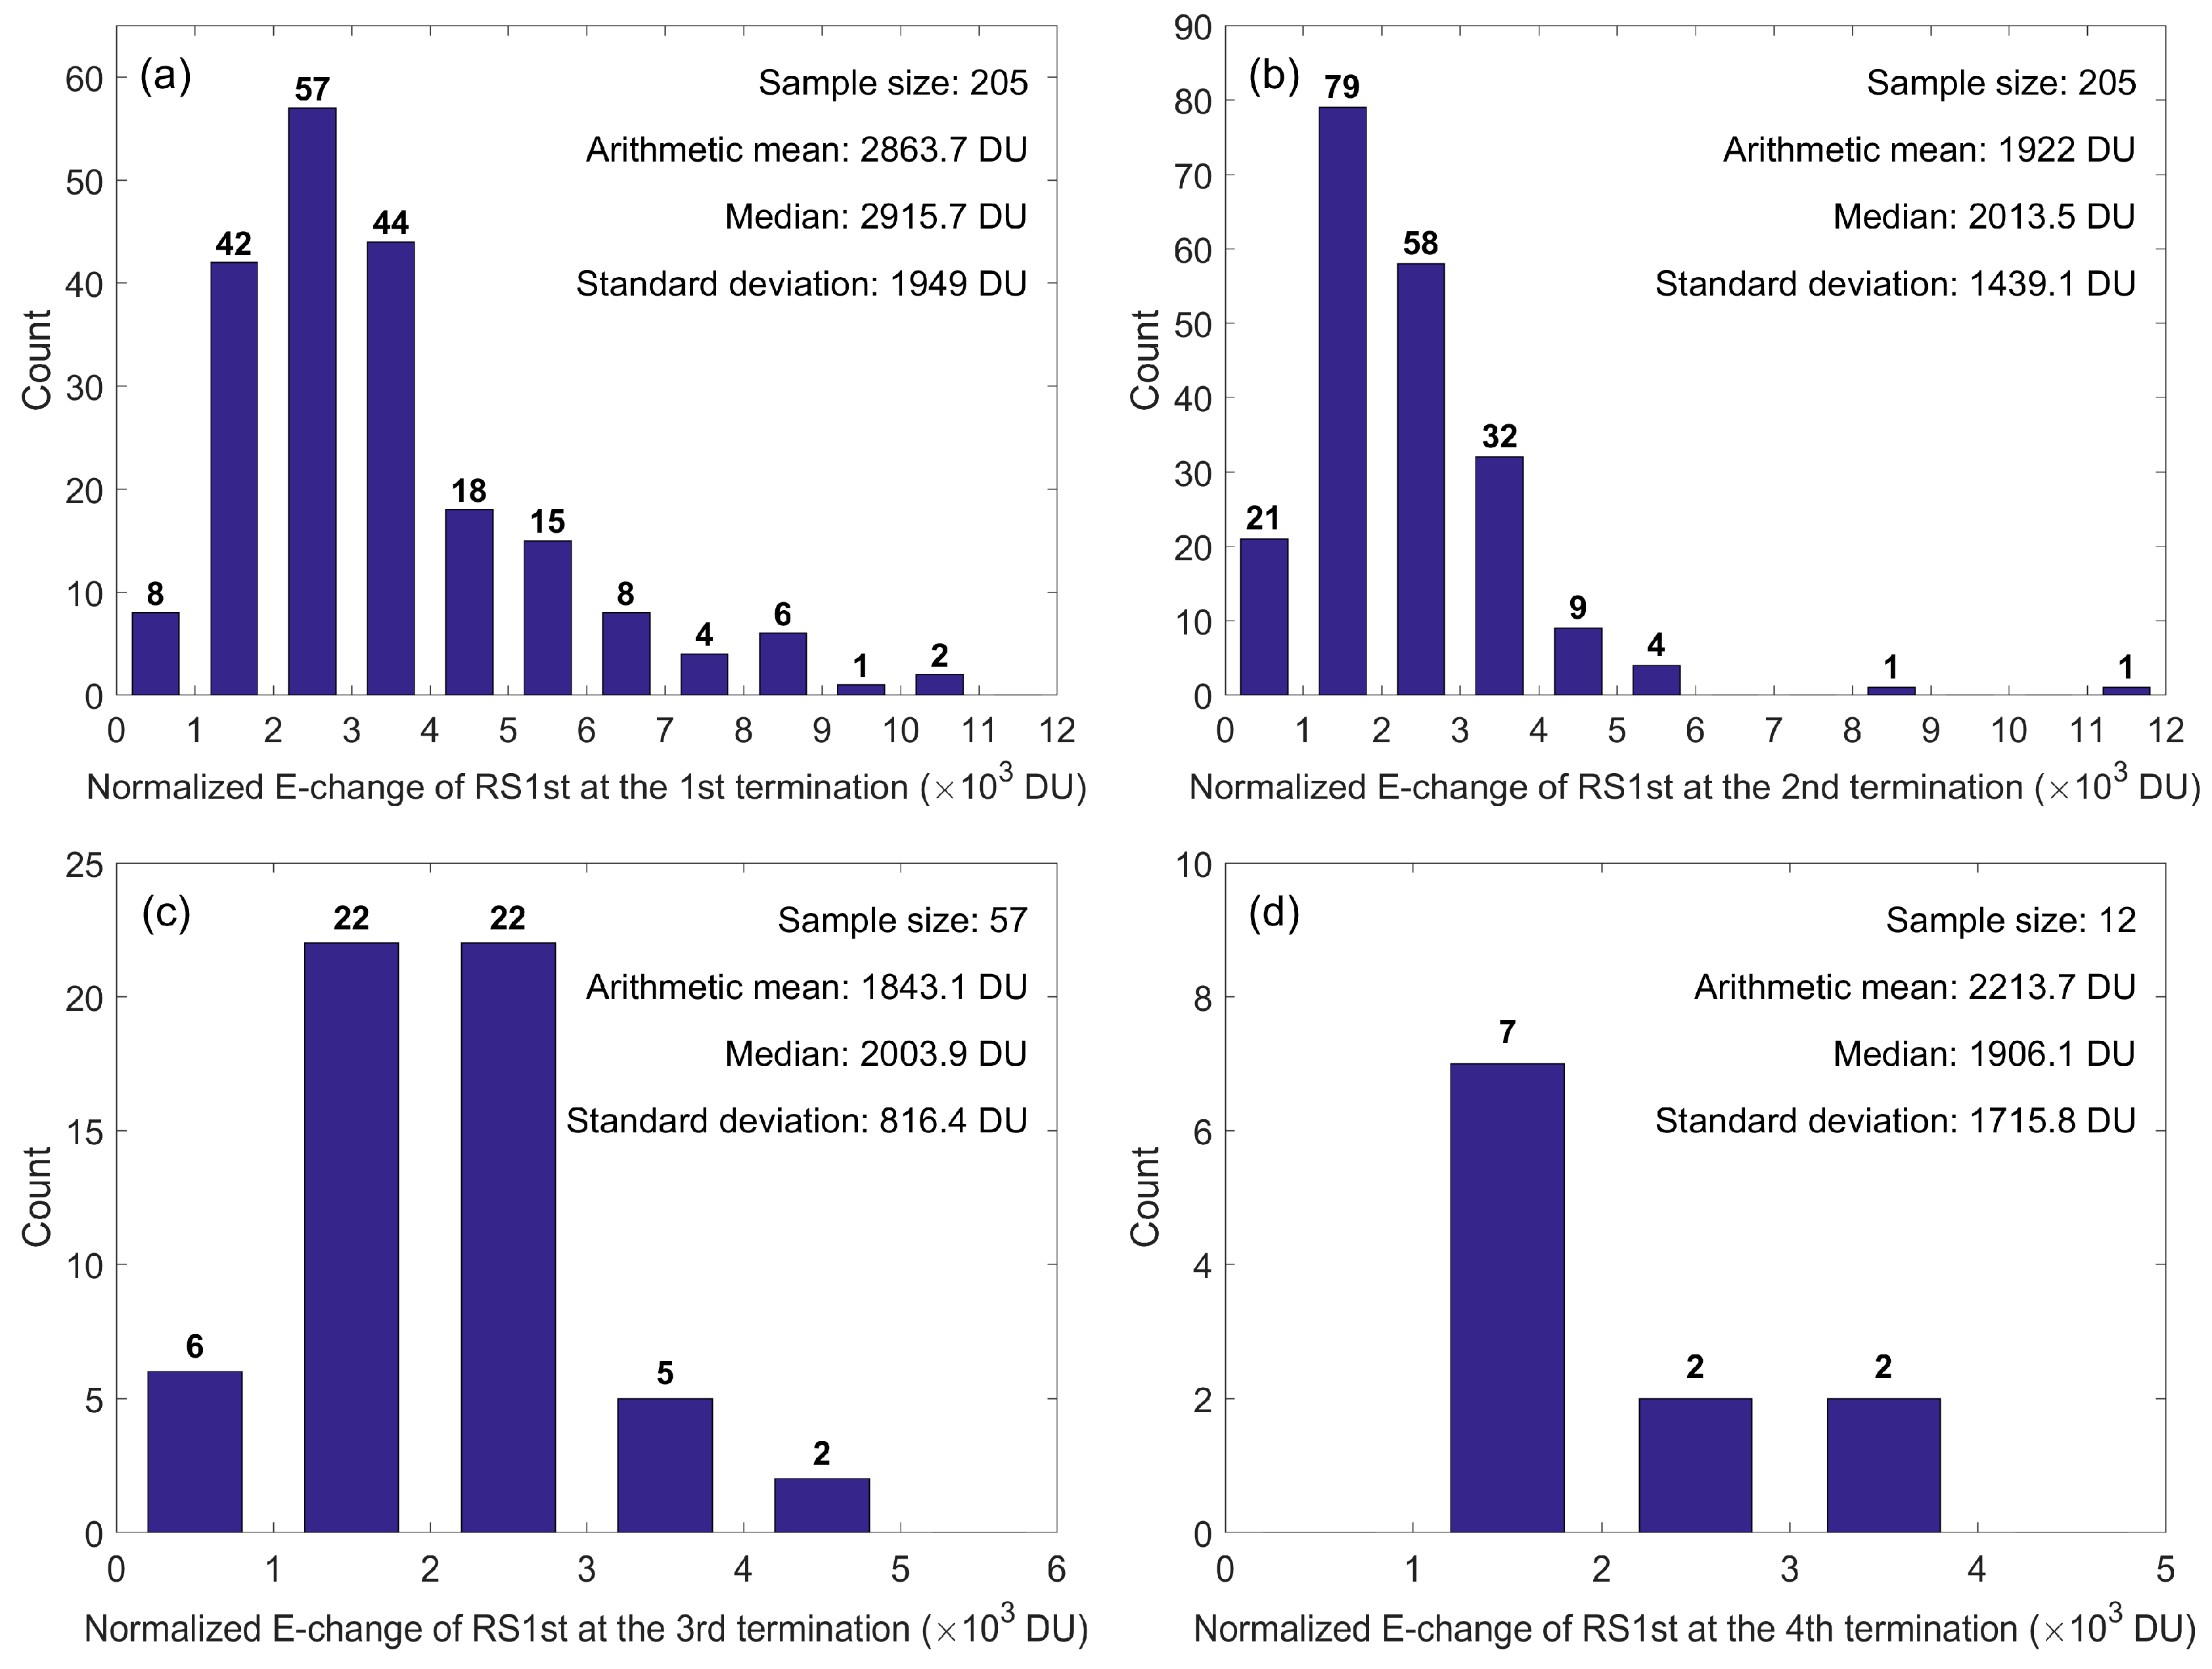
  • The first stroke intensity at each termination of an MTF: the range-normalized peak amplitude of the first stroke at each termination.

3. Results

3.1. Termination Number

Figure 3 presents a histogram of termination numbers. This histogram is surprisingly similar to that obtained in Reference [17] for Arizona’s lightning flashes with video recordings. The arithmetic mean (AM) termination per flash was 2.3, which was similar to the 2.4 roughly estimated from the MTFs in Reference [18].

3.2. Termination Distance

Figure 4 shows a histogram of the horizontal distances between any two terminations in each individual MTF. The most frequent termination distance was around 3 or 4 km, with an average value of about 4 km. A few lightning flashes had multiple terminations with a distance longer than 10 km. The distances between adjacent terminations in Reference [14] ranged from 0.3 to 7.3 km with a mean value of 1.7 km, smaller than the one obtained in this study. Since the system used for the observation of multiple terminations in Reference [14] was TV video, the possibility of missing larger-distance multiterminations was high. In addition, a few cases in Reference [14] corresponded with the multiple termination strokes, which tended to have smaller termination distances.

3.3. Fork Height

Figure 5a shows a histogram of the height where the fork of the leaders led to different terminations. The arithmetic mean and median value of the fork height were 4.8 km and 4.7 km, respectively. As a comparison, we also give the initiation height of the MTFs in Figure 5b. The average initiation height was 5.9 km, which was consistent with the results in Reference [13]. The average difference between the initiation and fork height was about 1.1 km. Coincidentally, as reported by Reference [13], the initiating stage of the negative CG flashes in summer thunderstorms in Japan mostly occur within a height range of about 1.2 km. It appears that the majority of the forks occurred near the heights where the CG flashes initiated.

3.4. Return Stroke Number

Figure 6 shows a histogram of the RS numbers for 205 MTFs. The maximum RS number was 18, while the most frequent RS number was 4. The AM value of the RS number per flash was 5.8, which was apparently larger than the mean multiplicity (e.g., 3.5 in Japan [16], 3.8 in Brazil [18], and 3.4 in Sweden [19]) calculated from all negative CG flashes.

3.5. Time Interval between the First Strokes of Each Termination

Figure 7 shows a histogram of the time interval between the first strokes of each termination. The time interval could be as large as roughly 1 s. For most MTFs, the time difference was less than 300 ms. In our dataset, the shortest time difference was 0.5 ms, with a corresponding fork height of about 4 km.

3.6. Shortest Time Difference between the Strokes at Different Terminations

Figure 8 shows a histogram of the shortest time difference between the strokes at different terminations. Compared to the statistics in Figure 7, the time difference in Figure 8 was smaller overall, with an AM of 189.6 ms. Here, we should point out that since we did not distinguish between RSs occurring within 100 µs, we could have missed a few CG flashes with a smaller time difference of multiple termination strokes.

3.7. RS1st Intensity at Each MTF Termination

Figure 9 shows a histogram of the intensity of the first RS (RS1st) at different terminations separated by termination occurrence orders. The RS intensity was measured from the E-change amplitude at the central station TMK, which was normalized to 100 km. The specific data processing can be found in the supporting information in Reference [13]. The sample sizes of RS1st in the first, second, third, and fourth terminations were 205, 205, 57, and 12, respectively. The sample size of RS1st in the fifth termination was only 1, and hence the corresponding histogram is not given. As seen in Figure 9a–c, with a sufficient sample size, the average RS1st intensities for the first, second, and third terminations were 3368, 2274, and 2011 DU, respectively. It appears that the RS1st intensity tended to decrease with increasing termination occurrence orders.

4. Discussion

To the best of our knowledge, most of the results presented above are the first to be documented. Our results should be useful in addressing the challenges involved with MTFs. As an example, a termination distance of 10 km has traditionally been used as a criterion to separate lightning flashes [16]. However, according to the results shown in Figure 4, 10 out of 359 MTF termination distances were over 10 km, and the traditional criterion was clearly improper. As another example, in order to estimate the effect of a multitermination CG flash on an electrical power system, we need to assume not only the intensity of the lightning but also the exact timing of the lightning at each termination. The results presented in Figure 7, Figure 8 and Figure 9 should be useful in making the relevant assumptions.
One interesting result of this study is that the majority of the MTF forks occurred near the heights where the CG flashes initiated. Similar to the case shown in Reference [20], many CGs had apparent branches during their initial stages inside the cloud. It appeared that some of the branches functioned later and consequently produced different terminations. The time delay for a branch to function and produce a new termination could be various, as is evident in Figure 7. In some cases, the time delay could be too short to be observed. As described in Section 2, in this study we intentionally excluded such short time delay cases by using a time window of 100 μs. In a future study, we will try to include such short time delay cases. To improve the accuracy of our study, we are also planning to add high-speed video to the FALMA system.

5. Conclusions

We characterized 205 multiple-termination negative cloud-to-ground (CG) lightning flashes. The main statistical conclusions are as follows.
The RS number and the termination number of multitermination flashes ranged from 2 to 18 with an AM of 5.8 and from 2 to 5 with an AM of 2.3, respectively.
The AM termination distance was 4 km, and 10 out of 359 MTF termination distances were more than 10 km, indicating that a 10-km criterion to separate CG flashes is not adequate.
The fork height of the CG flashes ranged from 2.5 km to 8.5 km with an AM height of 4.8 km, while the AM initiation height was 5.9 km.
The AM interval between the first stroke of each termination in one flash was 225.6 ms with minimum and maximum values of 0.5 ms and 965.3 ms, respectively. The shortest time difference between the RSs of each termination in one flash had an AM value of 189.6 ms.
The intensity of RS1st at different terminations of MTFs tended to decrease with increasing termination occurrence orders.

Author Contributions

P.G. did initial data analysis and prepared the original draft. D.W. interpreted the data and gave supervision. D.S. provided an analysis of the raw data. D.W., T.W., and N.T. developed FALMA and performed observation.

Funding

This research was funded by the Ministry of Education, Culture, Sports, Science, and Technology, grant number 15H02597, 18K13618, and 16H04315.

Acknowledgments

The author would like to thank all the people who helped carry out the related observation experiments in the summer of 2017. Readers can get the data from the corresponding author ([email protected]).

Conflicts of Interest

The authors declare no conflict of interest.

References

  1. Schonland, B.F.J. Progressive lightning, 4, The discharge mechanism. Proc. R. Soc. Lond. Ser. A 1938, 164, 132–150. [Google Scholar]
  2. Barasch, G.E. Spectral intensities emitted by lightning discharges. J. Geophys. Res. 1970, 75, 1041–1057. [Google Scholar] [CrossRef]
  3. Brantley, R.D.; Tiller, J.A.; Uman, M.A. Lightning properties in Florida thunderstorms from video tape records. J. Geophys. Res. 1975, 80, 3402–3406. [Google Scholar] [CrossRef]
  4. Kitagawa, N.; Brook, M.; Workman, E.J. Continuing currents in cloud-to-ground lightning discharges. J. Geophys. Res. 1962, 67, 637–647. [Google Scholar] [CrossRef]
  5. Krider, E.P. Some photographic observations of lightning. J. Geophys. Res. 1966, 71, 3095–3098. [Google Scholar] [CrossRef]
  6. Winn, W.P.; Aldridge, T.V.; Morse, C.B. Video tape recordings of lightning flashes. J. Geophys. Res. 1973, 78, 4515–4519. [Google Scholar] [CrossRef]
  7. Rakov, V.A.; Uman, M.A.; Thottappillil, R. Review of Lightning Properties from Electric Field and TV Observations. J. Geophys. Res. 1994, 99, 10745–10750. [Google Scholar] [CrossRef]
  8. Rakov, V.A.; Huffines, G.R. Return-Stroke Multiplicity of Negative Cloud-to-Ground Lightning Flashes. J. Appl. Meteorol. 2003, 42, 1455–1462. [Google Scholar] [CrossRef]
  9. Stall, C.A.; Cummins, K.L.; Krider, E.P.; Cramer, J.A. Detecting Multiple Ground Contacts in Cloud-to-Ground Lightning Flashes. J. Atmos. Ocean. Technol. 2009, 26, 2392. [Google Scholar] [CrossRef]
  10. Wu, T.; Wang, D.; Takagi, N. Lightning mapping with an array of fast antennas. Geophys. Res. Lett. 2018, 45, 3698–3705. [Google Scholar] [CrossRef]
  11. Wu, T.; Wang, D.; Takagi, N. Locating preliminary breakdown pulses in positive cloud-to-ground lightning. J. Geophys. Res. 2018, 123, 7989–7998. [Google Scholar] [CrossRef]
  12. Wu, T.; Wang, D.; Takagi, N. Intracloud lightning flashes initiated at high altitudes and dominated by downward positive leaders. J. Geophys. Res. 2019, 124, 6982–6998. [Google Scholar] [CrossRef]
  13. Shi, D.; Wang, D.; Wu, T.; Takagi, N. Correlation between the first return stroke of negative CG lightning and its preceding discharge processes. J. Geophys. Res. 2019, 124, 8501–8510. [Google Scholar] [CrossRef]
  14. Thottappillil, R.; Rakov, V.A.; Uman, M.A.; Beasley, W.H.; Master, M.J.; Shelukhin, D.V. Lightning subsequent stroke electric field peak greater than the first strike peak and multiple ground terminations. J. Geophys. Res. 1992, 97, 7503–7509. [Google Scholar] [CrossRef]
  15. Wang, D.; Takagi, N.; Watanabe, T.; Rakov, V.A.; Uman, M.A. Luminosity waves in branched channels of two negative lightning flashes. J. Atmos. Electr. 2000, 20, 91–97. [Google Scholar]
  16. Matsui, M.; Michishita, K.; Yokoyama, S. Characteristics of Negative Flashes with Multiple Ground Strike Points Located by the Japanese Lightning Detection Network. IEEE Trans. Electromagn. Compat. 2019, 61, 751–758. [Google Scholar] [CrossRef]
  17. Valine, W.C.; Krider, E.P. Statistics and characteristics of cloud-to-ground lightning with multiple ground contacts. J. Geophys. Res. 2002, 107, 4441–4452. [Google Scholar] [CrossRef]
  18. Saba, M.M.F.; Ballarotti, M.G.; Pinto, O., Jr. Negative cloud-to-ground lightning properties from high-speed video observations. J. Geophys. Res. 2006, 111, 0148–0227. [Google Scholar] [CrossRef]
  19. Cooray, V.; Perez, H. Some features of lightning flashes observed in Sweden. J. Geophys. Res. 1994, 99, 10683–10688. [Google Scholar] [CrossRef]
  20. Sun, Z.; Qie, X.; Liu, M.; Jiang, R.; Wang, Z.; Zhang, H. Characteristics of a negative lightning with multiple-ground terminations observed by a VHF lightning location system. J. Geophys. Res. 2016, 121, 413–426. [Google Scholar] [CrossRef] [Green Version]
Figure 1. Geographical positions of Fast Antenna Lightning Mapping Array (FALMA) sites in the summer of 2017. Each of the FALMA 12 sites is indicated by a black square and its name is labeled next to the corresponding square. The red dots indicate the locations of 1180 return strokes (RSs) in the 205 studied multiple-termination flashes (MTFs). The latitude and longitude of the site at (0,0) are 35.475° N and 136.960° E, respectively.
Atmosphere 10 00625 g001
Figure 2. An example of negative cloud-to-ground (CG) lightning with multiple terminations. (a) Electric field change (E-change) waveform recorded at the site TOK. The triangle and squares indicate the identified RSs. The abbreviation DU stands for digital unit. (b) Pulse-located height with time; (c) xz vertical view; (d) geographical positions of FALMA station; (e) xy view; (f) yz vertical view.
Atmosphere 10 00625 g002
Figure 3. Histogram of termination number in each MTF.
Atmosphere 10 00625 g003
Figure 4. Histogram of the distance between any two terminations in each multiple-termination CG lightning flash.
Atmosphere 10 00625 g004
Figure 5. Histogram of the (a) leader fork height and (b) lightning initiation height.
Atmosphere 10 00625 g005
Figure 6. Histogram of RS numbers in each multiple-termination CG lightning flash.
Atmosphere 10 00625 g006
Figure 7. Histogram of the time interval between the first RS of each termination in the same MTF.
Atmosphere 10 00625 g007
Figure 8. Histogram of the shortest time difference between the strokes at different terminations.
Atmosphere 10 00625 g008
Figure 9. Histogram of the RS1st intensity at each type of termination separated by termination occurrence orders (a) for the first terminations, (b) second terminations, (c) third terminations, and (d) fourth terminations.
Atmosphere 10 00625 g009

