The 10–20 d Low-Frequency Oscillation Characteristics of Summer Precipitation in Eastern China in the Decaying Year of CP ENSO

1
Key Laboratory of Meteorological Disaster, Ministry of Education/Joint International Research Laboratory of Climate and Environment Change/Collaborative Innovation Center on Forecast and Evaluation of Meteorological Disasters, Nanjing University of Information Science &Technology, Nanjing 210044, China
2
Dafeng Meteorological Service, Yancheng Meteorological Service, Yancheng 224100, China
3
Shanghai Flight Department, China Eastern Airlines, Shanghai 201100, China
*
Author to whom correspondence should be addressed.
Atmosphere 2019, 10(10), 616; https://doi.org/10.3390/atmos10100616
Submission received: 6 August 2019
/
Revised: 17 September 2019
/
Accepted: 25 September 2019
/
Published: 11 October 2019
(This article belongs to the Section Meteorology)
Abstract
:Using National Centers for Atmospheric Prediction/National Center for Atmospheric Research (NCEP/NCAR) reanalysis data and observational data, the low-frequency oscillation characteristics of precipitation in eastern China during the decaying summer of central Pacific El Niño–Southern Oscillation (CP ENSO) and the corresponding low-frequency atmospheric oscillation characteristic were investigated. The results showed that summer precipitation in eastern China during the decaying year of CP El Niño (La Niña) was more (less) than the climatological mean and that 10–20 d was its dominant period. Low-frequency oscillations at different tropospheric levels had different effects on low-frequency precipitation. In the upper troposphere, Eastern China was dominated by low-frequency divergence and positive (negative) anomaly of low-frequency height during the decaying year of CP El Niño (La Niña), and there was strong (weak) northwest–southeast wave-active flux transport. In the middle troposphere, the range and intensity of the subtropical western Pacific High (SWPH) of CP El Niño was larger and stronger than that of CP La Niña, which may be related to the low-frequency height fields. Meanwhile, the correspnding low-frequency wind field, water vapor circulation systems and moisture transport channels in the lower troposphere, along with the low-frequency vertical movement were significantly different, causing the low-frequency precipitation of CP El Niño to be stronger than CP La Niña.
1. Introduction
As the strongest signal of global air–sea interaction, the mechanism and climate impacts of the El Niño–Southern Oscillation (ENSO) have attracted substantial scientific attention [1,2,3,4]. Unlike the conventional ENSO, a new type of ENSO in which sea-surface temperature (SST) anomaly centers occur in the equatorial central Pacific, which is sometimes called El Niño Modoki [5], warm pool El Niño [6], or central Pacific ENSO [7] has occurred frequently recently. To be clear, we will use the term central Pacific (CP) ENSO.
Low-frequency oscillation of the atmosphere, including interseasonal oscillation (ISO) (30–60 d) and quasi-biweekly oscillation (QBO) (10–20 d) [8], can interact with oscillations at other time scales, causing large-scale atmospheric anomalies. There are significant differences in time scale between ISO and ENSO, and interactions between them have been discussed widely. Li et al. [9] noted that the interannual anomalies of the enhanced Madden–Julian Oscillation (MJO) can arouse El Niño to some extent and that the occurrence of El Niño can suppress the intensity of MJO. Gushchina and Dewitte [10] found that the MJO is enhanced during the developing, mature, and decaying phases of CP El Niño but that the enhanced MJO only occurs during the developing phase of the eastern Pacific (EP) El Niño. The analysis performed by Yuan et al. [11] also showed that from mature winter to subsequent spring of CP El Niño, the intensity of MJO activity can suddenly strengthen and be stronger than that of the developing summer and spring. A study conducted by Feng et al. [12] indicated that MJO activity was weak during EP El Niño, especially in its 4th–6th phases, but exhibited notably enhanced and suppressed amplitudes in its different phases during CP El Niño.
Many researchers have studied the influence of ENSO on precipitation in China. Gao et al. [13] noted that interdecadal changes were quite different in the asymmetric impacts of ENSO on wintertime rainfall over China and atmospheric circulations over western North Pacific. A study conducted by Zhang et al. [14] demonstrated that the ENSO phase transition from La Niña to El Niño was one of the important precursors of prolonged spring–summer drought over north China. Karori et al. [15] indicated that the two types of ENSO have asymmetric features with respect to the impact of their positive and negative phases on boreal summer rainfall over the Yangtze River Valley (YRV) and South China (SC). The relationship between rainfall over the YRV and the CP La Niña is positive and significant, whereas rainfall over SC has a significant positive relationship with CP El Niño. A study conducted by Cao et al. [16] showed that EP El Niño in the developing phase had the largest influence on ENSO-related precipitation in China among the EP or CP ENSO regimes. Zhang et al. [17,18] pointed that ENSO longitudinal positions during decaying phase can result in distinct meridional structures of the tropical Pacific convection anomalies. They emphasize that the impacts of CP El Niño on the Spring precipitation over southern China depend crucially on the simultaneous zonal location of warm sea surface-temperature anomalies (SSTAs) in the tropical Pacific.
Although many studies concerning the effects of the two types of ENSO on precipitation in China and research on interactions between atmospheric low-frequency oscillation and the two types of ENSO have been conducted, most of these aimed to reveal the relationship between ENSO and MJO or seasonal precipitation in China influenced by ENSO [19,20,21,22]. The impacts of low-frequency atmospheric oscillation on rainfall in China during a decaying year of CP ENSO have rarely been reported. Moreover, eastern China is an economically developed and densely populated region, and it is also a region where abundant precipitation frequently occurs. The low frequency variations in multiple time scales is an important factor that affects precipitation in eastern China. Therefore, it is of scientific significance and social value to study the low-frequency precipitation in eastern China. This study focused on low-frequency precipitation in eastern China during the decaying summer of CP ENSO. We investigated the evolution features of low-frequency oscillation of the atmosphere, how low-frequency atmospheric change influences low-frequency precipitation and compared the difference between CP El niño and La niña.
2. Data and Methods
2.1. Data
Data utilized in present study include the daily precipitation data (mm) recorded at 753 observation stations from 1961–2016 provided by the National Meteorological Information Center in China, daily reanalysis data derived from National Centers for Atmospheric Prediction (NCEP)/National Center for Atmospheric Research (NCAR) including geopotential height (gpm), horizontal wind (m·s−1), vertical p-velocity (Pa·s−1), specific humidity (g·kg−1) (resolution: 2.5° × 2.5°), global reanalysis monthly mean SST (°C) from Met Office Hadley Centre observations datasets (resolution: 1° × 1°).
2.2. Methods
The power spectrum can diagnose the main significant period of the sequence while Morlet wavelets perform better in terms of local performance in the frequency and time domains [23]. Thus, power spectrum and Morlet wavelet analysis were used to find the low-frequency oscillation period of precipitation in this study. In addition, since the Lanczos filter has a narrow transition band, can effectively suppress Gibbs spurious waves, and retains almost all variances in the window, the Lanczos filter (filtering parameter n = 121) was used to extract the low-frequency components of the physical quantities. The statiistical significance of the results was estimated by using a Student’s t-test.
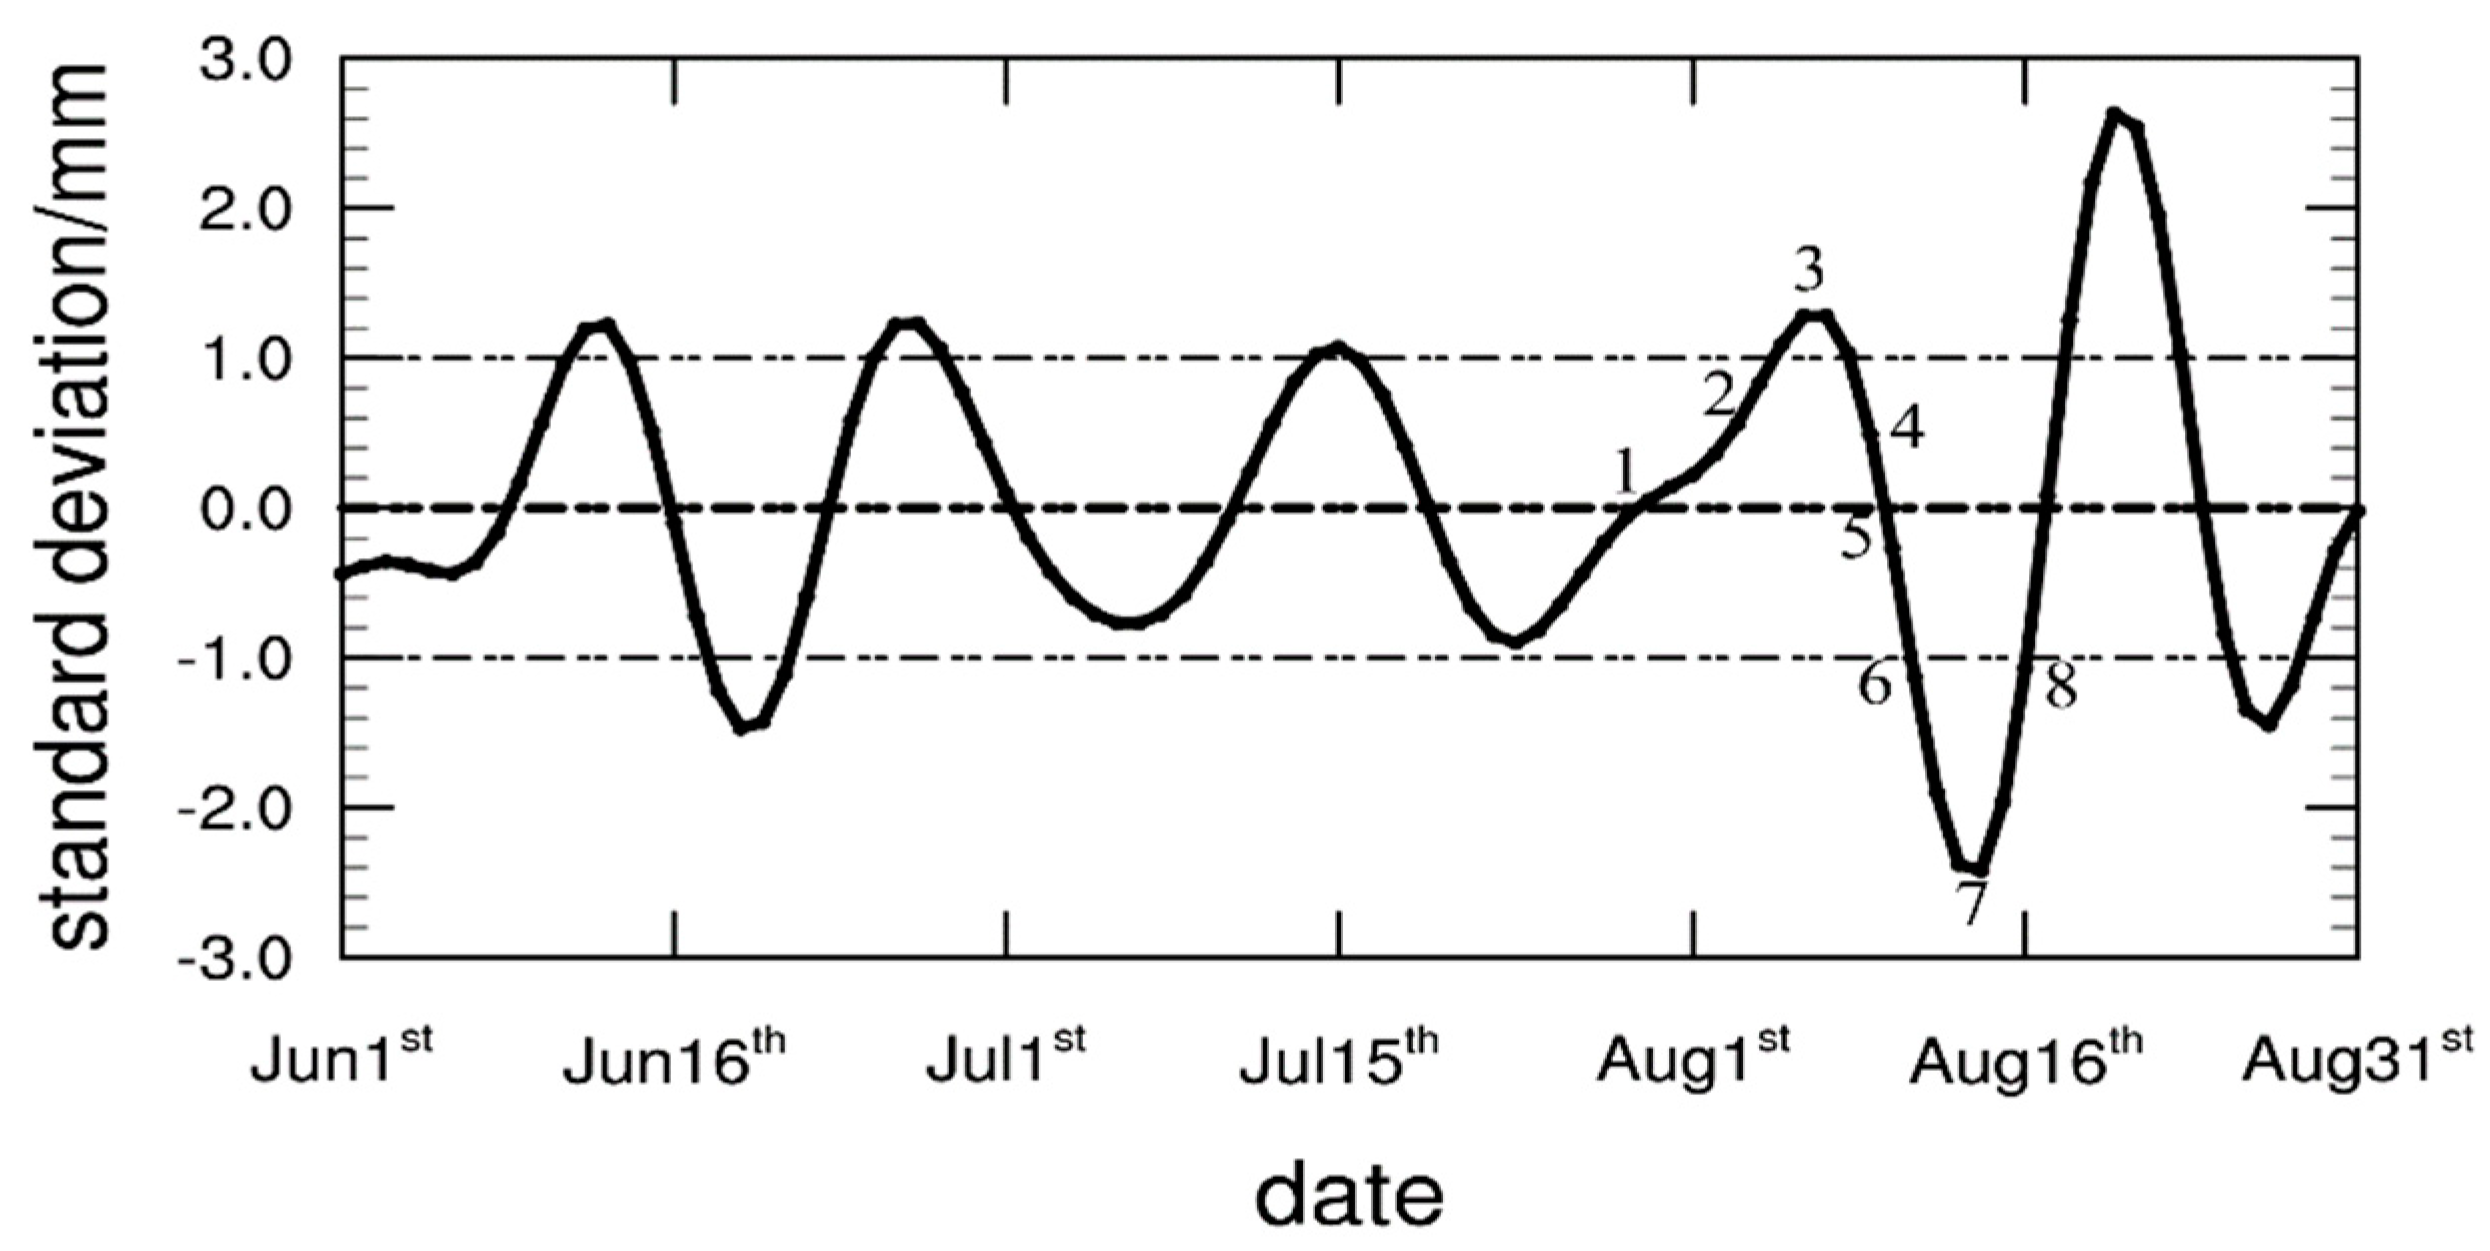
To understand the characteristics of low-frequency circulation systems related with low-frequency precipitation, each cycle of the low-frequency precipitation was divided into 8 phases according to previous studies [24], taking the year 2012 (decaying summer of CP La Niña) as an example (Figure 1), Phase 3(7) represents the extremely active(interruption) phase respectively. The phases 1(5) represents the transition phase, and Phases 2, 4, 6, and 8 represent the date when the low-frequency oscillation amplitude reaches half of the oscillation intensity. The phase definitions of other years were identical. Based on 1 times standard deviation, the low-frequency precipitation process with obvious phase distribution was selected, and the phase synthesis analysis was then carried out to analyze the effect of atmospheric low-frequency circulation field on low-frequency precipitation in eastern China during the decaying summer of CP ENSO through the evolution of 8 phases.
The wave-activity flux (WAF) [25,26] was calculated to describe the propagation characteristics of low-frequency oscillation energy in this study. The two-dimensional formula can be expressed as follows:
Here p signifies the ratio of the standard pressure and 1000 hPa, this paper take the June to August as the basic climate average airflow, is the horizontal zonally varying basic flow, U and represents the zonal and meridional wind components of the basic flow, denotes disturbance of the stream function.
3. Definition of Central Pacific El Niño–Southern Oscillation (CP ENSO) Events and Selection of Study Area
According to Kug et al. [6] and Feng et al. [12], a CP El Niño is identified when the winter mean (December–January–February, DJF) Niño4 index is greater than the Niño3 index and 0.5 °C. The August–September–October (ASO)/December–January–February (DJF) periods are regarded as the developing/mature periods of ENSO events. Thus, in this study, a CP El Niño (La Niña) was identified when the monthly mean (both ASO and DJF) Niño4 index was greater (less) than the Niño3 index and 0.5 °C (−0.5 °C). Seven CP El Niño events and seven CP La Niña events were identified, as shown in Table 1. It is worth noting that, due to its long duration, the 1998/2001 La Niña event was separated into three events (1998/1999, 1999/2000, and 2000/2001) and that the 2000/2001 event was identified as a CP La Niña event.
The difference of summer precipitation anomalies in eastern China during the decaying year of CP ENSO events is illustrated in Figure 2a (El Niño) and Figure 2b (La Niña). The summer precipitation anomalies of CP ENSO events presented a dipole-type reversed-phase distribution; that is, during the decaying summer of CP El Niño (La Niña), the positive (negative) anomaly center of the precipitation was located in the mid-latitude region of eastern China (the quadrilateral area) while the negative anomaly center was located in the south of the lower reaches of the Yangtze River. The selected region in Figure 2 is the region where the precipitation anomaly center was located, and the variation rate of precipitation in this region was large (figures not shown), indicating that the summer low-frequency precipitation may be active in the region. A total of 53 stations (Figure 2c) within the quadrilateral region were selected to represent the mid-latitude region of eastern China (28–35.5° N, 108–118° E).
4. Low-Frequency Precipitation Characteristics
To determine whether precipitation in the mid-latitude region of eastern China during the decaying summer of CP ENSO events had a significant low-frequency period and understand the low-frequency characteristics, the mean precipitation in the selected region was calculated to obtain the daily precipitation series of the decaying summer (June–July–August) of CP ENSO events for subsequent research, then a 5-day moving average was performed on the daily precipitation series to weaken the influence of high-frequency waves, and power spectrum and wavelet analysis were performed separately on the precipitation series. Table 2 illustrates the significant low-frequency oscillation period of the summer precipitation of CP ENSO. The power spectrum results showed that the period within 25 d and 60 d of CP El Niño was significant and that the peak of the power spectrum was usually between 8 d and 15 d in each year. Subsequently, the low-frequency components of different time scales of precipitation were obtained from the wavelet analysis. It was found that the 10–20 d low-frequency period occurred most frequently (6/7), whereas the 20–30 d and 30–60 d appeared less frequently (3/7). According to the power spectrum analysis of the summer precipitation of CP La Niña, there were significant periods on time scales within 20 d, 30 d, and 60 d, which made it difficult to distinguish the specific low-frequency components among the different time scales. As mentioned previously, the wavelet analysis indicated that the 10–20 d low-frequency significant periods occurred most often (5/7) and that the 20–30 d (2/7) and 30–60 d (3/7) periods occurred relatively less often.
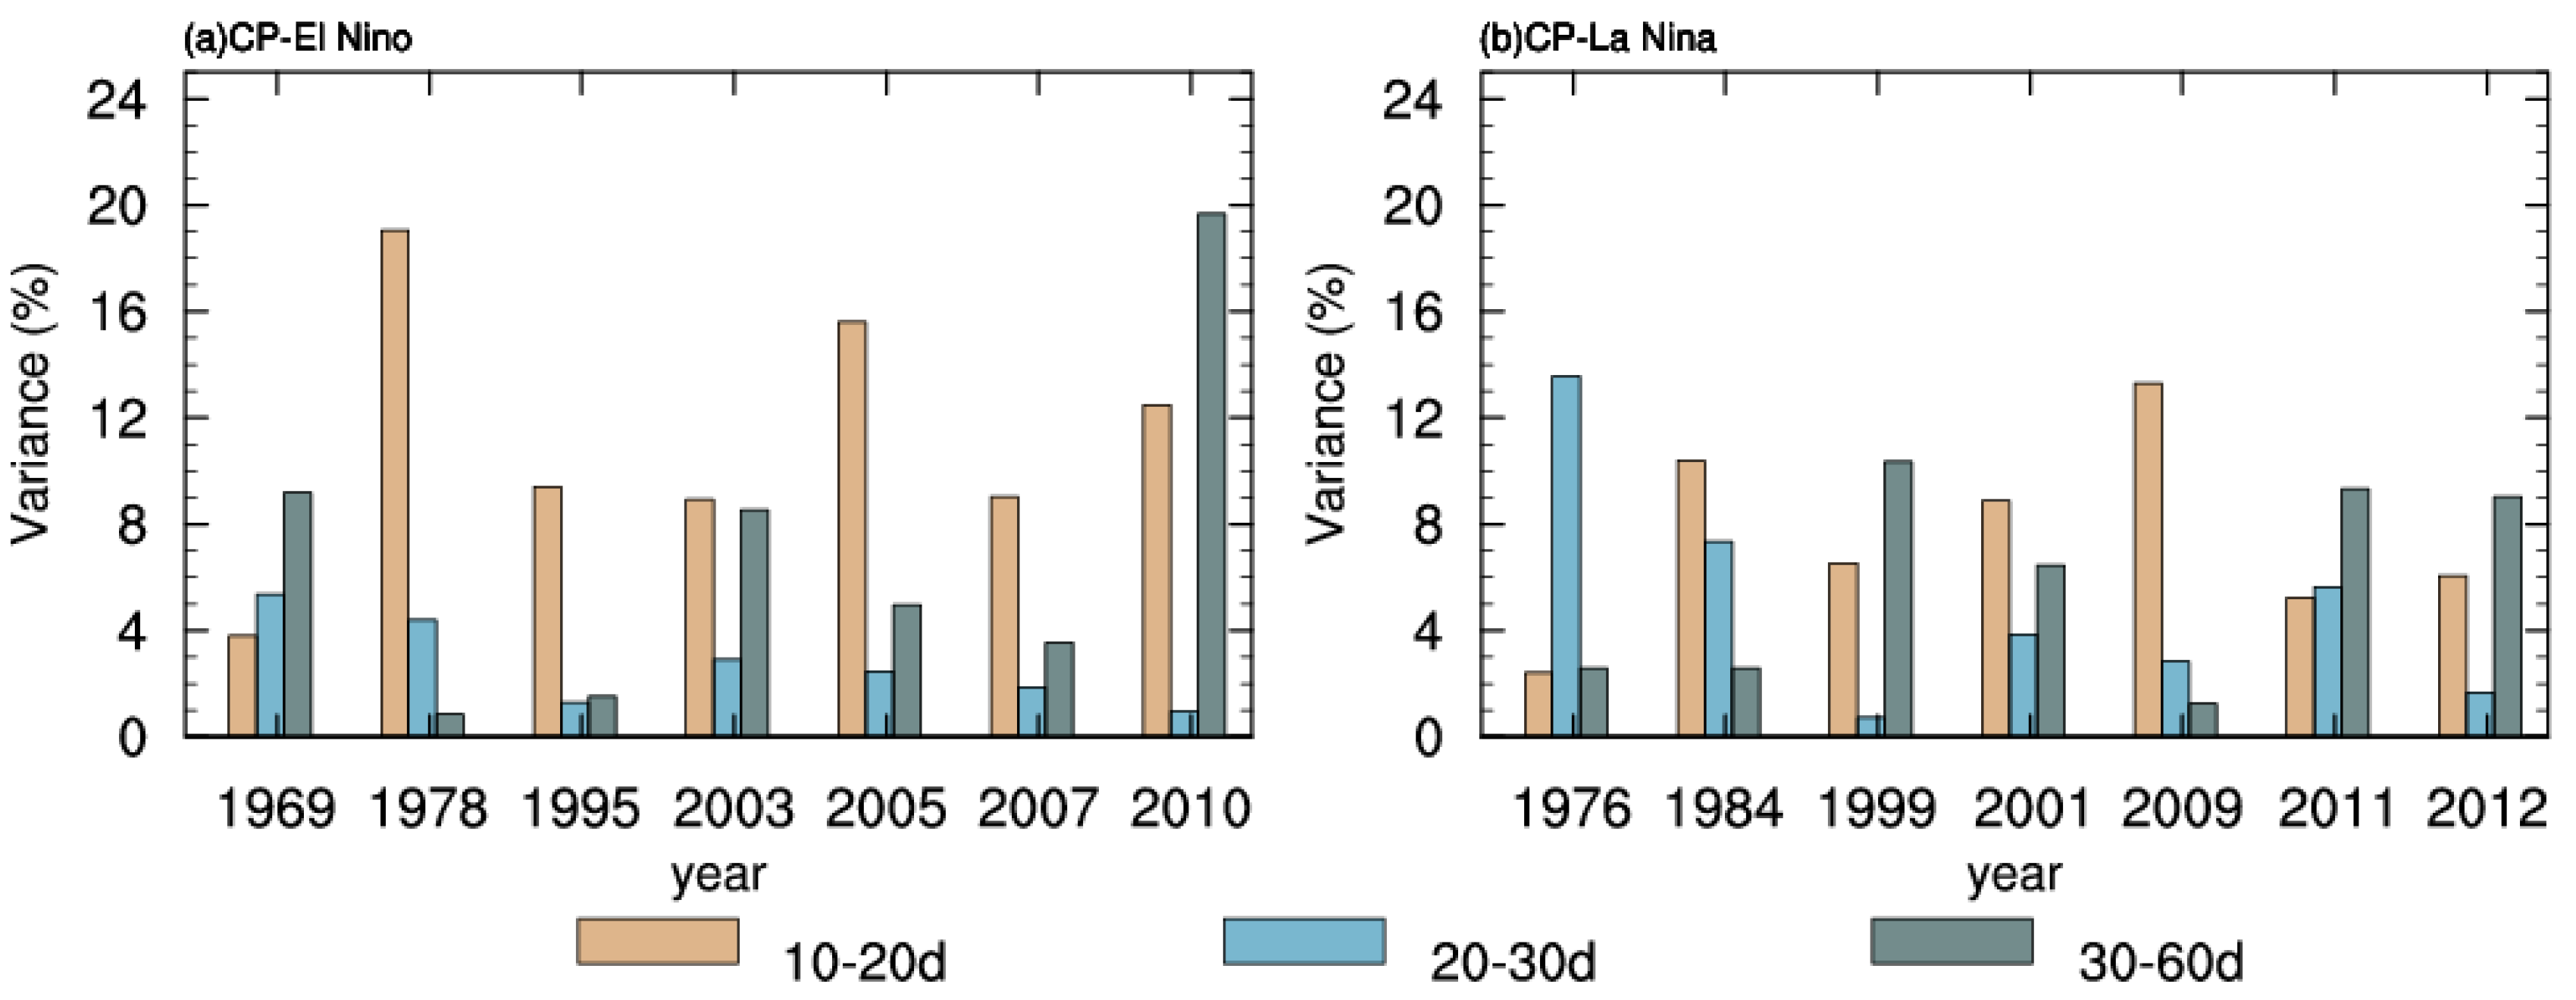
The above analysis showed that the summer precipitation of both CP El Niño and La Niña had a low-frequency oscillation period of 10–20 d, 20–30 d, and 30–60 d; however, it remained unclear which specific time-scale low-frequency component contributed more to summer precipitation. Therefore, the variance contribution rates of the low-frequency oscillation components of the different time scales accounting for the total summer precipitation variability of CP ENSO were calculated (Figure 3). As shown in Figure 3, in the decaying summer of CP El Niño, the 10–20 d low-frequency component was dominant in 1978, 1995, 2003, 2005, and 2007, whereas the 30–60 d low-frequency component was more important in 1969 and 2010. For CP La Niña, the 10–20 d low-frequency oscillation was significant in 1984, 2001, and 2009, but the 30–60 d low-frequency oscillation contributed more to precipitation in 1999, 2011, and 2012. That is, the 10–20 d and 30–60 d low-frequency oscillations of summer precipitation were as equally important for CP La Niña. Therefore, in this article, the period of 10–20 d was selected to study the low-frequency characteristics of precipitation in order to compare and analyze the differences of low-frequency systems affecting summer low-frequency precipitation in eastern China between CP El Niño and CP La Niña.
5. Circulation Characteristics of Low-Frequency Precipitation
Previous research [27,28] indicated that low-frequency oscillation of the atmosphere plays a very important role in the formation and maintenance of anomalous circulation, providing a favorable large-scale background for precipitation anomalies and facilitating more significant low-frequency oscillation characteristics in precipitation. The following portion of this article discusses the role of low-frequency atmospheric circulation systems in low-frequency precipitation in the decaying summer of CP ENSO at the time scale of 10–20 d in the upper, middle, and lower troposphere, as well as low-frequency vertical motion and low-frequency water vapor transport.
5.1. Large-Scale Circulation Background of Low-Frequency Precipitation
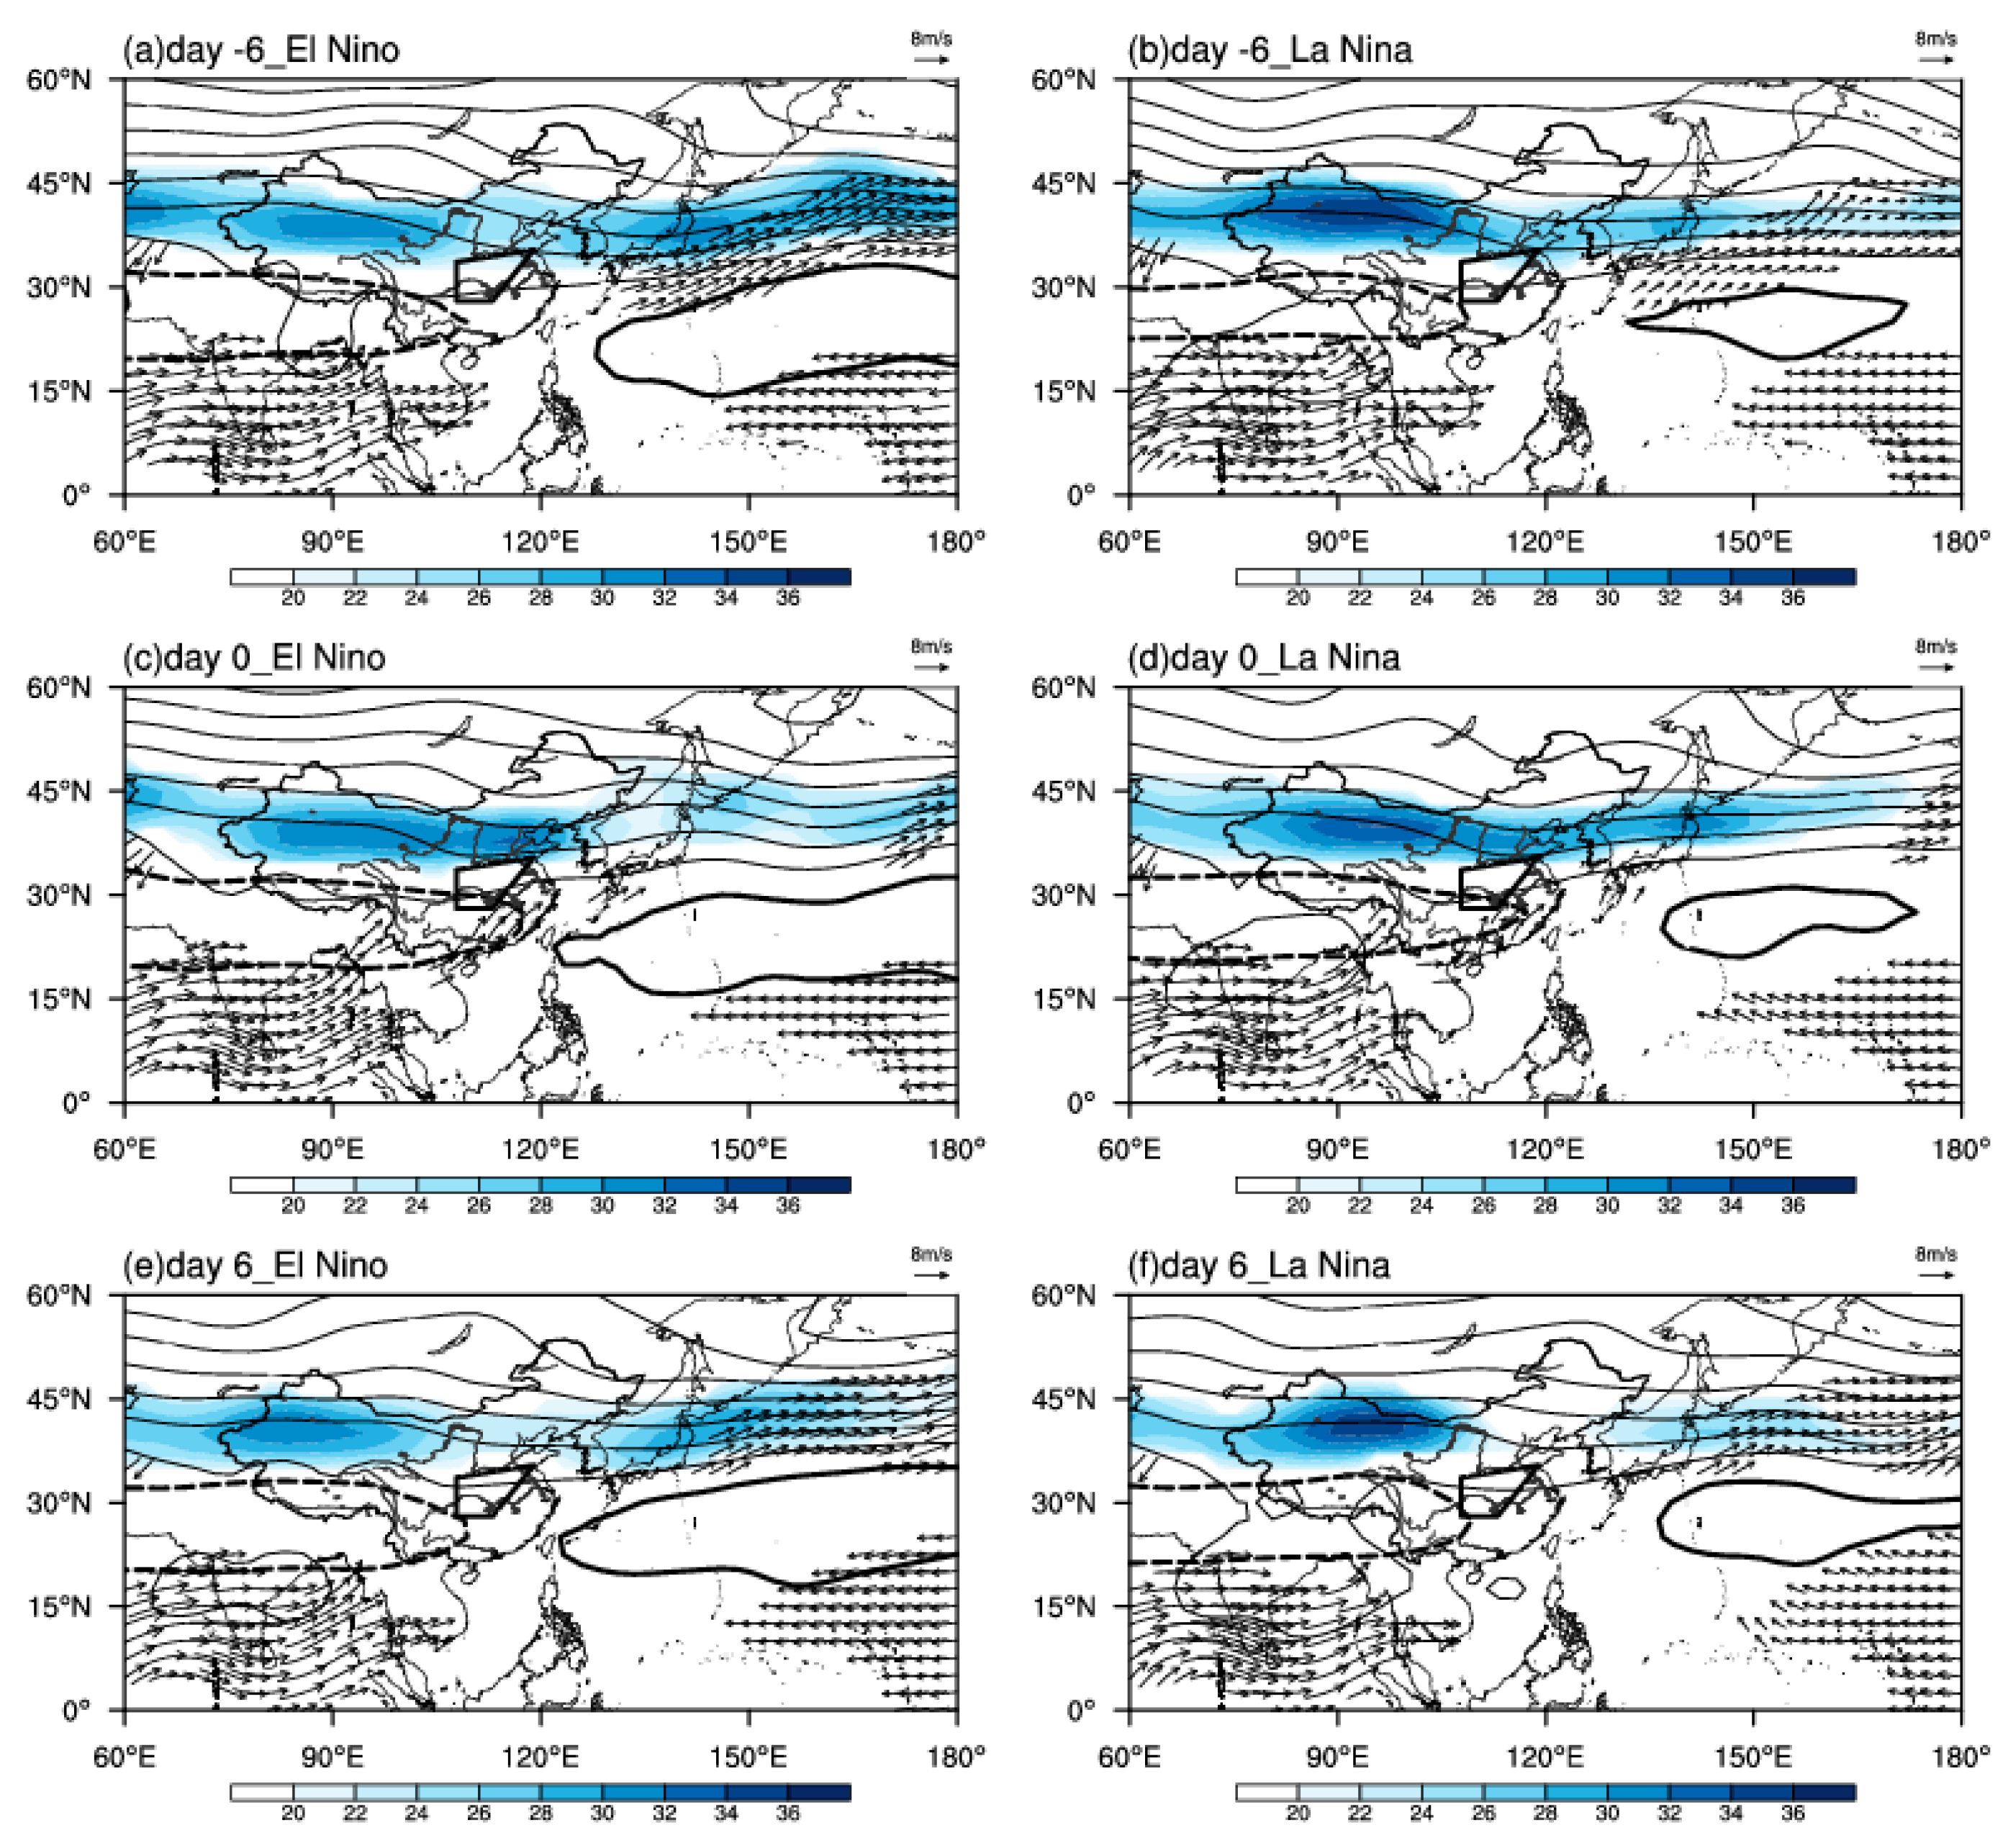
To understand the general characteristics of atmospheric circulation during low-frequency precipitation in eastern China in the decaying summer of CP ENSO events, unfiltered lead-lag composite analysis was performed on the atmospheric circulation field. Day 0 represents the starting date (the extremely active phase) of low-frequency precipitation and day −6 (day 6) denotes 6 days prior to (after) the starting date.
The circulation fields at different layers of the troposphere of the following summer of CP ENSO are shown in Figure 4. Previous studies [29,30,31] indicated that the South Asia High (SAH) and the Western Pacific Subtropical High (WPSH) are two crucial systems affecting atmospheric circulation in east Asia. On day −6 of CP El Niño (Figure 4a), the east ridge point of the SAH was located west of 110° E, a westerly jet at 200 hPa was excited in the northern part of the study area, and the west ridge point of the Western Pacific Subtropical High (WPSH) was near 126° E. The “two ridges and one trough” situation was quite stable at middle and high latitudes of 500 hPa. On day 0, the east ridge point of the SAH moved eastward to west of 120° E, and with the range expanded, the west ridge point of the WPSH also extended to around 120° E; that is, the latitudinal positions of the SAH and the WPSH were nearly overlapped. The westerly jet at 200 hPa was strengthened and the trough at 500 hPa was deepened. At the same time, warm-wet airflow from lower latitudes at 850 hPa merged with cold-dry air from south of Lake Baikal, causing precipitation in eastern China. On day 6, the east ridge point of the SAH retreated to around 110° E, with the westerly jet obviously weakened, and the WPSH retreated slightly. Meanwhile, the wind speed in the lower troposphere decreased and low-frequency precipitation was interrupted.
The circulation fields of the troposphere during the decaying summer of CP La Niña were quite different from those of CP El Niño. From day −6 to day 6, the movement of the SAH changed from eastward to westward, and the westerly jet at 200 hPa weakened gradually. The circulation at mid–high latitudes of 500 hPa presented a relatively stable “two ridges and one trough” situation. In addition, the range of the WPSH was quite small and the west ridge point was basically around 135° E. The wind field of 850 hPa was weak, and the latitudinal distance between the SAH and the WPSH was relatively far. The closest latitudinal distance between them was approximately 20 degrees of longitude on day 0. The trough in the middle troposphere was deepened, but the speed of the southwest wind before the trough was low, and less precipitation formed.
Obviously, the circulation fields of low-frequency precipitation during the following summer of CP El Niño and CP La Niña were significantly different. This raises the following questions: Why did the original circulation field at different layers of troposphere present such a distinct configuration during the occurrence of low-frequency precipitation in the decaying summer of the CP ENSO events? Are there any crucial low-frequency circulation systems, and how do they affect low-frequency precipitation?
5.2. Influence of Low-Frequency Circulation Field and WAF in the Upper Troposphere
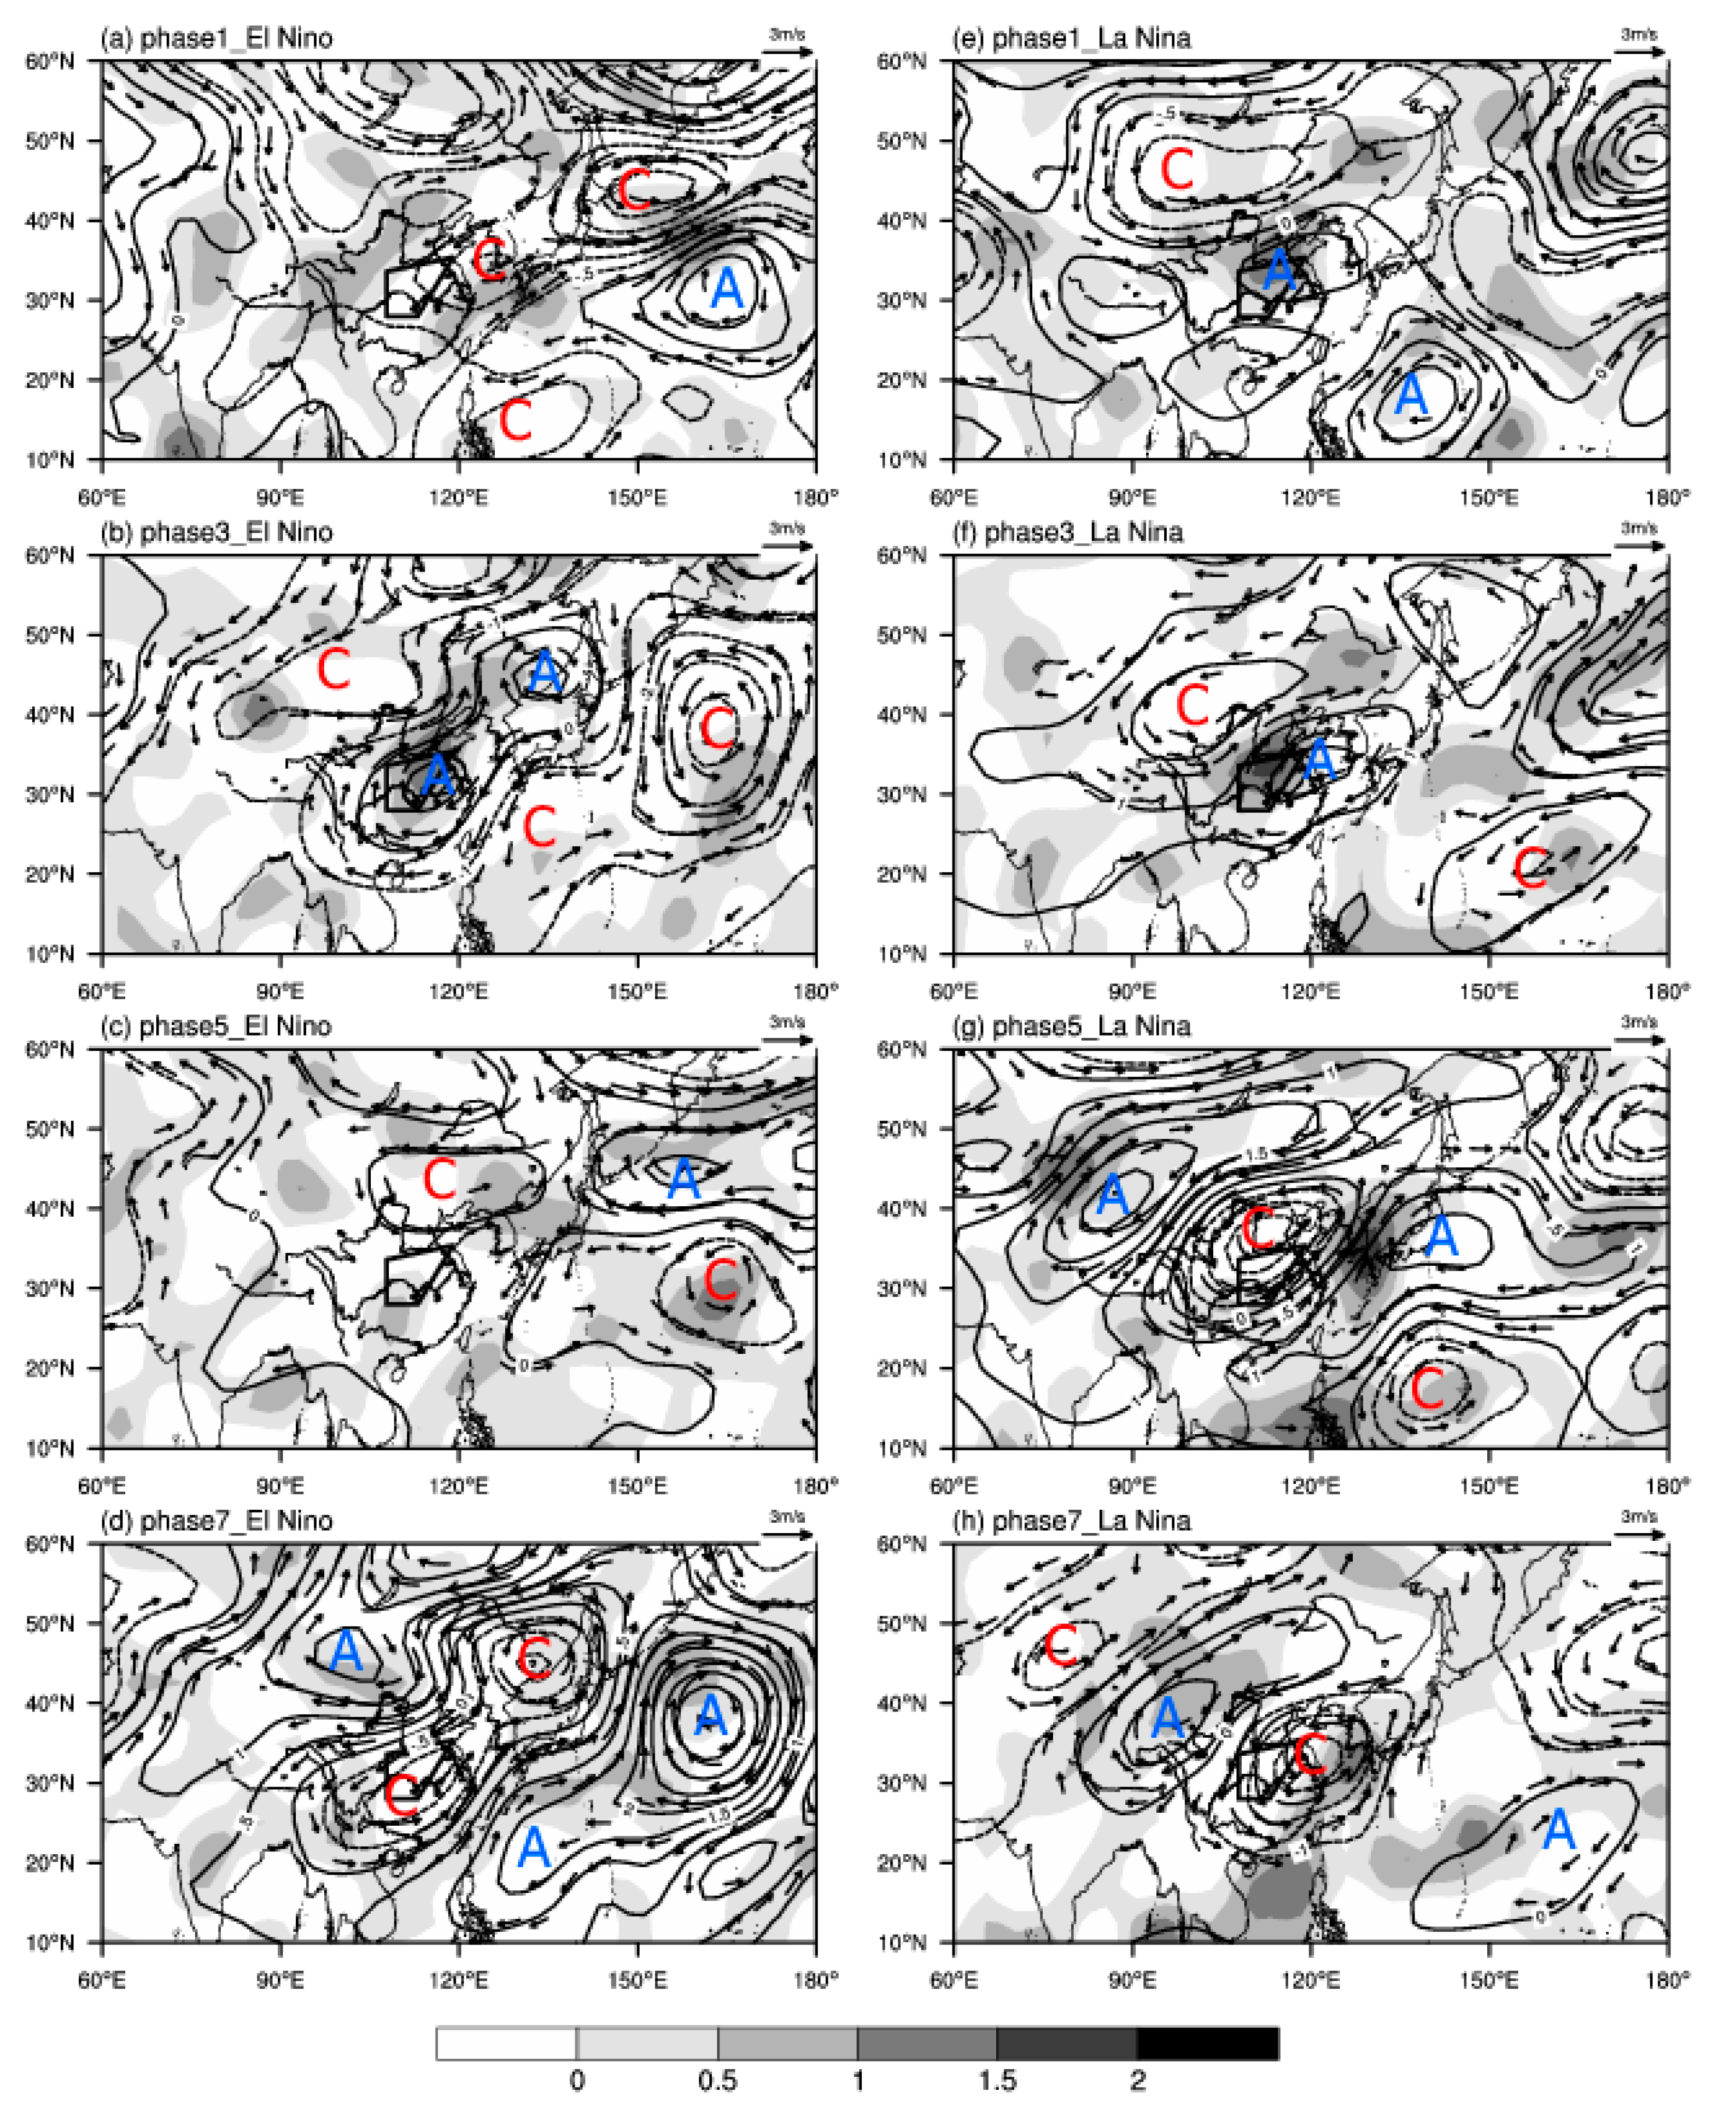
To study the characteristics of the low-frequency circulation field in the upper troposphere, the composite analysis of the circulation field was filtered for 10–20 days. Figure 5 shows the phase evolution of the low-frequency divergence field, low-frequency stream function, and non-divergence wind field of 200 hPa in the decaying summer of CP El Niño and CP La Niña.
During the decaying summer of CP El Niño events, Phase 1 (Figure 5a), there was a low-frequency cyclonic circulation over the Yellow Sea, and a low-frequency anticyclone appeared over northern China. Thus, the study area’s prevailing northerly flow was to the west of the low-frequency cyclone and at the bottom of the low-frequency anticyclone, being controlled mainly by low-frequency convergence. Meanwhile, the area from the Philippine islands to Taiwan Island was controlled by a low-frequency cyclone from low latitudes. Additionally, there was a low-frequency cyclone to the south of the Okhotsk Sea and a low-frequency anticyclonic circulation over the northwest Pacific, southeast of the cyclone. In Phase 2 (figure not shown), there was a low-frequency cyclone to the southwest of Lake Baikal, while both northeastern China and eastern China were under the control of a low-frequency anticyclonic circulation, with strong low-frequency divergent airflow prevailing over eastern China. There was also low-frequency anticyclone over the northwest Pacific at middle latitudes and to the northeast of the Philippines at lower latitudes, but the former was much stronger. Therefore, from Phase 2 to Phase 4, there was a northwest–southeast wave train from the southwest of Lake Baikal to the east of the Philippines and an east–west wave train from the southwest of Lake Baikal to the east Pacific of Japan (i.e., two low-frequency cyclone–anticyclone–cyclone wave trains). In Phase 3 (Figure 5b), the low-frequency anticyclonic circulation over eastern China was obviously strengthened, so most central and eastern parts of China were under the control of a strengthened low-frequency divergent airflow. In Phase 5 (Figure 5c), a low-frequency cyclone appeared to the southeast of Lake Baikal, and the low-frequency anticyclone over eastern China had disappeared, leading to a portion of the study area starting to be dominated by low-frequency convergent flow. In addition, there was a low-frequency cyclone and a low-frequency anticyclone over the northwestern Pacific to the east and to the southeast of Japan, respectively. During Phase 7 (the extreme disruption phase, Figure 5d), the former low frequency cyclones over northeastern China moved eastward and developed while the low-frequency cyclone controlling the whole of eastern China strengthened, causing the study area to be under the control of the low-frequency convergent airflow. The two former low-frequency anticyclones over the northwestern Pacific merged into one.
Circumstances were completely different for the following summer of CP La Niña. In Phase 1 (Figure 5e), there was a low-frequency cyclone to the southwest of Lake Baikal at high latitudes while the study area in eastern China was under the control of a low-frequency anticyclone, with low-frequency divergence prevailing over eastern China at high altitude. A closed low-frequency anticyclone existed near the Bailing Strait. Meanwhile, the areas to the east of the Philippines and to the east of the Japan Islands at low latitude were controlled by low-frequency cyclones. During Phase 3 (Figure 5f), the low-frequency cyclone to the south of Lake Baikal and the low-frequency anticyclone over eastern China both strengthened, which caused the study area, which was at the bottom of the low-frequency cyclone and in front of the low-frequency anticyclone, to be controlled by strong low-frequency divergent flow. In Phase 5 (Figure 5g), an obvious low-frequency anticyclone was generated to the southwest of Lake Baikal, and a strong low-frequency cyclone took control of China, where the low-frequency convergent flow dominated, while a low-frequency anticyclone over the ocean east of the Japan Islands began to form. Then, the low-frequency anticyclone to the southwest of Lake Baikal and the strong low-frequency cyclone over China moved to the southeast. In Phase 7 (Figure 5h), there was an obvious northwest–southeast wave train from Lake Balkhash to the ocean east of the Philippines (a low-frequency cyclone/anticyclone/cyclone/anticyclone wave train), and the strong low-frequency cyclone controlling eastern China enabled low-frequency divergent flow to dominate the study region, which may cause the interruption of low-frequency precipitation.
It is obvious from the analysis above that the low-frequency circulation systems in the upper troposphere were well matched with the low-frequency divergent circulation, which means that the low-frequency cyclones (anticyclones) were always accompanied by low-frequency convergent (divergent) flow. In the decaying summer CP El Niño event, during phase 2 to phase 4 of low-frequency precipitation, a low-frequency cyclone/anticyclone/cyclone wave series appeared from northwest to southeast, and the low-frequency circulations of phase 6 to phase 8 were nearly opposite those in phase 2 to phase 4. During the low-frequency precipitation in the decaying summer of CP La Niña, a northwest–southeast wave train of the low-frequency cyclone/anticyclone/anticyclone from northern Xinjiang to the Philippines was generated at phase 1 and maintained to phase 2. However, at phase 3, a low-frequency cyclone/anticyclone/cyclone wave train structure from northwest to southeast was induced and maintained until phase 4, and a strengthened low-frequency anticyclone appeared in the upstream. That is, during the occurrence of the low-frequency summer precipitation of CP El Niño, the maintenance of low-frequency wave train was longer than that of CP La Niña in the same period.
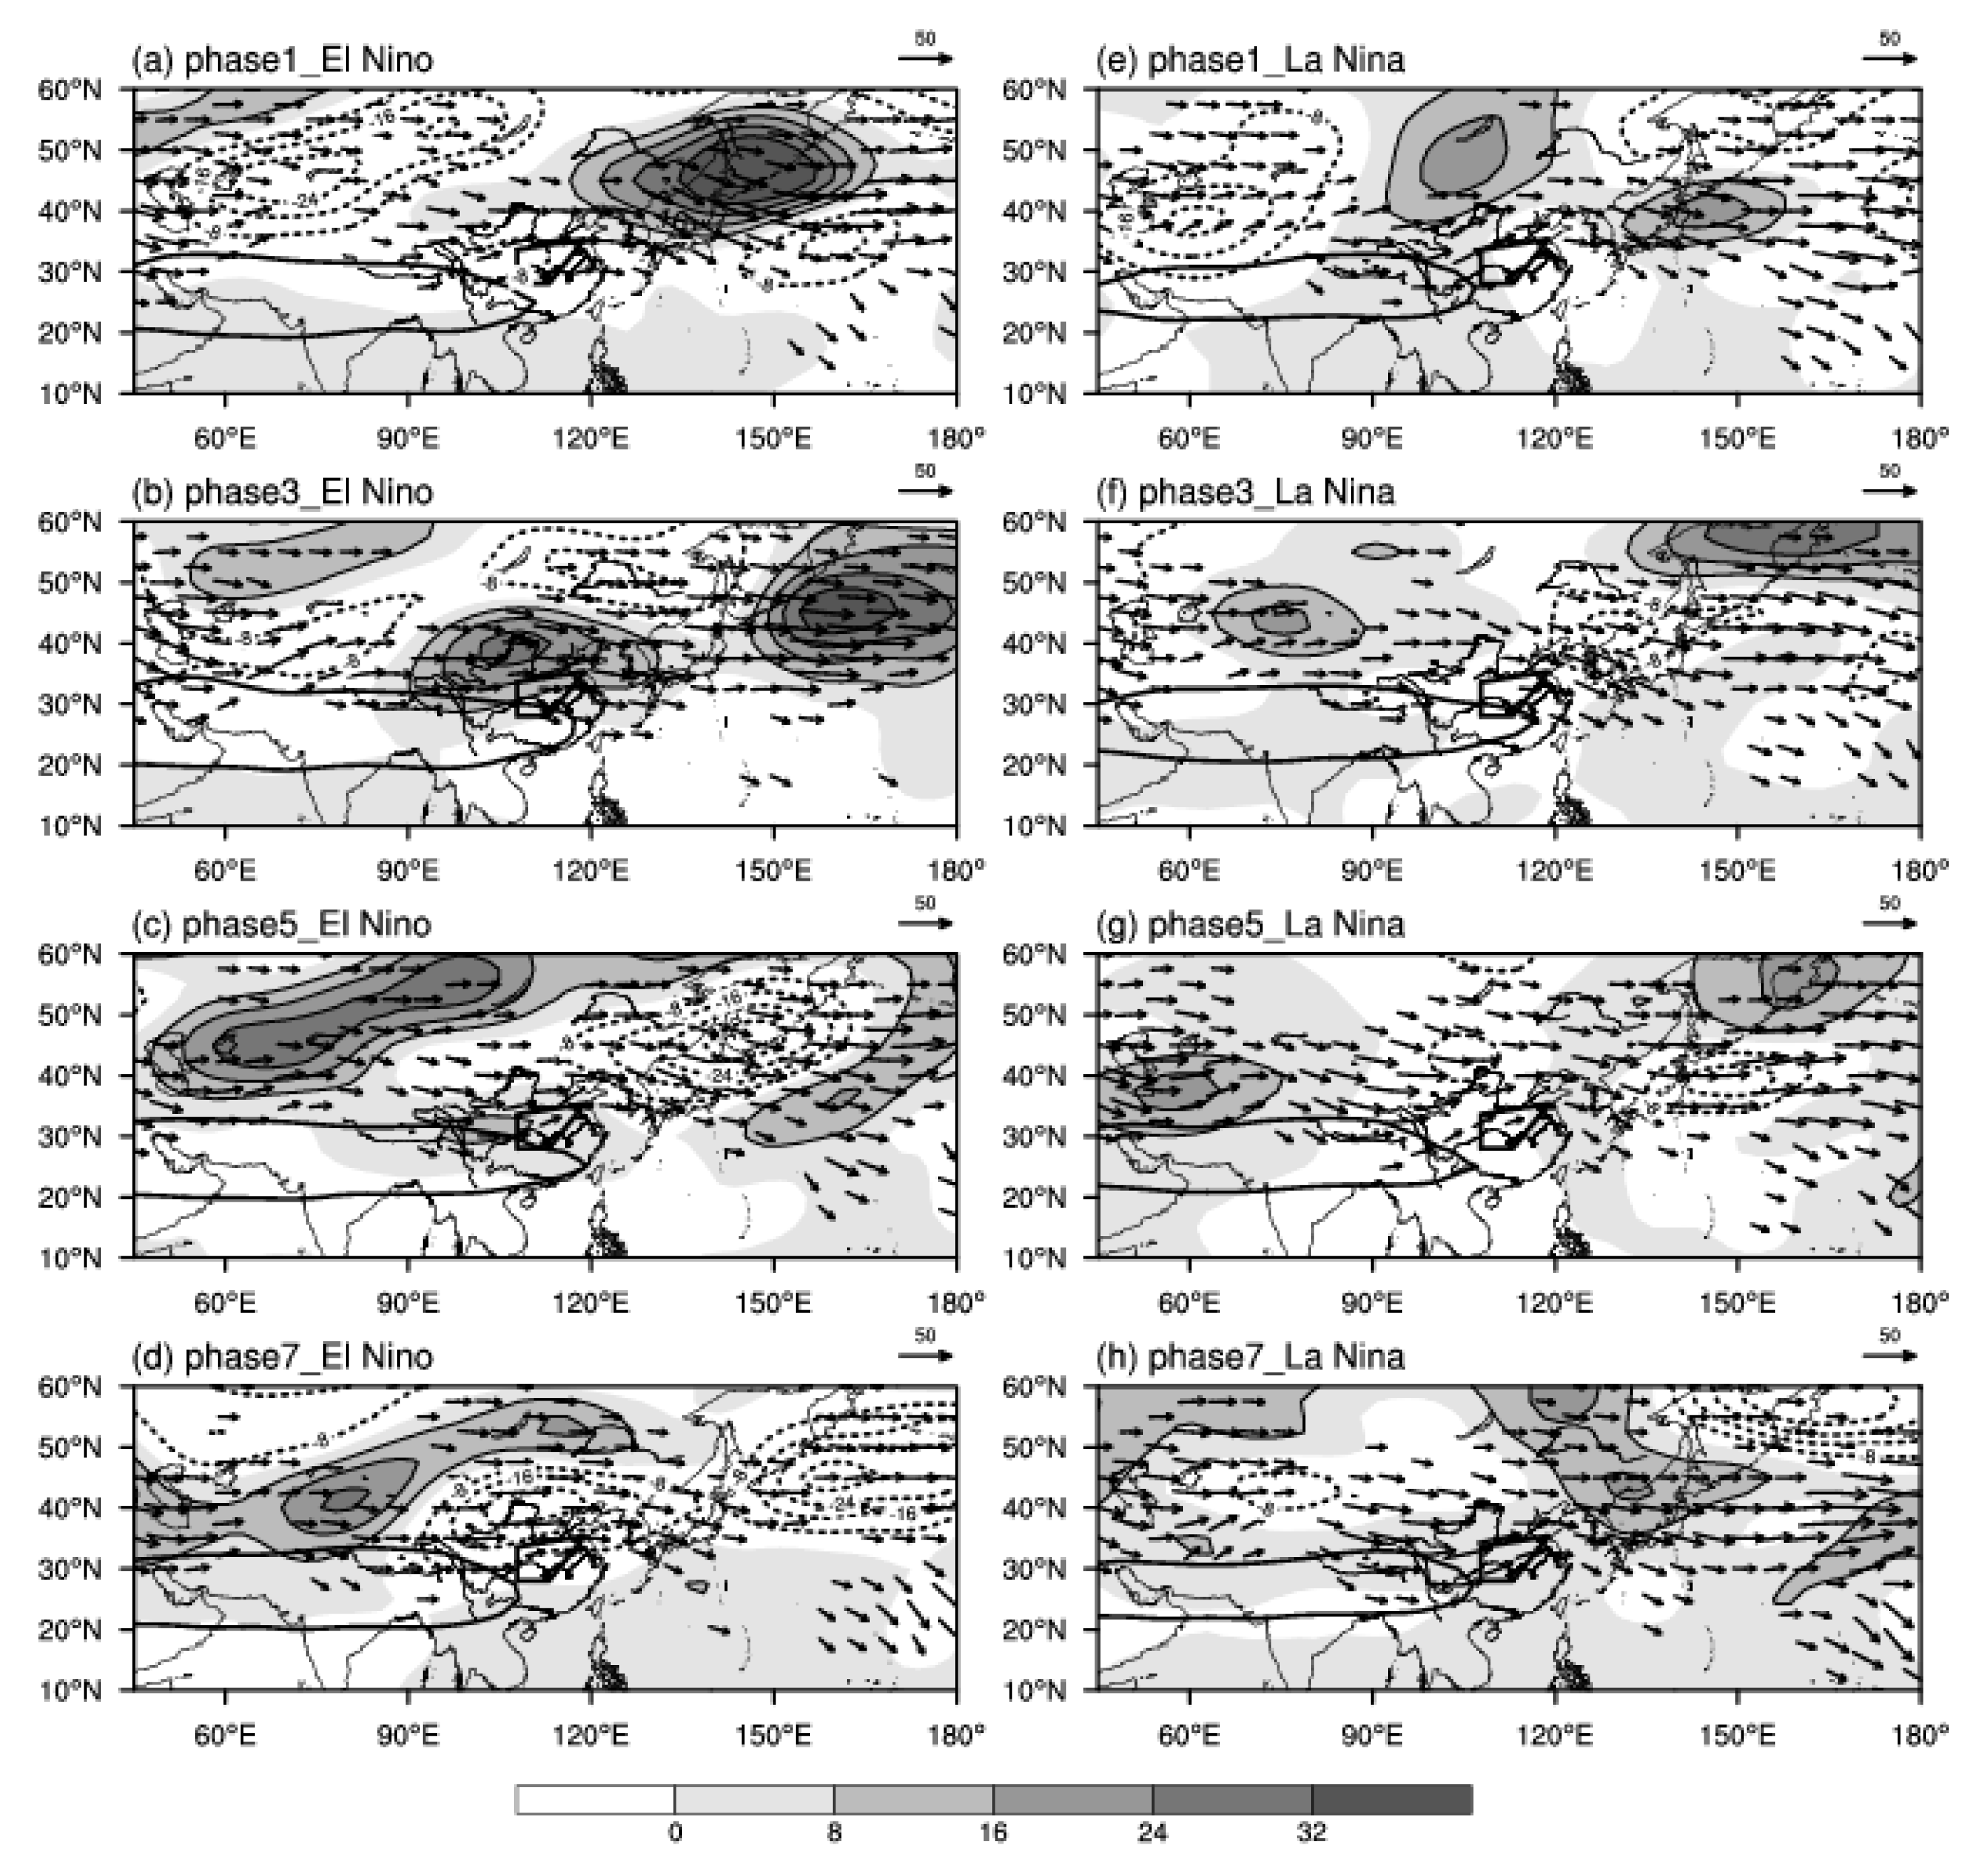
To further explore the possible connection between low-frequency wave train in the upper troposphere and low-frequency precipitation, Figure 6 shows the wave-activity flux (WAF) distribution and the low-frequency height field synthesized from 10–20 d precipitation of CP ENSO events. During the decaying summer of CP El Niño events, in Phase 1 (Figure 6a), there were two negative anomaly centers of low-frequency height field to the west of Lake Balkhash and Lake Baikal at high latitudes, while the area from the south of the Okhotsk Sea to northeastern China was controlled by a positive anomaly of the low-frequency height field. Meanwhile, over the ocean southeast of Japan, there was a negative low-frequency anomaly center, and most parts of China presented a weak negative low-frequency anomaly, south of which was the Equator area, which was controlled by a weak positive anomaly of the low-frequency height field. In addition, WAFs from low latitudes were transported northeastward to the study region in eastern China while WAFs from northeastern China at high latitudes were transported southwestward to the western Pacific at lower latitudes. Thereafter, in Phase 2, the low-frequency positive anomaly over the southern Okhotsk Sea extended further to the northern part of China, causing the negative/positive/negative low-frequency height field anomalies that persisted from northwest of Lake Balkhash to the region southeast of southeastern China and its eastern ocean, which is consistent with the northwest–southeast wave train (low-frequency cyclone/anticyclone/cyclone) shown in Figure 6c. Southeastward WAFs from high latitudes converged with northeastward WAFs from low latitudes in the northern part of study region. In Phase 3 (Figure 6b), the low-frequency height field wave train from northwest to southeast retained the same character as a negative/positive/negative anomalies distribution. The difference was that the low-frequency height positive anomaly center originally located in the southern part of the Okhotsk Sea was then divided into two, causing most parts of eastern China to be under the control of the low-frequency height positive anomaly, and northwestward WAFs were transport to the study region. In Phase 5 (Figure 6c), there was westward WAFs transport from Balkhash Lake to western China, and the area of southwestern China to the study region was in a weak low-frequency height positive anomaly with southwest-oriented WAFs transport to the study area. During Phase 7 (Figure 6d), the low-frequency height negative anomaly in central China continued to strengthen and reached its strongest condition, rendering the study area under the control of intense low-frequency negative anomaly, with no obvious WAFs transport.
In the decaying summer of CP La Niña, Phase 1 (Figure 6e), there was a low-frequency height negative anomaly center to the east of the Caspian Sea, with two low-frequency height positive anomaly centers at Lake Baikal and the Japan Islands, respectively. In addition, the region from central and western China to the Bay of Bengal presented a weaker low-frequency height positive anomaly, while the southeastern coastal area of China, including the eastern part of the study area, was dominated by a weak low-frequency height negative anomaly. Meanwhile, the southwestward WAFs from the low-frequency height positive anomaly area at low latitudes were transported to the study region. In Phase 3 (Figure 6f), the range of the low-frequency height positive anomaly near Lake Baikal decreased (the positive anomaly center was located near Lake Balkhash), while eastern China was under the control of a low-frequency height negative anomaly. In addition, the northwestward WAFs transported from western Lake Baikal to the ocean east of China decreased when the WAFs arrived at the study region in eastern China, indicating that the transmission of WAFs of CP La Niña was quite different from that of CP El Niño. In Phase 5 (Figure 6g), there was westward WAFs transmission from Lake Balkhash to western China and southwestward WAFs transport to the study region, where a weak low-frequency height positive anomaly was located. In Phase 7 (Figure 6h), the low-frequency height negative anomaly peaked in central China, which placed the study region under strong low-frequency height negative anomaly control, with southwestward WAFs delivered from lower latitudes.
Therefore, during CP El Niño events, in the extremely active phase, low-frequency divergence as well as low-frequency height positive anomaly controlled the study region, usually accompanied with WAF’s conveyance from the west, which was consistent with the direction of low-frequency wave propagation and favorable for the formation and maintenance of low-frequency precipitation. In contrast, in the extreme interruption phase, low-frequency convergence as well as a low-frequency height negative anomaly had control over the study region, without apparent WAF flux conveyance, causing the interruption of low-frequency precipitation. For CP La Niña, low-frequency precipitation in the extremely active phase existed over the study region, low-frequency divergence was the same, but low-frequency height negative anomaly dominated, which was different from the case of CP El Niño, and the southeastward transition of WAFs was significantly weaker, so the favorable conditions of low-frequency precipitation were less than those of CP El Niño. Moreover, in the extreme interruption phase, low-frequency convergence but low-frequency height positive anomaly dominated the study region, with southwestward WAFs conveyance from lower latitudes.
5.3. Characteristics of Low-Frequency Circulation Field during Low-Frequency Precipitation in the Middle Troposphere
To study the influence of the low-frequency circulation field in the middle troposphere on low-frequency precipitation, Figure 7 shows the low-frequency geopotential height fields at 500 hPa of four phases (Phases 1, 3, 5, and 7) of CP El Niño and La Niña events synthesized from 10–20 d low-frequency precipitation. Meanwhile, for consideration of the atmospheric circulation background, the unfiltered 5880 gpm feature line was superimposed on the in-phase composition figures. According to the climate average field (figures not shown), the WPSH exhibited zonal band distribution, with the east ridge point located roughly at 25° E, 136° N. In addition, the circulation situation over eastern Asia in the high latitudes presented as two ridges and a trough.
During the following summer low-frequency rainfall of the CP El Niño, Phase 1 (Figure 7a), there was a low-frequency height positive anomaly center located to the northwest of the Aral Sea, which then extended to northern China. The area from Lake Baikal to northeastern China and the Japan Islands, along with the ocean to the east, was dominated by a low-frequency height negative anomaly, while southern China and the western Pacific Ocean at low latitudes were controlled by a weak low-frequency height positive anomaly when the study region was in front of the ridge and the west ridge point of the WPSH was located around 128° E. In Phase 3 (Figure 7b), the low-frequency height positive anomaly located north of the Aral Sea weakened, so the positive range was reduced. The region northeast of Lake Baikal and the region from the east of Lake Balkhash to northwestern China were both dominated by weak height negative anomalies, which enabled the trough located in western and central China to deepen. To the north of the Japan Islands, there was a low-frequency height positive anomaly center, which caused the East Asia ridge to strengthen. The location of the study region was just in front of the trough and behind the ridge, and the west ridge point of the WPSH was located at 121.6° E. The form of the low-frequency height field of Phase 5(7) was nearly opposite that in Phase 1(3), but the position of the WPSH was totally different. In Phase 5 (Figure 8c), the WPSH retreated with the west ridge point located at 122.6° E. During the extreme interruption period (Phase 7, Figure 7d), the WPSH continued to retreat eastward until the west ridge point was at 123° E.
It was obvious that the range and intensity of the WPSH were significantly weaker during the low-frequency summer precipitation of CP La Niña events than during CP El Niño events. In Phase 1 (Figure 7e), the region from north of Lake Balkhash to southern China, including the South China Sea, was under the control of a low-frequency height positive anomaly, which caused the low-frequency height positive anomaly control of the study region, where the westerly was prevailing. A center of low-frequency height negative anomaly was located in southeastern Mongolia, while the Bering Strait was dominated by abnormal low-frequency height and the west ridge point of the WPSH was located at 140° E. In Phase 3 (Figure 7f), large areas from the Caspian Sea via Lake Baikal to the Ekhotsk Sea at mid–high latitudes were under the control of the low-frequency positive anomaly, while most of the central and eastern parts of China were dominated by the low-frequency anomaly whose center was located in the lower reaches of the Yellow River, causing the trough to deepen, which was also favorable for the formation of precipitation in the study area. The Japan Islands and the adjacent southeastern Pacific Ocean presented with a low-frequency height positive anomaly, which strengthened the ridge to the north of the Japan Sea, causing the expanded range of the WPSH. The west ridge point was located at 136.6° E. The form of the low-frequency height field of Phase 5(7) was nearly opposite that of Phase 1(3), but the position and range of the WPSH were totally different. From Phase 5 (Figure 7g) to Phase 7 (Figure 7h), the west ridge point of the WPSH retreated from 137.2° E to 139° E.
In summary, in the decaying summer of the CP ENSO event, the range and intensity of the WPSH showed significant differences, as did the evolution of low-frequency height fields in the middle troposphere. However, the influence of the low-frequency height fields on the ridge/trough and the WPSH were quite similar. The positive (negative) anomaly of the low-frequency height field in the western Pacific was favorable for the westward extension (eastward retreat) of the WPSH and the strengthening (weakening) of the high pressure ridge of the east coast of Asia. The negative (positive) anomaly of the low-frequency height field in central and western China caused the low trough in East Asia to deepen (weaken), which was beneficial to the occurrence (interruption) of the low-frequency precipitation in the study region.
5.4. Influence of Low-Frequency Circulation Fields in the Lower Troposphere
The characteristics of low-frequency circulation fields in the lower troposphere were analyzed synthetically through the evolution of the phases. Figure 8 shows the phase evolution of the low-frequency divergence field and low-frequency wind field of 850 hPa during the decaying summer of CP El Niño and CP La Niña events.
During the summer of CP El Niño, when the low-frequency precipitation started (Phase 1, Figure 8a), there was a low-frequency anticyclonic circulation to the south of the Indian Peninsula while a low-frequency southerly wind from the east of the Bay of Bengal prevailed over eastern China. The low-frequency southerly wind from lower latitudes converged with a low-frequency northerly wind from high latitudes, causing eastern China to be within a low-frequency convergence region. The mid–low latitudes of the southeastern ocean of the Japan Islands were affected by a low-frequency anticyclone. In the extremely active phase of low-frequency precipitation (Phase 3, Figure 8b), the low-frequency wind field in eastern China was still dominated by cyclonic circulation and the low-frequency southwest wind from the Bay of Bengal mainly prevailed to the south of the Yangtze River. This wind then combined with low-frequency easterly flow, causing eastern China to be in the control of low-frequency divergent airflow. At this time, the low-frequency anticyclone over the northwestern Pacific was located in the southern part of the Japan Islands, and a strong low-frequency cyclonic circulation existed to the east of the region. The form of the low-frequency wind field in the lower troposphere of Phase 5(7) was almost opposite that in Phase 1(3).
Circulations were completely different during the summer of CP La Niña. In Phase 1 (Figure 9e), the low-frequency wind field to the east of Lake Baikal presented a cyclonic circulation, there was a low-frequency anticyclonic circulation over the South China Sea, and the southern Japan Islands were dominated by a low-frequency cyclone. The bottom of the low-frequency cyclone existed to the north of the study region and the low-frequency anticyclone was in the south of the region, causing the study region to be controlled by low-frequency convergence and prevailing low-frequency southwesterly flow. In the extremely active phase of low-frequency precipitation (Phase 3, Figure 8f), the northern low-frequency cyclonic circulation center moved to the vicinity of the northern Bohai Sea, while the intensity of the low-frequency anticyclonic circulation over the South China Sea weakened slightly, so the northerly flow from the rear of the low-frequency cyclone in the north converged with the southwesterly flow from the top of the low-frequency anticyclone in the South China Sea over the study region, which was favorable for low-frequency rainfall. At this time, a strong low-frequency anticyclonic circulation appeared in the northwestern Pacific Ocean to the south of the Japan Islands. A circumstance similar to the case of CP El Niño was that the form of the low-frequency wind field in lower troposphere of Phase 5(7) of CP La Niña was nearly opposite that in Phase 1(3).
As can be seen, in the lower troposphere, low-frequency circulation systems affecting summer low-frequency precipitation of CP El Niño were mainly the low-frequency cyclone (anticyclone) in eastern China, which caused the low-frequency convergent (divergent) airflow to dominate the study region, thus facilitating the formation and maintenance (weakening and interruption) of low-frequency precipitation; while the generation and cessation of low-frequency precipitation during the summer of CP La Niña was due to the combination of a low-frequency cyclone (anticyclone) in northern China and a low-frequency anticyclone (cyclone) over the South China Sea, which affected the low-frequency convergence or divergence of the study region in the lower troposphere and influenced the low-frequency precipitation.
5.5. Evolution of the Low-Frequency Vertical Velocity
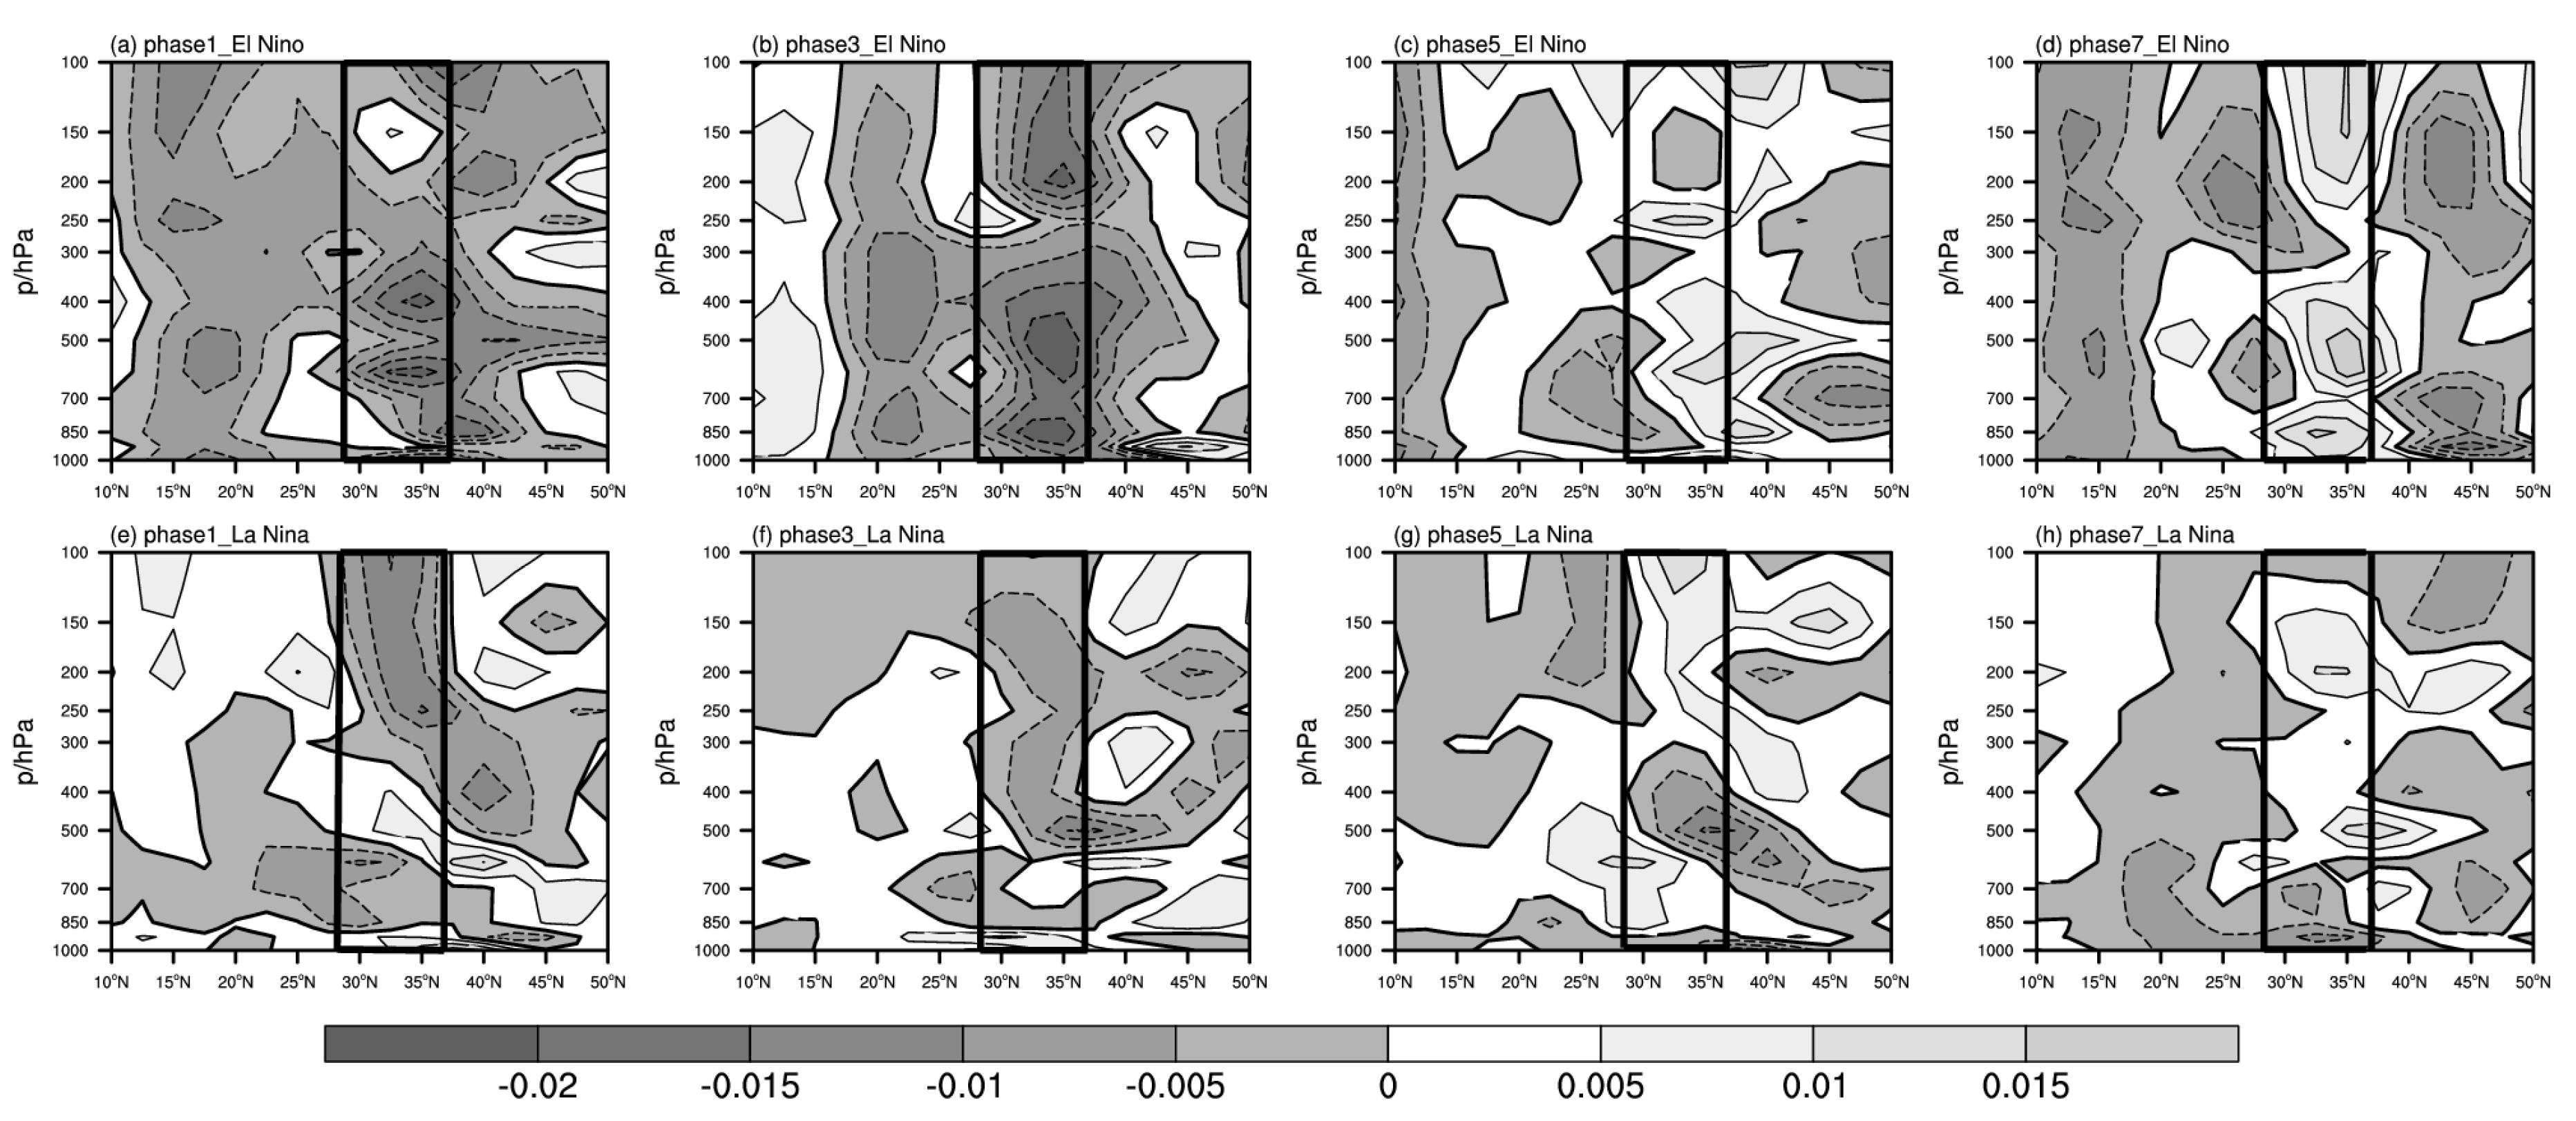
Vertical movement has a positive effect on the generation and maintenance of precipitation, and it is also a good reflection of precipitation. The meridional average of the study area summer precipitation anomalies (108–118° E) during the decaying year of the CP ENSO event was calculated to obtain the synthetic distribution of the latitude–height profile of four phases of the 10–20 d low-frequency vertical velocity.
When the low-frequency precipitation of the CP El Niño started (Phase 1, Figure 9a), upward airflow over the study area was rising from the lower layer to the upper layer, providing beneficial dynamic conditions for low-frequency precipitation. During the extremely active phase (Phase 3, Figure 9b), the study region presented a consistently strong ascending motion from the ground to high altitude and was located at the rear of the ridge and in front of the trough of low-frequency height fields at 500 hPa, which enabled the strongest low-frequency precipitation. The form of the low-frequency vertical velocity of Phase 5(7) was almost opposite that in Phase 1(3), indicating that in Phase 1 (Figure 9c), the downdraft started to play an important role in the study region. In the extreme interruption phase (Phase 7, Figure 9d), except for a weak ascending motion appearing in the middle and upper troposphere over a small part of the southern area, the study area was mainly controlled by the downdraft from the upper troposphere to the ground, causing the low-frequency precipitation to enter the extreme interruption period.
It was apparent that the low-frequency dynamic ascending conditions corresponding to the low-frequency precipitation of CP La Niña were significantly weaker than those of CP El Niño. In Phase 1 (Figure 9e), most of region of the study area in the lower and upper troposphere was dominated by rising motion, but the ground and the middle troposphere were controlled by a sinking movement. In the extremely active phase (Phase 3, Figure 9f), the ground and the lower troposphere (at around 700 hPa) over the northern study region showed a sinking motion, while most of the region still had prevailing ascending motion from the lower to upper troposphere. Meanwhile, the low-frequency precipitation reached its strongest condition, but the strength of the ascending motion was much weaker than that of CP El Niño. In Phase 5 (Figure 9g), the study area had an ascending motion in the middle troposphere and the lower and upper troposphere were still dominated by updrafts. At Phase 7 (Figure 9h), there was an ascending motion in the lower troposphere below 700 hPa but the middle and upper troposphere had a prevailing sinking motion, so the lack of consistent ascending conditions caused interruption of the low-frequency precipitation.
It was obvious that the low-frequency summer precipitation in the study region of the CP ENSO events was related highly to the low-frequency vertical motion of the region. The start and interruption of the low-frequency precipitation was always accompanied by the rise and fall motion of the low-frequency vertical wind. However, the low-frequency vertical motion corresponding to the low-frequency precipitation of CP El Niño was stronger and the scope was wider than that of CP La Niña, which induced stronger and longer low-frequency precipitation.
5.6. Evolution Characteristics of Low-Frequency Water Vapor Flux
Abundant water vapor transportation is another important factor for the generation and maintenance of precipitation. Therefore, this section discusses the influences of circulation systems of low-frequency water vapor flux transportation and low-frequency water vapor channels on the low-frequency precipitation of the study region in the following summer of CP ENSO events through phase synthesis distribution of the low-frequency water vapor flux at 850 hPa.
When the low-frequency summer precipitation of CP El Niño (Phase 1, Figure 10a) started, there was a low-frequency anticyclonic water vapor circulation over the southern ocean of the Indian Peninsula. To the east of the Indian Peninsula, there was a low-frequency cyclone water vapor circulation. In addition, a low-frequency water vapor anticyclone appeared over the Bohai Sea, while the area south of the Japan Islands and southeast of the northwestern Pacific Ocean were dominated by two anticyclone circulations of low-frequency water vapor. Thus, low-frequency water vapor from the Indian Ocean, South China Sea, and western Pacific Ocean was transported to southern China, causing low-frequency moisture flux convergence over the study region. At the extremely active phase of low-frequency precipitation (Phase 3, Figure 10b), there was an anticyclonic circulation of low-frequency water vapor to the west of the Indian Peninsula, and a low-frequency water vapor cyclone circulation over the equatorial Indian Ocean in the Southern Hemisphere appeared and intensified, which enabled warm water vapor from the tropical Indian Ocean to transport from the Bay of Bengal via Indochina to southern China. The anticyclonic circulation from the southern Japan Islands and the cyclonic circulation to the east of Japan transported the low-frequency water vapor from the Pacific, causing low-frequency water vapor to converge over the study region at the time when low-frequency rainfall reached its peak. The form of the low-frequency moisture transport and its divergence fields of Phase 5(7) was almost opposite that in Phase 1(3).
At the starting phase of low-frequency precipitation of CP La Niña (Phase 1, Figure 10e), southwesterly flow from the low-frequency anticyclonic water vapor circulation to the south of Sri Lanka was transported to southern China via the Arabian Sea and Bay of Bengal. Southerly flow from the obvious low-frequency anticyclonic water vapor circulation over the South China Sea brought warm-wet water vapor to eastern China, while northerly flow from the low-frequency water vapor cyclone in central Inner Mongolia brought cold-dry water vapor to the area, causing low-frequency moisture flux convergence in the study region. Meanwhile, there was a low-frequency water vapor cyclone over the southern Japan Islands. At the extremely active phase (Phase 3, Figure 10f), a low-frequency anticyclonic water vapor circulation replaced the original low-frequency cyclonic water circulation in the southern Japan Islands, and the original low-frequency water vapor anticyclone over the South China Sea was divided into two anticyclones with centers located in the west and east ocean of Indochina, respectively. Southwesterly flow from the area north of the two low-frequency anticyclones transported water vapor from the Bay of Bengal and South China Sea to eastern China; at the same time, the low-frequency cyclonic water vapor circulation in central Inner Mongolia moved northward to North China and brought cold-dry water vapor to the study region, causing warm-wet water vapor from the south to converge with cold-dry water vapor from the north in this region when the low-frequency rainfall reached its peak. The form of the low-frequency moisture transport and its divergence fields of phase 5(7) were almost opposite those in phase 1(3).
It can be seen from the analysis above that the low-frequency water vapor circulation systems and the moisture transportation channels that affected the low-frequency summer precipitation of CP El Niño were quite different from those of CP La Niña. During the following summer of CP El Niño, the low-frequency water vapor circulation systems affecting low-frequency precipitation were the low-frequency cyclone in the equatorial Indian Ocean, the low-frequency anticyclone in the Bay of Bengal, the low-frequency cyclone in eastern China, and the low-frequency anticyclone in the southern Japan Islands. The low-frequency water vapor came mainly from the equatorial Indian Ocean, the Bay of Bengal, the South China Sea, and the western Pacific Ocean. The two warm-wet water vapor channels are the tropical Indian Ocean–Bay of Bengal–central South Peninsula–eastern China channel and the South China Sea–eastern China channel. One cold-dry water vapor channel was the Western Pacific–Bohai Sea–eastern China channel. However, the low-frequency systems affecting low-frequency water vapor transportation in the following summer of CP La Niña were the low-frequency cyclone in northern China and two low-frequency anticyclones, one in the Bay of Bengal and another in the northern South China Sea. The low-frequency water vapor came from the Bay of Bengal, South China Sea, and northern China, and the two warm-wet water vapor channels were the Bay of Bengal–Myanmar–eastern China and the South China Sea–eastern China channels. A colder water vapor channel was the north China–eastern China channel.
6. Discussion and Conclusions
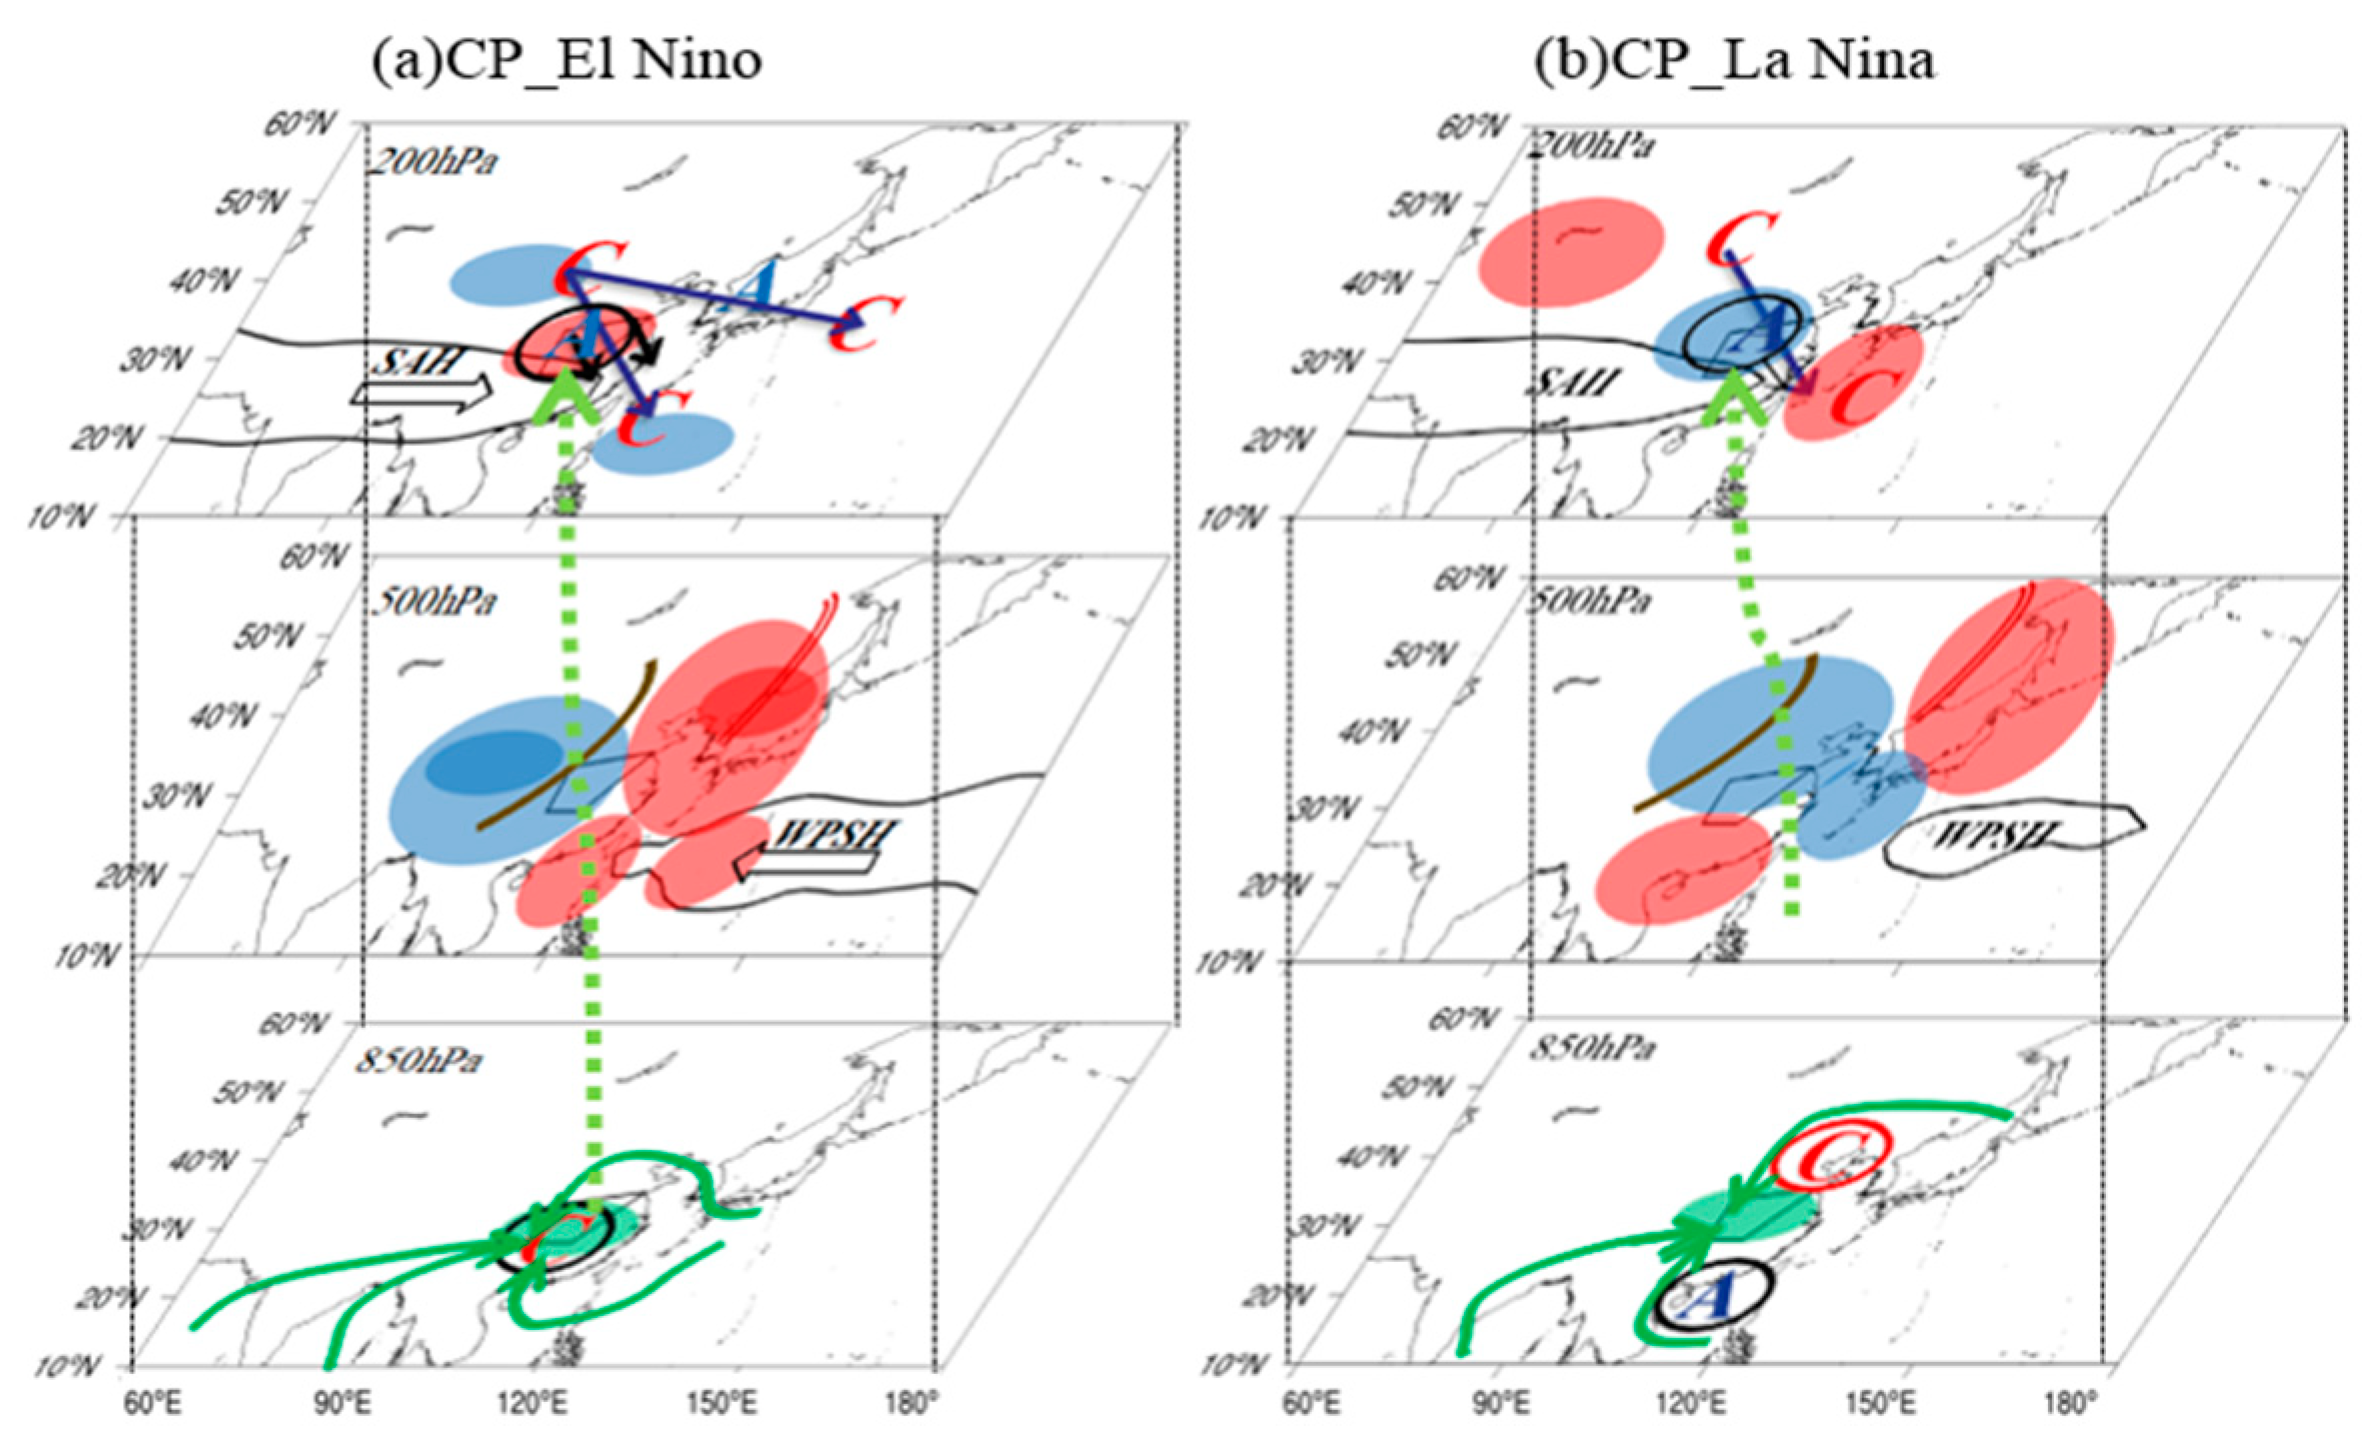
This study investigated the characteristics of 10–20 d low-frequency precipitation, the differences of corresponding atmospheric low-frequency circulation fields, and the effects of atmospheric low-frequency oscillations in different layers of the troposphere on low-frequency precipitation during the following period of CP ENSO events. The main conclusions are as follows, with a schematic diagram describing the starting date of the low-frequency precipitation (Figure 11):
(1) Summer precipitation in eastern China during the following year of CP El Niño (La Niña) was more (less) than the climatological average, and the 10–20 d low-frequency oscillation period of precipitation was significant. When the low-frequency precipitation of CP El Niño started, the study region of eastern China was located in the vicinity of the jet axis at 200 hPa and in front of the East Asian trough at 500 hPa. Moreover, the zonal position of the SAH and the SWPH was near (far) while the vertical ascending motion was strong (weak) (Figure 11). The warm-wet flow from the west side of the SWPH converged with the cold-dry flow from the front ridge of Lake Baikal, which was favorable for generating precipitation.
(2) The upper troposphere: the low-frequency wave train of CP El Niño (La Niña) maintained for a long (short) time. In addition, low-frequency circulation systems and low-frequency divergence fields matched well, indicating that low-frequency cyclone (anticyclone) was always accompanied by low-frequency convergence (divergence). During the active (interruption) phase of low-frequency precipitation of the CP El Niño, the study region in eastern China was dominated by low-frequency divergence (convergence), which was also controlled by low-frequency height positive (negative) anomaly with (without) WAFs propagating from the west, which was conducive to the formation and maintenance (weakening and interruption) of low-frequency precipitation. For the extremely active (interruption) phase of low-frequency precipitation of CP La Niña, although the study area was still dominated by low-frequency divergence (convergence) in the upper troposphere, the low-frequency negative (positive) height anomaly controlled the region as well. The southeastward WAFs transported from the northwest were much weaker because the WAFs transported to the southwest was from low latitudes; thus, the formation and maintenance conditions of low-frequency precipitation were not as good as those of CP El Niño.
(3) The middle troposphere: the range and intensity of the SWPH during the decaying summer of CP El Niño was larger and stronger than those of CP La Niña, and the evolution of the low-frequency height fields was also different (at 500 hPa in Figure 11). However, a commonality of these was that the low-frequency height positive (negative) anomaly of the western Pacific was conducive to the westward extension (eastward retreat) of the SWPH and the strengthening (weakening) of the high-pressure ridge at coastal East Asia. Meanwhile, the low-frequency height negative (positive) anomaly in central and western China made the low pressure trough in East Asia deepen (weaken), which was beneficial to the occurrence (interruption) of low-frequency precipitation.
(4) The lower troposphere: the circulation system that affected the low-frequency summer precipitation of the CP El Niño was mainly the low-frequency cyclone (anticyclone) in eastern China, which caused the low-frequency convergent (divergent) airflow prevailing in the study region in eastern China and that was conducive to the formation (weakening) of low-frequency precipitation. However, the low-frequency precipitation of CP La Niña was mainly due to the combination of low-frequency cyclone (anticyclonic) in northern China and low-frequency anticyclone (cyclone) in the South China Sea, which affected the low-frequency divergent fields of the study region and thus influenced the low-frequency precipitation.
(5) Low-level water vapor and vertical motion: during the following summer of CP El Niño, the water vapor circulation systems that affected low-frequency precipitation were the low-frequency cyclone in the equatorial Indian Ocean, the low-frequency cyclone in the Bay of Bengal, the low-frequency cyclone in eastern China, and the low-frequency anticyclone in the southern Japan Islands. The main sources of low-frequency water vapor were the equatorial Indian Ocean, Bay of Bengal, South China Sea, and western Pacific Ocean. The low-frequency systems affecting low-frequency water vapor transportation in the following summer of CP La Niña were the low-frequency cyclone in northern China and two low-frequency anticyclones in the Bay of Bengal and the northern South China Sea. The water vapor came mainly from the Bay of Bengal, South China Sea, and North China. The start and interruption of the low-frequency precipitation were always accompanied by ascending and sinking movements of the low-frequency vertical wind, respectively. However, the low-frequency vertical motion corresponding to the low-frequency precipitation of CP El Niño was much stronger than that of CP La Niña, so the low-frequency precipitation at the same phase was also stronger.
Author Contributions
L.W. conceived the research and provided logistics guidance. C.C. analyzed the work and wrote the paper. J.W. did some literature search and basic data analysis. Z.W. provided technical guidance.
Funding
This research was jointly supported by the National Key R&D Program of China (2018YFC1505804) and National Natural Science Foundation of China (41975085; 41575081).
Acknowledgments
Daily precipitation data were derived from National Meteorological Information Center (China), NCEP/NCAR reanalysis data can be found at https://www.esrl.noaa.gov/psd/data/index.html. Monthly mean SST data at https://www.metoffice.gov.uk/hadobs/hadisst/data/download.html.
Conflicts of Interest
The authors declare no conflict of interest regarding the publication of this paper.
References
- Chao, J.P. El Nino and Southern Oscillation Dynamics; China Meteorological Press: Beijing, China, 1993. (In Chinese) [Google Scholar]
- Wang, B.; Wu, R.; Fu, X. Pacific-East Asian teleconnection: How does ENSO affect East Asian climate? J. Clim. 2010, 13, 1517–1536. [Google Scholar] [CrossRef]
- Li, T.; Wang, B.; Wu, B.; Zhou, T.; Chang, C.P.; Zhang, R. Theories on Formation of an Anomalous Anticyclone in Western North Pacific during El Niño: A Review. J. Meteorol. Res. 2017, 31, 987–1006. [Google Scholar] [CrossRef]
- Hu, H.; Wu, Q.; Wu, Z. Influences of two types of El Niño event on the Northwest Pacific and tropical Indian Ocean SST anomalies. J. Oceanol. Limnol. 2018, 36, 33–47. [Google Scholar] [CrossRef]
- Ashok, K.; Behera, S.K.; Rao, S.A.; Weng, H.; Yamagata, T. El Niño Modoki and its Possible teleconnection. J. Geophys. Res. Ocean. (1978–2012) 2007, 112. [Google Scholar] [CrossRef]
- Kug, J.S.; Jin, F.F.; An, S.I. Two types of El Niño events: Cold tongue El Niño and warm pool El Niño. J. Clim. 2009, 22, 1499–1515. [Google Scholar] [CrossRef]
- Kao, H.Y.; Yu, J.Y. Contrasting Eastern-Pacific and Central-Pacific types of ENSO. J Clim. 2009, 22, 615–632. [Google Scholar] [CrossRef]
- Li, C.Y. Atmosphere Low-Frequency Oscillation; China Meteorological Press: Beijing, China, 1993. (In Chinese) [Google Scholar]
- Li, C.; Ling, J.; Song, J.; Pan, J.; Tian, H.; Chen, X. Research progress in China on the tropical atmospheric intraseasonal oscillation. Acta Meterol. Sin. 2014, 72, 814–834. (In Chinese) [Google Scholar] [CrossRef]
- Gushhchina, D.; Dewitte, B. Intraseasonal tropical atmospheric variability associated to the two flavors of El Niño. Mon. Weather Rev. 2012, 140, 3669–3681. [Google Scholar] [CrossRef]
- Yuan, Y.; Li, C.Y.; Ling, J. Different MJO activities between EP El Niño and CP El Niño. Sci. Sin. Terrae 2015, 45, 318–334. (In Chinese) [Google Scholar]
- Feng, J.; Liu, P.; Chen, W.; Wang, X. Constracting Madden-Julian Oscillation activity during various stages of EP and CP El Niños. Atmos. Sci. Lett. 2014, 16, 32–37. [Google Scholar] [CrossRef]
- Gao, R.; Zhang, R.; Min, W.; Li, T. Interdecadal changes in the asymmetric impacts of ENSO on wintertime rainfall over China and atmospheric circulations over western North Pacific. Clim. Dyn. 2019, 52, 7525–7536. [Google Scholar] [CrossRef]
- Zhang, L.X.; Wu, P.L.; Zhou, T.J.; Xiao, C. ENSO Transition from La Niña to El Niño drives prolonged spring–summer drought over North China. J. Clim. 2018, 31, 3509–3523. [Google Scholar] [CrossRef]
- Karori, M.A.; Li, J.; Jin, F.F. The Asymmetric Influence of the Two Types of El Niño and La Niña on Summer Rainfall over Southeast China. J. Clim. 2013, 26, 4567–4582. [Google Scholar] [CrossRef]
- Cao, Q.; Hao, Z.; Yuan, F.; Su, Z.; Berndtsson, R.; Hao, J.; Nyima, T. Impact of ENSO regimes on developing- and decaying-phase precipitation during rainy season in China. Hydrol. Earth Syst. Sci. 2017, 21, 5415–5426. [Google Scholar] [CrossRef] [Green Version]
- Zhang, W.; Wang, Z.; Stuecker, M.F.; Turner, A.G.; Jin, F.F.; Geng, X. Impact of ENSO longitudinal position on teleconnections to the NAO. Clim. Dyn. 2019, 52, 257–274. [Google Scholar] [CrossRef]
- Jiang, F.; Zhang, W.; Geng, X.; Stuecker, M.F.; Liu, C. Impact of central Pacific El Nino on Southern China spring precipitation controlled by its longitudinal position. J. Clim. 2019, 2019. [Google Scholar] [CrossRef]
- Hsu, P.Q.; Xiao, T. Differences in the Initiation and Development of the Madden-Julian Oscillation over the Indian Ocean Associated with Two Types of El Niño. J. Clim. 2017, 30, 1397–1415. [Google Scholar] [CrossRef]
- Hsu, P.C.; Fu, Z.; Xiao, T. Energetic processes regulating the strength of MJO circulation over the Maritime Continent during two types of El Niño. Atmos. Ocean. Sci. Lett. 2018, 11, 112–119. [Google Scholar] [CrossRef]
- Wang, L.; Li, T.; Chen, L.; Behera, S.K.; Nasuno, T. Modulation of the MJO intensity over the equatorial western Pacific by two types of El Nino. Clim. Dyn. 2018, 51, 687–700. [Google Scholar] [CrossRef]
- Tong, Q.Y.; Yao, S.X. The Quasi-Biweekly Oscillation of Winter Precipitation Associated with ENSO over Southern China. Atmosphere 2018, 9, 406. [Google Scholar] [CrossRef]
- Torrence, C.; Comopo, G.P. A practical guide to wavelet analysis. Bull. Am. Meteorol. Soc. 1998, 79, 61–78. [Google Scholar] [CrossRef]
- Chan, J.C.L.; Ai, W.; Xu, J. Mechanisms responsible for the maintenance of the 1998 South China Sea summer monsoon. J. Meteorol. Soc. Jpn. 2002, 80, 1103–1113. [Google Scholar] [CrossRef]
- Takaya, K.; Nakamura, H. A formulation of a wave-activity flux for stationary Rossby waves on a zonally varying basic flow. Geophys. Res. Lett. 1997, 24, 2985–2988. [Google Scholar] [CrossRef]
- Takaya, K.; Nakamura, H. A formulation of a phase-independent wave-activity flux for stationary and migratory quasigeostrophic eddies on a zonally varying basic flow. J. Atmos. Sci. 2001, 58, 608–627. [Google Scholar] [CrossRef]
- Yang, J.; Wang, B.; Wang, B.; Bao, Q. Biweekly and 21-30-day variations of the subtropical summer monsoon rainfall over the Lower Reach of the Yangtze River Basin. J. Clim. 2010, 23, 1146–1159. [Google Scholar] [CrossRef]
- Jia, X.L.; Chen, L.J.; Ren, F.M.; Li, C. Impacts of the MJO on Winter Rainfall and Cirulation in China. Adv. Atmos. Sci. 2011, 28, 521–533. [Google Scholar] [CrossRef]
- Zhang, L.; Zhi, X.F. South Asian high and the subtropical western Pacific high and its relation to the mid-summer precipitation anomalies over China. J. Meteorol. Sci. 2010, 30, 438–444. [Google Scholar]
- Shi, C.; Huang, Y.; Guo, D.; Zhou, S.; Hu, K.; Liu, Y. Comparison of trends and abrupt changes of the South Asia high from 1979 to 2014 in reanalysis and radiosonde datasets. J. Atmos. Sol.-Terr. Phys. 2018, 170, 48–54. [Google Scholar] [CrossRef]
- Shi, C.H.; Zhang, C.X.; Guo, D. Comparison of Electrochemical Concentration Cell Ozonesonde and Microwave Limb Sounder Satellite Remote Sensing Ozone Profiles for the Center of the South Asian High. Remote Sens. 2017, 9, 1012. [Google Scholar] [CrossRef]
Figure 1.
The daily 10–20 d filtered rainfall time series from June to August (June–July–August) in 2012. (the gray dashed line is 1 times standard deviation of filtered precipitation time series, numbers 1–8 denote low-frequency oscillation phase, units: mm).
Figure 1.
The daily 10–20 d filtered rainfall time series from June to August (June–July–August) in 2012. (the gray dashed line is 1 times standard deviation of filtered precipitation time series, numbers 1–8 denote low-frequency oscillation phase, units: mm).

Figure 2.
Percentage of precipitation anomalies of daily precipitation in the following summer (June–July–August) of CP El Niño (a) and CP La Niña (b) (unit: %) and locations of 53 stations in eastern China (c). (dotted areas (a,b) represent results above the 90% confidence level).
Figure 2.
Percentage of precipitation anomalies of daily precipitation in the following summer (June–July–August) of CP El Niño (a) and CP La Niña (b) (unit: %) and locations of 53 stations in eastern China (c). (dotted areas (a,b) represent results above the 90% confidence level).
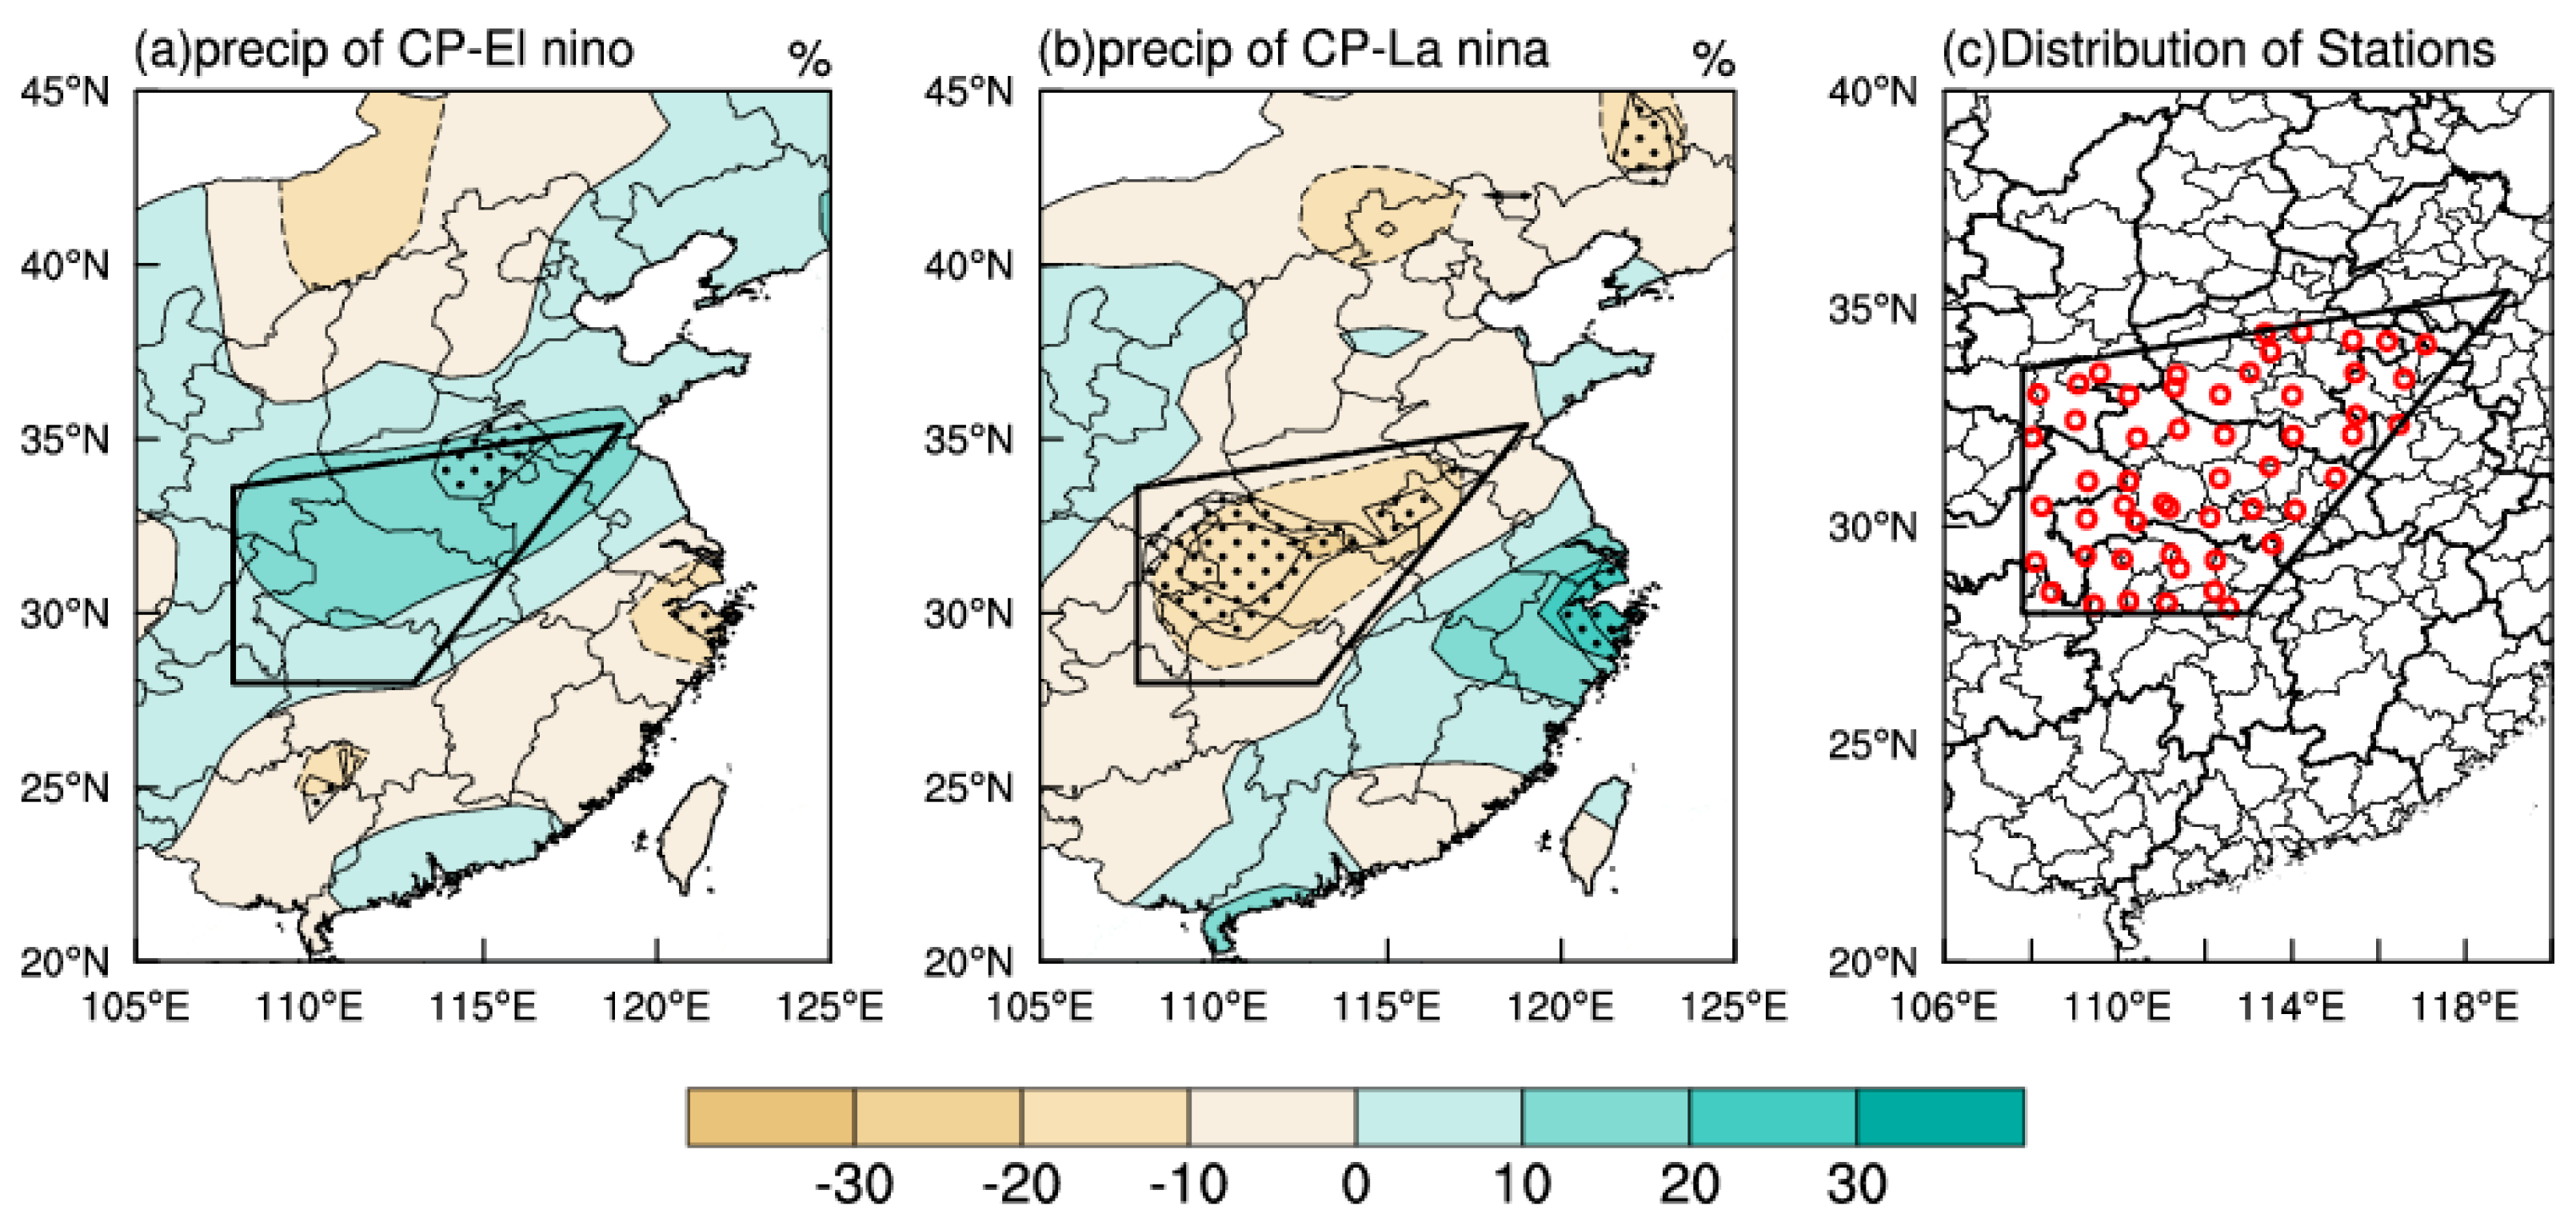
Figure 3.
The variance contribution of low-frequency oscillation components accounting for the total summer precipitation variability of CP El Niño (a) and CP La Niña (b) (unit:%).
Figure 3.
The variance contribution of low-frequency oscillation components accounting for the total summer precipitation variability of CP El Niño (a) and CP La Niña (b) (unit:%).

Figure 4.
Lead-lag composite analysis of unfiltered westerly jet (blue shaded areas, units:m·s−1) and the South Asia High (SAH, dashed line denotes 12,520 gpm (geopotential height) characteristic line) at 200 hPa, wind fields at 850 hPa (vector, units: m·s−1), geopotential height fields at 500 hPa (solid line, thick solid line denotes 5880 gpm characteristic line) during the low-frequency precipitation in the following summer of CP El Niño (a,c,e) and CP La Niña (b,d,f).

Figure 5.
Phase synthesis of 10–20 d low-frequency divergence fields (shaded areas represent divergent areas, units: 10−6 s−1), low-frequency stream function fields (contours, units: 106 m2·s−1) and low-frequency rotational wind fields (vector, units: m·s−1) at 200 hPa during the following summer of CP El Niño (a–d) and CP La Niña (e–h). The letters ‘C’ (‘A’) represent the centers of the cyclone (anticyclone).

Figure 6.
Same as Figure 5, but for the phase synthesis of 10–20 d low-frequency height fields (the shaded areas denote low-frequency height positive anomaly, dotted lines denote negative anomalies, units: gpm), and the two-dimensional wave-activity flux (WAF) fields (vector, WAFs <5.0 m2·s−2 were not drawn, units: 102 m2·s−2) at 200hPa, black thick solid line denotes unfiltered 12,520 gpm contour.

Figure 7.
Same as Figure 5, but for the phase synthesis of 10–20 d low-frequency height fields and the unfiltered height fields at 500 hPa (unit: gpm), black thick solid line denotes unfiltered 5880 gpm contour.
Figure 7.
Same as Figure 5, but for the phase synthesis of 10–20 d low-frequency height fields and the unfiltered height fields at 500 hPa (unit: gpm), black thick solid line denotes unfiltered 5880 gpm contour.
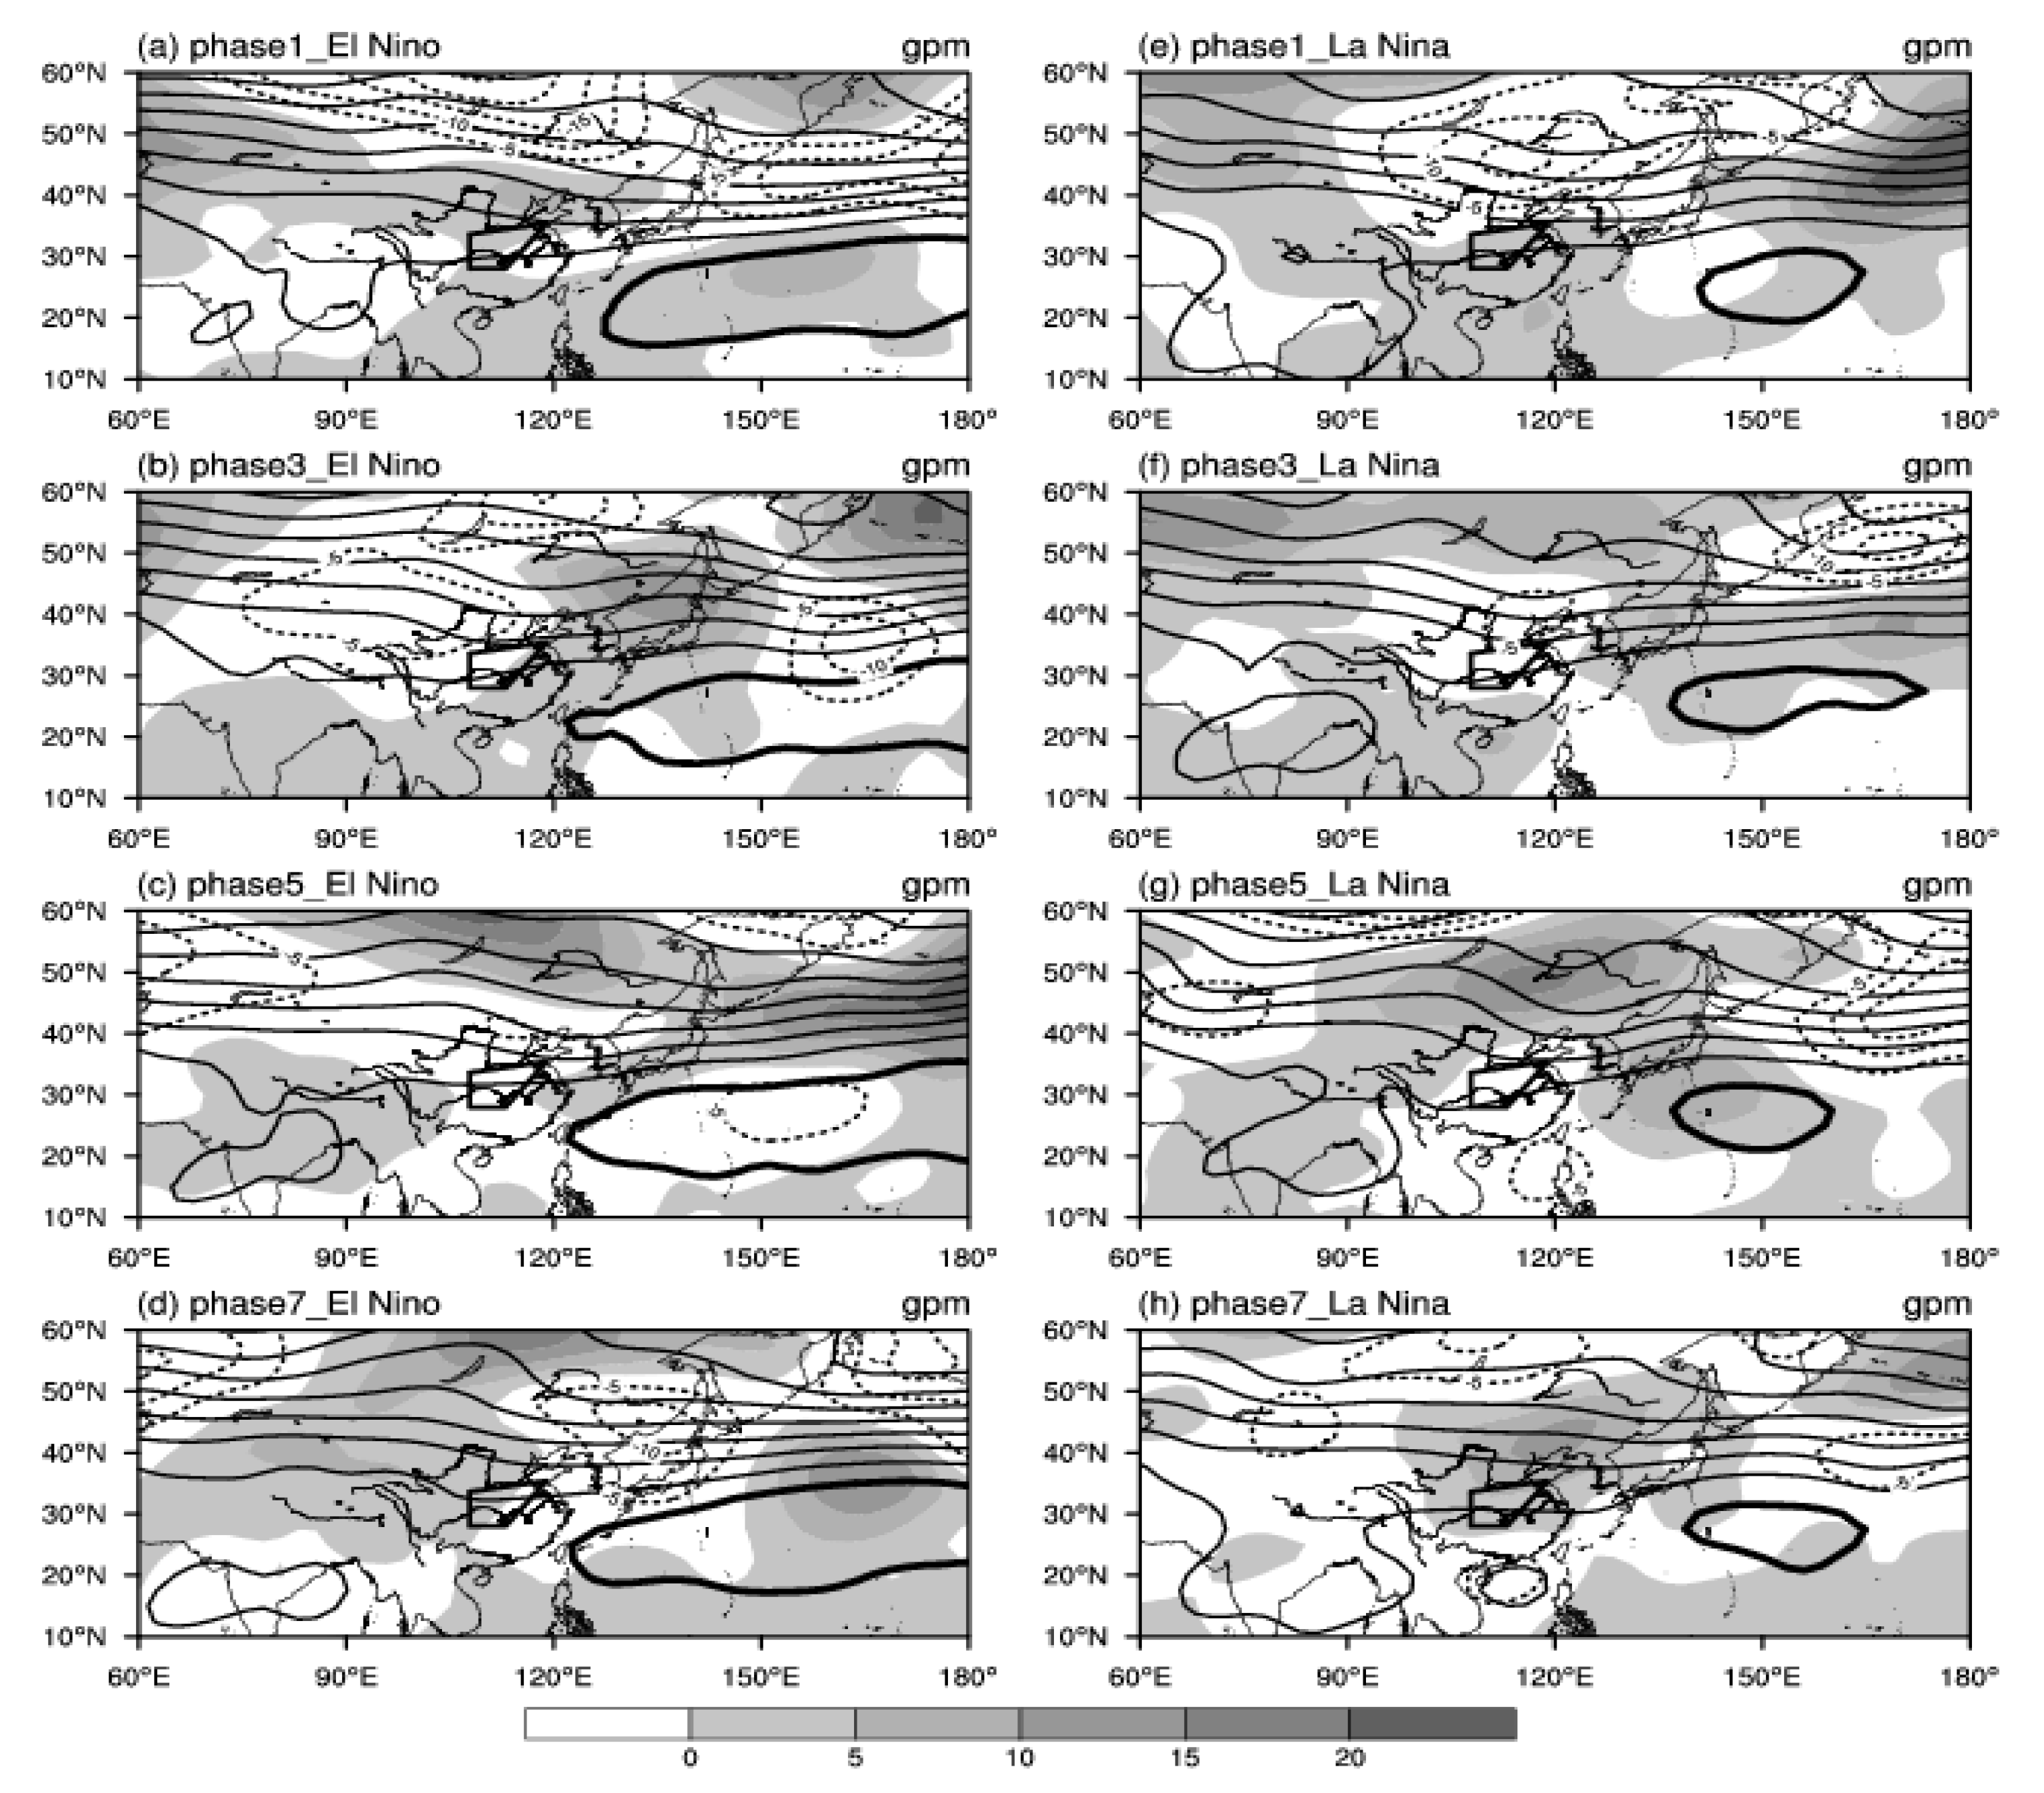
Figure 8.
Same as Figure 5, but for the phase synthesis of 10–20 d low-frequency divergence fields (shaded areas represent convergent areas, units: 10−6·s−1) and low-frequency wind fields (vector, units: m·s−1) at 850 hPa.
Figure 8.
Same as Figure 5, but for the phase synthesis of 10–20 d low-frequency divergence fields (shaded areas represent convergent areas, units: 10−6·s−1) and low-frequency wind fields (vector, units: m·s−1) at 850 hPa.
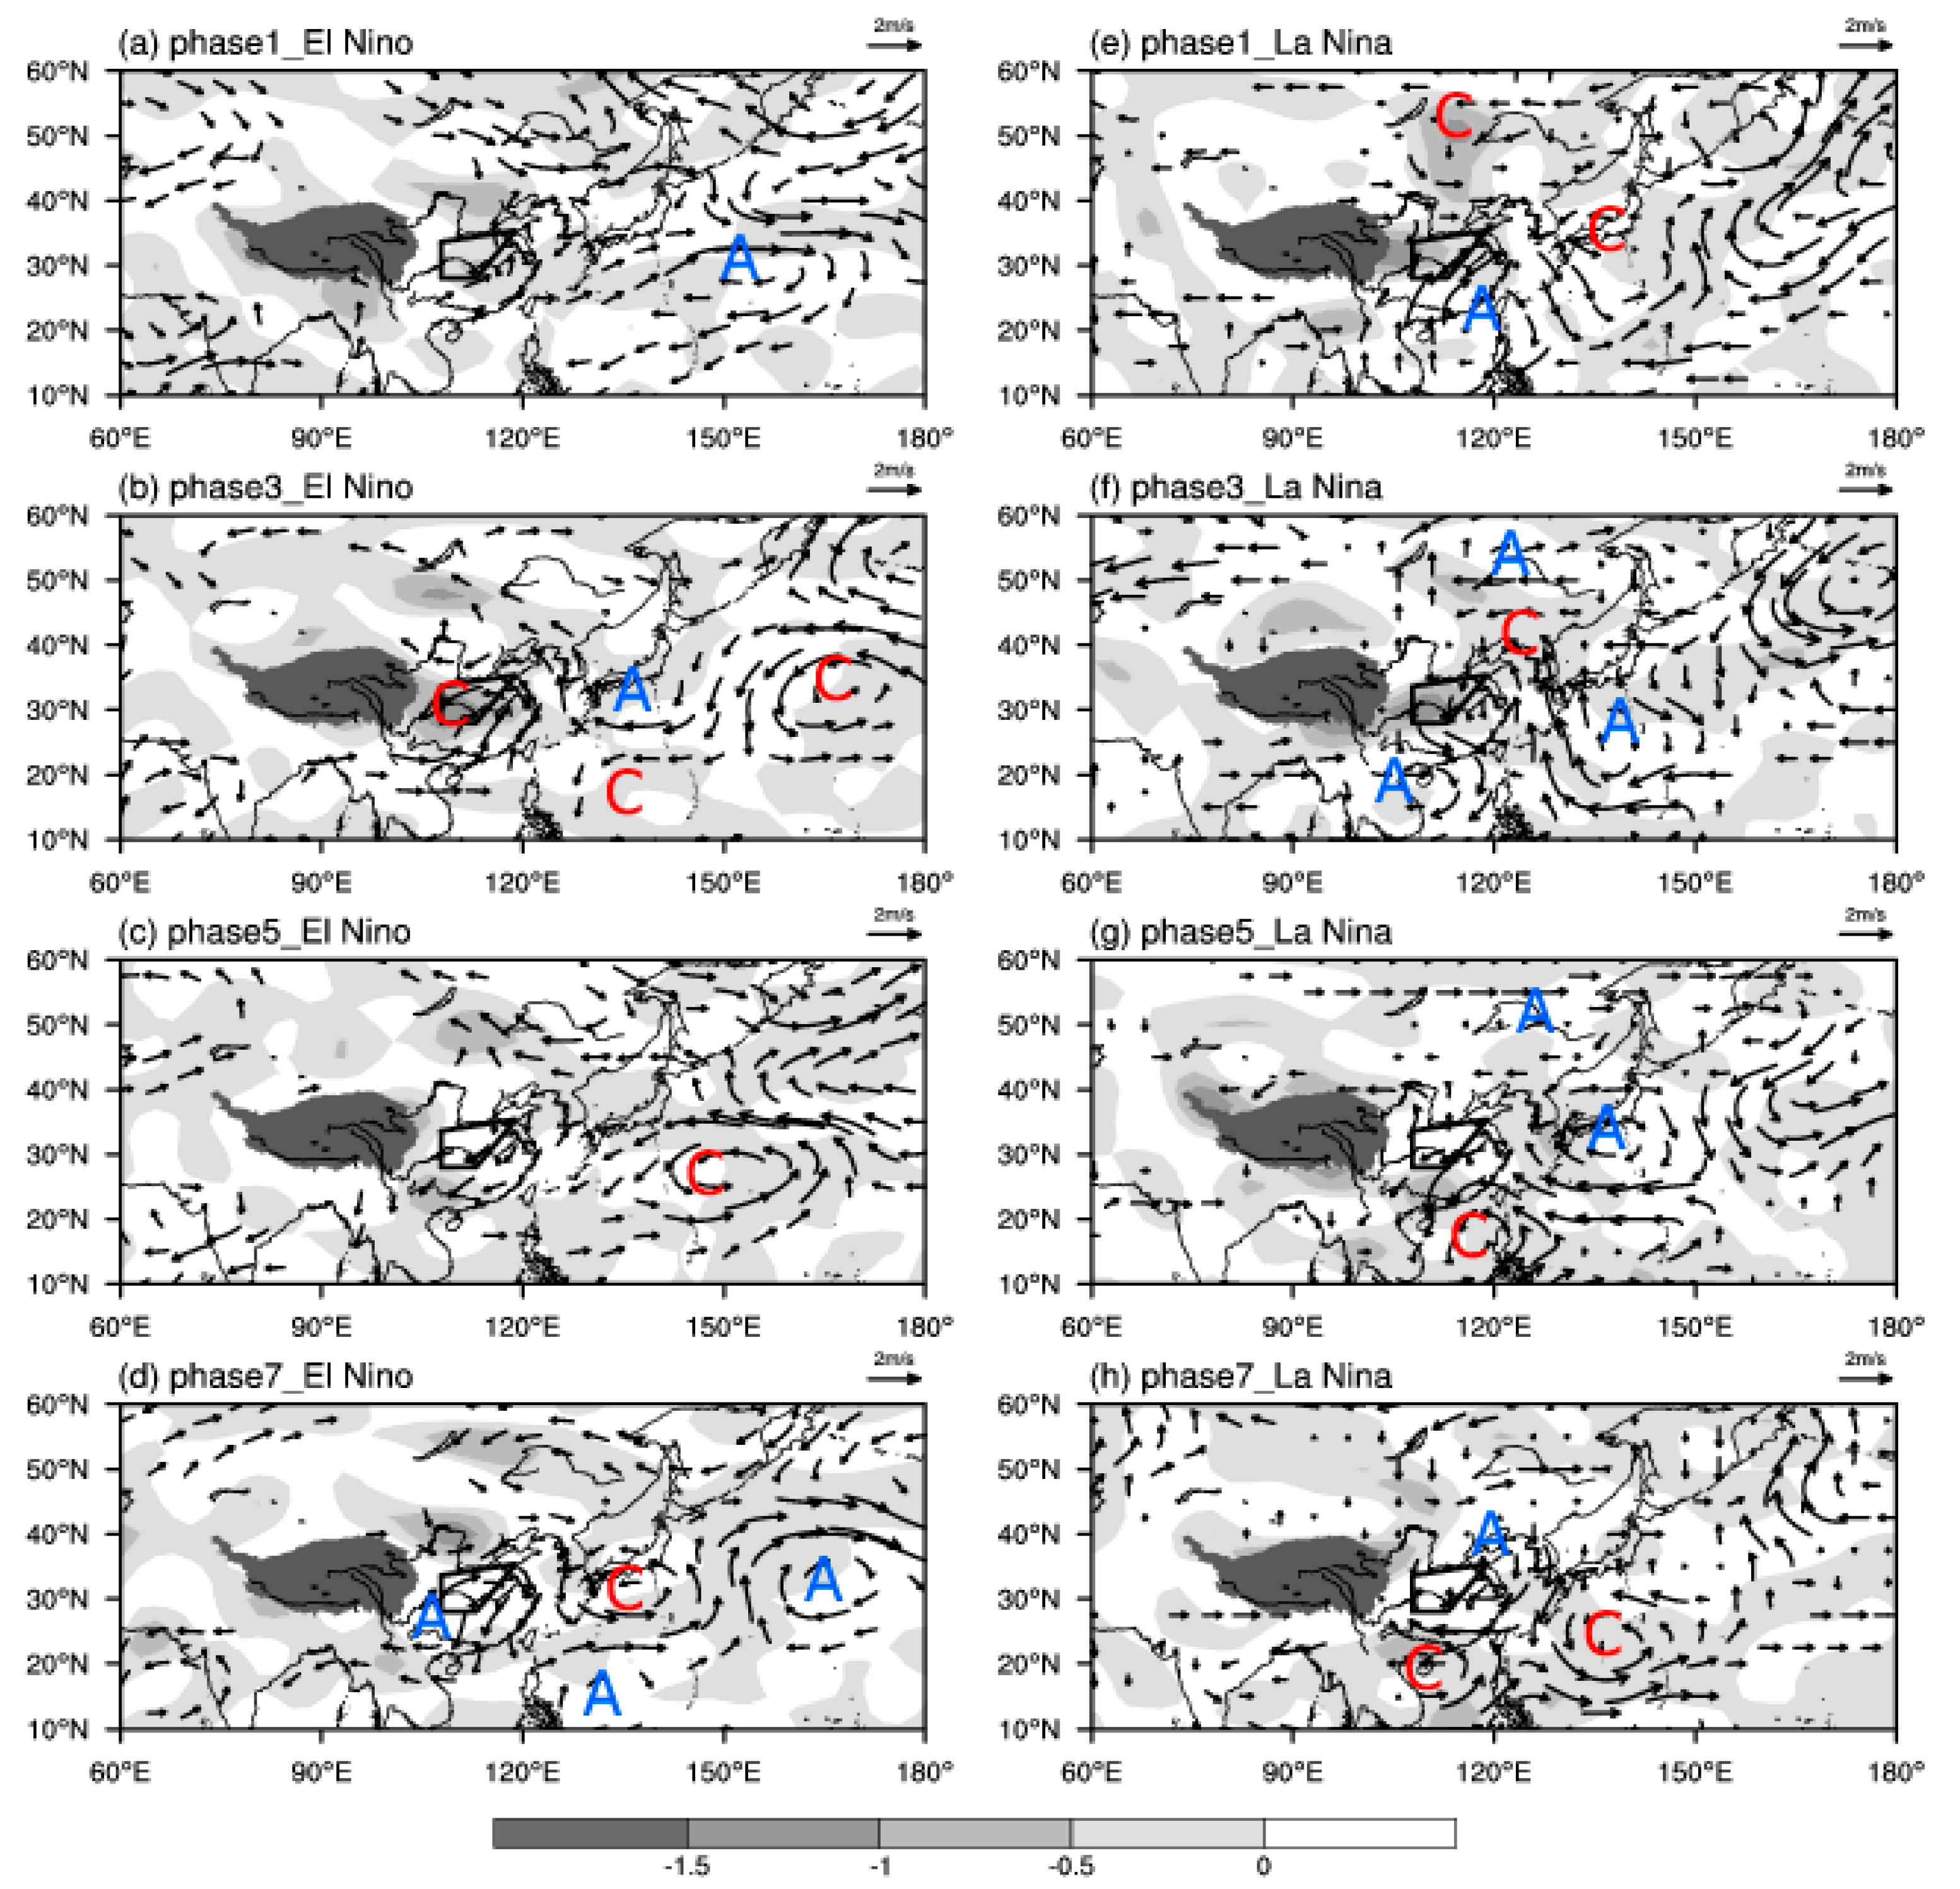
Figure 9.
Same as Figure 5, but for the 10–20 d low-frequency vertical velocity field profiles along the mean 108–118° E meridian in eastern China (units: pa·s−1). CP El Niño (a–d) and CP La Niña (e–h).
Figure 9.
Same as Figure 5, but for the 10–20 d low-frequency vertical velocity field profiles along the mean 108–118° E meridian in eastern China (units: pa·s−1). CP El Niño (a–d) and CP La Niña (e–h).

Figure 10.
Same as Figure 5, but for the 10–20 d low-frequency water vapor flux fields (vector, units: kg·m−1·s−1) and water vapor flux divergence fields (shaded areas represent water vapor convergent areas, units: 10−5 kg·m−2 ·s−1).
Figure 10.
Same as Figure 5, but for the 10–20 d low-frequency water vapor flux fields (vector, units: kg·m−1·s−1) and water vapor flux divergence fields (shaded areas represent water vapor convergent areas, units: 10−5 kg·m−2 ·s−1).
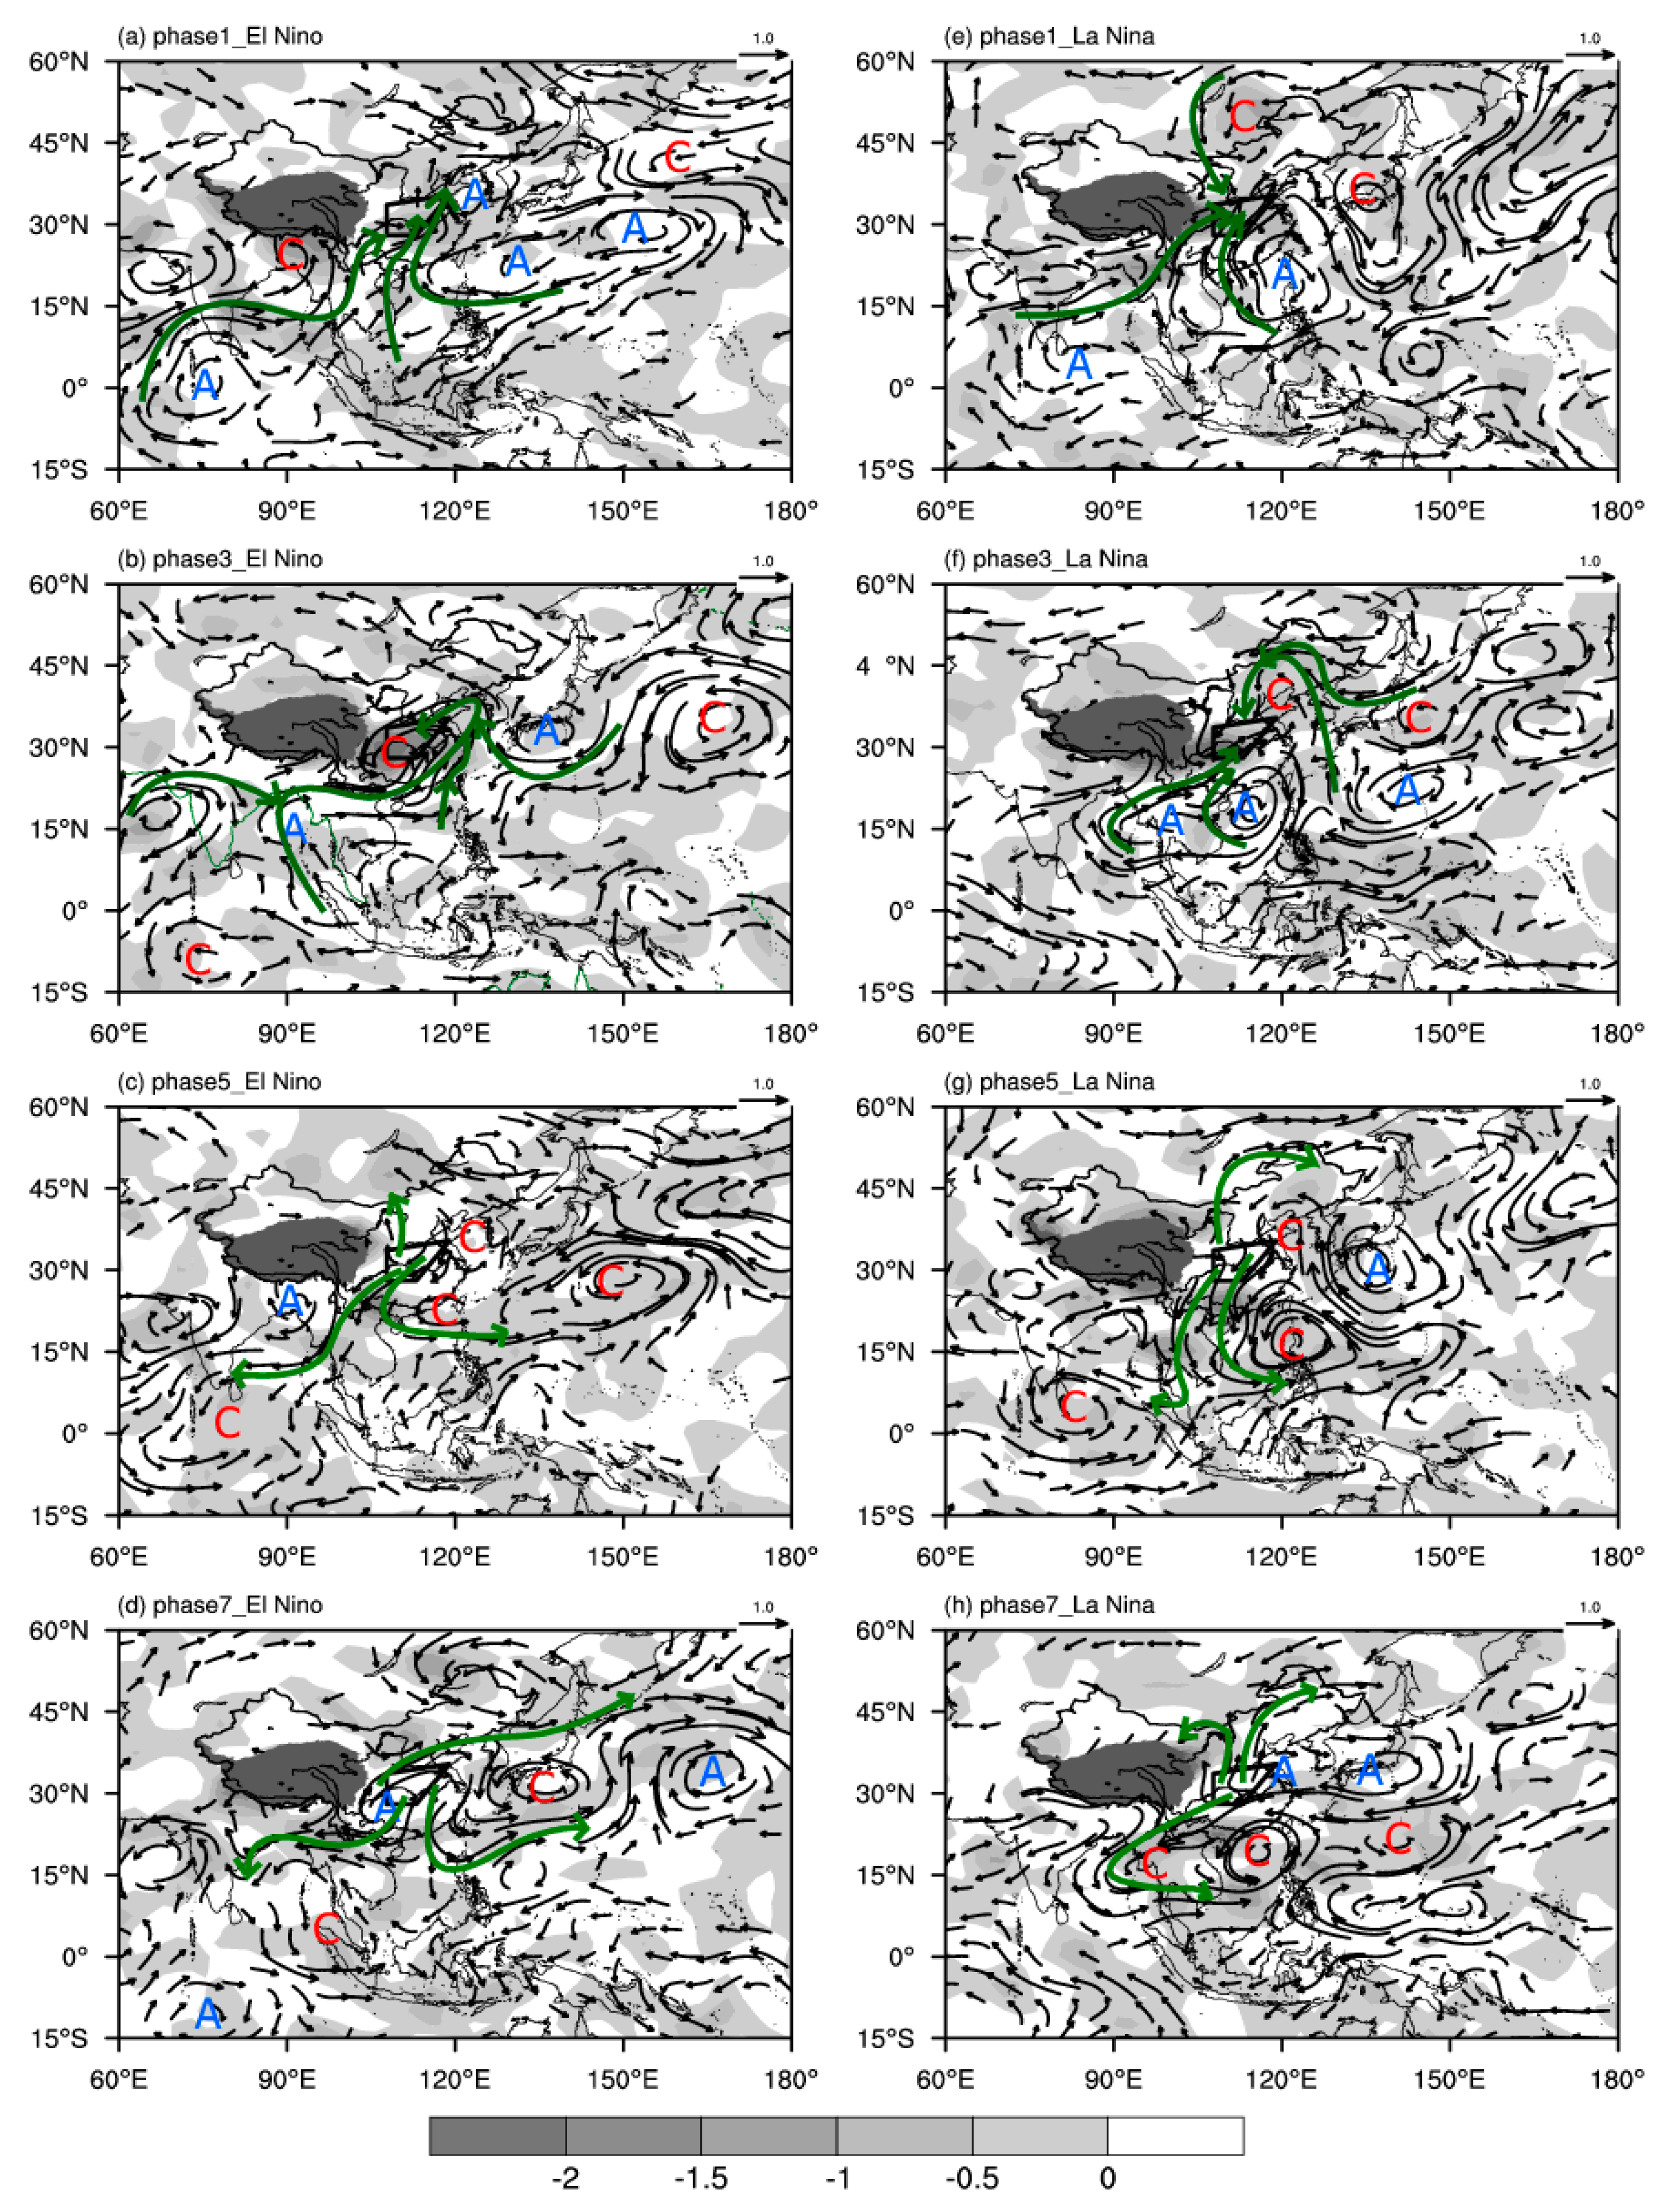
Figure 11.
Schematic diagrams for circulation anomalies of CP El Nino (a) and CP La Nina (b) responsible for low-frequency precipitation in eastern China. The letters ‘C’ and ‘A’ represent the low-frequency cyclone and anticyclone, respectively. The black arrow denotes WAF transport, and the blue arrow represent the low-frequency wave train. The black solid lines at 200 hPa and 500 hPa denote the boundary of the SAH and Western Pacific Subtropical High (WPSH). Mid-latitude trough and ridge at 500 hPa is indicated by brown and red lines respectively. The red (blue) shading at 200 hPa and 500 hPa represent low-frequency height positive (negative) anomaly. The low-frequency water vapor convergence and water vapor channels at 850 hPa are presented as green shading and green lines respectively. Green dashed arrow represents low-frequency ascending motion.


Table 1.
The starting and ending month of central Pacific El Niño–Southern Oscillation (CP ENSO) events during the years 1961 to 2016.
Table 1.
The starting and ending month of central Pacific El Niño–Southern Oscillation (CP ENSO) events during the years 1961 to 2016.
| CP El Niño | CP La Niña | ||
|---|---|---|---|
| 1968.10–1969.06 | 1977.09–1978.01 | 1974.10–1976.04 | 1983.09–1984.01 |
| 1994.09–1995.03 | 2002.06–2003.02 | 1998.07–2001.02 | 1998.07–2001.02 |
| 2004.07–2005.02 | 2006.09–2007.01 | 2008.11–2009.03 | 2010.06–2011.05 |
| 2009.07–2010.04 | 2011.07–2012.03 | ||
Table 2.
Power spectrum and wavelet analysis of daily precipitation in the eastern China during the following summer of CP ENSO.
Table 2.
Power spectrum and wavelet analysis of daily precipitation in the eastern China during the following summer of CP ENSO.
| Events | Year | Power Spectrum Analysis | Morlet Wavelet Analysis | |
|---|---|---|---|---|
| Period | Peak | Significant Period | ||
| CP El Niño | 1969 | 7–15 d, 22–60 d | 10 d, 30 d | 6–16 d, 20–60 d |
| 1978 | 7–60 d | 15 d, 20 d | 10–20 d, 10–30 d | |
| 1995 | 7–25 d | 8 d, 15 d, 20 d | 10–20 d | |
| 2003 | 7–60 d | 8 d, 15 d, | 10–20 d, 20–30 d, 30–60 d | |
| 2005 | 7–25 d | 15 d | 10–20 d, 20–30 d | |
| 2007 | 7–30 d | 10 d, 12 d, 20 d | 10–0 d, 20–25 d | |
| 2010 | 7–60 d | 10 d, 15 d | 10–20 d, 30–60 d | |
| CP La Niña | 1976 | 6–10 d, 12–45 d | 20 d, 30 d | 5–10 d, 10–20 d, 20–30 d |
| 1984 | 6-30 d | 8 d, 20 d | 10–20 d, 10–30 d | |
| 1999 | 7–14 d, 30–60 d | 10 d | 5–16 d, 16–20 d, 30–60 d | |
| 2001 | 7–30 d | 8 d, 12 d | 6–15 d,10–20 d | |
| 2009 | 7–17 d | 12 d | 6–20 d, 20–30 d | |
| 2011 | 10–45 d | 10 d, 20 d, 30 d | 12 d–25 d, 30–45 d | |
| 2012 | 6–60 d | 10 d, 15 d | 10–20 d, 10–30 d, 30–60 d | |
© 2019 by the authors. Licensee MDPI, Basel, Switzerland. This article is an open access article distributed under the terms and conditions of the Creative Commons Attribution (CC BY) license (http://creativecommons.org/licenses/by/4.0/).
Share and Cite
MDPI and ACS Style
Cai, C.; Wang, L.; Wang, J.; Wang, Z. The 10–20 d Low-Frequency Oscillation Characteristics of Summer Precipitation in Eastern China in the Decaying Year of CP ENSO. Atmosphere 2019, 10, 616. https://doi.org/10.3390/atmos10100616
AMA Style
Cai C, Wang L, Wang J, Wang Z. The 10–20 d Low-Frequency Oscillation Characteristics of Summer Precipitation in Eastern China in the Decaying Year of CP ENSO. Atmosphere. 2019; 10(10):616. https://doi.org/10.3390/atmos10100616
Chicago/Turabian StyleCai, Cong, Lijuan Wang, Junyu Wang, and Zhiqiang Wang. 2019. "The 10–20 d Low-Frequency Oscillation Characteristics of Summer Precipitation in Eastern China in the Decaying Year of CP ENSO" Atmosphere 10, no. 10: 616. https://doi.org/10.3390/atmos10100616
Note that from the first issue of 2016, this journal uses article numbers instead of page numbers. See further details here.