Article

Contribution of Meteorological Conditions to the Variation in Winter PM2.5 Concentrations from 2013 to 2019 in Middle-Eastern China

1
State Key Laboratory of Severe Weather (LASW), Chinese Academy of Meteorological Sciences (CAMS), CMA, Beijing 100081, China
2
Key Laboratory of Meteorological Disaster, Ministry of Education/Joint International Research Laboratory of Climate and Environment Change/Collaborative Innovation Center on Forecast and Evaluation of Meteorological Disasters, Nanjing University of Information Science and Technology, Nanjing 210044, China
3
Southern Marine Science and Engineering Guangdong Laboratory (Zhuhai), Zhuhai 519082, China
*
Authors to whom correspondence should be addressed.
Atmosphere 2019, 10(10), 563; https://doi.org/10.3390/atmos10100563
Submission received: 7 August 2019 / Revised: 8 September 2019 / Accepted: 17 September 2019 / Published: 20 September 2019
(This article belongs to the Section Air Quality)

Abstract

:
Severe air pollution events accompanied by high PM2.5 concentrations have been repeatedly observed in Middle-Eastern China since 2013 and decreased in recent years. The reason for this caused widespread attention. The month of January was selected to represent the winter season annual changes in the winter PM2.5 and meteorological conditions—including the upper-air meridional circulation index (MCI), winds at 700 and 850 hPa levels and surface meteorology—from 2013 to 2019. These conditions were analyzed to study the contribution of meteorology changing to the annual PM2.5 changing on the regional scale. Results show that, based on values of upper-level MCI, the years 2014, 2015, 2017, and 2019 were defined as meteorology-haze years and the years 2016 and 2018 were defined as meteorology-clean years. A change in meteorological conditions may lead to a 26% change in PM2.5 concentration between 2014 and 2013 (two meteorology-haze years) and 16–20% changes in PM2.5 concentration between meteorology-haze years and meteorology-clean years. Changes in pollutant emissions may cause 21–47% changes in PM2.5 concentration between each two meteorology-haze years. A comparison of two meteorology-clean years and pollutant emissions in 2018 may be reduced by 40% compared with 2016. Overall, changes in emissions had a greater influence on changes in PM2.5 compared with meteorological conditions.

1. Introduction

Fine particulate matter with an aerodynamic diameter <2.5 μm (PM2.5) is considered to be a major air pollutant that causes severe environmental problems and affects human health [1,2,3,4]. Air pollution has been an environmental issue in China for many decades. The visibility-retrieved PM2.5 concentrations as well as haze events experienced an overall increasing trend throughout China from 1957 to 2014, with fluctuations in different time periods [5,6,7]. PM2.5 concentrations and fog and haze events all have significant seasonal variations. PM2.5 concentrations tend to be highest in winter and lowest in summer. Low visibility and days with haze and fog, accompanied by high PM2.5 concentrations, mostly occur in the winter [8].
The region of Mid-eastern China (MEC, defined as 34–41.5° N, 112–120° E), which includes the Hebei province, the cities of Tianjin and Beijing, and the northern part of Henan and Shandong provinces, is located on the northern coast of China and is surrounded by the Yanshan and Taihang mountains. MEC is one of the most populated and prosperous regions of China. According to statistics, the population of MEC exceeded 110 million and the number of cars exceeded 60 million. Rural industrialization and traditional industrialization led to a large number of pollutant emissions. As a result of rapid economic development, the highest PM2.5 pollution levels and the greatest number of days with haze and fog have repeatedly occurred in this region over the past 40 years [9,10,11,12,13]. The annual average retrieved PM2.5 concentration in MEC increased from 1964 to 1996, showed a decreasing trend from 1996 to 2006, and then slightly increased again after 2006 [5,14]. By contrast, PM2.5 concentrations in Beijing, Zhengzhou, Jinan, and some stations in the Hebei province continued to decrease after 2000 [15,16,17,18]. Similarly, haze and fog events in the Hebei province showed a variable, but generally decreasing, trend from 2000 to 2010. As a consequence, it is thought that high PM2.5 events occurred less frequently in the period from 2000 to 2010 than in the 1990s [12]. Extremely severe and prolonged episodes of pollutant haze and high numbers of haze days were observed in MEC in January 2013 and many severe PM2.5 air pollution events occurred in MEC in the winter in subsequent years. The monthly average PM2.5 concentrations at many monitoring stations were >150 μg m−3 in 2013 [19,20,21,22,23]. The annual average PM2.5 concentrations at some stations reached 100 μg m − 3 in 2014. The most polluted cities in China with very poor air quality include Xingtai, Baoding, Shijiazhuang, Handan, Hengshui, Dezhou, Heze, Tangshan, Liaocheng, and Langfang. These cities are all located in MEC [6,20]. Both the general public and the government have paid special attention to PM2.5 monitoring and air quality standards. The Chinese government has implemented a large number of measures to control anthropogenic emissions in recent years. The Ministry of Environmental Protection of China issued a new Ambient Air Quality Index in 2012 and implemented this in 2016. The Chinese government established a network of national environmental PM2.5 monitoring stations in late 2012. The State Council adopted the Action Plan for the Control of Air Pollution in September 2013. In June 2017, the government amended the Regulations on Environmental Protection Management of Construction Projects and implemented them from 1 October 2017 to prevent new pollution from construction projects. The Environmental Protection Law of China was revised again in 2018. This shows that PM2.5 air pollution has received widespread attention and it is necessary to study the trend in winter PM2.5 concentrations from 2013 to 2019. However, since 2014, PM2.5 air pollution in MEC has changed repeatedly. The number of high PM2.5 concentration days increased significantly during the winter of 2016, but decreased dramatically in the winter of 2017 [24,25].
High PM2.5 concentrations result from the anthropogenic pollutant emissions, including heating, vehicle exhausts, and burning straw [26,27,28,29,30]. Meteorological conditions such as a stable atmosphere, weak winds, and a high ambient relative humidity (RH) favor the accumulation of aerosol pollutants [16,31,32]. Therefore, the annual changes in the winter PM2.5 concentrations from 2013 to 2019 may be due to changes in the meteorological conditions or changes in anthropogenic emissions. However, variations in emissions are really closely related to economic output, energy production, consumption, implementation of emission reduction measures, and other artificial reasons. The level of emissions controls in different cities should be different from 2013 to 2019. In addition, it is impossible to get the annual emission data in China. It is both difficult and complex to directly calculate the emission of pollutants. Therefore, the meteorological conditions are discussed in this paper in depth to indirectly consider the variations of pollutant emissions.
There have been some studies on the changing trend of PM2.5 concentration and its causes in China after 2013 [33,34]. Zhang et al. analyzed the contribution of change of meteorological conditions to the change of PM2.5 concentration from 2013 to 2017 by the PLAM index [33]. Liu et al. established the multiple regression models. After excluding the influence of meteorological factors, changes in emissions were discussed. The variation in PM2.5 concentrations in MEC in the winter were analyzed from 2013 to 2019 in this study. The meteorological conditions, including the upper air circulation patterns, winds at 700 and 850 hPa levels, and surface meteorological factors (e.g., wind speed, RH, and temperature), were investigated to explain the meteorological causes of the changing trends in PM2.5 concentrations.

2. Data and Methodology

The month of January was selected to represent the winter season in from 2013 to 2019. Hourly pollution data from the 1324 stations of the China Environmental Monitoring Center [35] were used to analyze the spatiotemporal distribution of PM2.5 concentrations in MEC in January from 2013 to 2019 (Figure 1a). As in previous decades, the highest PM2.5 concentrations were found in MEC. Many stations reported PM2.5 concentrations >150 μg m−3, which represent heavy pollution, as defined by the National Ambient Air Quality Standard in China (NAAQS, Table 1). It is, therefore, essential to study the annual changes in the winter PM2.5 concentration in MEC.
The MEC contains almost all the heavily polluted cities in Central and Eastern China. Other heavily polluted areas, such as the Yangtze River Delta, are far from the study area. In addition, considering the weak winds and relatively stable atmospheric conditions in the winter, the effect of pollutants transport between different regions on variations in regional average PM2.5 concentration in MEC should be small. On the city scale, pollutants transport outside the city is considered to be very important for PM2.5 concentration in some cities [20]. This study is focused on the influence of meteorological conditions including the upper-air circulation pattern, wind speed, temperature, and ambient relative humidity in a regional PM2.5 concentration.
The unique topography of MEC has contributed to this region becoming one of the most polluted areas of China (Figure 1b). The western part of MEC is influenced by dry, warm winds from the eastern Taihang Mountains, which results in increased stability at the surface. The east coast of MEC often has lower PM2.5 concentrations under the influence of moderate to strong winds from the Bohai and Yellow seas [12]. Figure 1b shows the locations of the 264 PM2.5 monitoring sites selected for this study. The average PM2.5 concentrations in January were calculated from 2013 to 2019 for MEC and some large polluted cities (e.g., Beijing, Xingtai, and Tianjin) to analyze the overall trend in winter PM2.5 concentrations. A day is defined as an air pollution day based on the NAAQS if the 24-h average PM2.5 concentration is >75.0 μg m−3 (Table 1). The number of days with different levels of air pollution was counted to show the trends.
We also collected data from 491 ground meteorological observation sites and five sounding sites, including Beijing, Xingtai, Taiyuan, Zhengzhou, and Jinan (Figure 1b). The wind speed, temperature (T, K), and dew-point temperature (TD, K) at 02:00, 05:00, 08:00, 11:00, 14:00, 17:00, 20:00, and 23:00 h local time in January 2013–2019 were used to analyze the influence of these meteorological factors on the PM2.5 concentrations. Average wind speed of 850, 925, and 1000 hPa levels was calculated to represent the wind speed in the boundary layer.
Re-analysis meteorological data from the European Center for Medium-Range Weather Forecasts [36], including the geopotential height (dagpm), temperature (T, K), dew-point temperature (TD, K), and wind speed (m s1) at heights of 500, 700, and 850 hPa. In addition, the surface and the sea-level pressure (hPa) at 02:00, 05:00, 08:00, 14:00, and 20:00 h local time from 2013 to 2019 were used to determine the climate characteristics and synoptic conditions from 2013 to 2019 and their effect on the PM2.5 distribution.

3. Results and Discussion

3.1. Trend of Winter PM2.5 in MEC

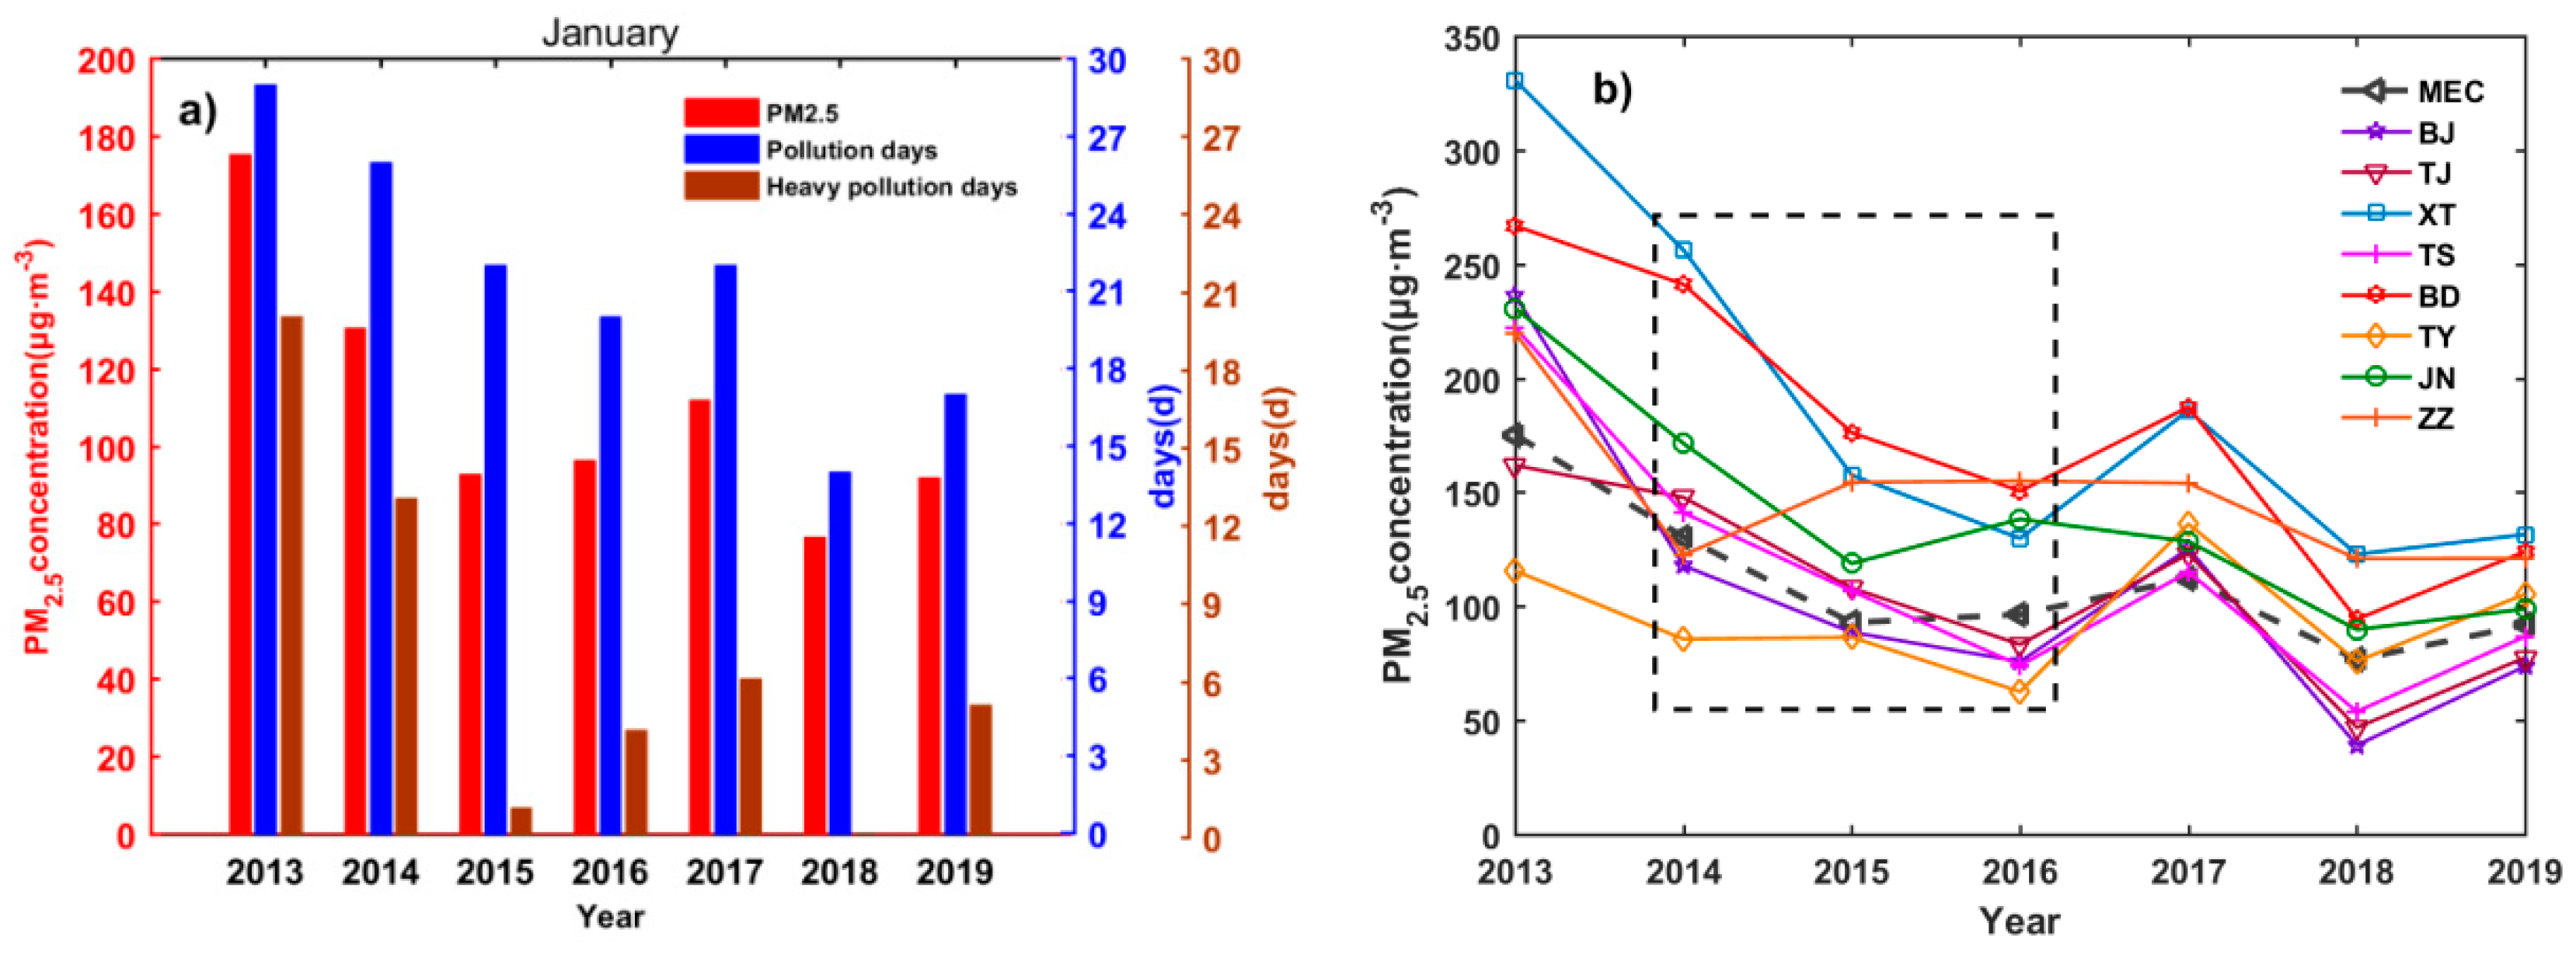
Figure 2a shows the regional January average PM2.5 concentrations and the number of pollution and heavy pollution days in MEC from 2013 to 2019. The highest winter PM2.5 concentration (175.2 μg m−3) was recorded in 2013, which reached the level of heavy pollution, according to the AAQS (Table 1). The highest number of pollution and heavy pollution days (29 and 20 days, respectively) also occurred in 2013. The winter PM2.5 concentration decreased from 2013 to 2015. The number of pollution and heavy pollution days also decreased from 2013 to 2015. The PM2.5 concentrations then increased slightly from 2015 to 2017. Both the PM2.5 concentration and the number of pollution days reached another peak in 2017 (112.0 μg m−3, 22 days). The lowest PM2.5 concentration (76.6 μg m−3) occurred in 2018, which is 56% lower than in 2013. The number of pollution days dropped to 14 and no heavy pollution incident occurred in January 2018. These results show that the air quality in MEC improved by 2018. However, the average PM2.5 concentration and number of pollution days increased again in the winter of 2019.
Figure 2b shows the January average PM2.5 concentrations at the eight typical stations from 2013 to 2019. The highest PM2.5 concentrations in 2013 were observed at Xingtai and Baoding stations (330.8 and 266.9 μg m−3, respectively), which are both located in the middle part of MEC. Beijing, which is the capital of China, also recorded serious air pollution with an average PM2.5 concentration of 236.4 μg m−3. The southern MEC, including Zhengzhou (219.9 μg m−3) and Jinan (230.7 μg m−3), was another highly polluted area. There were clear regional differences in the temporal changes in PM2.5 concentrations. The annual change trend of PM2.5 concentration at these middle stations (Beijing, Tianjin, Xingtai, Tangshan, and Baoding) was very similar with the trend of the whole MEC. Yet, the PM2.5 trends at stations of Taiyuan and Zhengzhou were different from that of MEC (black box). The PM2.5 concentrations at stations in the middle MEC all decreased from 2013 to 2016, but clearly increased in 2017, and then decreased to the lowest value in 2018. While PM2.5 concentration in Zhengzhou was the lowest in 2014, it increased from 2014 to 2016.
In general, the regional average PM2.5 concentration of MEC in 2019 was 83.4 μg m−3 lower than that of 2013 and PM2.5 concentrations in Beijing, Xingtai, and Baoding stations dropped by >140 μg m−3, which suggests that air quality in MEC improved significantly during the study period. This phenomenon may be related to the control of anthropogenic emissions and more favorable meteorological conditions.

3.2. Meteorological Conditions in the Winter of 2013

The highest regional winter PM2.5 concentration was recorded in 2013 and, therefore, the meteorological conditions, including the upper air circulation pattern and surface meteorological conditions, were investigated further.
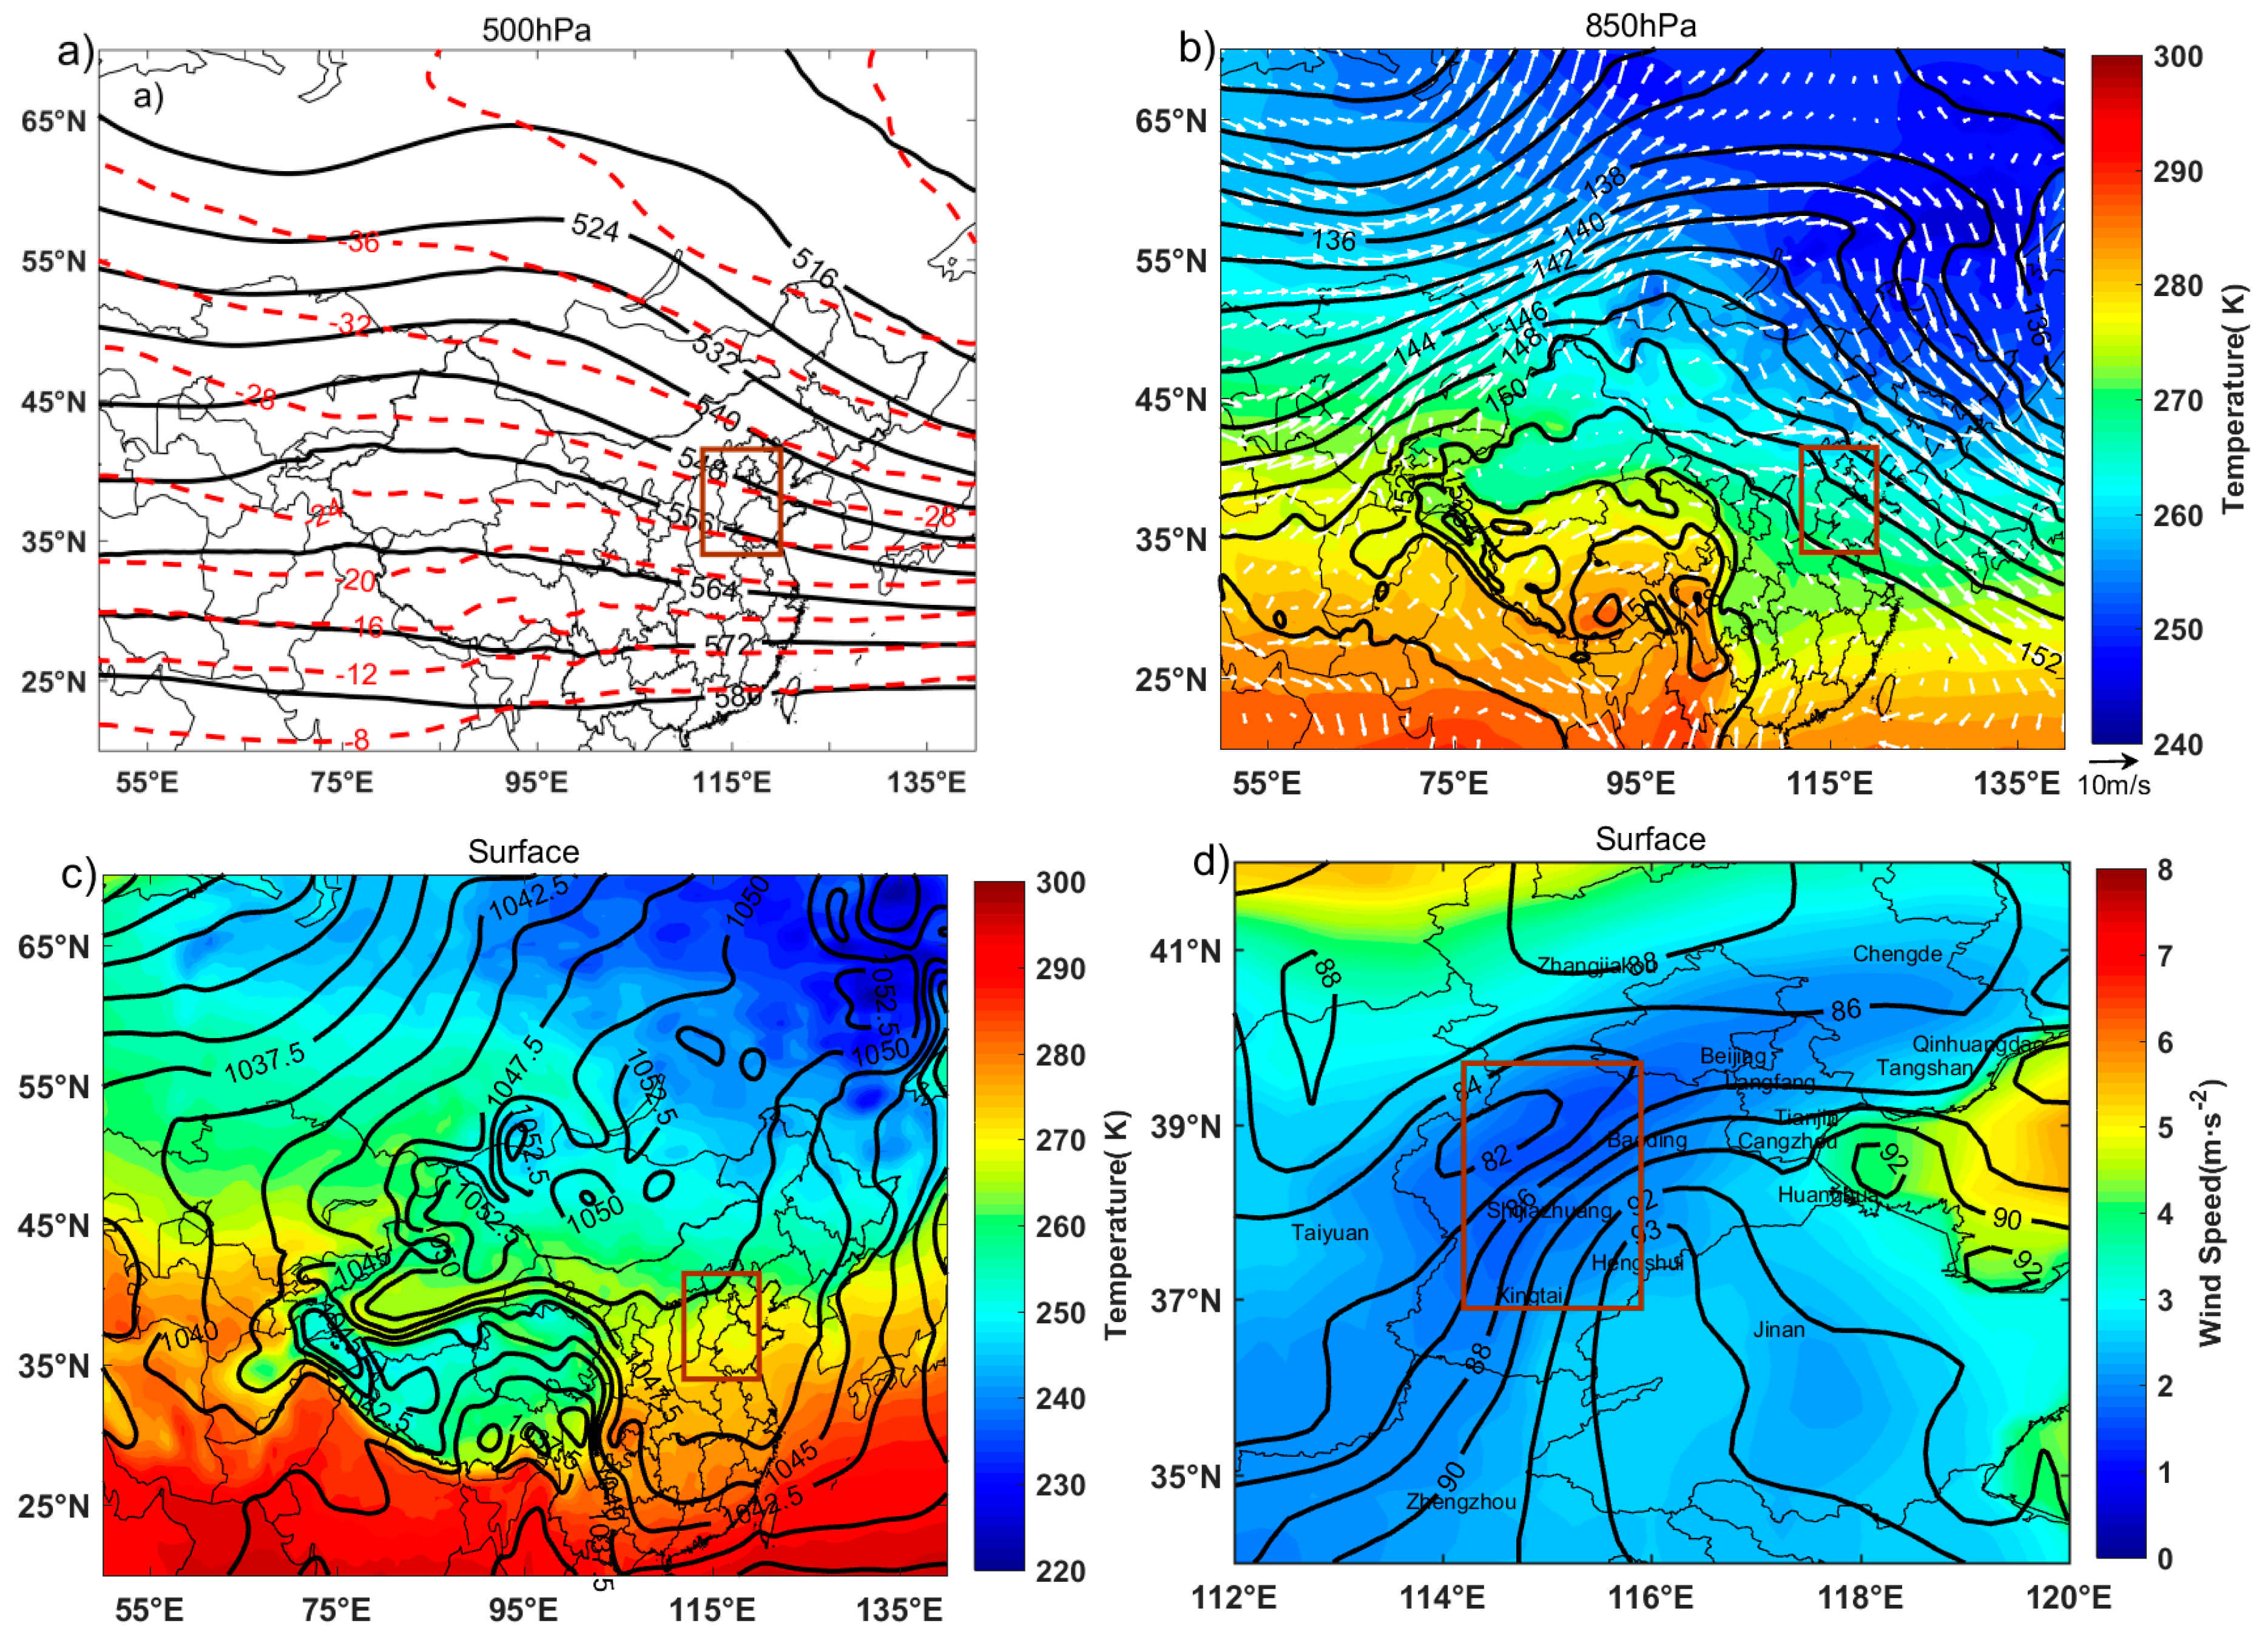
Figure 3a,b show the average geopotential height and temperature fields at 500 and 850 hPa levels, respectively, in January 2013. The synoptic situation at 500 hPa height was dominated by the distinct zonal circulation. A weak high-pressure ridge was found at both 500 and 850 hPa height in the middle and high latitudes of Asia. The MEC region was located in the front of this high ridge, which indicates that this area was often influenced by the divergence and subsidence of winds, suggesting weak winds and very stable atmospheric conditions in the winter of 2013. Figure 3c shows the average sea-level pressure and temperature fields on the surface in January 2013. The isobaric lines were extremely sparse in MEC, which suggests low horizontal wind speeds. This led to weak dispersion abilities.
The distribution of wind speeds has a dramatic effect on the distribution of PM2.5 concentrations. Low wind speeds suggest that the atmosphere is relatively stable and the dispersion of local emissions is largely limited. High ambient relative humidity (RH) favors the hygroscopic growth of aerosols. Figure 3d shows the average RH on the surface at 8:00 h local time and the wind speed field on 29 pollution days in January 2013. The whole area was controlled by low wind speeds (<3 m·s−1) and a high ambient RH (>84%). Meteorology conditions such as a turbulence condition and wind may have similar effects on water vapor and PM2.5, which is one of the reasons for high relative humidity and PM2.5 usually happening at the same time. High humidity is very favorable for increasing PM2.5 because of its contribution to the hygroscopic aerosol [8,12]. The highest PM2.5 concentrations in the winter of 2013 were found at Xingtai, Beijing, and Baoding stations in middle MEC. Similarly, a wind convergence zone (brown box in Figure 3c) from the northeast to the southwest was clearly visible in the middle MEC, which covered the most severely polluted stations (Beijing, Baoding, Shijiazhuang, Hengshui, Xingtai, and Zhengzhou). The wind convergence zone occurred in this region primarily as a result of the unique topography. The southeastern winds from the eastern plain and the northwestern winds weakened by the blocking effect of the Taihang Mountains converge to this wind convergence zone along the foot of the Taihang Mountains, which leads to low wind speeds and high aerosol loadings [12]. This explains why high PM2.5 events are common in this region.
In general, the meteorological conditions in 2013 were very conducive for the accumulation of aerosol pollutants and the occurrence of high PM2.5 concentration events. The strong zonal circulation at 500 hPa height, weak wind speeds, and high ambient RH on the surface favored the highest PM2.5 concentrations in the winter of 2013.

3.3. Meteorological Conditions from 2014 to 2019 Compared with 2013

3.3.1. Spatial Distribution of Geopotential Height, Temperature, and Wind Fields at 500 and 850 hPa Levels

The type and intensity of upper air circulation patterns have a strong influence on atmospheric conditions. When the synoptic situation is dominated by the zonal circulation, the circulation is relatively straight. Weak troughs and weak ridges usually appear in the westerly air flow. Affected by these, the MEC was often influenced by the divergence and subsidence of winds, which often results in stable atmospheric conditions and weak diffusion abilities. When the synoptic situation is dominated by the meridional circulation, deep troughs and strong ridges usually develop in the westerly air flow, which can cause strong cold air activity and high wind speeds. Figure 4a shows the average geopotential height and temperature fields in January from 2014 to 2019. Figure 4b shows the differences in these fields in 2014–2019 relative to 2013.
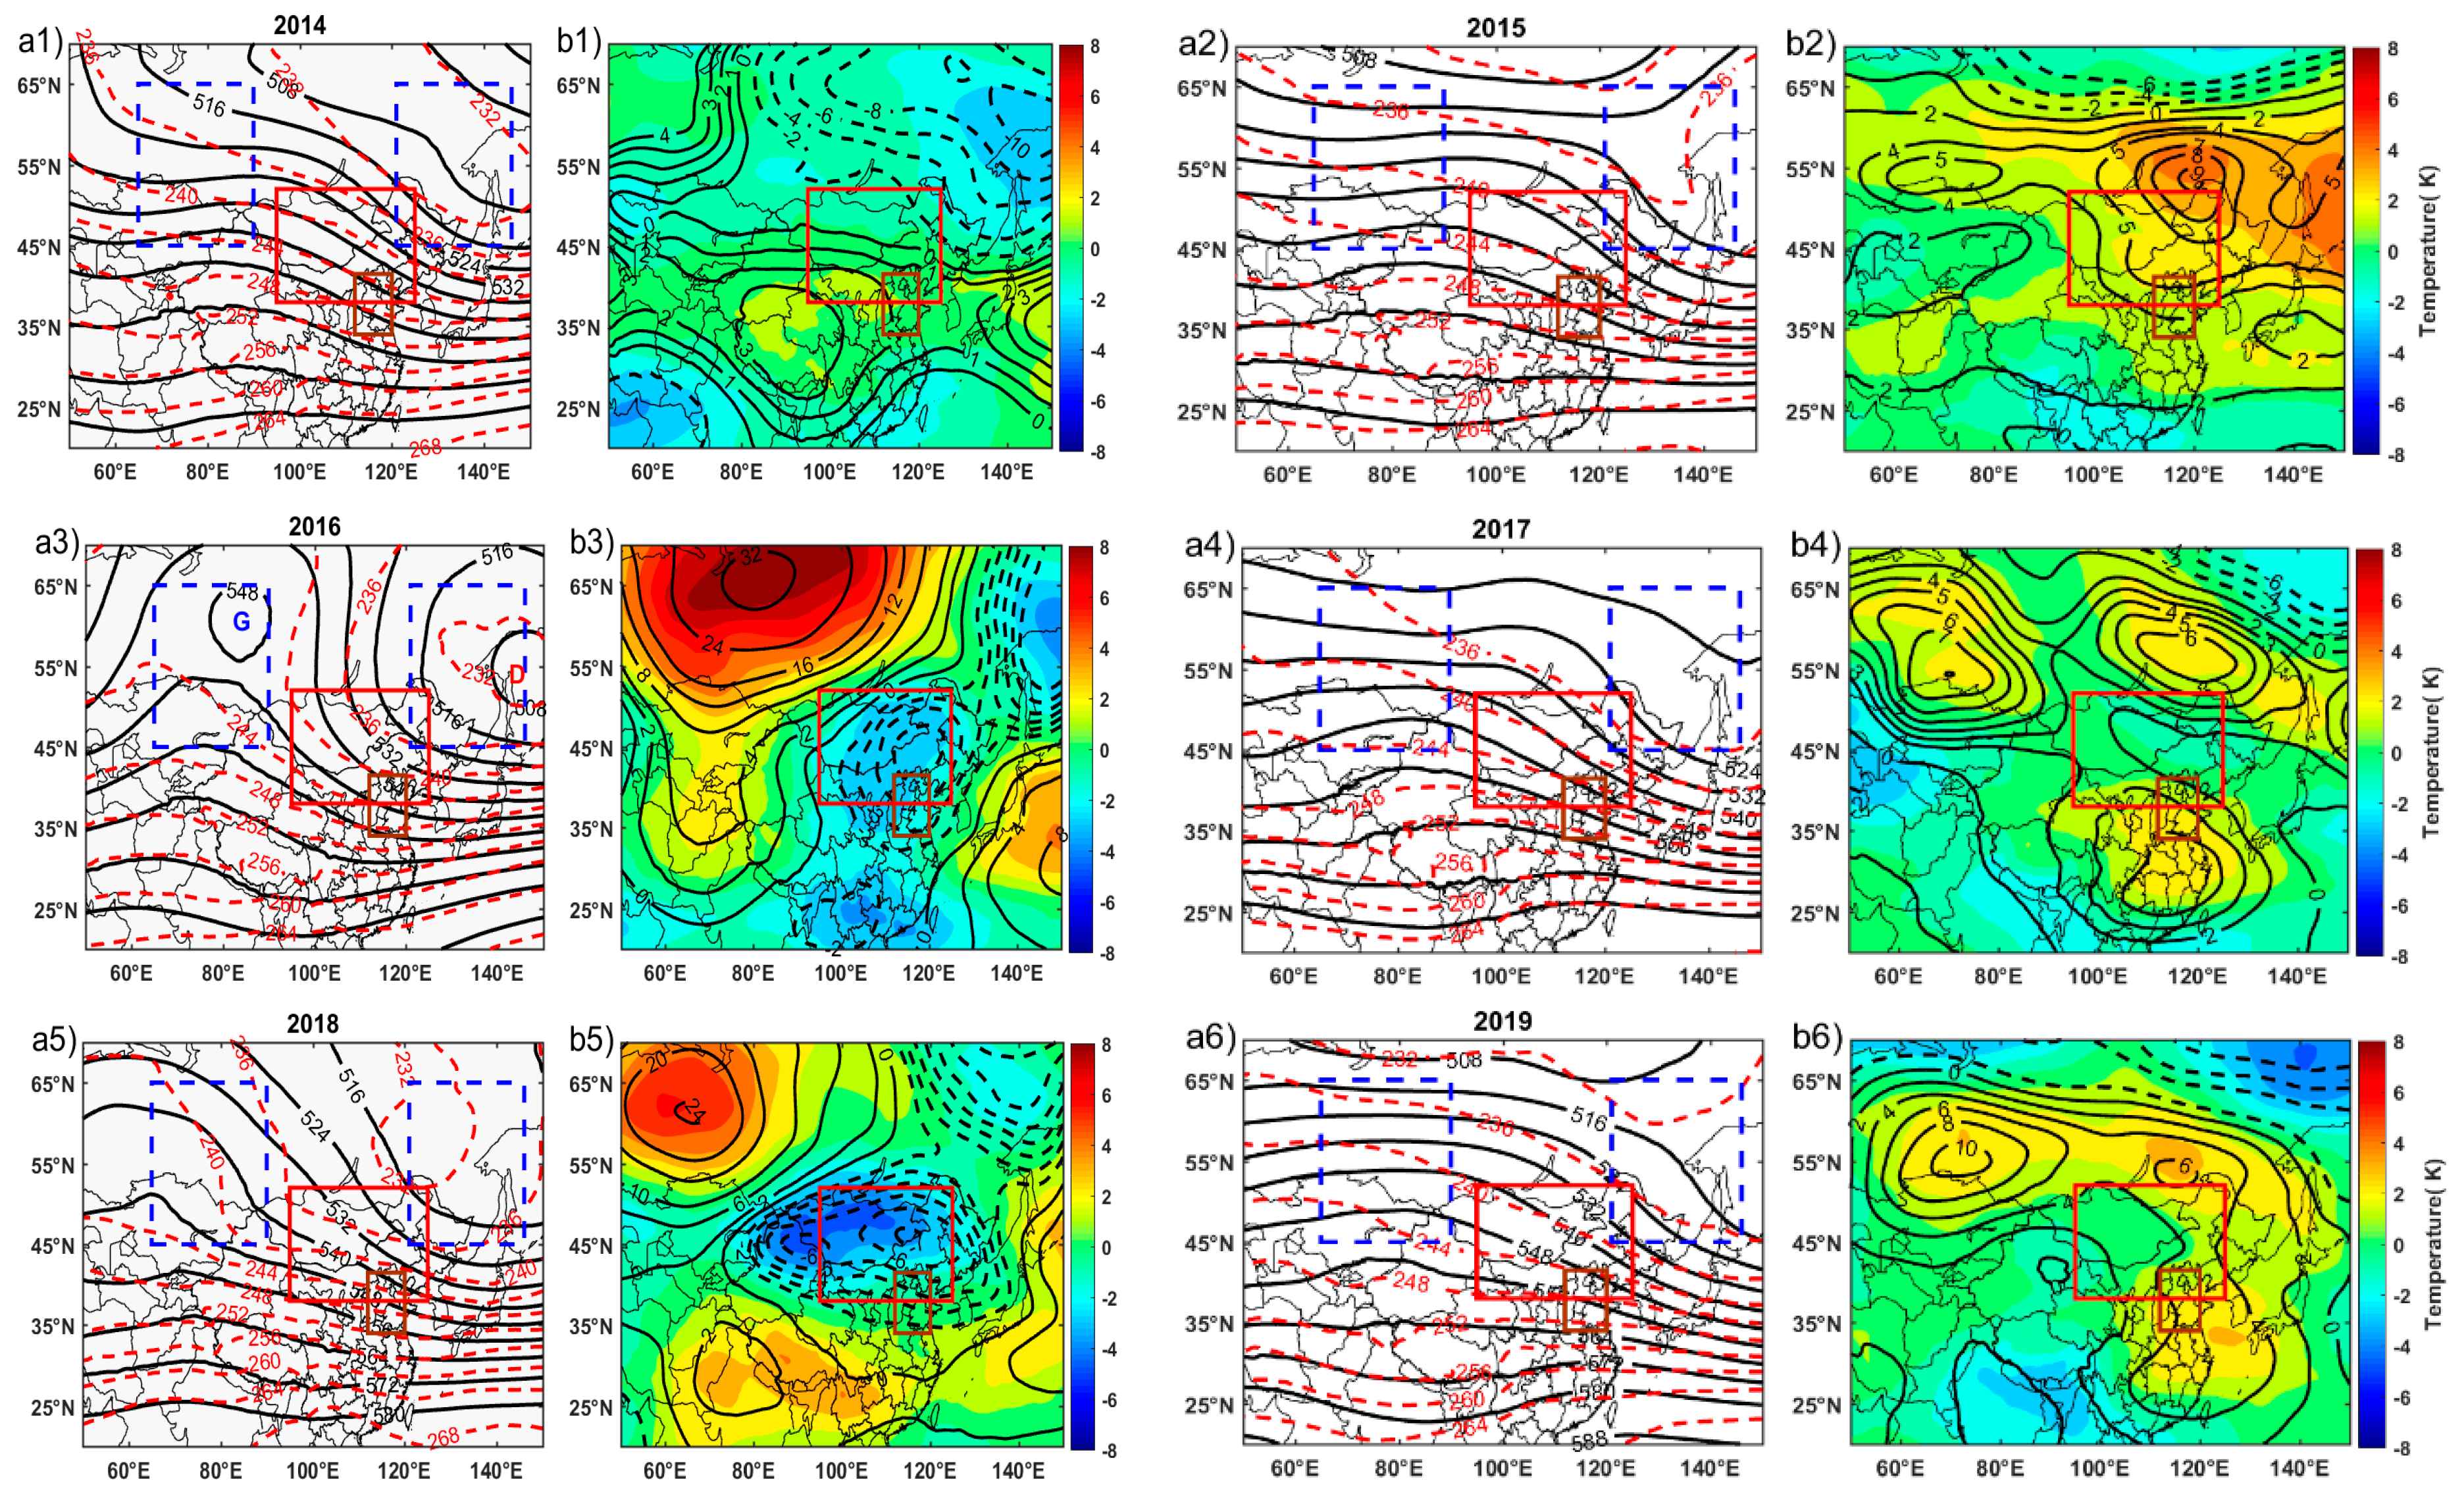
Figure 4 shows that the upper air circulation patterns in 2014 (Figure 4(a1)), 2015 (Figure 4(a2)), 2017 (Figure 4(a4)), and 2019 (Figure 4(a6)) were similar to the pattern in 2013 (Figure 3(a1)). The average synoptic situation at 500 hPa height in these years was dominated by the distinct zonal circulation. This zonal circulation led to stable atmospheric conditions and weaker dispersion abilities, which favored high pollutant loadings. We, therefore, define 2013, 2014, 2015, 2017, and 2019 as meteorology-haze years.
There were large changes in the synoptic situations at 500 hPa in 2016 and 2018 compared with those meteorology-haze years. The average synoptic situation in the mid-troposphere in 2016 and 2018 were dominated by the meridional circulation. As can be seen in Figure 4(a3), a strong center of high pressure occurred in the southern Ural Mountains in 2016. Strong north winds in front of the high ridge transported a large volume of cold air to Central and Eastern China and caused a considerable decrease in temperature. A deep low-pressure trough was present in the vicinity of Lake Baikal. As a result, MEC was often affected by the convergence and ascension of winds, which contributed to the vertical diffusion of pollutants. Similar geopotential height and temperature fields, although with a weaker ridge and trough, were present in 2018 (Figure 4(b5)), which suggests a relatively weaker upper air circulation in 2018 than in 2016. In general, MEC experienced frequent cold air events and strong winds in both 2016 and 2018, which contributed to the dispersion of pollutants. We, therefore, define 2016 and 2018 as meteorology-clean years.
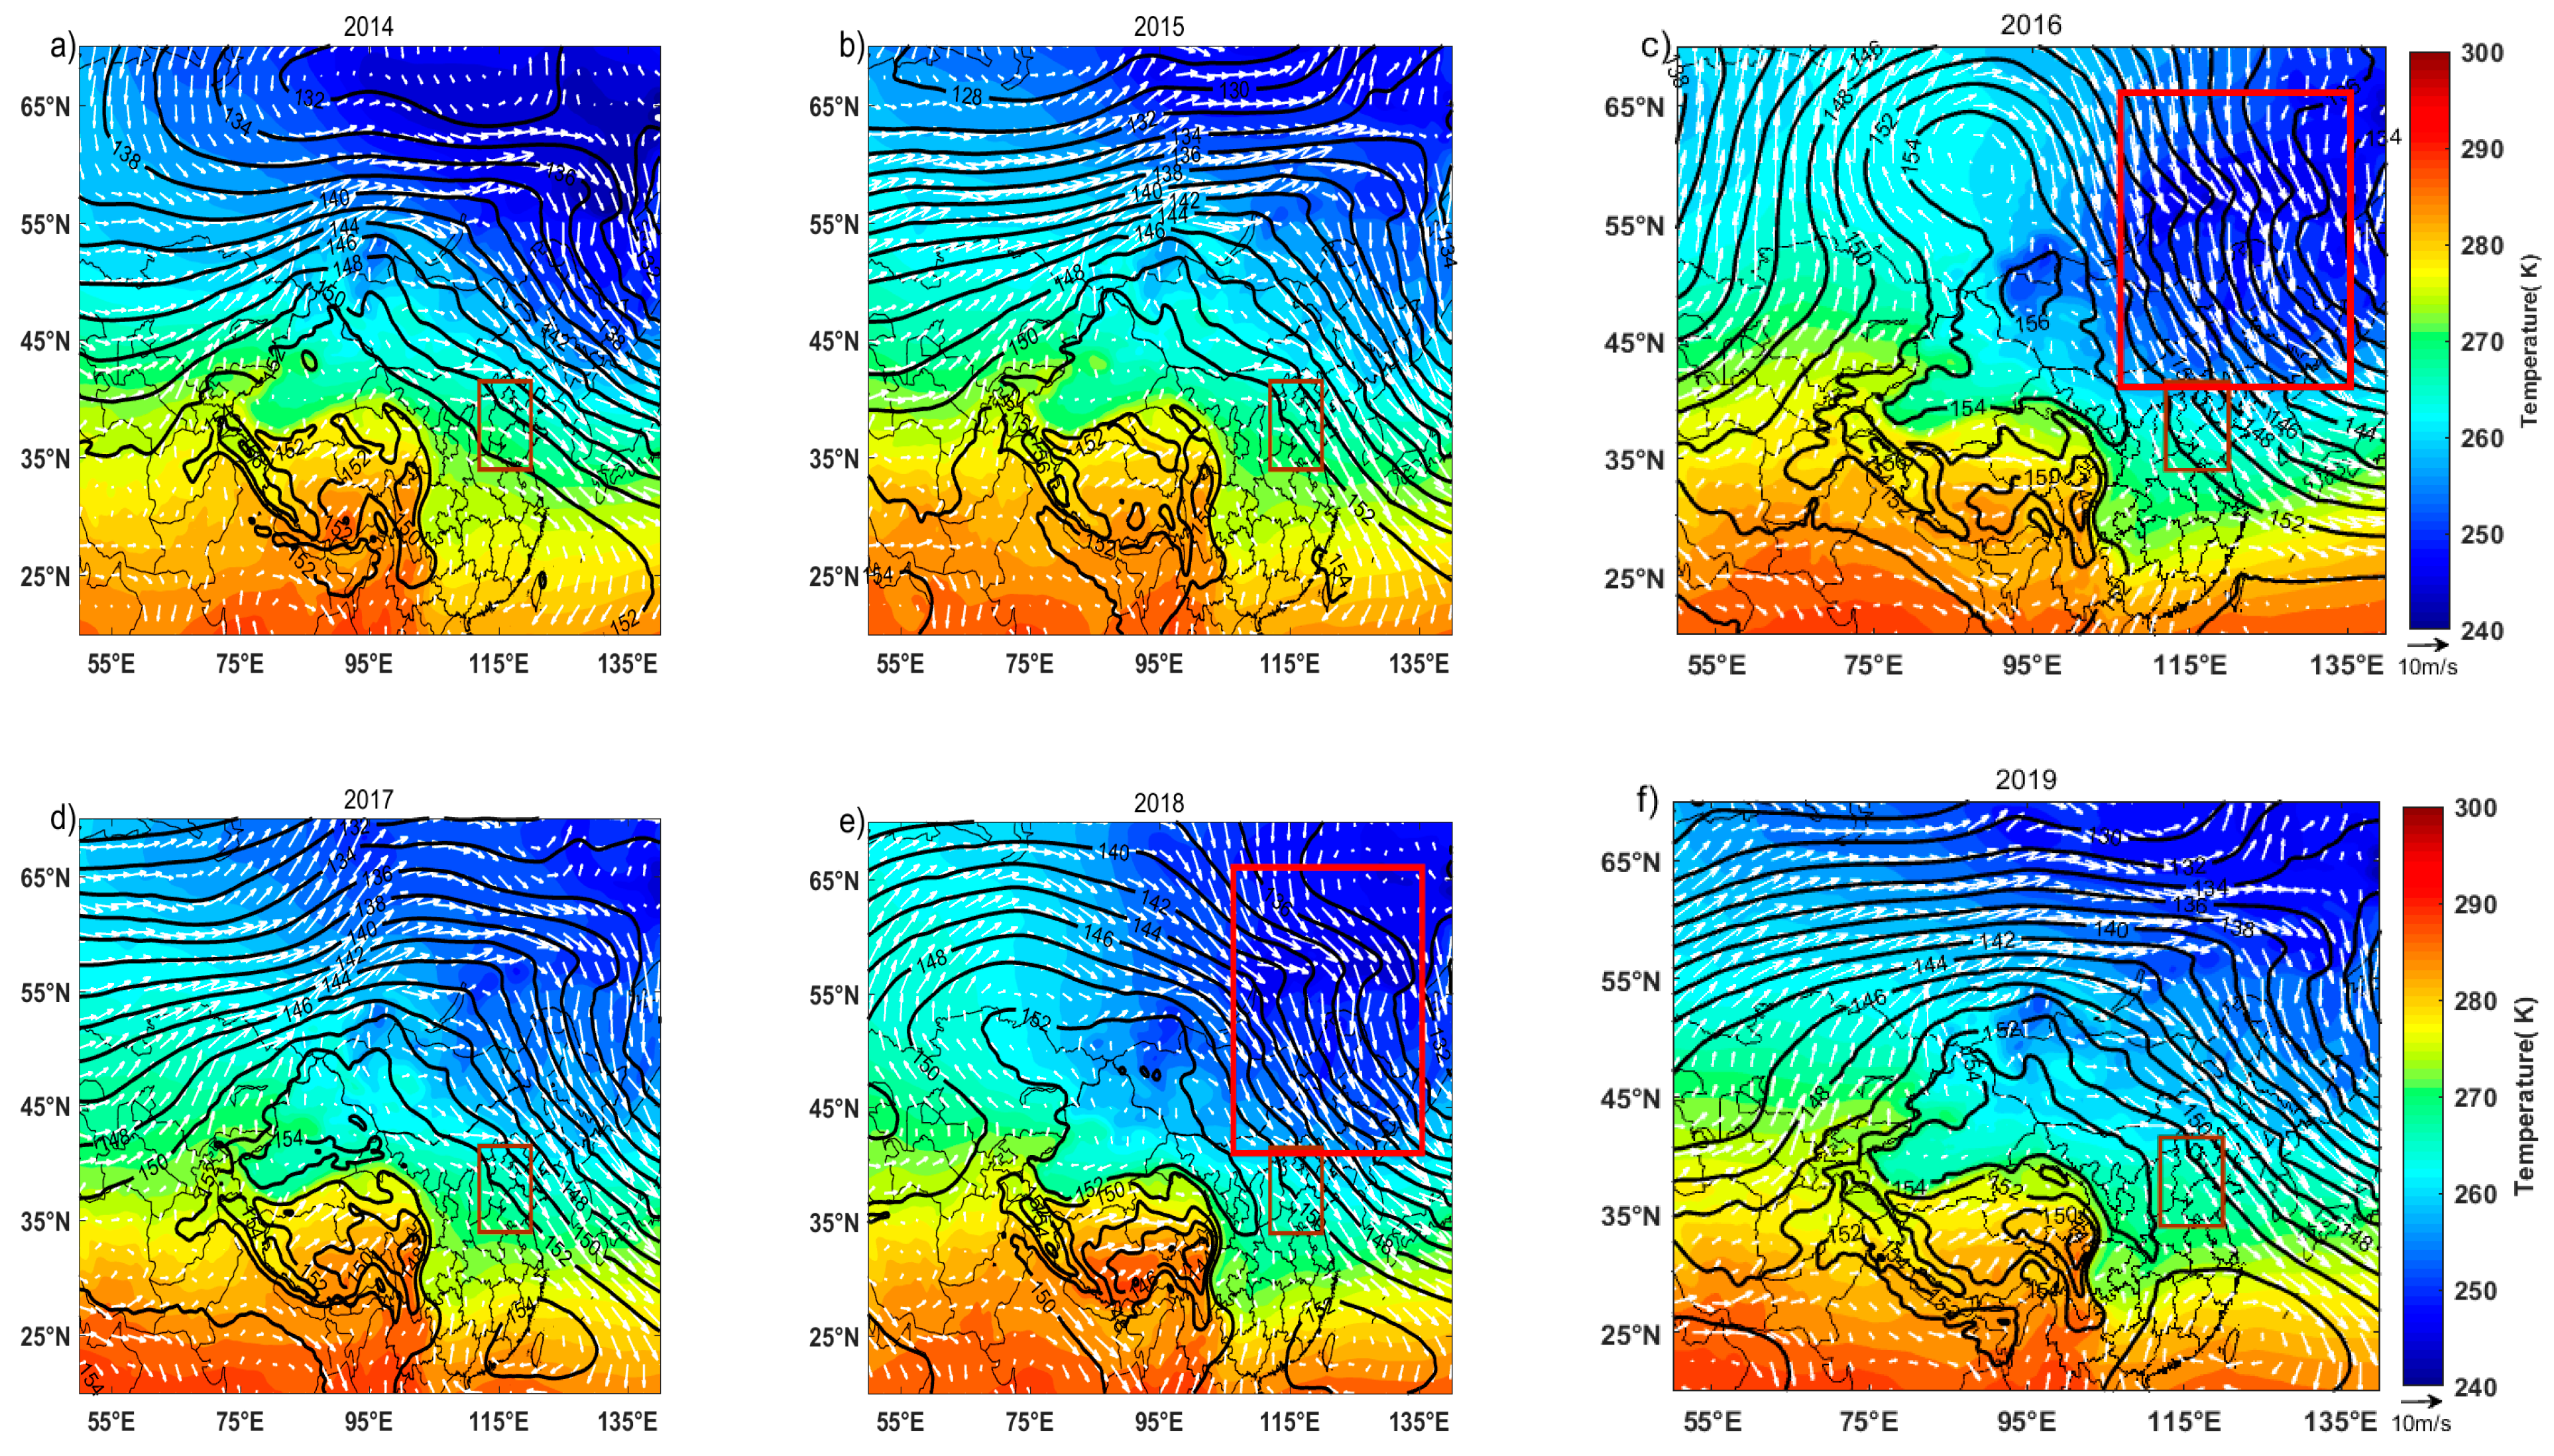
The synoptic situations at 850 hPa height can also reflect the type of low-level circulation and the intensity of cold air affecting the MEC. Figure 5 shows the average geopotential height, temperature, and wind fields in January from 2014 to 2019.
The distributions of geopotential height and temperature fields at a height of 850 hPa from 2013 to 2019 were almost consistent with those at 500 hPa height. These fields clearly reflected the strength of low-level cold air and its affecting region. When the synoptic situation were dominated by the distinct zonal circulation in these meteorology-haze years (2013, 2014, 2015, 2017, and 2019), the MEC was mainly affected by the weak northwest air flow and the low-temperature region was located on the northeast side of the study area, which suggests that the northwest airflow accompanied by cold air mainly affected the high latitudes of Asia and had little effect on MEC. However, when the synoptic situation was dominated by the strong meridional circulation in these meteorology-clean years (2016 and 2018), the low-temperature area (red box) were very close to MEC with clearly lower temperature values and higher wind speed compared with those in meteorology-haze years. The MEC was under the control of strong northerly airflow accompanied by strong cold air from the low-temperature area. The lower temperature and higher wind speed in MEC in 2016 and 2018 suggest that the meteorological conditions in 2016 and 2018 were much more conducive to the diffusion of aerosol pollutants.
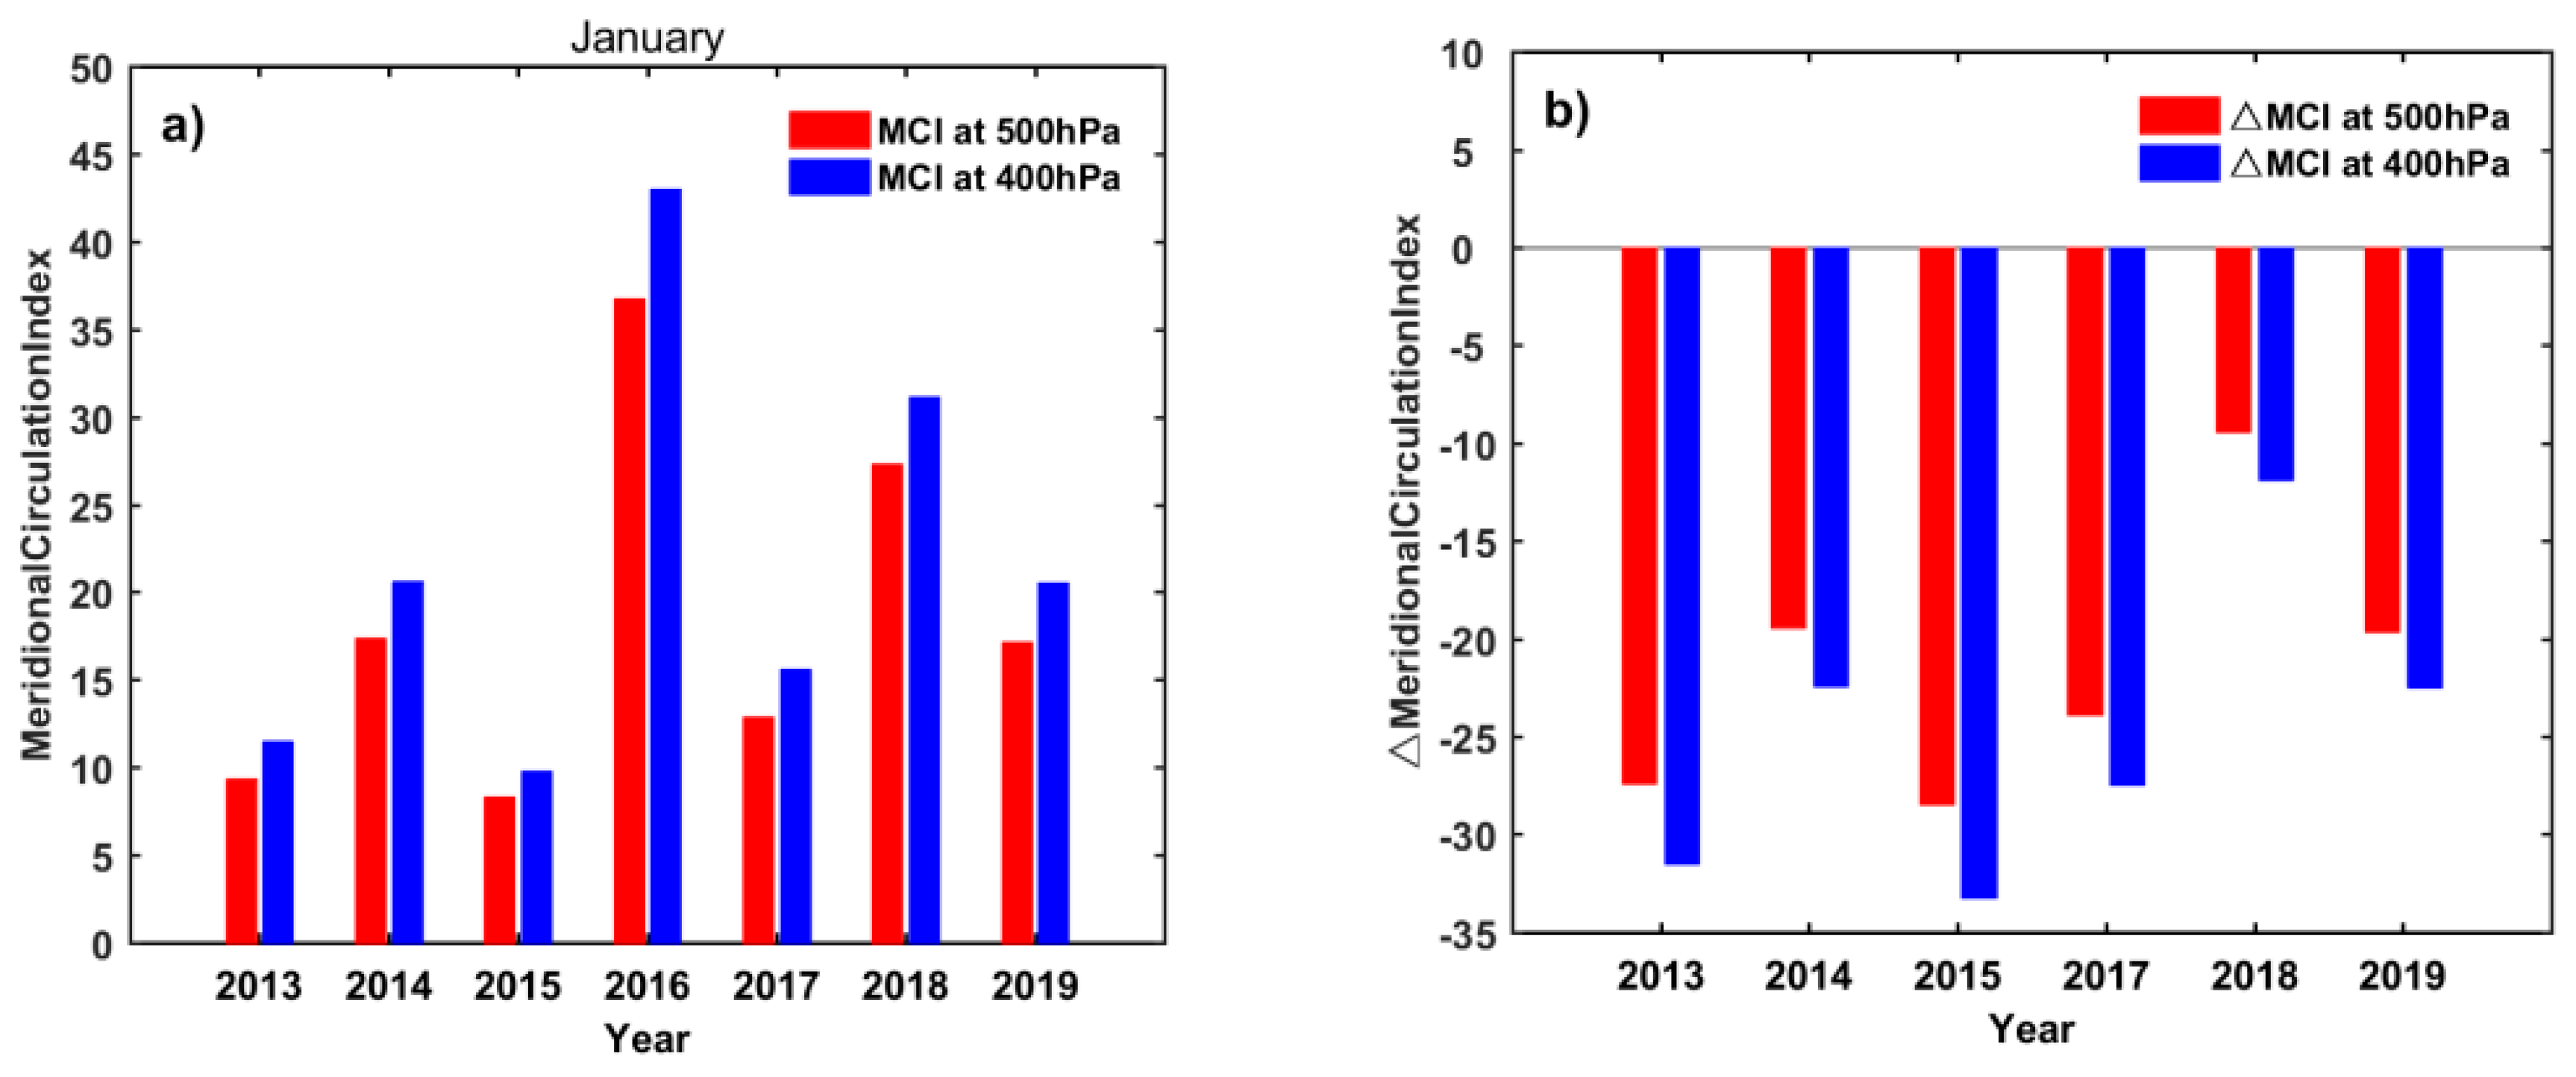
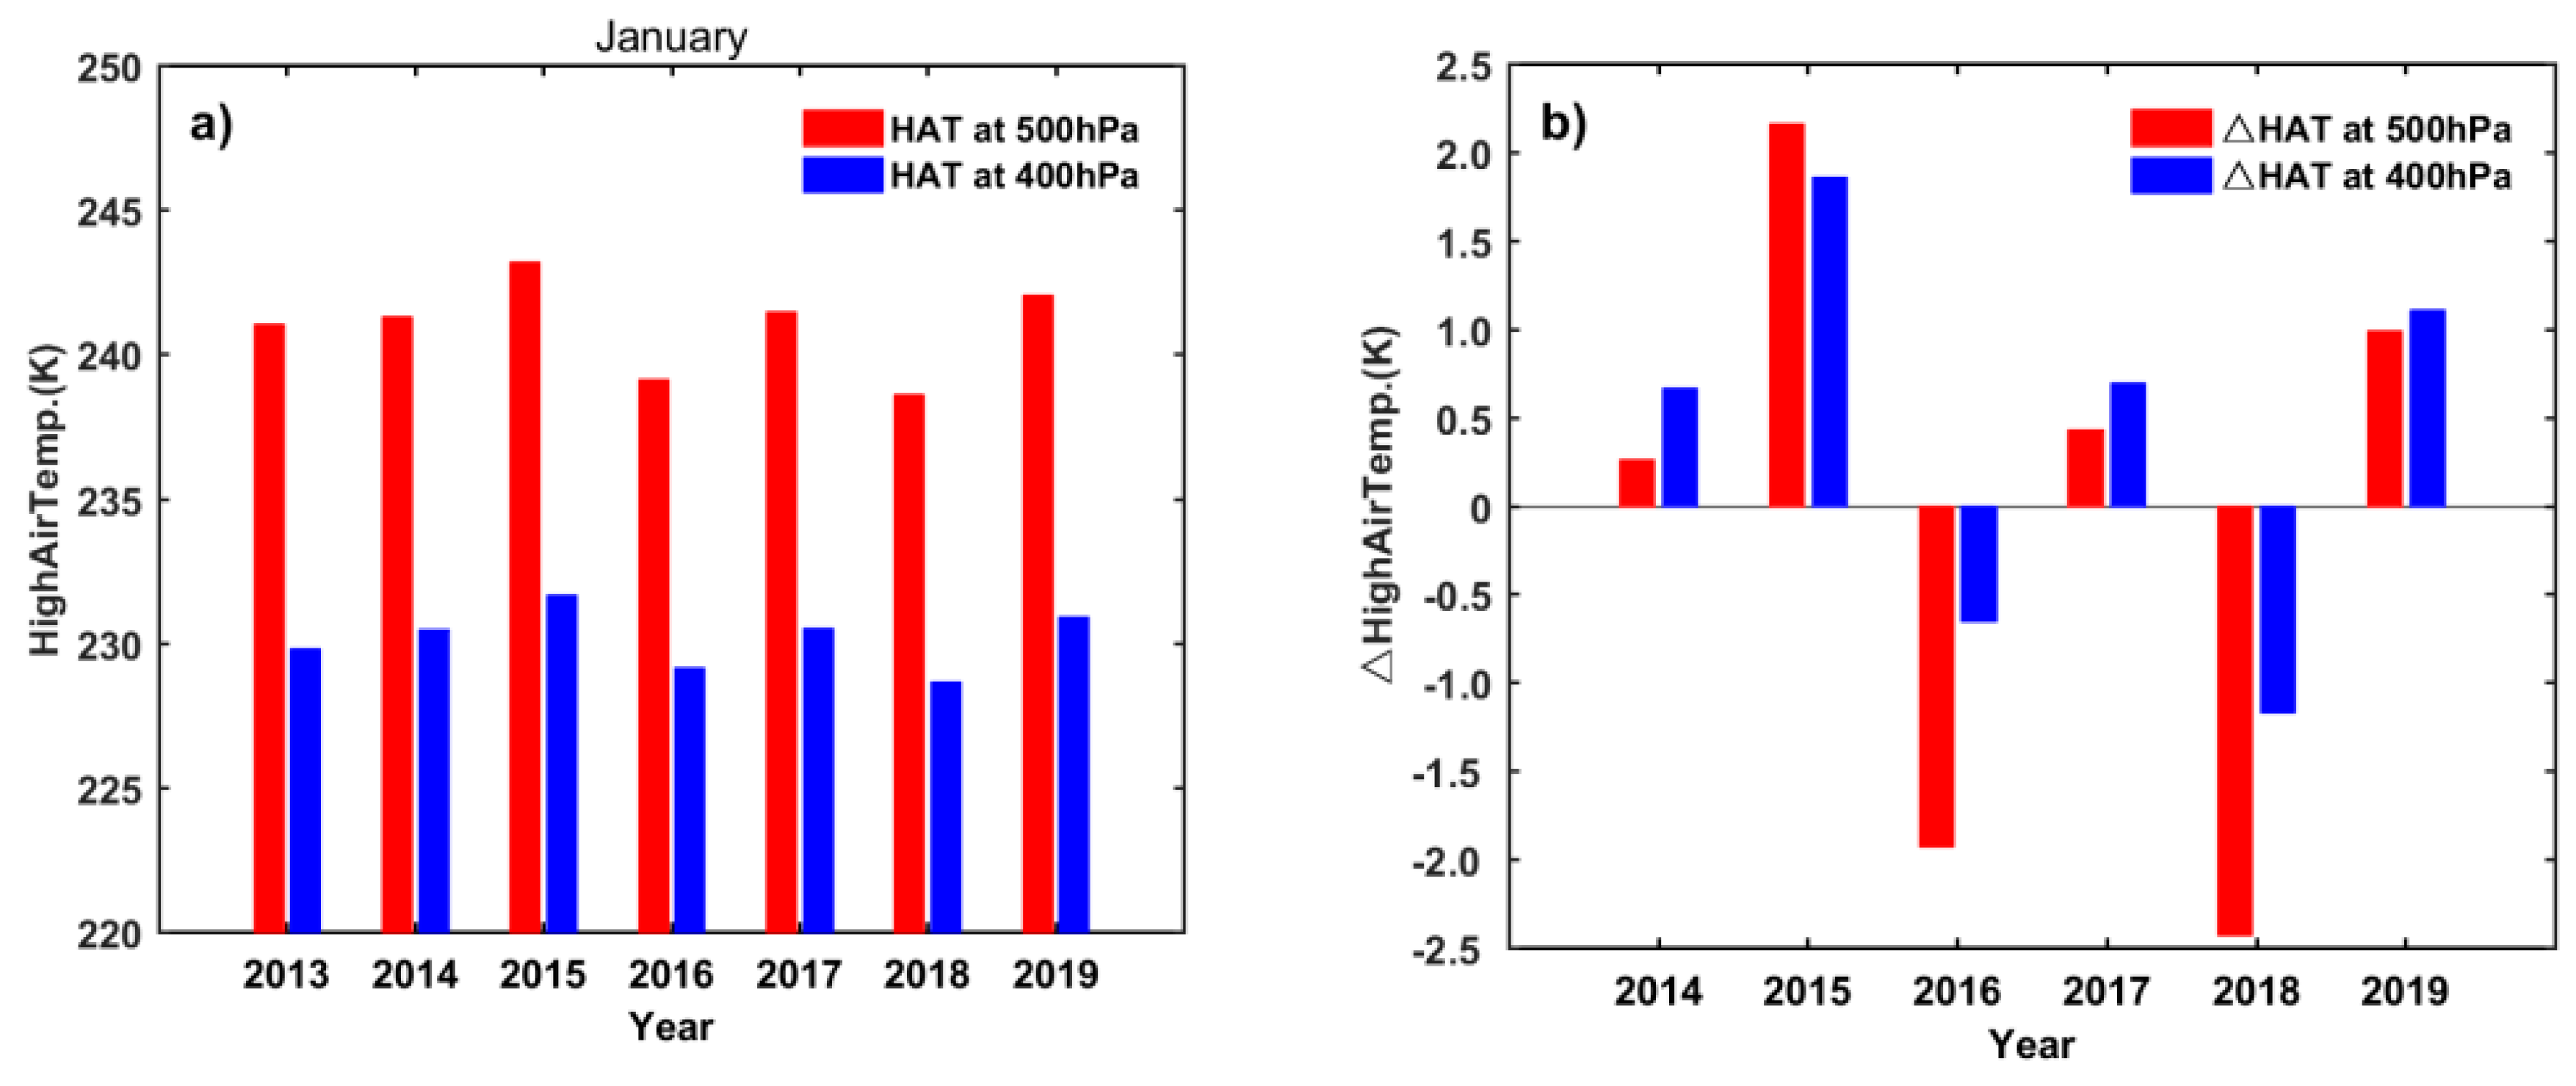
The synoptic situation at 500 hPa height was dominated by the strong meridional circulation in the winter of 2016 and strong centers of high and low pressure appeared at high latitudes (Figure 4(a3)). We, therefore, selected two regions (50–65° N, 70–90° E and 50–65° N, 126–146° E, blue dashed box), which contains the high and low pressure centers, as the meridional circulation affected areas and the difference between the average geopotential heights of these two regions was defined as the Meridional Circulation Index (MCI). The same calculation method was used to obtain the MCI from 2013 to 2019. MCI will be very high if the circulation at 500 hPa height is dominated by the meridional circulation. The average temperature of the upper area (38–52° N, 95–125° E) of MEC (high-level air temperature) was calculated to represent the strength of the high-level cold air. Strong cold air corresponds to a low high-level air temperature.
Figure 6a and Figure 7a show the values of the MCI and the high-level air temperature at 500 and 400 hPa heights from 2013 to 2019. The MCI was highest in 2016 and corresponded to the strongest meridional circulation. Figure 6b compares the differences in the MCI from 2013 to 2019 with the highest value. Figure 7b shows the differences in the high-level air temperature from 2014 to 2019 relative to 2013. The average synoptic situation in the mid-troposphere was dominated by the zonal circulation in the five meteorology-haze years (2013, 2014, 2015, 2017, and 2019) and, therefore, relatively lower MCI values and higher high-air temperature values were found in these years relative to 2016 and 2018. The lowest MCI value and highest high-level air temperature in 2015 suggest the most stable atmospheric conditions and, therefore, the most unfavorable conditions for the diffusion of aerosol pollutants, followed by 2013, 2017, 2019, and 2014. The MCI values were much higher in the two meteorology-clean years (2016 and 2018) than in other years. The synoptic situation in the mid-troposphere in 2016 favored a greater diffusion of pollutants than in 2018 based on the much higher MCI value. The levels of meteorology-haze based on the MCI values decreased in the order 2015, 2013, 2017, 2019, 2014, 2018, and 2016.

3.3.2. Spatial Distribution of Wind Speed and RH Field

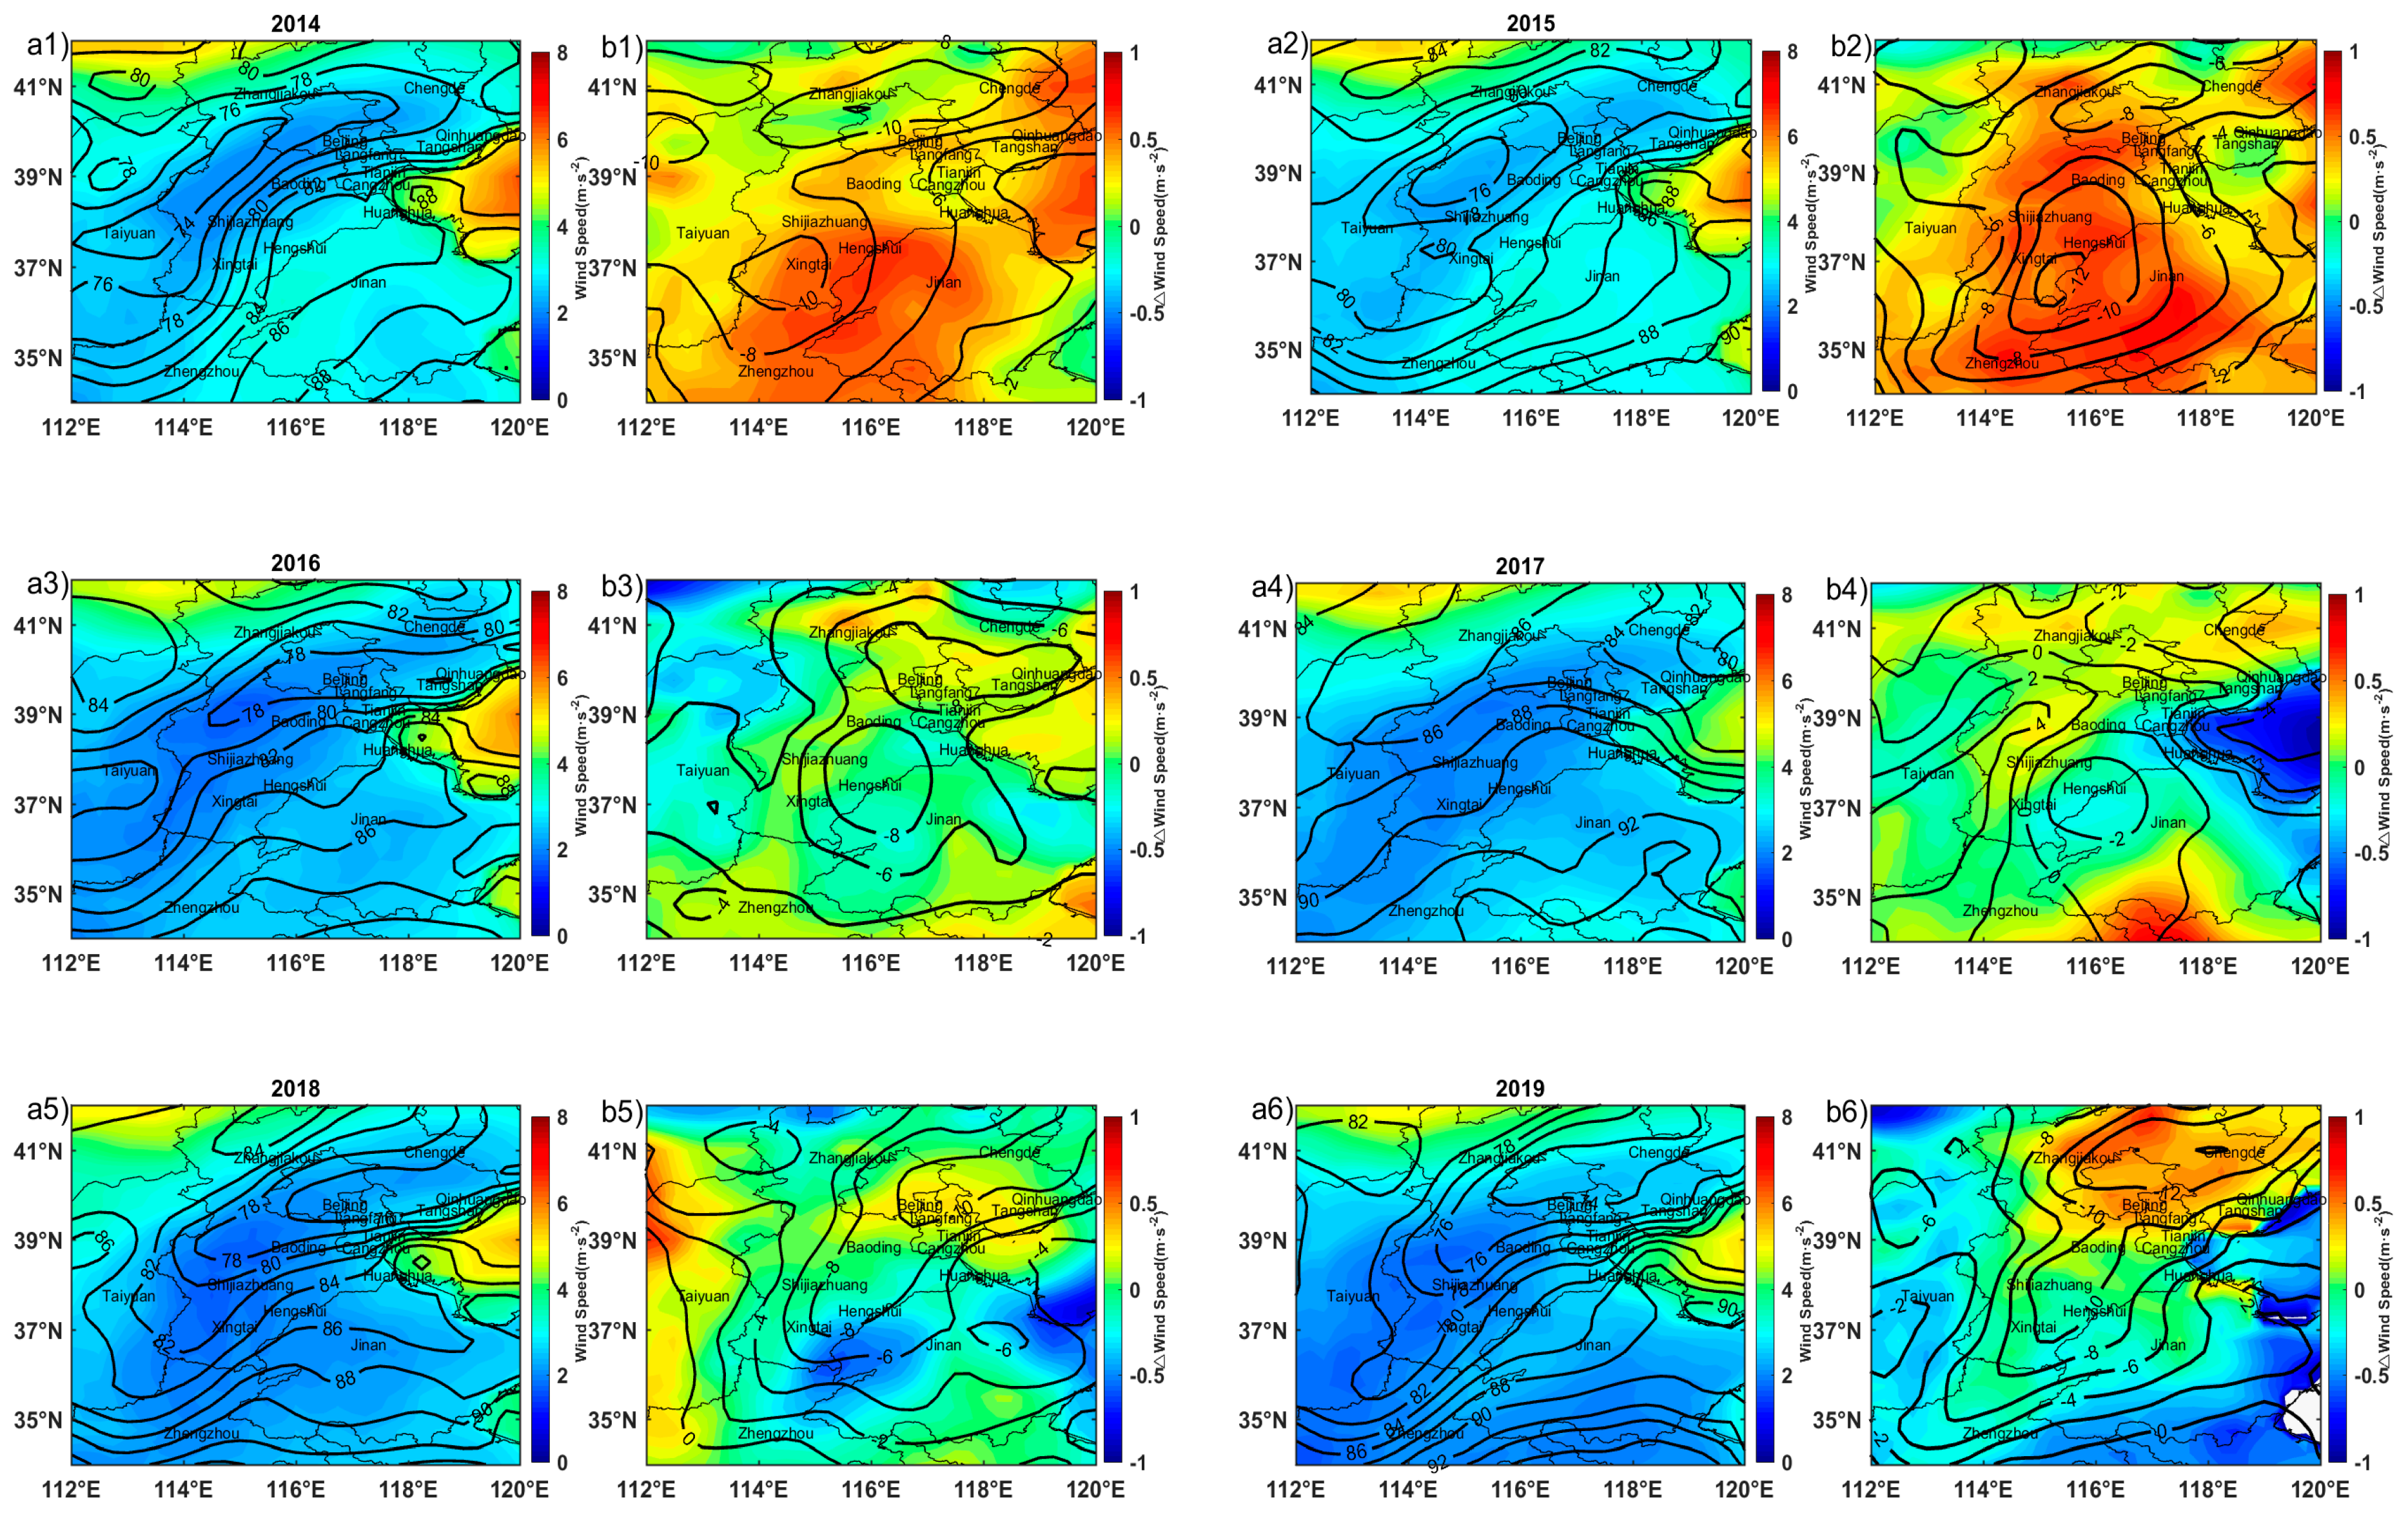
Both weak winds and a high ambient RH on the surface are regarded as important factors in high aerosol loadings. The wind speed has a great influence on its ability to disperse pollutants. The ambient RH influences the growth of aerosols by affecting their scattering and hygroscopic properties. The effects of these two factors on PM2.5 pollution events can be determined from Figure 8, which shows the average RH at 8:00 h of local time and wind speed field of air pollution days from 2014 to 2019, along with their differences from the conditions in 2013.
Lower ambient RH and higher wind speeds were found in 2014 (Figure 8(b1)) and 2015 (Figure 8(b2)) than in 2013. The ambient RH values dropped by as much as 12% and wind speeds in 2015 was 0.5 m·s−1 higher compared with 2013 (Figure 8(b2)). The wind speeds in 2016 (Figure 8(a3)), 2018 (Figure 8(a5)), and 2019 (Figure 8(a6)) were similar to those in 2013, but with lower ambient RH values. The relative humidity values in the western MEC in 2017 exceeded the values in 2013 (Figure 8(b4)).
The wind speeds increased at most of the stations located in the middle and southern MEC (including Shijiazhuang, Xingtai, Hengshui, Zhengzhou, and Jinan) in 2014. This region of high winds extended to the northern MEC in 2015, which includes Baoding, Beijing, and Zhangjiakou. The wind speeds at the southern stations (including Xingtai, Jinan, and Zhengzhou) then decreased from 2015 to 2018. There was no significant change in the wind speeds at stations in the middle and eastern MEC (including Baoding, Beijing, Tianjin, and Tangshan) from 2015 to 2018, even though these were still higher than in 2013.

3.4. Contribution of Meteorological Conditions and Emissions to Winter PM2.5 Concentrations

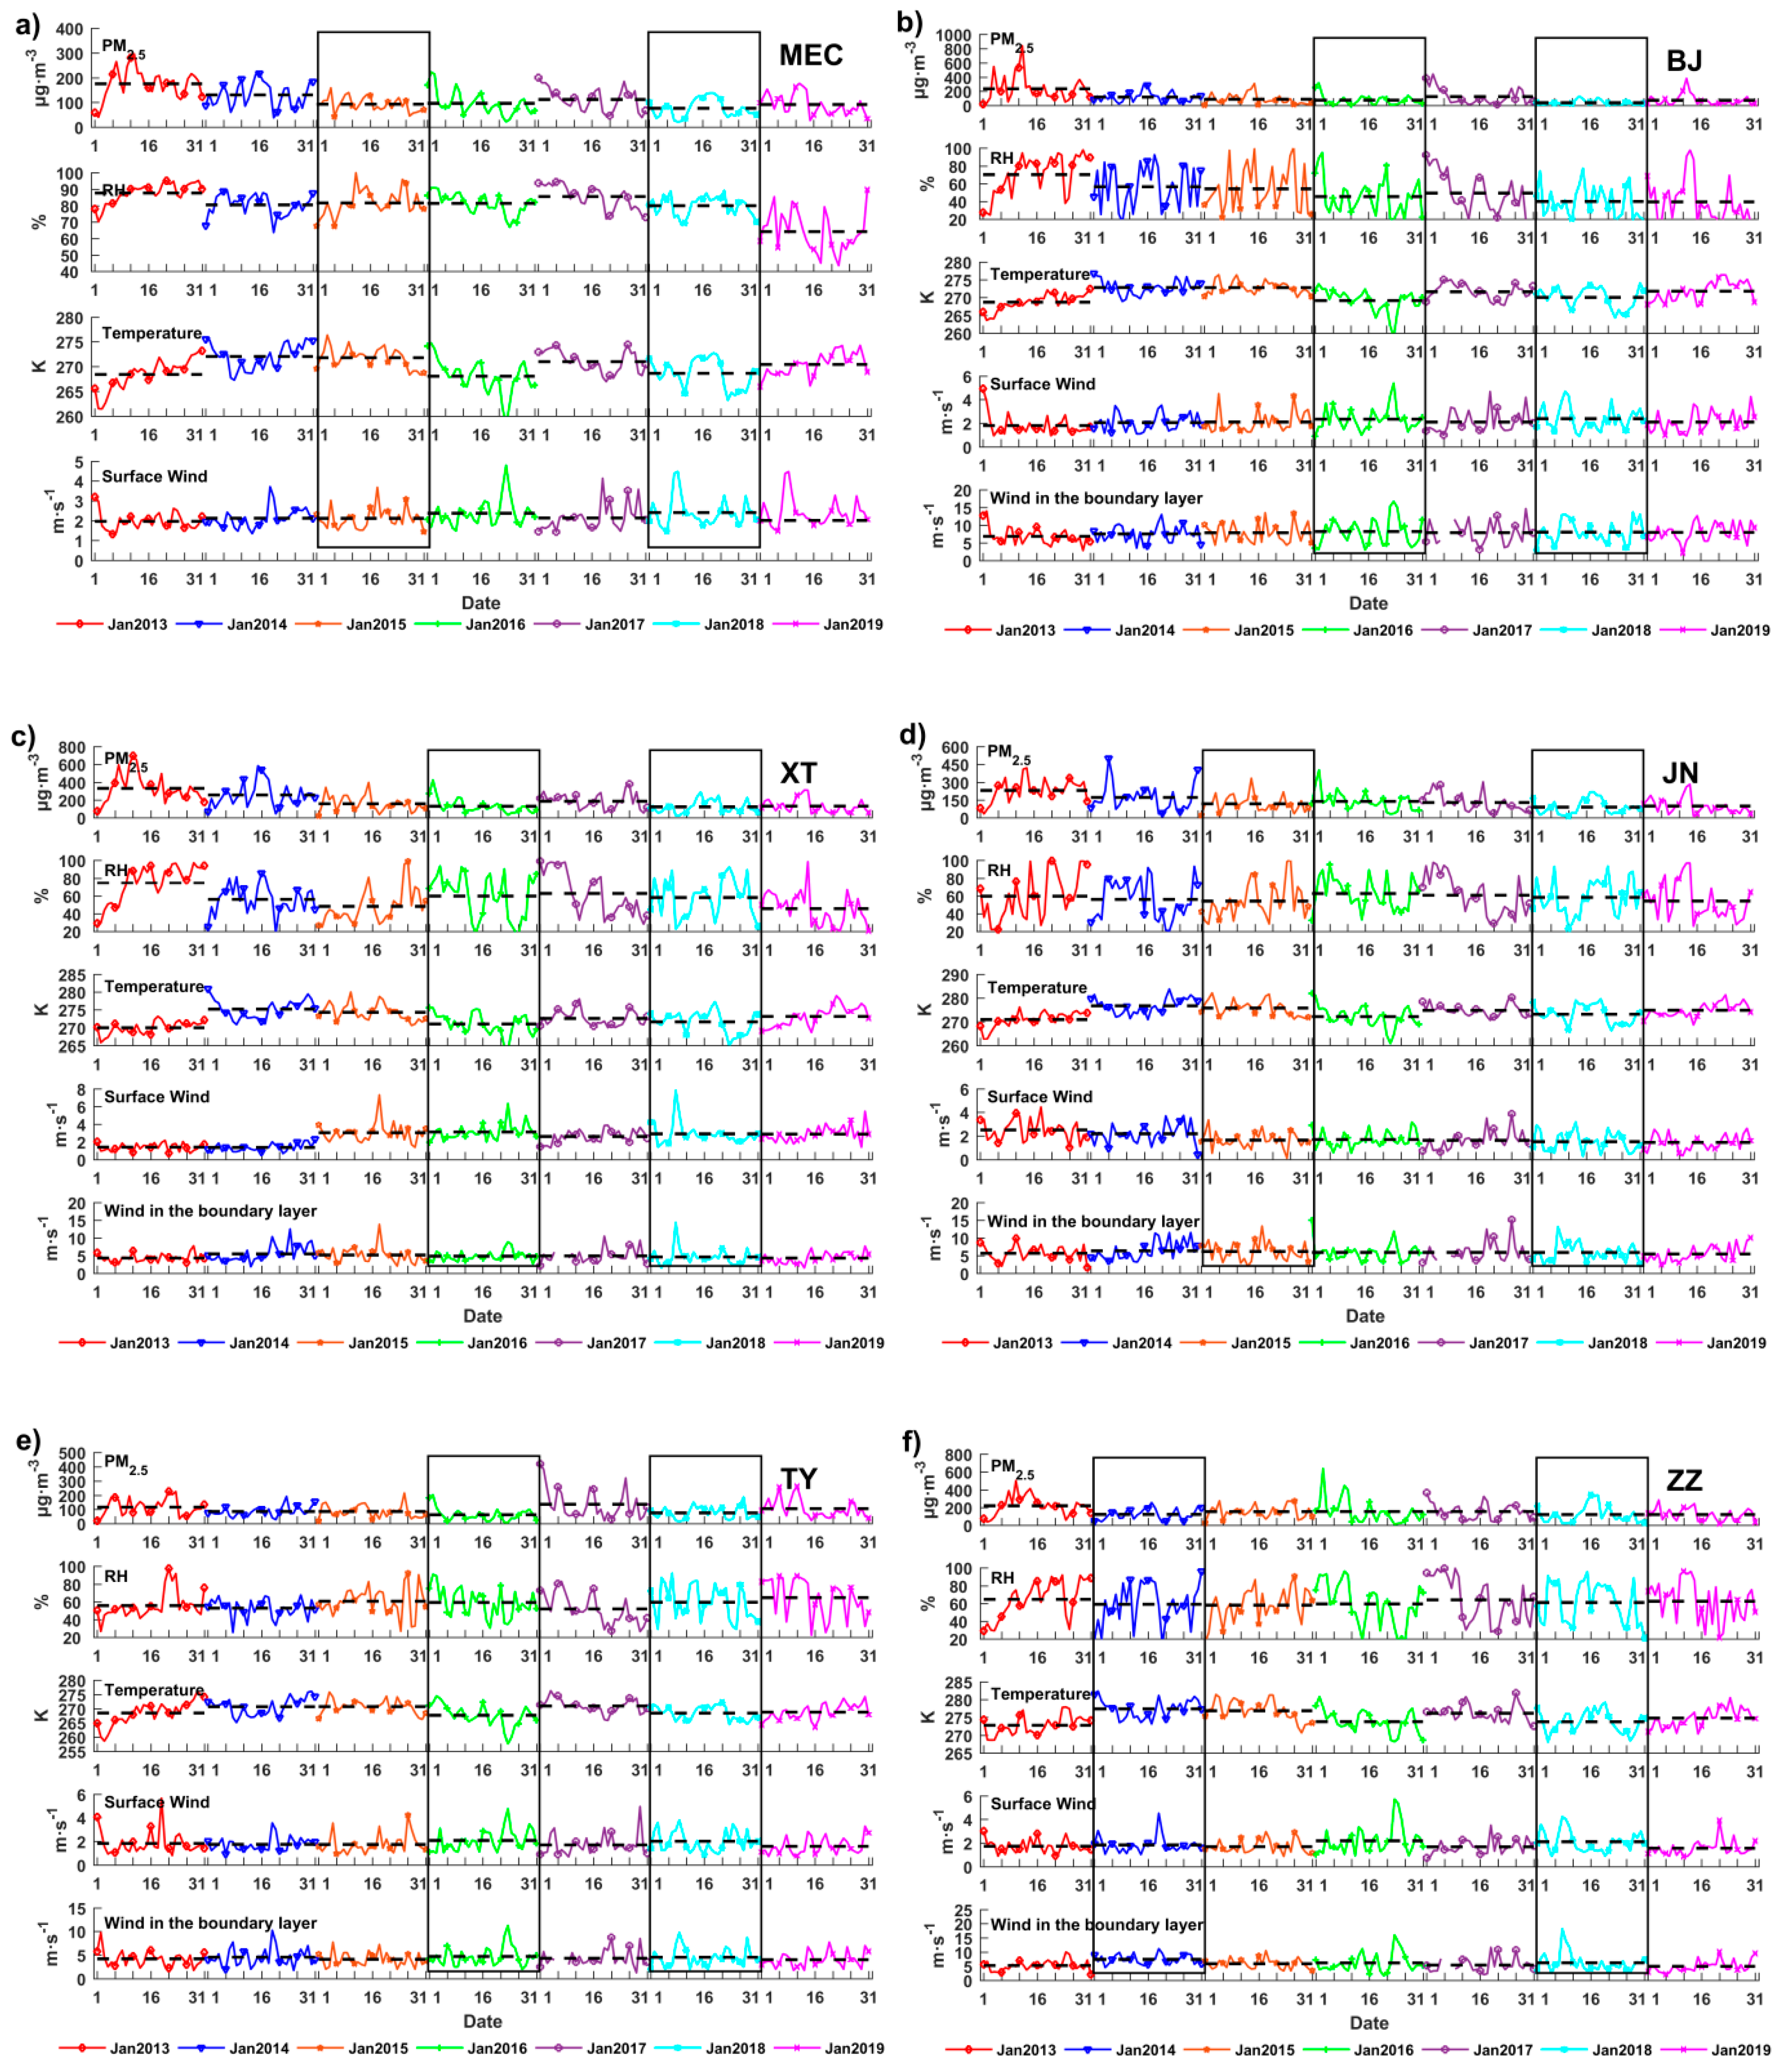
Figure 9 shows the daily average PM2.5 concentrations, wind speed, temperature, and RH values at 8:00 h of local time of the overall MEC and the five stations from 2013 to 2019 in order to study the influence of surface factors on PM2.5 concentrations. Table 2 gives the values of regional average PM2.5 concentrations, wind speeds at 700 and 850 hPa levels, surface RH, and wind speeds of the whole MEC as well as the air pollution days, MCI, and high-level air temperature from 2013 to 2019. Winter (January) is a dry season in MEC in China. Considering precipitation in the study area was generally low in the winter and the difference in spatial distribution of precipitation was small (Figure ignored). Therefore, the influence in the removal effect of rainfall on regional PM2.5 concentration could be neglected.
The time series of daily PM2.5 values shows that the air quality in January 2013 (Figure 9a) was only good during the first two days. Thereafter, most of the daily values reached the level of heavy pollution. The heaviest air pollution episode with a peak value of 296.3 μg m−3 was observed from January 6, 2013 to January 16, 2013. Corresponding to these high PM2.5 values, high RH values and low wind speeds were also observed in 2013. The rapid increase in PM2.5 concentrations in early January corresponded with the rapid increase in RH and decrease in wind speed. The correlation coefficients between PM2.5 concentration and RH and wind speed were 0.44 and −0.49, passed a 95% and a 99% significant test, respectively, which suggests that short-term variations in PM2.5 concentrations have a positive correlation with ambient RH and a negative correlation with the wind speed. Beijing (Figure 9b) and Xingtai (Figure 9c), which are located in the middle part of MEC, as well as Jinan (Figure 9d) and Zhengzhou (Figure 9f) stations, which are located in the southern MEC, all experienced the most severe air pollution in 2013. An extremely serious air pollution event was observed in Beijing during the period January 9–23, with a peak on January 12 of 838.5 μg m−3. Xingtai was confirmed as the most polluted city in 2013, with an average PM2.5 concentration of 329.3 μg m−3 (Figure 2b). The daily PM2.5 value for 21 days in Xingtai exceeded 250.0 μg m−3 and reached the level of hazardous pollution. These frequent air pollution events in the three middle stations may be related to the high ambient RH with average values of the two stations close to 80% and weak winds with average values <2 m·s−1.
The regional daily PM2.5 concentrations in 2014 fluctuated around 150 μg m−3 and most of the PM2.5 values were relatively lower than in 2013 (Figure 9a). Corresponding to the lower PM2.5 values, most RH values were also lower than in 2013. The wind speeds in the first half of the month in 2014 showed no significant change, but increased thereafter. A higher MCI and lower high-level air temperature than in 2013 suggest that the upper air circulation pattern in 2014 was more favorable for the diffusion of aerosol pollutants. The average PM2.5 at Beijing and Xingtai stations decreased by 118.6 and 74.6 μg m−3, respectively (Figure 2b). Correspondingly, the average RH at the two stations dropped to <60% and the average surface wind speeds increased. On the regional scale, the regional winter PM2.5 decreased by 26% in 2014 compared with that in 2013 (Table 2). The meteorological factors in 2014 were also more conducive to the diffusion of pollutants. Considering the 87% higher MCI, and both 5% higher wind speed of 700 hPa height and the ground than in 2013, the 26% decrease in PM2.5 in 2014 may be due to better meteorological conditions.
The regional winter PM2.5 value in 2015 was clearly lower than that in 2013 and 2014 (Figure 2a). The PM2.5 values decreased further at these stations, except at station Zhengzhou, but there was no clear change in the wind speed, RH, and temperature in MEC. The largest decrease in the average PM2.5 concentration at the six stations was at Xingtai (Figure 9c), where it was accompanied by a large increase in the average wind speed (3.0 m·s−1) and a significant decrease in RH (48.3%). However, the reduction in PM2.5 concentrations at Beijing, Taiyuan, and Jinan stations did not correspond to better meteorological conditions on the surface. The winds at Jinan station, both on the surface and in the boundary layer, became weaker than in 2014. The regional average PM2.5 value of MEC in 2015 (92.8 μg m−3) decreased by 29% compared with 2014 (130.5 μg m−3), while the wind speeds at 700 and 850 hPa height decreased by 16% and 6%, respectively. In addition, there were only small changes in surface RH and wind speed (Table 2). It has been shown that the large-scale circulation in 2015 resulted in a poorer diffusion of pollutants, with a 52% lower MCI than in 2014. We suggest that the 29% reduction in PM2.5 in 2015 compared with 2014 was the result of emissions reduction. Regional PM2.5 concentration in 2015 was 47% lower than 2013, while MCI, wind speed at 700 hPa and 850 hPa, height in 2015 were 11%, 12%, and 6% lower than those in 2013. Therefore, the 47% reduction in PM2.5 compared with 2013 was likely due to emissions reduction in MEC.
MEC was under the control of the strongest meridional circulation in 2016, which was one of the meteorology-clean years. However, some severe PM2.5 air pollution events still occurred at the five stations in early January. The daily regional PM2.5 concentration decreased sharply from 80.0 to 18.3 μgm−3 in the period of January 21 to 23, accompanied by increasingly strong winds and lower temperatures (Figure 9a), which suggests that this region was strongly affected by cold air. A clear decrease in temperature corresponding to strong winds has been observed at all these stations. The effect of this strong cold air led to only a small decrease in the average PM2.5 concentrations at Beijing, Xingtai, and Taiyuan stations in 2016 compared with 2015. By contrast, the PM2.5 concentrations at Jinan and Zhengzhou increased. In general, the MCI (36.8) 2016 was much higher than in 2015 (8.3). Wind speed at 700 and 850 hPa heights and the surface increased by 26%, 22%, and 13%, respectively. All these values were the highest in the time period studied here, while the PM2.5 concentration in the winter of 2016 showed a small increase from those in 2015. The change of PM2.5 concentration in 2016 cannot be explained simply by the changes of meteorological conditions, which suggests that the emission of pollutants was far higher in 2016 than in 2015. This means that, even if the meridional circulation and cold air at 500 hPa height were the strongest and the wind speeds were the highest in 2016, the high emission of pollutants led to a slight increase in PM2.5 concentration.
The synoptic situation was influenced by the zonal circulation at 500 hPa height in the winter of 2017 and the atmospheric conditions became stable again. Correspondingly, some heavy air pollution episodes occurred from January 1 to 12 (Figure 9a). The average PM2.5 concentrations in 2017 at Beijing and Xingtai stations also increased and exceeded those in 2015, but were still much lower than in 2014. Despite the poorer surface conditions at Jinan and Zhengzhou stations, with lower winds and lower RH than in 2016, the average PM2.5 concentration decreased slightly, which suggests lower anthropogenic emissions in 2017. The average PM2.5 concentration at Taiyuan in January 2017 was the highest in the study period. The daily average PM2.5 concentration even exceeded 400 μg m−3 on 1 January, 2017. However, the average RH was the lowest at Taiyuan station in 2017 and the wind speeds were similar to previous years. Compared with other stations, the large increase in PM2.5 concentration in Taiyuan may be related to differences in anthropogenic emissions and its unique topography. In addition, it is believed that the Taiyuan station was affected by severe air pollution in 2017 when related to high anthropogenic emissions. According to Table 2, the MCI wind speeds were at 700 and 850 hPa levels. The surface decreased by 65%, 7%, 17%, and 13%, respectively, in 2017 when compared to 2016, whereas the regional winter PM2.5 only increased by 16%. This suggests that the 16% increase in PM2.5 in 2017 should be entirely due to the poorer meteorological conditions rather than changes in anthropogenic emissions. Higher MCI and wind speed at 700 hPa and 850hPa levels in 2017 compared with those in 2015 suggests that meteorological conditions in 2017 were more conducive to the diffusion of pollutants. However, PM2.5 concentration in 2017 was 21% higher than in 2015. Thus, the 21% higher PM2.5 in 2017 was likely due to higher pollutant emissions in MEC rather than changes in meteorology conditions. PM2.5 concentration was lowest in 2015 and low from 2013 to 2017. The pollutant emissions were also likely the lowest from 2013 to 2017.
The regional PM2.5 concentration decreased to its lowest value (76.6 μg m−3) in 2018 (Table 2), which was another meteorology-clean year. Similar to the period 21–23 January, 2016, the PM2.5 concentration clearly decreased from 85.0 to 21.8 μg m−3 in the period of January 7–9, accompanied by strong winds and low temperatures. The average winter PM2.5 concentration at Beijing station in 2018 dropped to 39.1 μg m−3, and there were only five air pollution days in Beijing in 2018 when compared with 27 in 2013. It is believed that the air quality was greatly improved in the two cities. As another meteorology-clean year, the MCI in 2018 (27.3) was 20% lower than in 2016 (36.8) and the other meteorological factors in 2016 and 2018 were similar, although the air quality was better in 2018, with the lowest regional PM2.5 concentration (76.6 μg m−3, 20% lower than in 2016) and the minimum number of air pollution days (14 days) occurred from 2013 to 2019 (Table 2). This suggests that anthropogenic emissions in the winter of 2018 were likely 20% to 40% lower when compared to 2016.
The winter PM2.5 concentration increased again in 2019. The PM2.5 concentrations at the middle stations (including Beijing, Tianjin, Xingtai, and Tangshan) increased more significantly than in the southern stations (including Jinan and Zhengzhou) (Figure 2b). Beijing, Xingtai, and Jinan were observed to have heavy PM2.5 air pollution events, with a peak value >300 μg m−3 from 7–15 January, 2019. This may be related to the more stable atmospheric conditions and much lower wind speeds compared with those of 2018 (Figure 9a). Table 2 shows that the MCI (17.1) decreased by 20% compared with that in 2018 (36.8). Wind speeds of 700 (8.8 m·s−1) and 850 hPa (4.1 m·s−1) levels as well as the surface (2.0 m·s−1) decreased by 24%, 20%, and 20%, respectively, and all were the lowest from 2013 to 2019, whereas the winter PM2.5 concentration only increased by 20% in 2019. This suggests that the 20% increase in PM2.5 concentration in 2019 may be entirely due to poorer atmospheric conditions. Compared with the meteorological conditions in 2014, wind speeds at 700 and 850 hPa levels in 2019 were 22% and 16% lower than in 2014, respectively. The MCI and surface wind speed in 2019 were very similar to those in 2014 (17.4 and 2.1 m·s−1, respectively), whereas the PM2.5 concentration was 30% lower when compared to 2014. This suggests that the 30% decrease in PM2.5 concentration is entirely due to a reduction in the emission of pollutants in 2019.
Overall, a change in meteorological conditions may cause a 26% change in PM2.5 concentration between two meteorology-haze years and 16% to 20% changes in PM2.5 concentration between the meteorology-haze year and the meteorology-clean year, respectively. Changes in pollutant emissions may cause 21% to 47% changes in PM2.5 concentration between two meteorology-haze years. In a comparison of two meteorology-clean years, pollutant emissions in 2018 were reduced by 40% when compared with 2016. Changes in emissions had a greater influence on changing in PM2.5 than changes in meteorological conditions.

3.5. Discussion

This study is mainly focused on the contribution of the meteorological conditions to regional average PM2.5 concentration. The methods have some limitations and uncertainties. The quantitative contribution of meteorological conditions and emissions to regional PM2.5 is basically reasonable and credible, but it is not completely accurate. Other meteorological factors within this study region, which includes some thermal circulations caused by pollutants transportation [37,38,39], atmospheric chemistry [40,41], or thermal circulations [32] are also important when we consider the difference of PM2.5 concentrations on the city scale. However, these have not been studied in depth because of their small influence on regional PM2.5 concentration. Our follow-up work may involve these.
The ambient RH might be the most complex factor affecting PM2.5 concentrations [42,43,44]. The PM2.5 concentration and the RH were both highest in 2013, which suggests a possible contribution of high RH to a PM2.5 concentration. High ambient RH is very helpful to the hygroscopic growth of aerosols [12]. However, PM2.5 concentration and RH are affected by some meteorological factors at the same time. If the local wind speed is relatively low, the diffusion of pollutants and water vapor will be limited to a certain extent, which easily results in both high PM2.5 concentration and high RH. The influence mechanism of RH on different components of PM2.5 is also different [43,44,45]. It is indicated that the influence of the RH on PM2.5 concentration requires further study.

4. Conclusions

The annual changes in the trends of the winter PM2.5 concentration in Middle-Eastern China from 2013 to 2019 were analyzed by The Meridional Circulation Index (MCI), which represents the type and strength of the upper air circulation pattern (a higher MCI value indicates more favorable meteorological conditions for high PM2.5 concentrations), wind speed at 700 and 850hPa heights, and surface wind speed. RH and temperature were investigated to study the contribution of meteorology changing yearly and PM2.5 changing on the regional and city scale.
On the regional scale, the winter PM2.5 concentration in 2013 (175.2 μg m−3) was the highest from 2013 to 2019. Corresponding to this, the meteorological conditions, including the MCI and surface factors, were also the most suitable for the accumulation of aerosols and haze pollution in the winter of 2013, referred to as a meteorology-haze year. The January average synoptic situation at 500 hPa height was dominated by the distinct zonal circulation with a low MCI value (9.3), which results in weak cold air and stable atmosphere conditions. The lowest wind speed (2.0 m·s−1) and the highest ambient RH (87.7%) favored the highest PM2.5 concentrations in the winter of 2013. Similarly, 2014, 2015, 2017, and 2019 were also classified as meteorology-haze years based on similarly low MCI values. By contrast, 2016 and 2018 were classified as meteorology-clean years based on extremely high MCI values, strong cold air at 500 hPa height, and the highest surface wind speeds.
The highest PM2.5 concentrations (in descending order) occurred in 2013 (175.2 μg m−3), 2014 (130.5 μg m−3), 2017 (112.0 μg m−3), 2016 (96.5 μg m−3), 2015 (92.8 μg m−3), 2019 (91.9 μg m−3), and 2018 (76.6 μg m−3). Compared with the winter of 2013, the PM2.5 concentration decreased by 26% in 2014, 36% in 2017, 45% in 2016, 47% in 2015, 48% in 2019, and 56% in 2018. The meteorology-haze levels, which are mainly based on the MCI values, were in descending order: 2015 (8.3), 2013 (9.3), 2017 (12.9), 2019 (17.1), 2014 (17.4), 2018 (27.3), and 2016 (36.8). The average synoptic situation at 500 hPa height in the winter of 2016 was dominated by the distinct meridional circulation with the highest MCI value, which resulted in the strongest cold air and highest wind speed (2.4 m·s−1). Compared with 2016, the MCI was 77% lower in 2015, 75% lower in 2013, 65% lower in 2017, 54% lower in 2019, 53% lower in 2014, and 26% lower in 2018. It can be seen that the annual change in the PM2.5 concentration is not completely consistent with the meteorological conditions due to changes in the emission of pollutants.
The regional winter PM2.5 concentration showed a significantly decreasing trend from 2013 to 2015. The PM2.5 concentration decreased by 26% in 2014 relative to 2013. The meteorological factors in 2014 were also more conducive to the diffusion of pollutants. Considering the 87% higher MCI and both 5% higher wind speeds of 700 hPa height and the surface relative to 2014, the 26% decrease in PM2.5 concentration in 2014 may be due to better meteorological conditions. The PM2.5 concentration decreased by 29% in 2015, whereas the MCI value in 2015 was 52% lower than in 2014, which suggests that the 29% reduction in the PM2.5 concentration relative to 2014 was due to a reduction in emissions. It is worth noting that both MCI and wind speeds in 2016 were much higher than in 2015 and were the highest from 2013 to 2019, even though the PM2.5 concentration in the winter of 2016 was slightly higher than that in 2015. This suggests that the emission of pollutants in 2016 was much higher than in 2015. This means that, even if the meridional circulation and cold air at 500 hPa height was the strongest and the wind speeds were the largest in 2016, the higher emission of pollutants led to a slight increase in PM2.5 concentrations when compared to 2015. The MCI, wind speeds at 700, 850 hPa levels, and the surface decreased by 65%, 26%, 22%, and 13%, respectively, in 2017 when compared to 2016, whereas the winter PM2.5 concentration only increased by 16% in 2017. This suggests that the 16% increase in the PM2.5 concentration in 2017 may be due to worse meteorological conditions. Higher MCI and wind speed at 700 hPa and 850 hPa levels in 2017 compared with those in 2015 suggests that meteorological conditions in 2017 were more conducive to the diffusion of pollutants. However, PM2.5 concentration in 2017 was 21% higher than in 2015. Thus, the 21% higher PM2.5 in 2017 was likely due to higher pollutant emissions in MEC rather than changes in meteorology conditions. In the meteorology-clean years of 2016 and 2018, the MCI in 2018 was 20% lower than that in 2016, but the air quality was better in 2018, with the lowest PM2.5 value (20% lower than 2016) and the lowest number of air pollution days (14 days) from 2013 to 2019. This suggests that anthropogenic emissions in 2018 were probably 20% to 40% lower when compared to 2016. The MCI, wind speeds at 700, 850 hPa, the height, and the surface decreased by 37%, 24%, 20%, and 20%, respectively, in 2019 when compared to 2018, whereas the winter PM2.5 only increased by 20% in 2019. This suggests that the increase in PM2.5 in 2019 may be entirely due to worse atmospheric conditions.
Overall, a change in meteorological conditions may lead to a 26% change in PM2.5 concentration between two meteorology-haze years and 16–20% changes in PM2.5 concentration between the meteorology-haze year and the meteorology-clean year. Changes in pollutant emissions may cause 21–47% changes in PM2.5 concentration between two meteorology-haze years. In a comparison of two meteorology-clean years, pollutant emissions in 2018 may be reduced by 40% when compared with 2016. Changes in emissions had a greater influence on changing PM2.5 than meteorological conditions.

Author Contributions

Writing—original draft preparation, Z.L.; Conceptualization, H.W.; Methodology, H.W.; Data curation, X.S.; Writing—review and editing, H.W. and X.S.; Visualization, Z.L., Y.P., Y.S., H.C. and G.W.; Project administration, H.W. and H.C.; Funding acquisition, H.W. and X.S.

Funding

This research received no external funding. The National Key Research and Development Program of China (2016YFC0203300), the National Natural Scientific Foundation of China (41590874, 41790471 and 41530427), and the Strategic Priority Research Program of Chinese Academy of Sciences (XDA20100304) supported this work.

Acknowledgments

We appreciate the provision of the ERA-Interim reanalysis data from the European Center for Medium-Range Weather Forecasts (www.ecmwf.int) and data from the China Environmental Monitoring Center (www.cenmc.cn/) and the China Meteorological Administration (www.cma.gov.cn/).

Conflicts of Interest

The authors declare no conflict of interest.

References

  1. Charlson, R.J.; Lovelock, J.E.; Andreae, M.O.; Warren, S.G. Oceanic phytoplankton, atmospheric sulfur, cloud albedo and climate. Nature 1987, 326, 655–661. [Google Scholar] [CrossRef]
  2. Pope, C.A., III; Dockery, D.W. Health effects of fine particulate air pollution: Lines that connect. J. Air Waste Manag. Assoc. 2006, 56, 709–742. [Google Scholar] [CrossRef] [PubMed]
  3. Shang, Y.; Sun, Z.; Cao, J.; Wang, X.; Zhong, L.; Bi, X. Systematic review of Chinese studies of short-term exposure to air pollution and daily mortality. Environ. Int. 2013, 54, 100–111. [Google Scholar] [CrossRef] [PubMed]
  4. Song, C.; He, J.; Wu, L.; Jin, T.; Chen, X.; Li, R. Health burden attributable to ambient PM2.5 in china. Environ. Pollut. 2017, 223, 575–586. [Google Scholar] [CrossRef] [PubMed]
  5. Liu, M.; Bi, J.; Ma, Z. Visibility-based PM2.5 concentrations in china: 1957–1964 and 1973–2014. Environ. Sci. Technol. 2017, 51, 13161–13169. [Google Scholar]
  6. Wu, P.; Ding, Y.; Liu, Y. Atmospheric circulation and dynamic mechanism for persistent haze events in the beijing–tianjin–hebei region. Adv. Atmos. Sci. 2017, 34, 429–440. [Google Scholar] [CrossRef]
  7. Han, R.; Wang, S.; Shen, W.; Wang, J.; Wu, K.; Ren, Z. Spatial and temporal variation of haze in china from 1961 to 2012. J. Environ. Sci. 2016, 28, 134–146. [Google Scholar] [CrossRef] [PubMed]
  8. Wang, Y.Q.; Zhang, X.Y.; Sun, J.Y.; Zhang, X.C.; Che, H.Z.; Li, Y. Spatial and temporal variations of the concentrations of PM10, PM2.5 and PM1 china. Atmos. Chem. Phys. 2015, 15, 13585–13598. [Google Scholar] [CrossRef]
  9. He, K.; Yang, F.; Ma, Y.; Zhang, Q.; Yao, X.; Chan, C.K. The characteristics of PM2.5 in Beijing, China. Atmos. Environ. 2001, 35, 4959–4970. [Google Scholar] [CrossRef]
  10. Meng, Z.Y.; Jiang, X.M.; Yan, P.; Lin, W.L.; Zhang, H.D.; Wang, Y. Characteristics and sources of PM2.5 and carbonaceous species during winter in Taiyuan, China. Atmos. Environ. 2007, 41, 6901–6908. [Google Scholar] [CrossRef]
  11. Han, S.Q.; Bian, H.; Tie, X.; Xie, Y.; Sun, M.; Liu, A. Impact measurements of nocturnal planetary boundary layer on urban airpollutants: From a 250-m tower over Tianjin, China. J. Hazard. Mater. 2009, 162, 264–269. [Google Scholar] [CrossRef]
  12. Fu, G.Q.; Xu, W.Y.; Yang, R.F.; Li, J.B.; Zhao, C.S. The distribution and trends of fog and haze in the North China Plain over the past 30 years. Atmos. Chem. Phys. 2014, 14, 11949–11958. [Google Scholar] [CrossRef] [Green Version]
  13. Ma, Z.; Hu, X.; Sayer, A.M.; Levy, R.; Zhang, Q.; Xue, Y. Satellite-based spatiotemporal trends in PM2.5 concentrations: China, 2004–2013. Environ. Health Perspect. 2016, 124, 184–192. [Google Scholar] [CrossRef] [PubMed]
  14. Zhao, P.; Zhang, X.; Xu, X.; Zhao, X. Long-term visibility rends and characteristics in the region of Beijing, Tianjin, and Hebei, China. Atmos. Res. 2011, 101, 711–718. [Google Scholar] [CrossRef]
  15. Zheng, M.; Salmon, L.G.; Schauer, J.J.; Zeng, L.; Kiang, C.S.; Zhang, Y. Seasonal trends in PM2.5 source contributions in Beijing, China. Atmos. Environ. 2005, 39, 3967–3976. [Google Scholar] [CrossRef]
  16. Dan, M.; Zhuang, G.; Li, X.; Tao, H.; Zhuang, Y. The characteristics of carbonaceous species and their sources in PM2.5 in Beijing. Atmos. Environ. 2004, 38, 3443–3452. [Google Scholar] [CrossRef]
  17. Zhao, X.; Zhang, X.; Xu, X.; Xu, J.; Meng, W.; Pu, W. Seasonal and diurnal variations of ambient PM2.5 concentration in urban and rural environments in Beijing. Atmos. Environ. 2009, 43, 2893–2900. [Google Scholar] [CrossRef]
  18. Quan, J.; Zhang, Q.; He, H.; Liu, J.; Huang, M.; Jin, H. Analysis of the formation of fog and haze in North China Plain (NCP). Atmos. Chem. Phys. 2011, 11, 8205–8214. [Google Scholar] [CrossRef] [Green Version]
  19. Han, B.; Zhang, R.; Yang, W.; Bai, Z.; Ma, Z.; Zhang, W. Heavy air pollution episodes in Beijing during January 2013: Inorganic ion chemistry and source analysis using highly time-resolved measurements in an urban site. Atmos. Chem. Phys. Discuss. 2015, 15, 11111–11141. [Google Scholar] [CrossRef]
  20. Wang, H.; Xu, J.; Zhang, M.; Yang, Y.; Shen, X.; Wang, Y. A study of the meteorological causes of a prolonged and severe haze episode in January 2013 over central-eastern China. Atmos. Environ. 2014, 98, 146–157. [Google Scholar] [CrossRef]
  21. Renhe, Z.; Li, Q.; Zhang, R.N. Meteorological conditions for the persistent severe fog and haze event over eastern China in January 2013. Sci. China Earth Sci. 2014, 57, 26–35. [Google Scholar] [CrossRef]
  22. Wang, L.T.; Wei, Z.; Yang, J.; Zhang, Y.; Zhang, F.F.; Su, J. The 2013 severe haze over southern Hebei, China: Model evaluation, source apportionment, and policy implications. Atmos. Chem. Phys. 2014, 14, 3151–3173. [Google Scholar] [CrossRef]
  23. Zhenbo, W.; Chuanglin, F.; Guang, X.U.; Yuepeng, P. Spatial-temporal characteristics of the PM2.5 China in 2014. Acta Geogr. Sin. 2015, 70, 1720–1734. [Google Scholar]
  24. Junming, L.; Xiulan, H.; Xiao, L.; Jianping, Y.; Xuejiao, L. Spatiotemporal patterns of ground monitored pm2.5 concentrations in china in recent years. Int. J. Environ. Res. Public Health 2018, 15, 114–122. [Google Scholar]
  25. Li, J.D.; Liao, H.; Hu, J.L.; Li, N. Severe particulate pollution days in China during 2013-2018 and the associated typical weather patterns in Beijing-Tianjin-Hebei and the Yangtze River Delta regions. Environ. Pollut. 2019, 248, 74–81. [Google Scholar] [CrossRef] [PubMed]
  26. Jacobson, M.Z. Strong radiative heating due to the mixing state of black carbon in atmospheric aerosols. Nature 2001, 409, 695–697. [Google Scholar] [CrossRef] [PubMed]
  27. Zhao, X.; Zhang, X.; Pu, W.; Meng, W.; Xu, X. Scattering properties of the atmospheric aerosol in Beijing, China. Atmos. Res. 2011, 101, 799–808. [Google Scholar] [CrossRef]
  28. Chen, H.; Wang, H. Haze Days in North China and the associated atmospheric circulations based on daily visibility data from 1960 to 2012. J. Geophys. Res. Atmos. 2015, 120, 5895–5909. [Google Scholar] [CrossRef]
  29. Ding, Y.H.; Liu, Y.J. Analysis of long-term variations of fog and haze in China in recent 50 years and their relations with atmospheric humidity. Sci. China Earth Sci. 2014, 57, 36–46. [Google Scholar] [CrossRef]
  30. Xiao, Q.; Ma, Z.; Li, S.; Liu, Y. The impact of winter heating on air pollution in China. PLoS ONE 2015, 10, e0117311. [Google Scholar] [CrossRef] [PubMed]
  31. Zhao, X.J.; Zhao, P.S.; Xu, J.; Meng, W.; Pu, W.W.; Dong, F.; He, D.; Shi, Q.F. Analysis of a winter regional haze event and its formation mechanism in the North China Plain. Atmos. Chem. Phys. 2013, 13, 5685–5696. [Google Scholar] [CrossRef] [Green Version]
  32. Wang, H.; Jianghao, L.; Yue, P.; Meng, Z.; Huizheng, C.; Xiaoye, Z. The impacts of the meteorology features on pm2.5 levels during a severe haze episode in central-east china. Atmos. Environ. 2019, 197, 177–189. [Google Scholar] [CrossRef]
  33. Zhang, X.Y.; XU, X.D.; Ding, Y.H.; Liu, Y.J.; Zhang, H.D.; Wang, Y.Q.; Zhong, J.T. Impact of the Air Pollution Prevention and Control Action Plan on air quality improvement in China. Sci. China Earth Sci. 2019, 1–18. [Google Scholar] [CrossRef]
  34. Zhai, S.; Jacob, D.J.; Wang, X.; Shen, L.; Li, K.; Zhang, Y.; Gui, K.; Zhao, T.; Liao, H. Fine particulate matter PM2.5 trends in China, 2013–2018: Contributions from meteorology. Atmos. Chem. Phys. 2019, 19, 11031–11041. [Google Scholar] [CrossRef]
  35. China Environmental Monitoring Center. Available online: http://www.cnemc.cn/sssj (accessed on 1 February 2019).
  36. European Center for Medium-Range Weather Forecasts. Available online: https://www.ecmwf.int/en/forecasts/datasets/reanalysis-datasets/era-interim (accessed on 31 April 2019).
  37. Yu, Z.; Huizheng, C.; Tianliang, Z.; Xiangao, X.; Ke, G.; Linchang, A. Aerosol optical properties over beijing during the world athletics championships and victory day military parade in august and September 2015. Atmosphere 2016, 7, 47. [Google Scholar]
  38. Ke, G.; Huizheng, C.; Quanliang, C.; Linchang, A.; Zhaoliang, Z.; Zengyuan, G. Aerosol optical properties based on ground and satellite retrievals during a serious haze episode in December 2015 over Beijing. Atmosphere 2016, 7, 70. [Google Scholar]
  39. Tianze, S.; Huizheng, C.; Bing, Q.; Yaqiang, W.; Yunsheng, D.; Xiangao, X. Aerosol optical characteristics and their vertical distributions under enhanced haze pollution events: Effect of the regional transport of different aerosol types over eastern China. Atmos. Chem. Phys. 2017, 18, 2949–2971. [Google Scholar]
  40. Sasaki, K.; Sakamoto, K. Vertical differences in the composition of pm10 and pm2.5 in the urban atmosphere of Osaka, Japan. Atmos. Environ. 2005, 39, 7240–7250. [Google Scholar] [CrossRef]
  41. Hu, W.; Hu, M.; Hu, W.; Jimenez, J.L.; Yuan, B.; Chen, W. Chemical composition, sources, and aging process of submicron aerosols in Beijing: Contrast between summer and winter. J. Geophys. Res. Atmos. 2016, 121, 1955–1977. [Google Scholar] [CrossRef]
  42. Fu, X.; Wang, X.; Hu, Q.; Li, G.; Ding, X.; Zhang, Y. Changes in visibility with pm2.5 composition and relative humidity at a background site in the pearl river delta region. J. Environ. Sci. 2016, 40, 10–19. [Google Scholar] [CrossRef]
  43. Yang, Y.H.; Qu, Q.; Liu, S.X.; Li, X.; Zhong, P.Y.; Tau, J. Chemical compositions in pm_(2.5) and its impact on visibility in summer in pearl river delta, China. Environ. Sci. 2015, 36, 2758–2767. [Google Scholar]
  44. Lin, Z.J.; Tao, J.; Chai, F.H.; Fan, S.J.; Yue, J.H.; Zhu, L.H. Impact of relative humidity and particles number size distribution on aerosol light extinction in the urban area of Guangzhou. Atmos. Chem. Phys. 2013, 13, 1115–1128. [Google Scholar] [CrossRef] [Green Version]
  45. Liu, X.; Cheng, Y.; Zhang, Y.; Jung, J.; Sugimoto, N.; Chang, S.Y. Influences of relative humidity and particle chemical composition on aerosol scattering properties during the 2006 prd campaign. Atmos. Environ. 2008, 42, 1525–1536. [Google Scholar] [CrossRef]
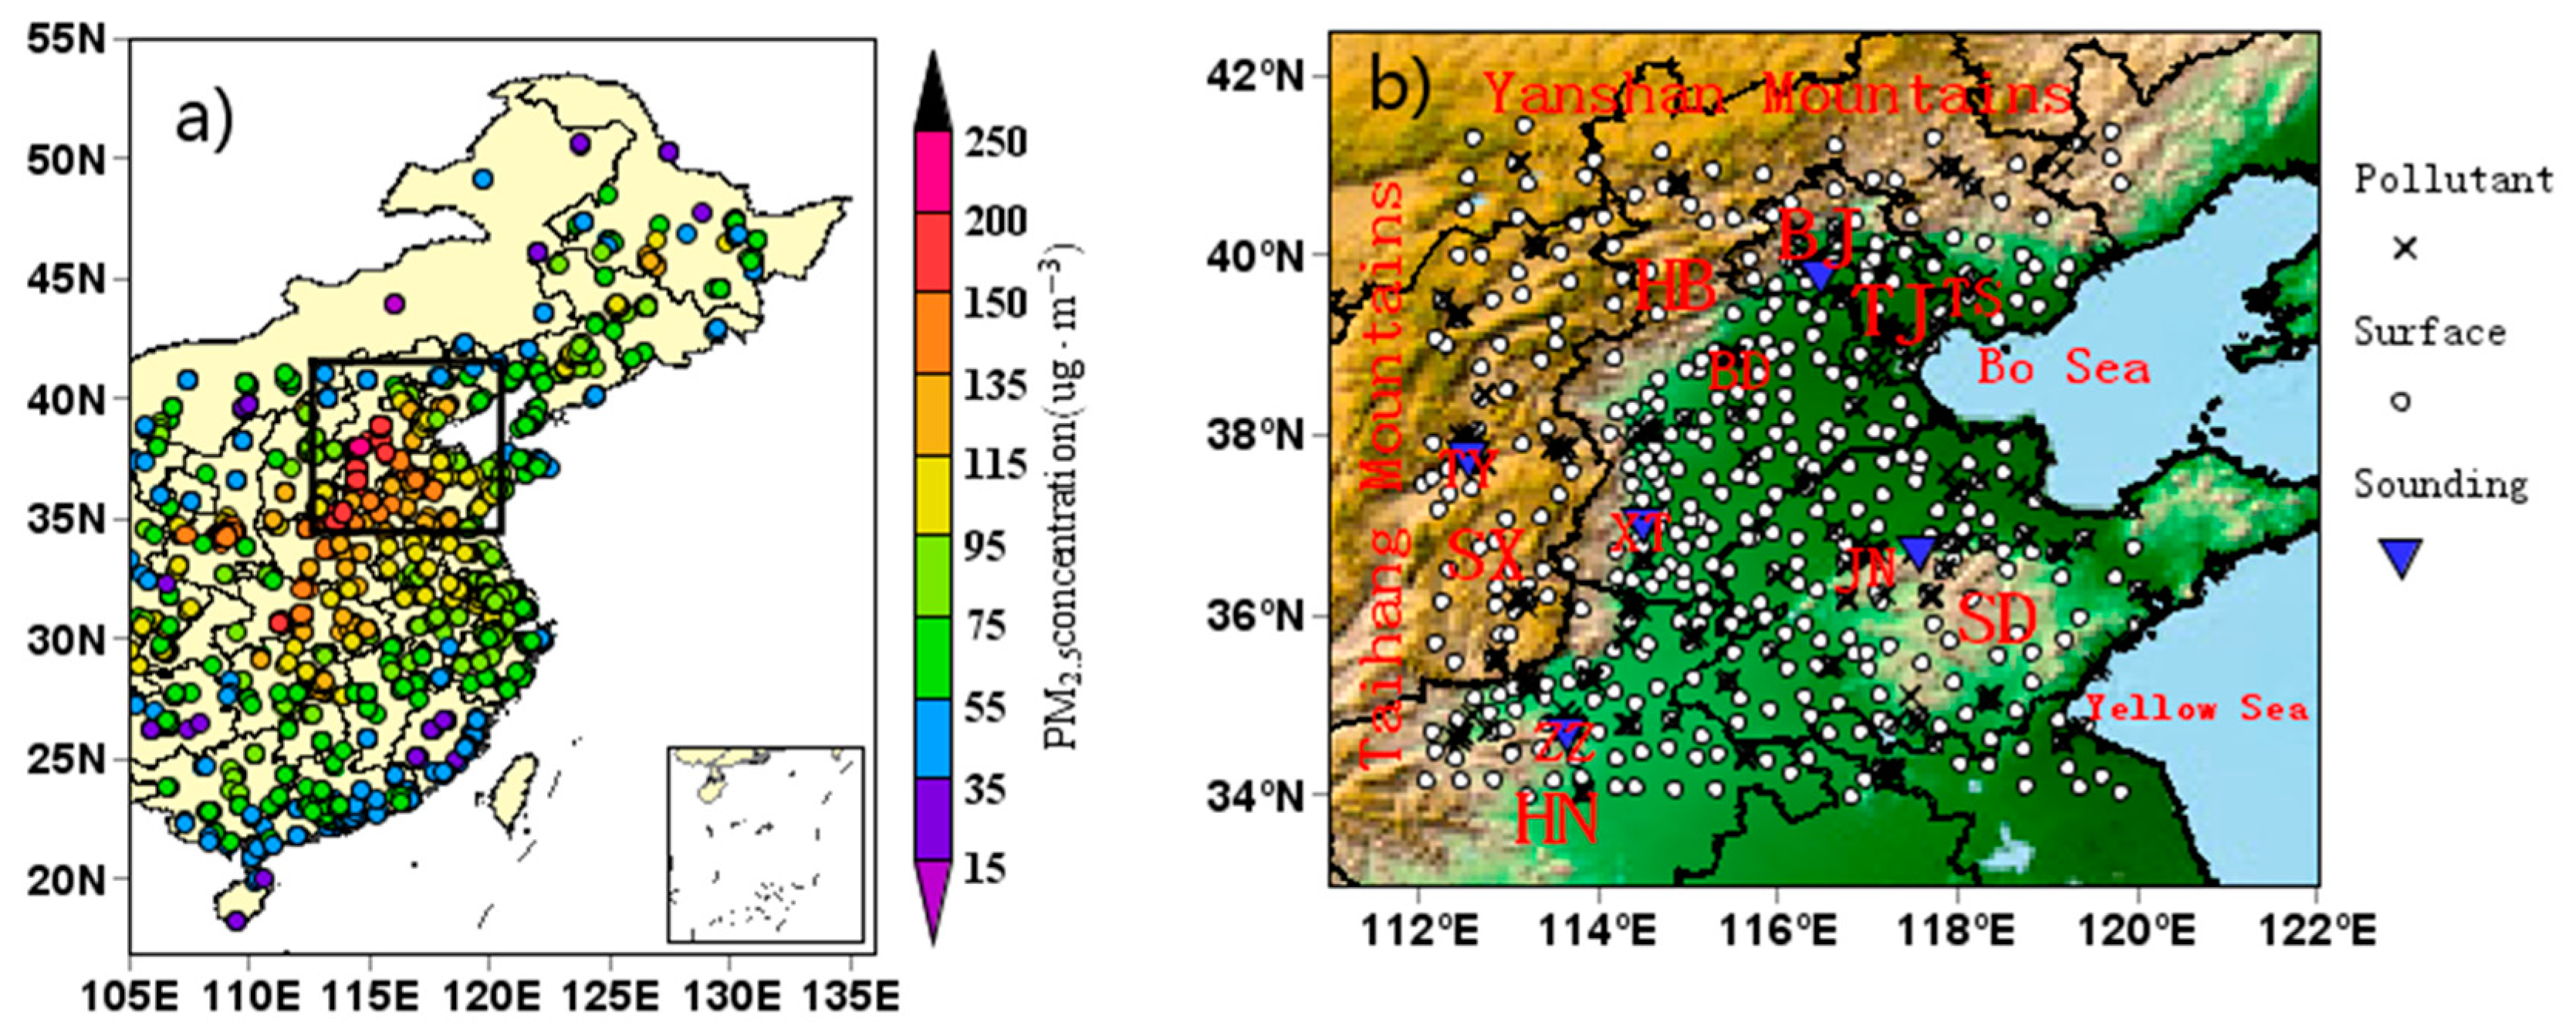
Figure 1. (a) Average PM2.5 concentrations (μg m−3) in January from 2013 to 2019 at the 1324 meteorological stations in Middle-eastern China. The black box represents the MEC region. (b) A topographic map of Middle-eastern China showing the location of ground-based observation sites (black circles), pollutant sites (pink circles), and sounding sites (blue circles). The location of the province including Beijing (BJ), Tianjin (TJ), Hebei (HB), Shanxi (SX), Henan (HN), and Shandong (SD) as well as some stations including Beijing(BJ), Tianjin (TJ), Xingtai (XT), Tangshan (TS), Baoding (BD), Taiyuan (TY), Jinan (JN), and Zhengzhou (ZZ) have been shown.
Atmosphere 10 00563 g001
Figure 2. (a) Regional average PM2.5 concentrations (red bars, μg m−3), number of pollution days (blue bars, days), and heavy pollution days (brown bars, days) as well as (b) average PM2.5 concentrations at the stations of Beijing (BJ), Tianjin (TJ), Xingtai (XT), Tangshan (TS), Baoding (BD), Taiyuan (TY), Jinan (JN), and Zhengzhou (ZZ) in January from 2013 to 2019. The irregular changes of PM2.5 concentration are framed in the black box.
Atmosphere 10 00563 g002
Figure 3. (a) Average geopotential height (solid lines, dagpm) and temperature (dashed lines, K) fields in January 2013 at 500 hPa height. (b) Average geopotential height (lines, dagpm), temperature (shading, K), and wind (arrows, m/s) fields in January 2013 at 850 hPa height. (c) Average sea-level pressure (lines, hPa) and temperature (shading, K) fields at the surface in January 2013. The brown box represents the MEC region. (d) Average wind speed (shading, m·s−1) and RH (lines, %) fields in MEC on the surface during 29 pollution days in January 2013.
Atmosphere 10 00563 g003
Figure 4. (a) January average geopotential height (solid lines, dagpm) and temperature (dashed lines, K) field at 500 h Pa height in (1) 2014, (2) 2015, (3) 2016, (4) 2017, (5) 2018, and (6) 2019 and (b) their differences compared with these fields in 2013. The brown boxes represent the MEC region. The blue boxes represent the meridional circulation regions. The red boxes represent the high-level air temperature affected region.
Atmosphere 10 00563 g004
Figure 5. January average geopotential height (lines, dagpm), temperature (shading, K), and wind (arrows, m/s) fields at 850 hPa height in (a) 2014, (b) 2015, (c) 2016, (d) 2017, (e) 2018, and (f) 2019. The brown box represents the MEC region. The red boxes represent the low-temperature region.
Atmosphere 10 00563 g005
Figure 6. (a) Meridional circulation index at 500 hPa (red bars) and 400 hPa (blue bars) levels in January from 2013 to 2019 and (b) their differences compared with 2016.
Atmosphere 10 00563 g006
Figure 7. (a) High-air temperature (HAT, K) at 500 hPa (red bars) and 400 hPa (blue bars) levels in January from 2013 to 2019 and (b) their differences compared with 2013.
Atmosphere 10 00563 g007
Figure 8. Average RH at 8:00 h of local time (lines, %) and wind speed field (shading, m·s−1) on air pollution days in (a1) 2014, (a2) 2015, (a3) 2016, (a4) 2017, (a5) 2018 and (a6) 2019 and their differences in (b1) 2014, (b2) 2015, (b3) 2016, (b4) 2017, (b5) 2018, and (b6) 2019 compared with conditions in 2013.
Atmosphere 10 00563 g008
Figure 9. Time series of daily average PM2.5 concentrations, relative humidity, temperature, wind speed on the surface, and wind speed in the boundary layer in (a) MEC, (b) Beijing (BJ), (c) Xingtai (XT), (d) Jinan (JN), (e) Taiyuan (TY), and (f) Zhengzhou (ZZ) from 2013 to 2019. The two years with the lowest average PM2.5 concentration of these stations are framed in the black boxes.
Atmosphere 10 00563 g009
Table 1. National ambient air quality standard (NAAQS) PM2.5 values.
Air Quality GradeAverage Concentration of 24 h PM2.5 (μg·m−3)
Excellent0–35
Good35–75
Light pollution75–115
Moderate pollution115–150
Heavy pollution150–250
Hazardous pollution>250
Table 2. January average PM2.5 concentrations, number of air pollution days, MCI, high-air temperature, wind speeds at 700 and 850 hPa heights, surface RH, and wind speeds from 2013 to 2019. The percentage variations in PM2.5 concentrations, air pollution days, and surface RH values compared with 2013 and the percentage variations of MCI and wind speeds compared with 2016 are given in parentheses.
YearPM2.5 (μg·m−3)Air Pollution DaysMCIHigh-Level Air Temp.Wind at 700 hPa (m·s−1)Wind at 850 hPa (m·s−1)Surface Wind (m·s−1)Surface RH (%)
2013175.2 (100%)29 (100%)9.3 (−75%)241.110.8 (−10%) 4.9 (−23%) 2.0 (−20%)87.7 (100%)
2014130.5 (−26%)26 (−10%)17.4 (−53%)241.311.3 (−6%)4.9 (−13%)2.1 (−13%)80.5 (−8%)
201592.8 (−47%)22 (−24%)8.3 (−77%)243.29.5 (−21%)4.6 (−18%)2.1 (−13%)81.7 (−7%)
201696.5 (−45%)20 (−31%)36.8 (100%)239.112.0 (100%)5.6 (100%)2.4 (100%)81.4 (−7%)
2017112.0 (−36%)22 (−24%)12.9 (−65%)241.511.1 (−8%)4.6 (−18%)2.1 (−13%)85.6 (+2%)
201876.6 (−56%)14 (−52%)27.3 (−26%)238.611.7 (−3%)5.2 (−7%)2.4 (100%)80.0 (−9%)
201991.9 (−48%)17 (−41%)17.1 (−54%)242.08.8 (−27%)4.1 (−27%)2.0 (−20%)78.2 (−11%)