Article

Variability and Mechanisms of Megadroughts over Eastern China during the Last Millennium: A Model Study

1
Key Laboratory of Virtual Geographic Environment, Ministry of Education, State Key Laboratory of Geographical Environment Evolution, Jiangsu Provincial Cultivation Base, School of Geographical Science, Nanjing Normal University, Nanjing 210023, China
2
Jiangsu Center for Collaborative Innovation in Geographical Information Resource Development and Application, Nanjing 210023, China
3
Department of Geosciences, Climate System Research Center, University of Massachusetts, Amherst, MA 01003, USA
4
Department of Atmospheric Sciences, International Pacific Research Center, University of Hawaii at Manoa, Honolulu, HI 96825, USA
5
Earth System Modeling Center, Nanjing University of Information Science and Technology, Nanjing 210044, China
*
Author to whom correspondence should be addressed.
Atmosphere 2019, 10(1), 7; https://doi.org/10.3390/atmos10010007
Submission received: 21 November 2018 / Revised: 23 December 2018 / Accepted: 25 December 2018 / Published: 28 December 2018

Abstract

:
The variability and mechanisms of multi-decadal megadroughts over eastern China during the last millennium were investigated using a control, full-forcing, and four sensitivity experiments from the Community Earth System Model (CESM) Last Millennium Ensemble (LME) archive. The model simulated megadroughts have comparable magnitudes and durations with those derived from reconstructed proxy data, although the megadroughts are not temporally synchronous. In all experiments, the megadroughts exhibit similar spatial structures, corresponding to a weakening of the East Asia summer monsoon (EASM) and a strengthening of the East Asia winter monsoon (EAWM). The results show that internal climate variability within the coupled climate system plays an essential role in triggering megadroughts, while different external forcings may contribute to persistence and modify the anomaly patterns of megadroughts. A pattern of meridional tripolar (warm-cold-warm) sea surface temperature (SST) anomalies in the western Pacific stretching from the equator to high latitude is responsible for the EASM weakening and EAWM strengthening. The weakening of the EASM and strengthening of the EAWM are essentially caused by negative SST anomalies over the northwestern Pacific and positive SST anomalies over the equatorial western Pacific, which are associated with a La Niña-like SST gradient across the tropical Pacific. The external forcings prolong the megadroughts through maintenance of the meridional tripolar SST anomalies and enlarge the megadrought spatial extent by magnifying the meridional tripolar SST anomalies.

1. Introduction

Drought is one of the most severe natural disasters to impact society and the economy. Observations have shown that the frequency and intensity of droughts has increased in many regions since 1950 [1]. Among different drought definitions, a megadrought is usually defined as a persistent period of drought conditions that lasts longer than a decade and up to centuries. Megadroughts have attracted more attention recently because they can have much more severe societal impacts than short-term droughts [2,3,4].
To improve the accuracy of future megadrought projections, it is critical to advance our understanding of the mechanisms influencing the occurrences and magnitudes of megadroughts on different time scales. Although there are progresses on megadrought studies, the underlying mechanisms of megadrought remain unclear [4]. Internal atmospheric variability is usually considered a major triggering mechanism for megadroughts [5,6]. Many other mechanisms, such as solar radiation and volcanic activity [7], internal climate variability [8,9,10], sea surface temperature (SST) anomalies [11,12,13], and human land degradation [14] have been hypothesized as potential causes of megadroughts.
Previous studies have shown that many prominent, large-scale circulation modes, such as the North Atlantic Oscillation (NAO) [15,16], Pacific Decadal Oscillation (PDO) [17] and El Niño–Southern Oscillation (ENSO) [18] have strong influences on the mean climate and climate extreme events over different regions [19,20,21]. These large-scale circulation modes also have significant influences on regional megadroughts [4]. For example, Cook et al. [22] found that the development of La Niña-like SSTs in the eastern tropical Pacific region is conducive to drought occurrence over North America. Herweijetr and Seager [8] suggested that the global pattern of persistent drought appears to be a low-frequency version of interannual ENSO-forced variability. Strong La Niña events that occurred during 1946–1956 contributed to the droughts over the southwestern U.S. [9]. Cook et al. [23] also found that the occurrence, severity, and fingerprint of several Asian megadroughts have close linkages to both PDO and ENSO.
Eastern China has a large human population and rapid societal and economic development, so eastern China is sensitive to the impacts brought by the megadroughts. The megadroughts severely impacted society across Chinese history; for example, the Ming Dynasty drought in 1634–1644 is one of the most severe sustained droughts that contributed to the collapse of the Ming Dynasty [23,24]. During recent decades, eastern China has experienced significant increasing trends in extreme climate events, including droughts and extreme precipitation [10,25,26,27,28,29]. Consequently, eastern China is uniquely challenged to understand, adapt to and mitigate the effects of extreme climate events.
Previous studies have shown that many modes of large-scale internal climate variability, such as the South Asian High, have impacts on the occurrences and magnitudes of extreme climate events over eastern China [30,31]. Yang et al. [10] found that the combined effects of PDO and AMO have strong decadal modulation of droughts over eastern China. Li and Wang [32] found that decadal variations in the East Asia summer monsoon (EASM) land precipitation are primarily linked to cooling over the central eastern tropical Pacific (CEP) and warming over the extratropical North Pacific and western tropical Pacific (NWP). The numerical experiments conducted by Li and Wang [32] suggest that both the forcings from the CEP and the atmosphere–ocean interaction in the NWP control the decadal variations in EASM land precipitation.
For the mechanisms behind megadroughts over eastern China, circulation anomalies, e.g., Western Pacific subtropical high (WPSH) and Eastern Asia summer monsoon (EASM), are the direct causes of megadroughts, while external forcing, e.g., solar radiation and volcanic eruptions, may influence the regional climate by changing large-scale circulation patterns [33,34,35,36]. For example, Shen et al. [37] found that several exceptional droughts over eastern China during the last 500 years may have been triggered by large volcanic eruptions and amplified by both volcanic eruptions and El Niño events. Through model simulations, Peng et al. [38] indicated that solar activity may be the primary driver in the occurrence of several persistent droughts over eastern China, and the influences occurred through EASM weakening.
A major difficulty in study of regional megadroughts is that observations are not long enough to examine megadrought variability because megadroughts are rare in instrumental data based on their definitions. Proxy-based reconstructions [23,24,39], GCM simulations [12,38], and regional climate model simulations [40] can provide a larger sample size of megadroughts and can be used to identify the factors triggering and maintaining megadroughts.
However, megadroughts simulated in the GCM are not temporally synchronous with those in the paleoclimate record [41]. There are also significant differences between the drought features simulated in both forced and control runs [42]. These differences suggest that model simulated megadroughts can result from modeled internal climate variability, rather than as only a response to changes in exogenous forcings [5,41]. Although GCMs have been used to reproduce the major characteristics of droughts, it is still unclear how external forcing and internal climate variability contribute to the frequencies, durations, and magnitudes of droughts on different time scales [4,42].
In this study, millennium-long simulations from the Community Earth System Model (CESM) Last Millennium Ensemble (LME) Project generated by the CESM Paleoclimate Working Group at the National Center for Atmospheric Research [43] are used to investigate the variability and dynamics of megadroughts over eastern China. In addition to assessing the CESM-LME performance in reproducing the frequency, duration, and severity of historical megadroughts over eastern China during the last millennium, another important scientific question addressed in the study is how external forcings contribute to the variations in megadroughts. These analyses will be helpful for improving the understanding of the mechanisms triggering and maintaining megadroughts over eastern China and will also be helpful for generating reliable estimates for future megadroughts. The projections of future megadroughts will provide useful insights to a wide range of decision makers interested in the influences of regional climate change on water supply, agriculture, environment, and ecosystems, as well as the corresponding adaption and mitigation efforts [21,22].

2. Data and Methodology

2.1. Reconstructed and Model Data

In this study, the time series of the reconstructed dry–wet index averaged over eastern China (25° N–40° N, 105° E–122° E) during the period of 850–1850 were used to estimate the observed variations in historical megadrought events. This data was reconstructed based on Chinese historical documents and instrument measurements [24]. This data is published as 10-year running mean. Thus, to be consistent with the reconstruction data, eastern China is selected as the study area in the CESM (25° N–40° N, 105° E–122° E), which is a typical monsoon region with a rainy season mainly extending from May to October [44]. The monsoon precipitation accounts for about 70% of annual total precipitation (Figure S1). The gridded reconstructed Palmer Drought Severity Index (PDSI) data [23] were also used to show the spatial patterns of megadroughts.
The simulations from the CESM-LME archive have a ~2 degree resolution for atmosphere and land components and ~1 degree resolution in ocean and sea ice components [43]. The ensemble used in this study includes one control experiment (CTRL), 13 all forcing experiments (ALL), 3 greenhouse gas emission sensitivity experiments (GHGs), 3 land use and land cover sensitivity experiments (LULC), 4 spectral solar irradiance sensitivity experiments (SSI), and 5 volcanic eruption sensitivity experiments (VOLC) using the transient evolution of reconstructions as the external forcing extending from 850 to 1850.
The simulated monthly mean SSTs are used to represent the atmospheric lower boundary thermal anomalies that impact the large-scale circulation, but the SST anomalies can be induced either by the external forcing or by the internal climate variability. The simulated monthly geopotential heights, u and v component winds, relative humidity, specific humidity, and sea level pressure (SLP) are used to examine the changes in large-scale synoptic circulation that directly influence the variation of megadroughts. All the model output has been regridded to a common 2° × 2° resolution before calculation.

2.2. Definition of Megadrought

There are many different definitions of megadrought, some definitions based on precipitation deficits, other definitions based on soil moisture deficits, and so on [12]. Because the reconstructed data used in this study are precipitation, we chose the definition of megadrought based on sustained precipitation deficits. Therefore, in this study, the regional area-averaged precipitation anomalies are first 10-year running averaged to be consistent with the reconstruction data [24], and then a megadrought is defined as a period with the precipitation anomalies less than zero for at least 20 consecutive years. This type of definition based on duration threshold was widely used in previous studies [12,38].
To illustrate the characteristics of megadroughts, the duration of a megadrought is defined as the number of years with anomalies below zero, and the magnitude of a megadrought is defined as the mean standardized annual precipitation anomalies (precipitation is standardized by dividing by the standard deviation of the time series calculated over the full time period of 815–1850) and mean absolute annual precipitation anomalies for the entire duration.

3. Results

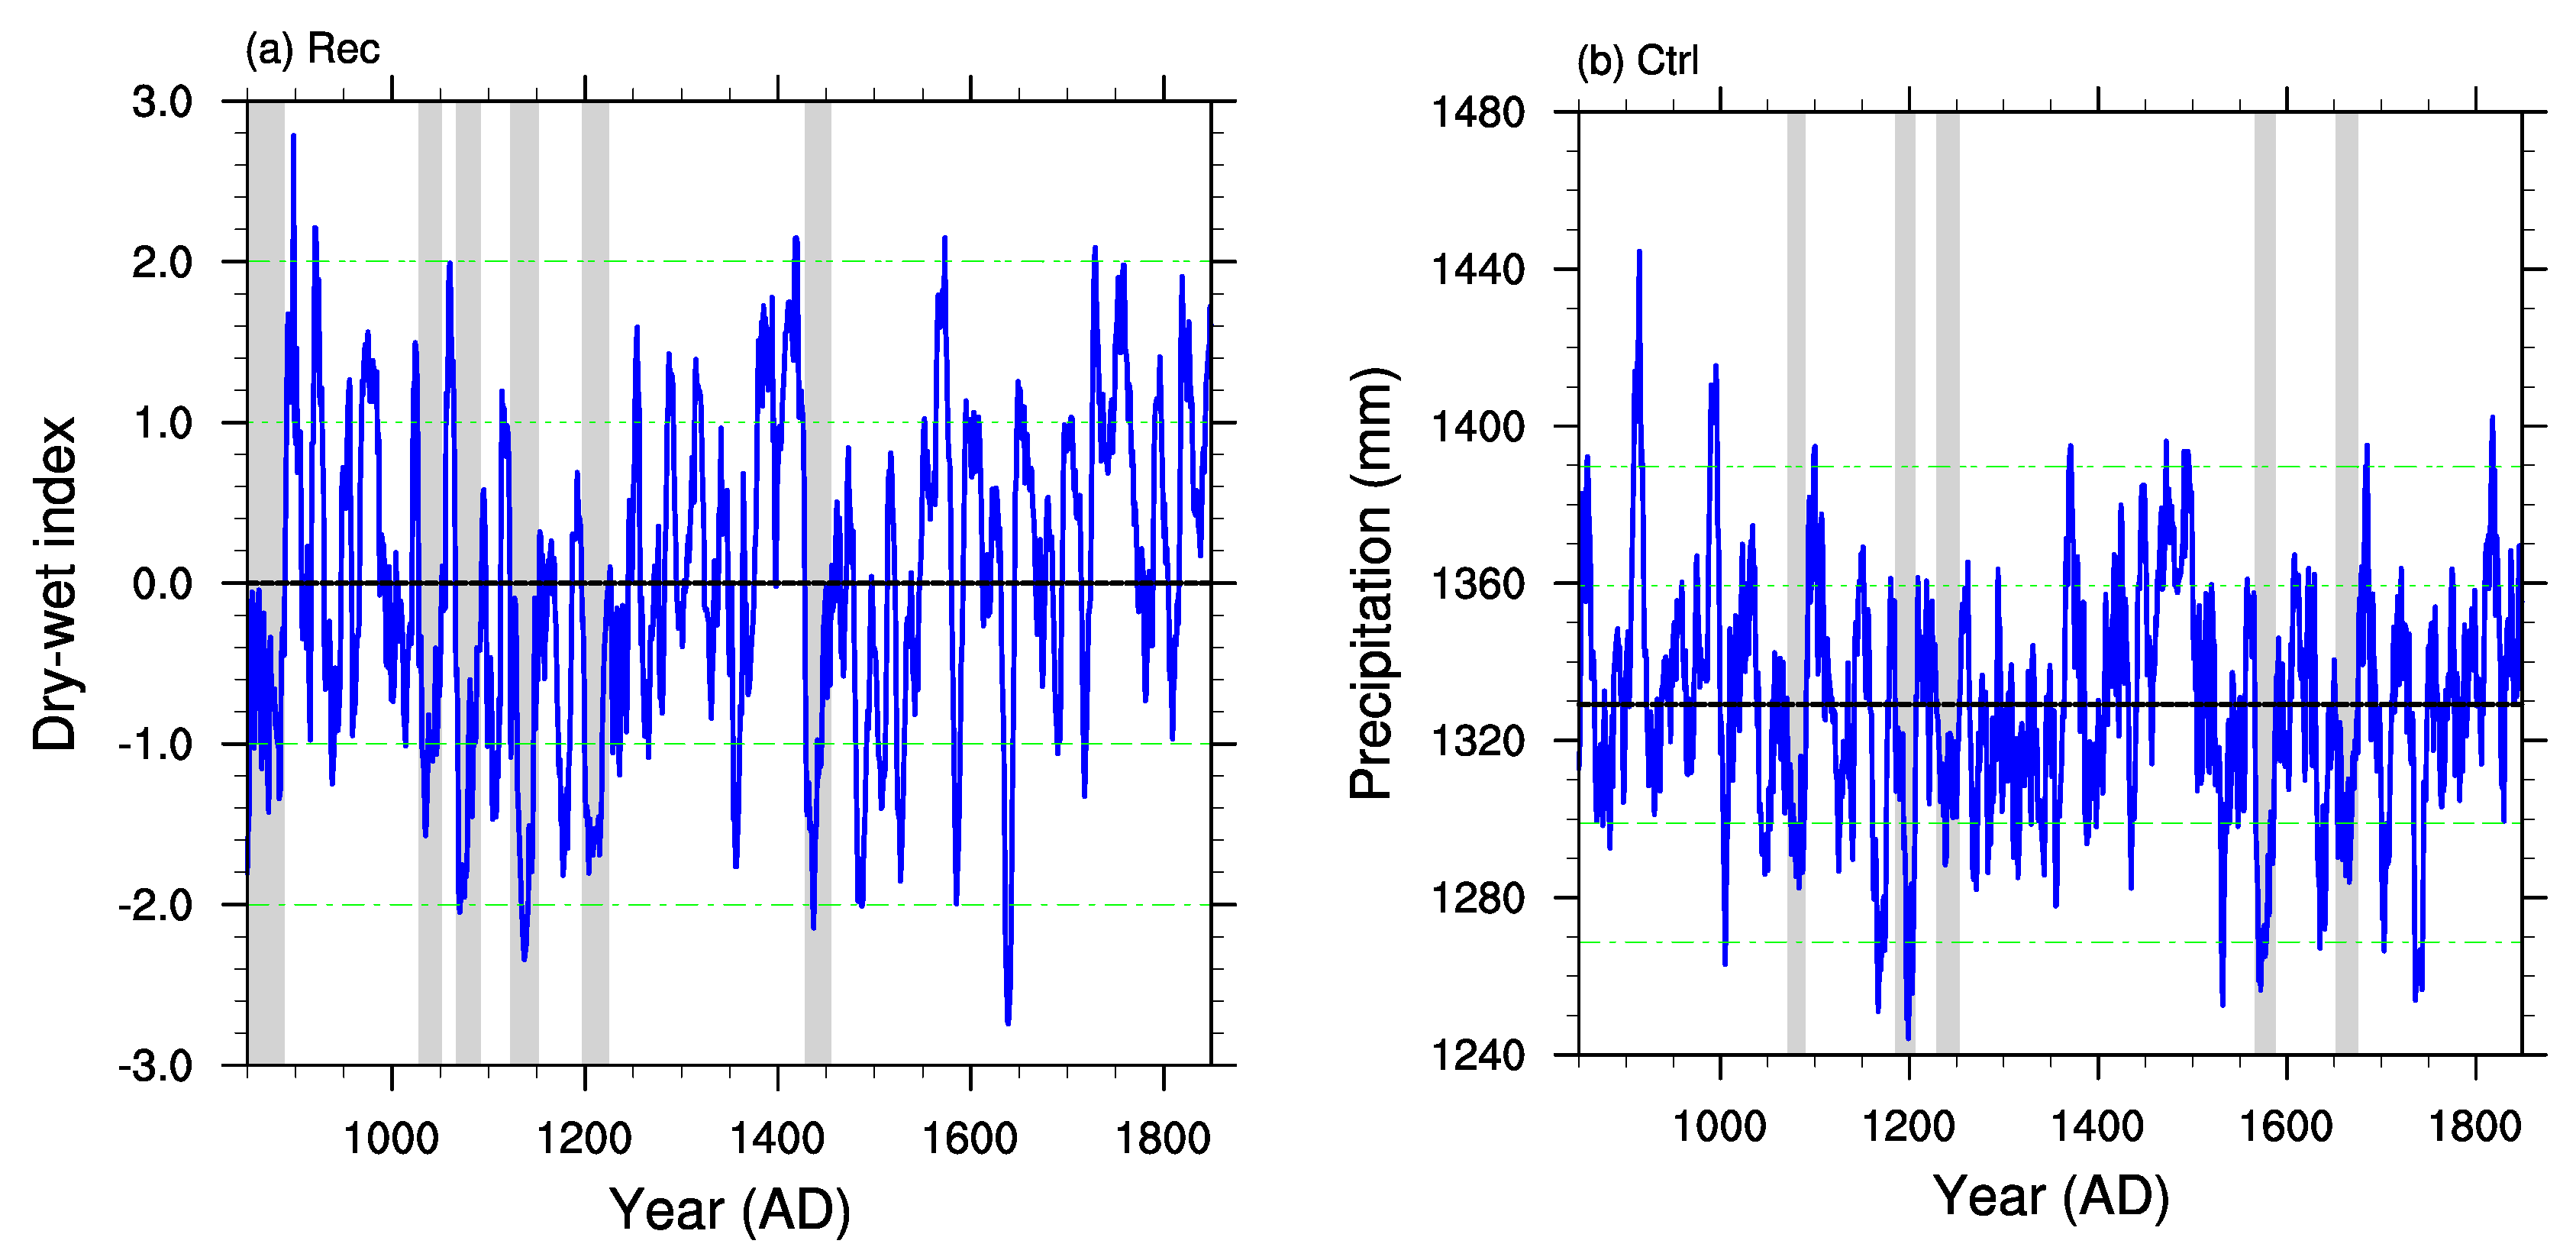
3.1. Simulated Megadroughts

Figure 1 compares the time series of the simulated regional precipitation with the reconstructed wet–dry index over eastern China. There are six megadroughts (marked in gray) in the reconstruction data (Figure 1a), while there are five megadroughts in the control run (Figure 1b) and 3–6 megadroughts in the forced runs (Figure 1c–g). Previous studies [45] have shown that CESM broadly reproduces the observed EASM and EASM-precipitation relationship with some small biases. Recall a megadrought event is defined as a period with precipitation anomalies less than zero for at least 20 consecutive years, and those drought events that do not persist for 20 years are not considered megadrought events in this study. There is little or no agreement in the timing between the reconstructed megadroughts and simulated megadroughts, either from the control run or forced runs. Moreover, the identified megadroughts among different sensitivity experiments or different members within the same group of sensitivity experiments are also inconsistent. The disagreement in the megadrought timing and magnitudes indicates that the major triggering mechanism of megadroughts is the internal climate variability.
In terms of megadrought duration and severity, the model exhibits a similar variability with the reconstructed data (Figure 2). For the megadrought duration, the mean length of the megadroughts in the reconstruction is approximately 29 years, while the mean length of the megadroughts in CTRL is approximately 23 years (significantly different at p < 0.05 from the reconstruction), and the mean lengths in the forced experiments range from 25 to 28 years (Figure 2a). Although these lengths in the forced experiments are shorter than the reconstructed length, most of these lengths are not significantly different from the reconstructed length at the p < 0.05 level, which is within the 25–75% range of the simulated lengths, except in the LULC experiment (p = 0.08). The potential explanation of this exception in only the LULC is that the LULC changes are smaller than the other sensitivity experiments during the period of 851–1850 (explained in the following sections), so the lengths in the LULC experiment are close to CTRL. For the ALL and SSI experiments, the model exhibits similar variability as compared to the reconstructed variability.
The average magnitude of megadroughts, defined as the mean standardized regional-averaged annual precipitation anomalies, in the reconstruction is approximately 1 standard deviation below the mean (Figure 2b). The magnitudes of the megadroughts simulated in both the CTRL run and forced runs are also approximately one standard deviation from their means (Figure 2b), indicating that the magnitude of the megadroughts is determined by the internal climate variability simulated in the experiments. When defined using precipitation decreases, the mean megadrought magnitudes in CTRL and forced runs are all approximately −30 mm (one standard deviation, c.f., Figure 1), which are not significant based on a Student’s t-test (p > 0.1) and the spreads in the forced runs range from −18 mm to −54 mm.
The spatial patterns of the megadroughts in the reconstructed PDSI and the simulations, representing the averages of the absolute magnitudes of megadroughts, are shown in Figure 3. The rectangle in Figure 3a shows the study area. In this analysis and the following analyses, the significances were calculated through applying Student t-test to the anomalies during the megadrought years from the long-term mean. In the CTRL run, the droughts are mainly located over the middle-lower reaches of the Yangtze River Basin. This drought extension is a little bit smaller than the drought extension in the reconstruction, which shows more significant droughts over the northern part of eastern China (Figure 3a,b). The maximum annual precipitation magnitudes are approximately −50 mm in the CTRL experiment. In the forced runs, droughts extend to the southern part of eastern China with similar but more significant precipitation decreases (Figure 3c–g), indicating that the drought areas were amplified by external forcing and closer to the drought extension in the reconstruction (Figure 3a), although the megadrought magnitudes are close to the CTRL run with averages of approximately −30 mm (Figure 2c).
In general, the comparisons suggest that the GCMs can simulate persistent megadroughts with the similar severity and frequency compared with the megadroughts in the reconstructed data. However, since the reconstructed wet–dry index data is filtered and unitless, the accuracy of this comparison may be influenced. Similar to previous studies [41], the model simulated megadroughts are not coincident in time across model simulations, despite the fact that the models are forced with similar external forcings. Moreover, the simulated megadroughts are not temporally synchronous with the megadroughts in the reconstructed data. This suggests that the internal climate variability, rather than the external forcing, is the predominant driver of the simulated megadroughts.

3.2. Circulation Patterns Associated with Megadroughts

As discussed before, the EASM precipitation contributes to a large part of annual total precipitation. During the megadroughts, the EASM precipitation decreases (Figure S2) are usually more consistent with the megadroughts than the non-monsoon season precipitation decreases (Figure S3). The magnitudes of the EASM precipitation decreases (Figure S4) are also larger than the non-monsoon season precipitation decreases (Figure S5) in most experiments, except the CTRL experiment. Thus, it can be concluded that the megadroughts are mainly dominated by the EASM precipitation decreases, while the contributions from the non-EASM season precipitation cannot be neglected. Therefore, the following mechanism analyses mainly focus on annual scale, EASM season (MJJASO) and non-EASM season (SDJFMA), separately.
The spatial patterns of 850 hPa wind anomalies associated with the megadroughts show northern wind anomalies over southeastern China the whole year (Figure 4), including both EASM season (Figure S6) and non-EASM season (Figure S7). All simulated megadroughts over eastern China are concluded to be associated with EASM weakening, which reduces moisture transportation to southeastern China, and EAWM strengthening, which shifts the rain belts to southern China and reduces the precipitation over eastern China, consistent with the results found in the proxy data [23]. Moreover, the contributions from EASM season and non-EASM season precipitation decreases on the megadrought magnitudes are consistent with the magnitudes of EASM weakening and EAWM strengthening (Figures S4–S7).
These northern wind anomalies are mainly caused by the anomalous cyclonic circulations over the northwestern Pacific, corresponding to significant negative sea level pressure (SLP) anomalies (Figure 5). This anomaly pattern implies a weakening of the climatological mean western North Pacific Subtropical High. Meanwhile, over central eastern China, there are positive SLP anomalies in all runs, with more significant anomalies in the forced runs (Figure 4b–f). These persistent positive SLP anomalies can also contribute to droughts by directly suppressing upward motions and reducing precipitation. Another obvious characteristic of the SLP anomaly pattern is the pattern of negative SLP anomalies over northeastern Asia in the forced runs, resulting in a tripolar pattern (negative-positive-negative) over East Asia. These tripolar patterns are more obvious in the EASM season (Figure S8). Meanwhile, during the other months, the major characteristics of SLP anomalies are the strengthened Aleutian Low that usually induces stronger EAWM (Figure S9).
These similar tripolar patterns also partially exist in the middle troposphere (Figure 6), especially during the EASM season (Figure S10). The two centers of negative geopotential height anomalies are still located over northeastern and southeastern Asia, while the positive geopotential height anomalies tilt westward, with the most significant geopotential height anomalies located over middle Asia. Among these three centers, the negative geopotential height anomalies over northeastern Asia are the most significant with evident barotropic structures, while the remaining two centers are less evident. These vertical structures with combined barotropic and baroclinic patterns are similar to the interdecadal Pacific-Japan (PJ) pattern [46] confined to the lower troposphere, which is maintained by convection over the tropical northwestern Pacific, while the locations of the nodes are different. Moreover, the centers over northeastern Asia also belong to a circumglobal wave train that is similar to the interdecadal circumglobal teleconnection with barotropic structures [47], which significantly influences the EASM, although the specific locations of the nodes are not the same.

3.3. Origins of the Megadrought Circulation Anomalies

Due to the short memory of the atmosphere, surface heating, such as SST anomalies, may play an important role in maintaining decadal circulation pattern anomalies and the persistence of megadroughts. The SST anomalies over the tropical and northwestern Pacific have been found to play important roles in droughts over eastern China on interannual to decadal scales through influences on the EASM [48,49,50]. Therefore, to investigate the reason for these circulation patterns, the SST anomalies associated with the megadroughts are calculated (Figure 7).
The spatial patterns of the SST anomalies (Figure 7) show that there is a tripolar pattern with significant negative SST anomalies over the northwestern Pacific, similar to the positive PDO pattern and other similar decadal scale patterns [12]. However, this SST anomaly pattern is not exactly the same as the typical PDO pattern [51,52] because the negative SST anomalies extend to the South China Sea and eastern Indian Ocean. Moreover, surrounding the negative SST anomalies, there are positive SST anomalies over the Bering Sea and the western tropical Pacific, creating a La Niña-like SST gradient over the tropical Pacific, indicating the potential model biases on reproducing spatial patterns of internal climate variability. These SST patterns can be considered an internal mode in the model simulations, which represents the multi-decadal variability extracted using the rotated empirical orthogonal function (REOF) analysis with the first 10 empirical orthogonal function (EOF) patterns retained, which is applied to both the CTRL and ALL experiments (Figure 8). All of the first 3 EOF patterns of both experiments are significantly separated based on North’s Rule of Thumb. On the other hand, this SST anomaly pattern bears similarity to the SST anomaly pattern associated with the multi-decadal variation of the EASM land precipitation, derived using the instrumental data (1901–2016) of Li and Wang [32]. The similarity includes opposing SST anomalies between the WNP and those over the equatorial western Pacific and Bering Sea; however, the difference is in the equatorial eastern Pacific.
Therefore, persistent megadroughts are proposed to result from the cyclonic circulation anomalies through multidecadal-scale SST anomalies over the northwestern Pacific. These sea surface temperature anomaly (SSTA) patterns may also be driven by atmospheric forcing [53]. In this mechanism, the cyclonic anomalies over the northwestern Pacific and the associated equatorial westerly anomalies are due to the Pacific-East Asian teleconnection, which favors a large-scale environment with warming over the western tropical Pacific and cooling over the central to eastern tropical Pacific [48], similar to the SST pattern shown in Figure 7.
First, to confirm the influences on the megadrought persistence from the SST pattern, four characteristic SST regions were identified, i.e., the Bering Sea (50° N–65° N, 160° E–160° W), the northwestern Pacific (20° N–45° N, 140° E–160° W), the western tropical Pacific (10° S–10° N, 140° E–170° W), and the eastern tropical Pacific (10° S–10° N, 130° W–80° W). A time series of the regional-averaged SST anomalies is considered to be significantly persistent if the lag-1 autocorrelation exceeds 2 N , where N is the number of years in the time series [54,55]. Based on this method, the percentages of significantly persistent SST anomalies over the four regions relative to the total megadrought events in each experiment are represented in Figure 9. Most of the SST anomalies over the Bering Sea (Figure 9a) and the northwestern Pacific (Figure 9b) and more than half of the SST anomalies over the western tropical Pacific (Figure 9c) significantly persist through the megadrought periods; however, less than 30% of the SST anomalies over the eastern tropical Pacific significantly persist through the megadrought periods (Figure 9d). Thus, the SST anomalies over the Bering Sea, the northwestern Pacific and the western tropical Pacific are the key regions influencing the persistence of the megadroughts.
The physical mechanisms behind the influences from SST anomalies over the northwestern Pacific and western tropical Pacific are investigated through examination of the regressed SLP and 500 hPa geopotential height anomalies with respect to the SST anomalies (Figure 10). To maintain a concise discussion, only the results from the CTRL run are shown here, and the results from other forced runs are similar. The SLP anomaly patterns relevant to the SST anomalies over the Bering Sea (Figure 10a) and the northwestern Pacific (Figure 10b) both show mainly significant negative SLP anomalies over the northwestern Pacific (p < 0.05 based on the r-test) due to the local heating over the Bering Sea. The SLP anomaly pattern relevant to the SST anomalies over the western tropical Pacific (Figure 10c) is similar to these patterns. Meanwhile, during the EASM season, the SLP anomaly pattern relevant to the SST anomalies over the western tropical Pacific (Figure S11) shows significant negative SLP anomalies over the western subtropical Pacific and significant positive SLP anomalies over eastern China (p < 0.05). These negative SLP anomalies and corresponding cyclonic circulations over the western subtropical Pacific are similar to the Matsuno-Gill pattern [56,57], which usually induces an anomalous cyclone in the northwestern tropical Pacific heating [48]. This also confirms that the interdecadal anomalous convective heating over the western tropical Pacific can drive the meridional wave-like PJ pattern over eastern Asia [46]. The combined effect from these three key SST regions results in a tripolar SLP anomaly pattern, as shown in Figure 5a.
The regression patterns of the 500 hPa geopotential height anomalies show (Figure 10d–f) that the strongest responses to the SST anomalies over all three key regions are located over the northern Pacific with negative geopotential height anomalies, while over the tropical to mid-latitude regions, there are mainly positive geopotential height anomalies. This is consistent with the results from the previous composite analyses in which the geopotential height anomalies over the northern Pacific are more significant than in other areas, and the SLP anomalies are more significant than the 500 hPa geopotential height anomalies. This indicates that the anomalous cyclonic circulation patterns over the subtropical western Pacific mainly exist over the lower troposphere.

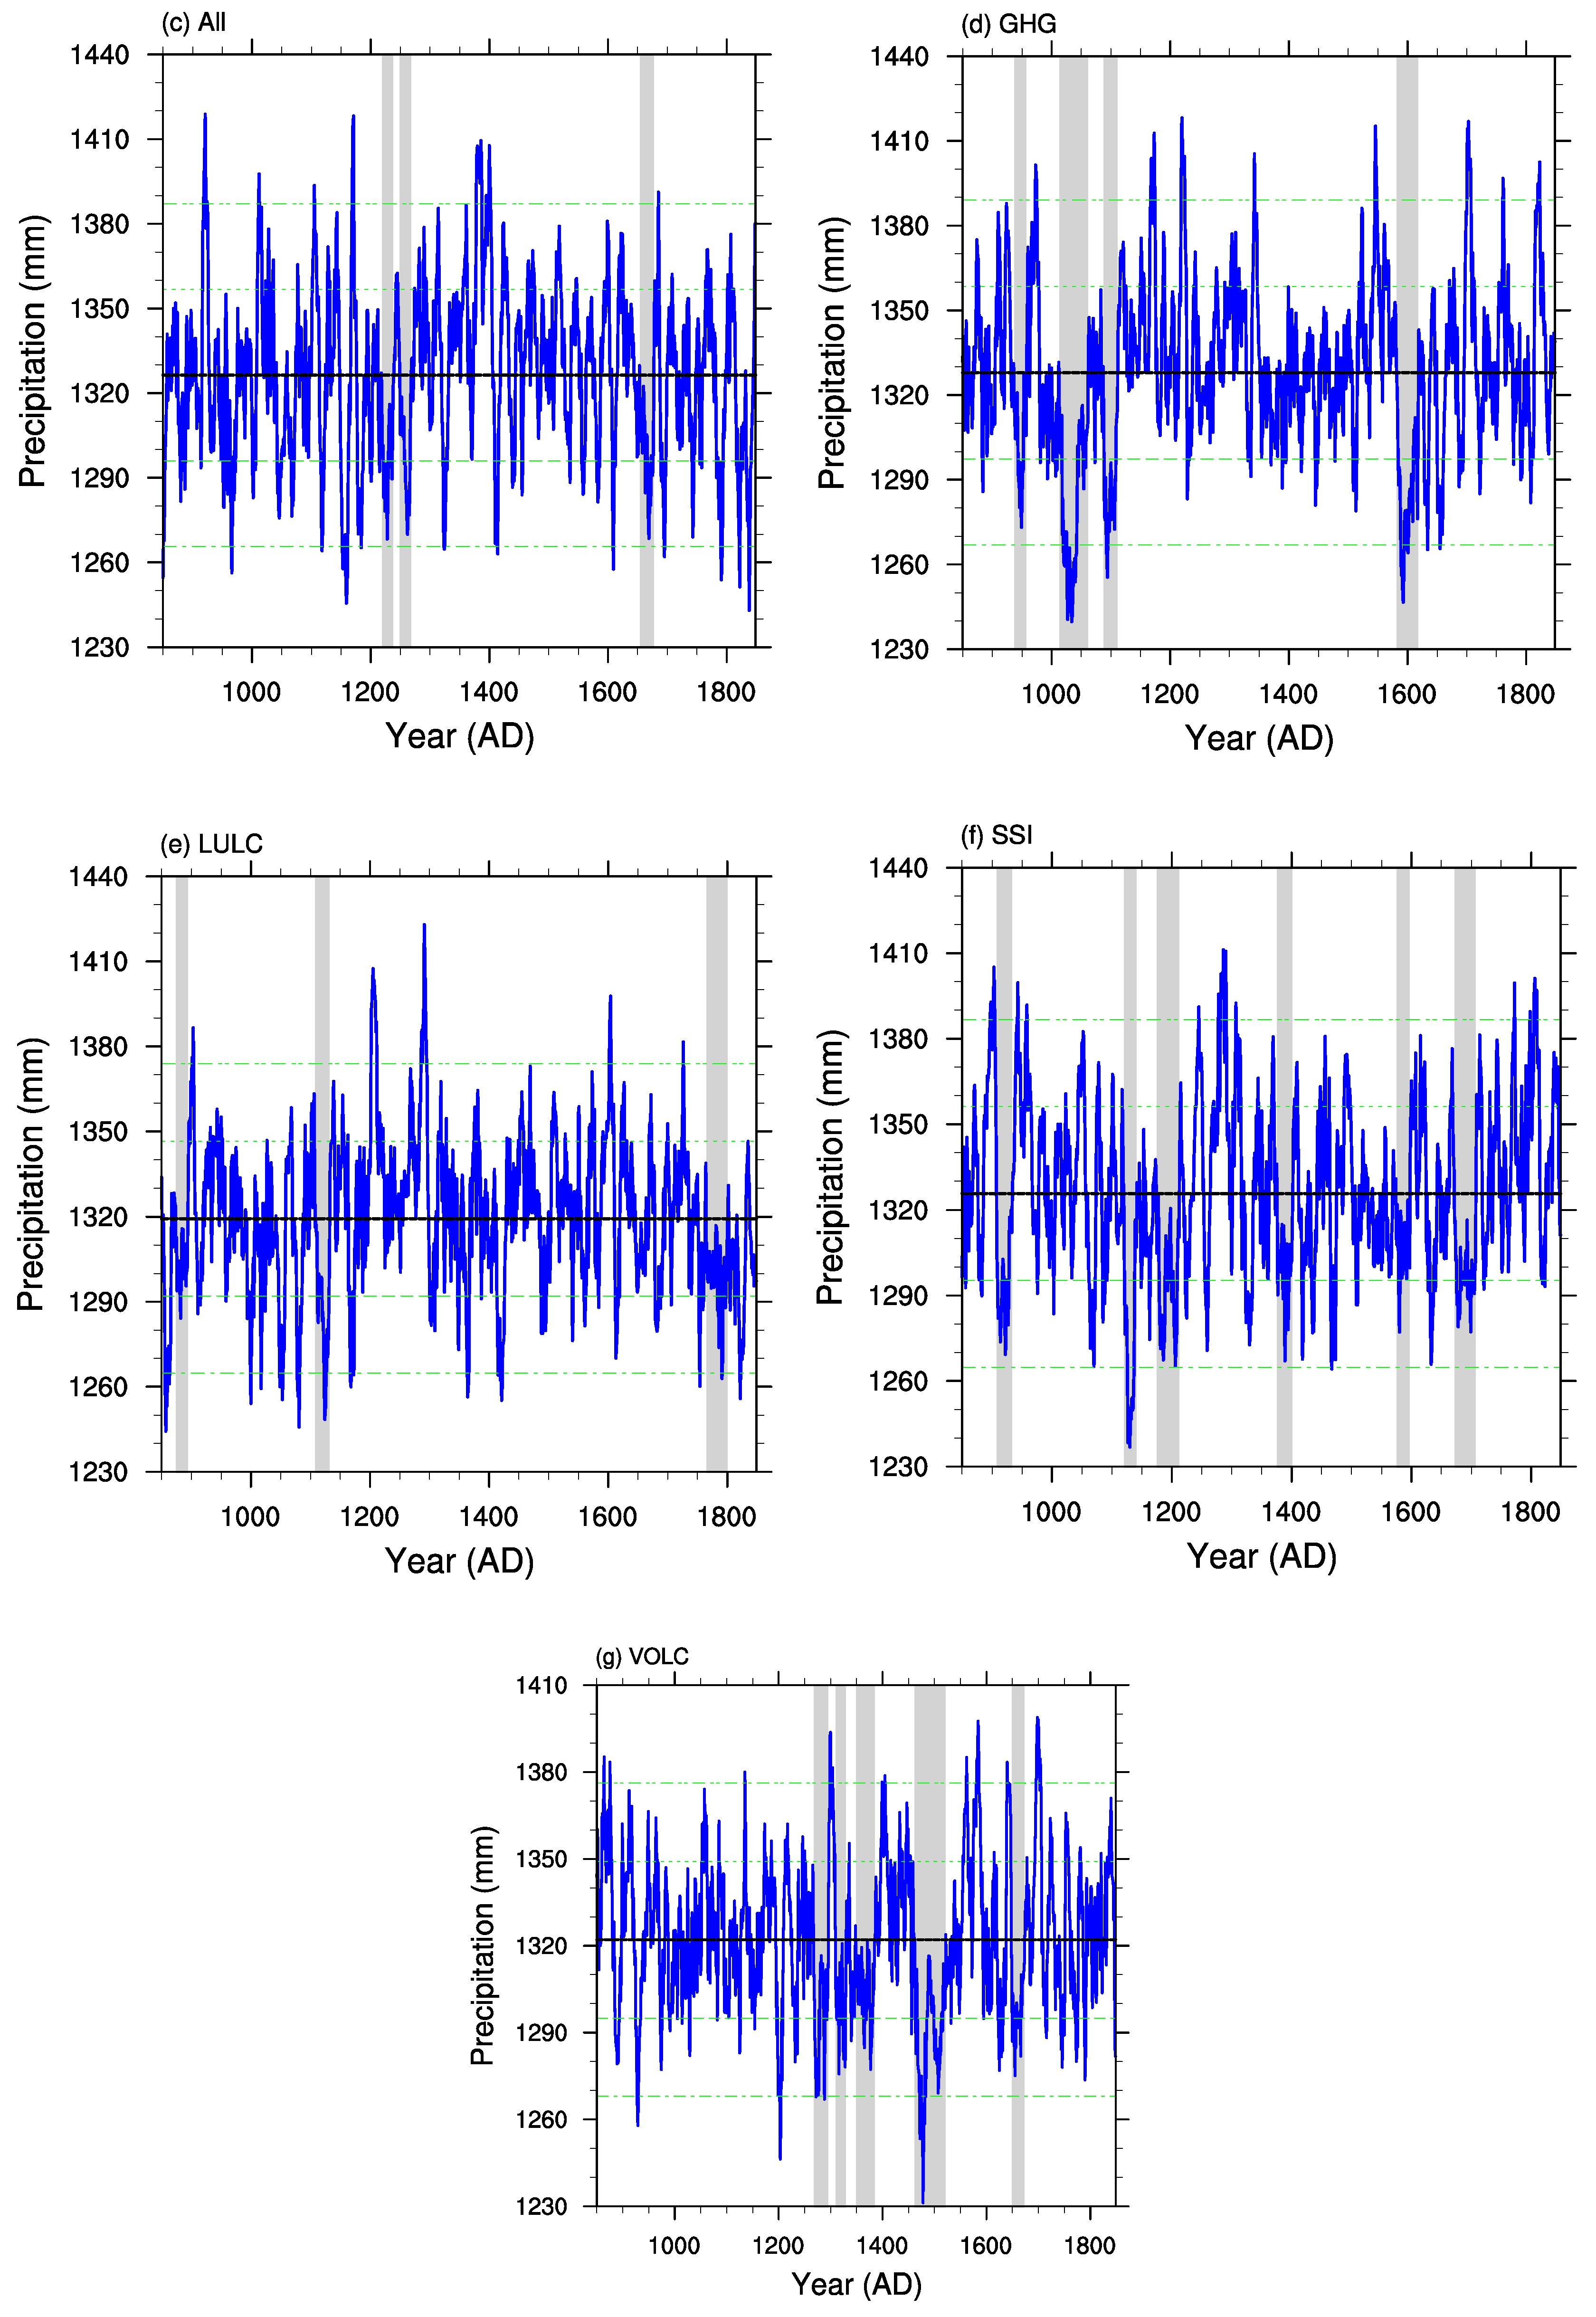
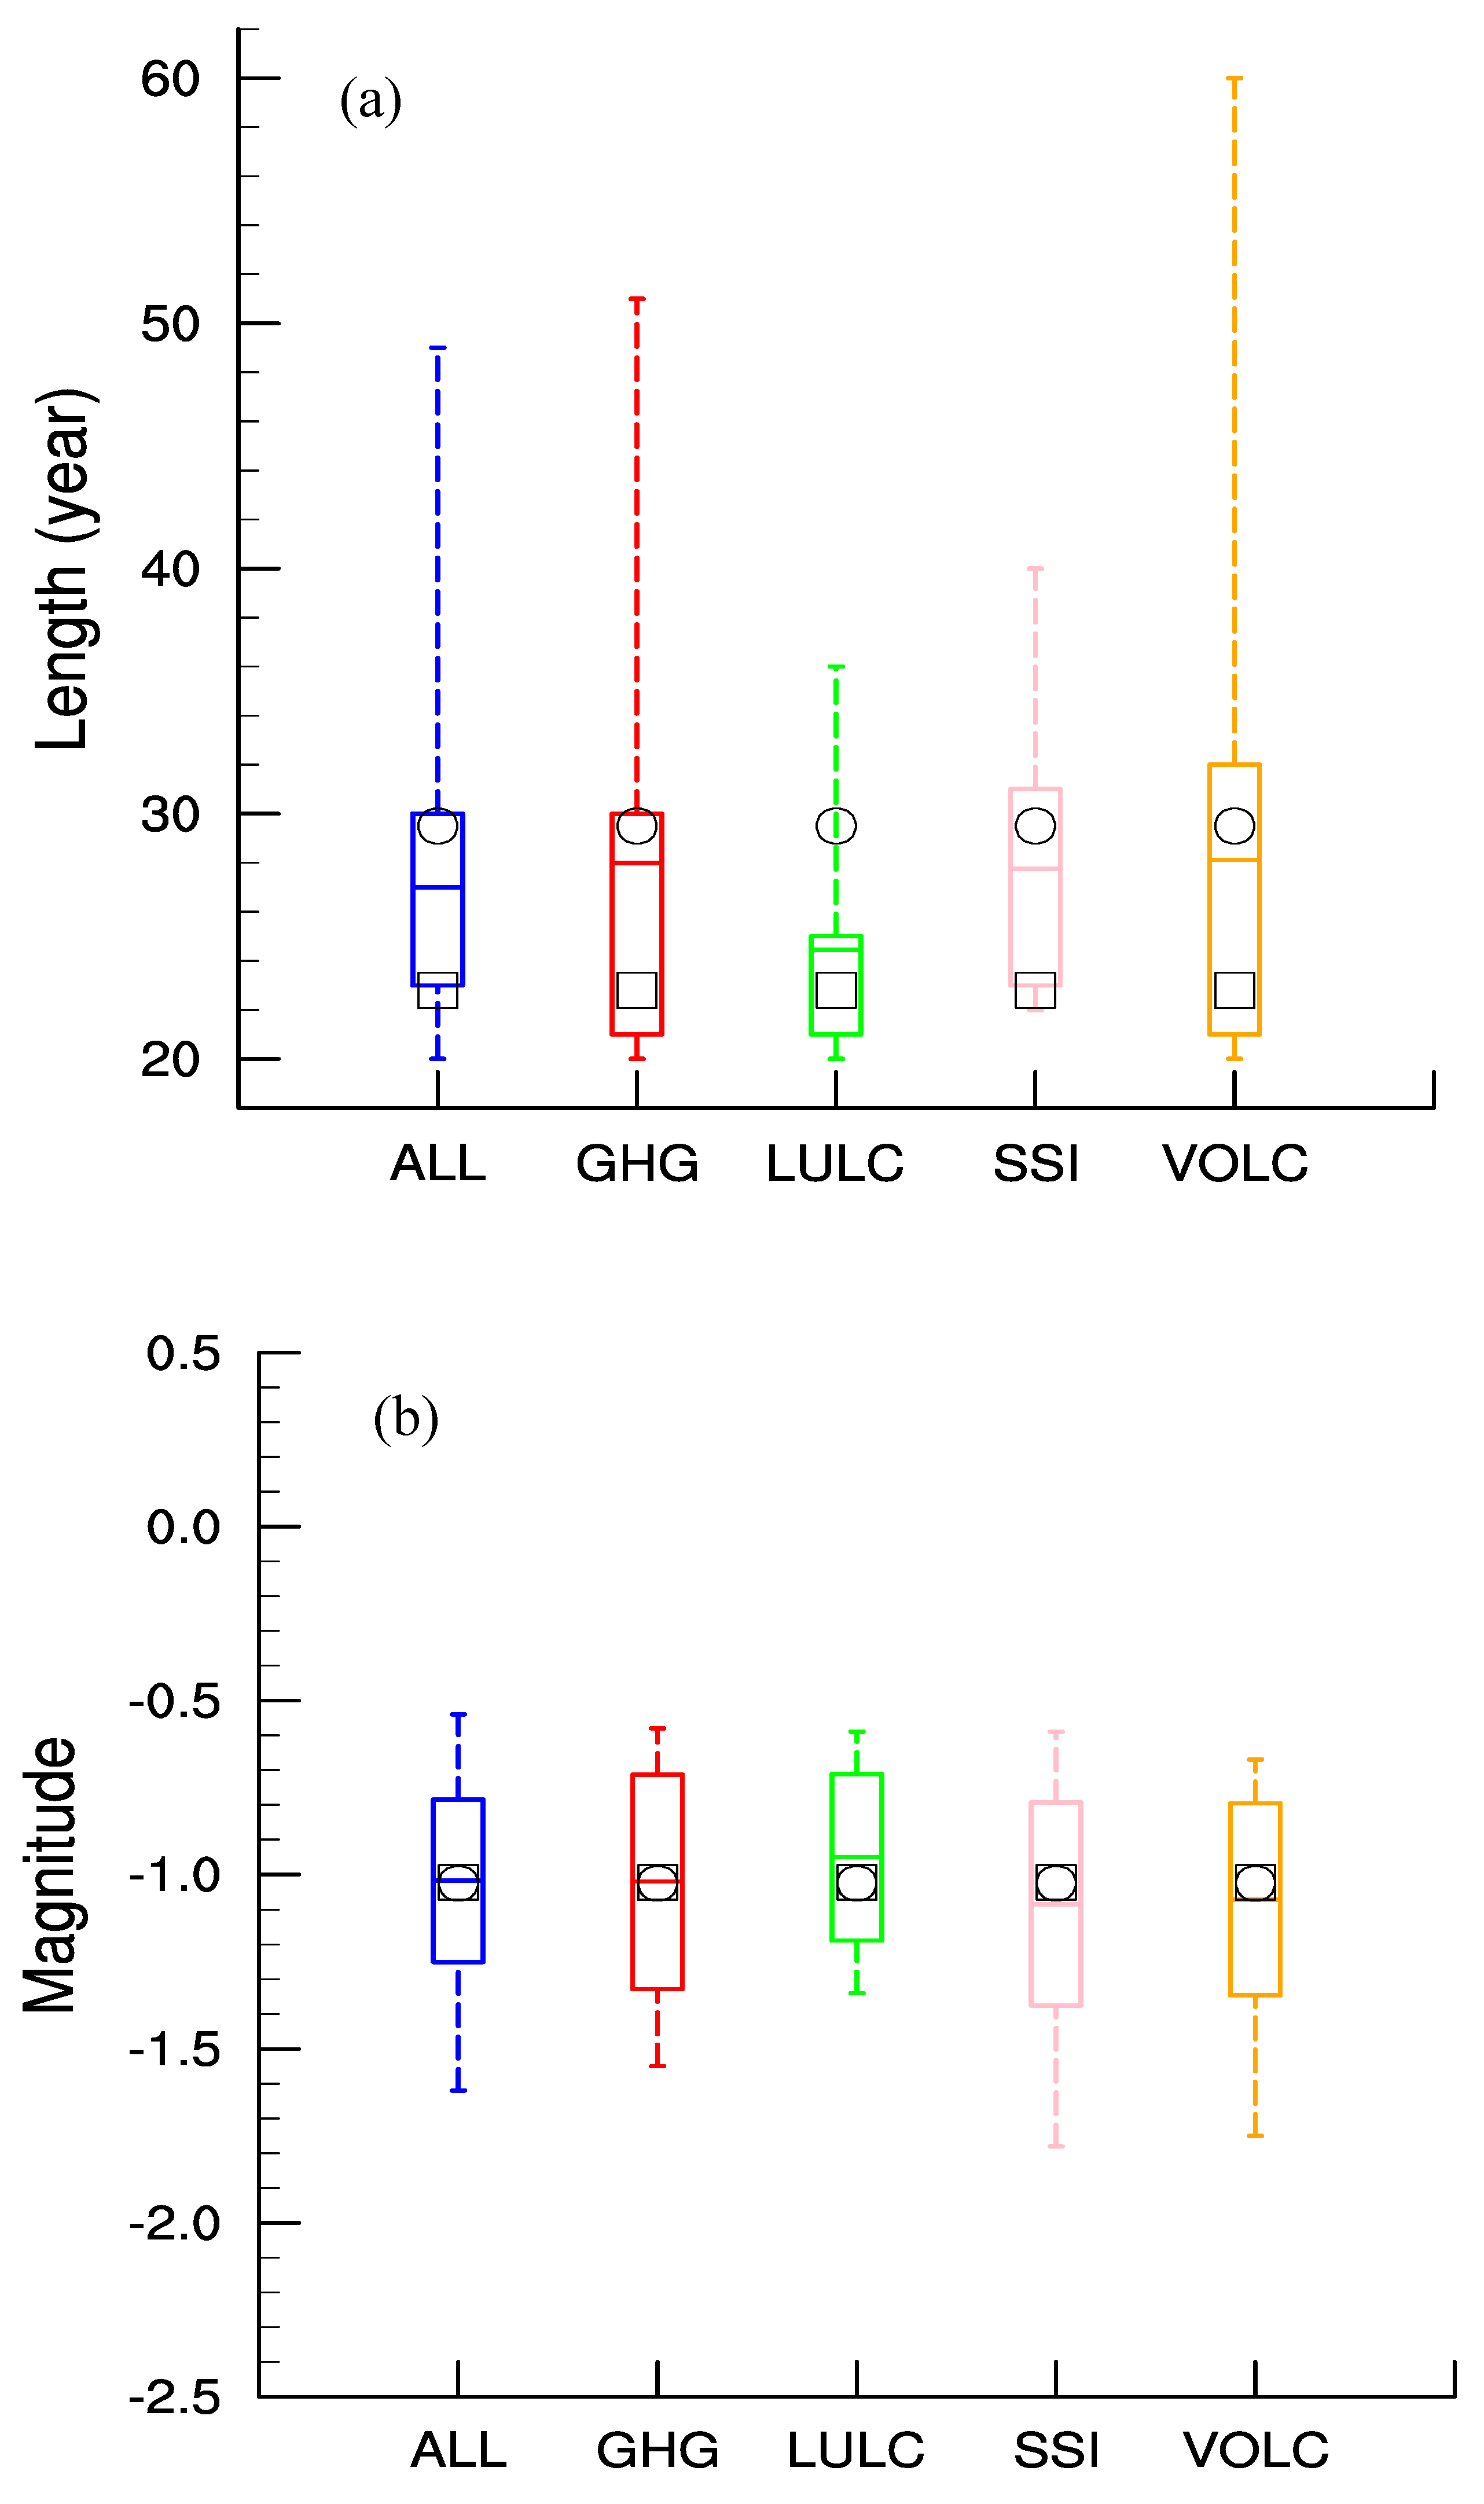
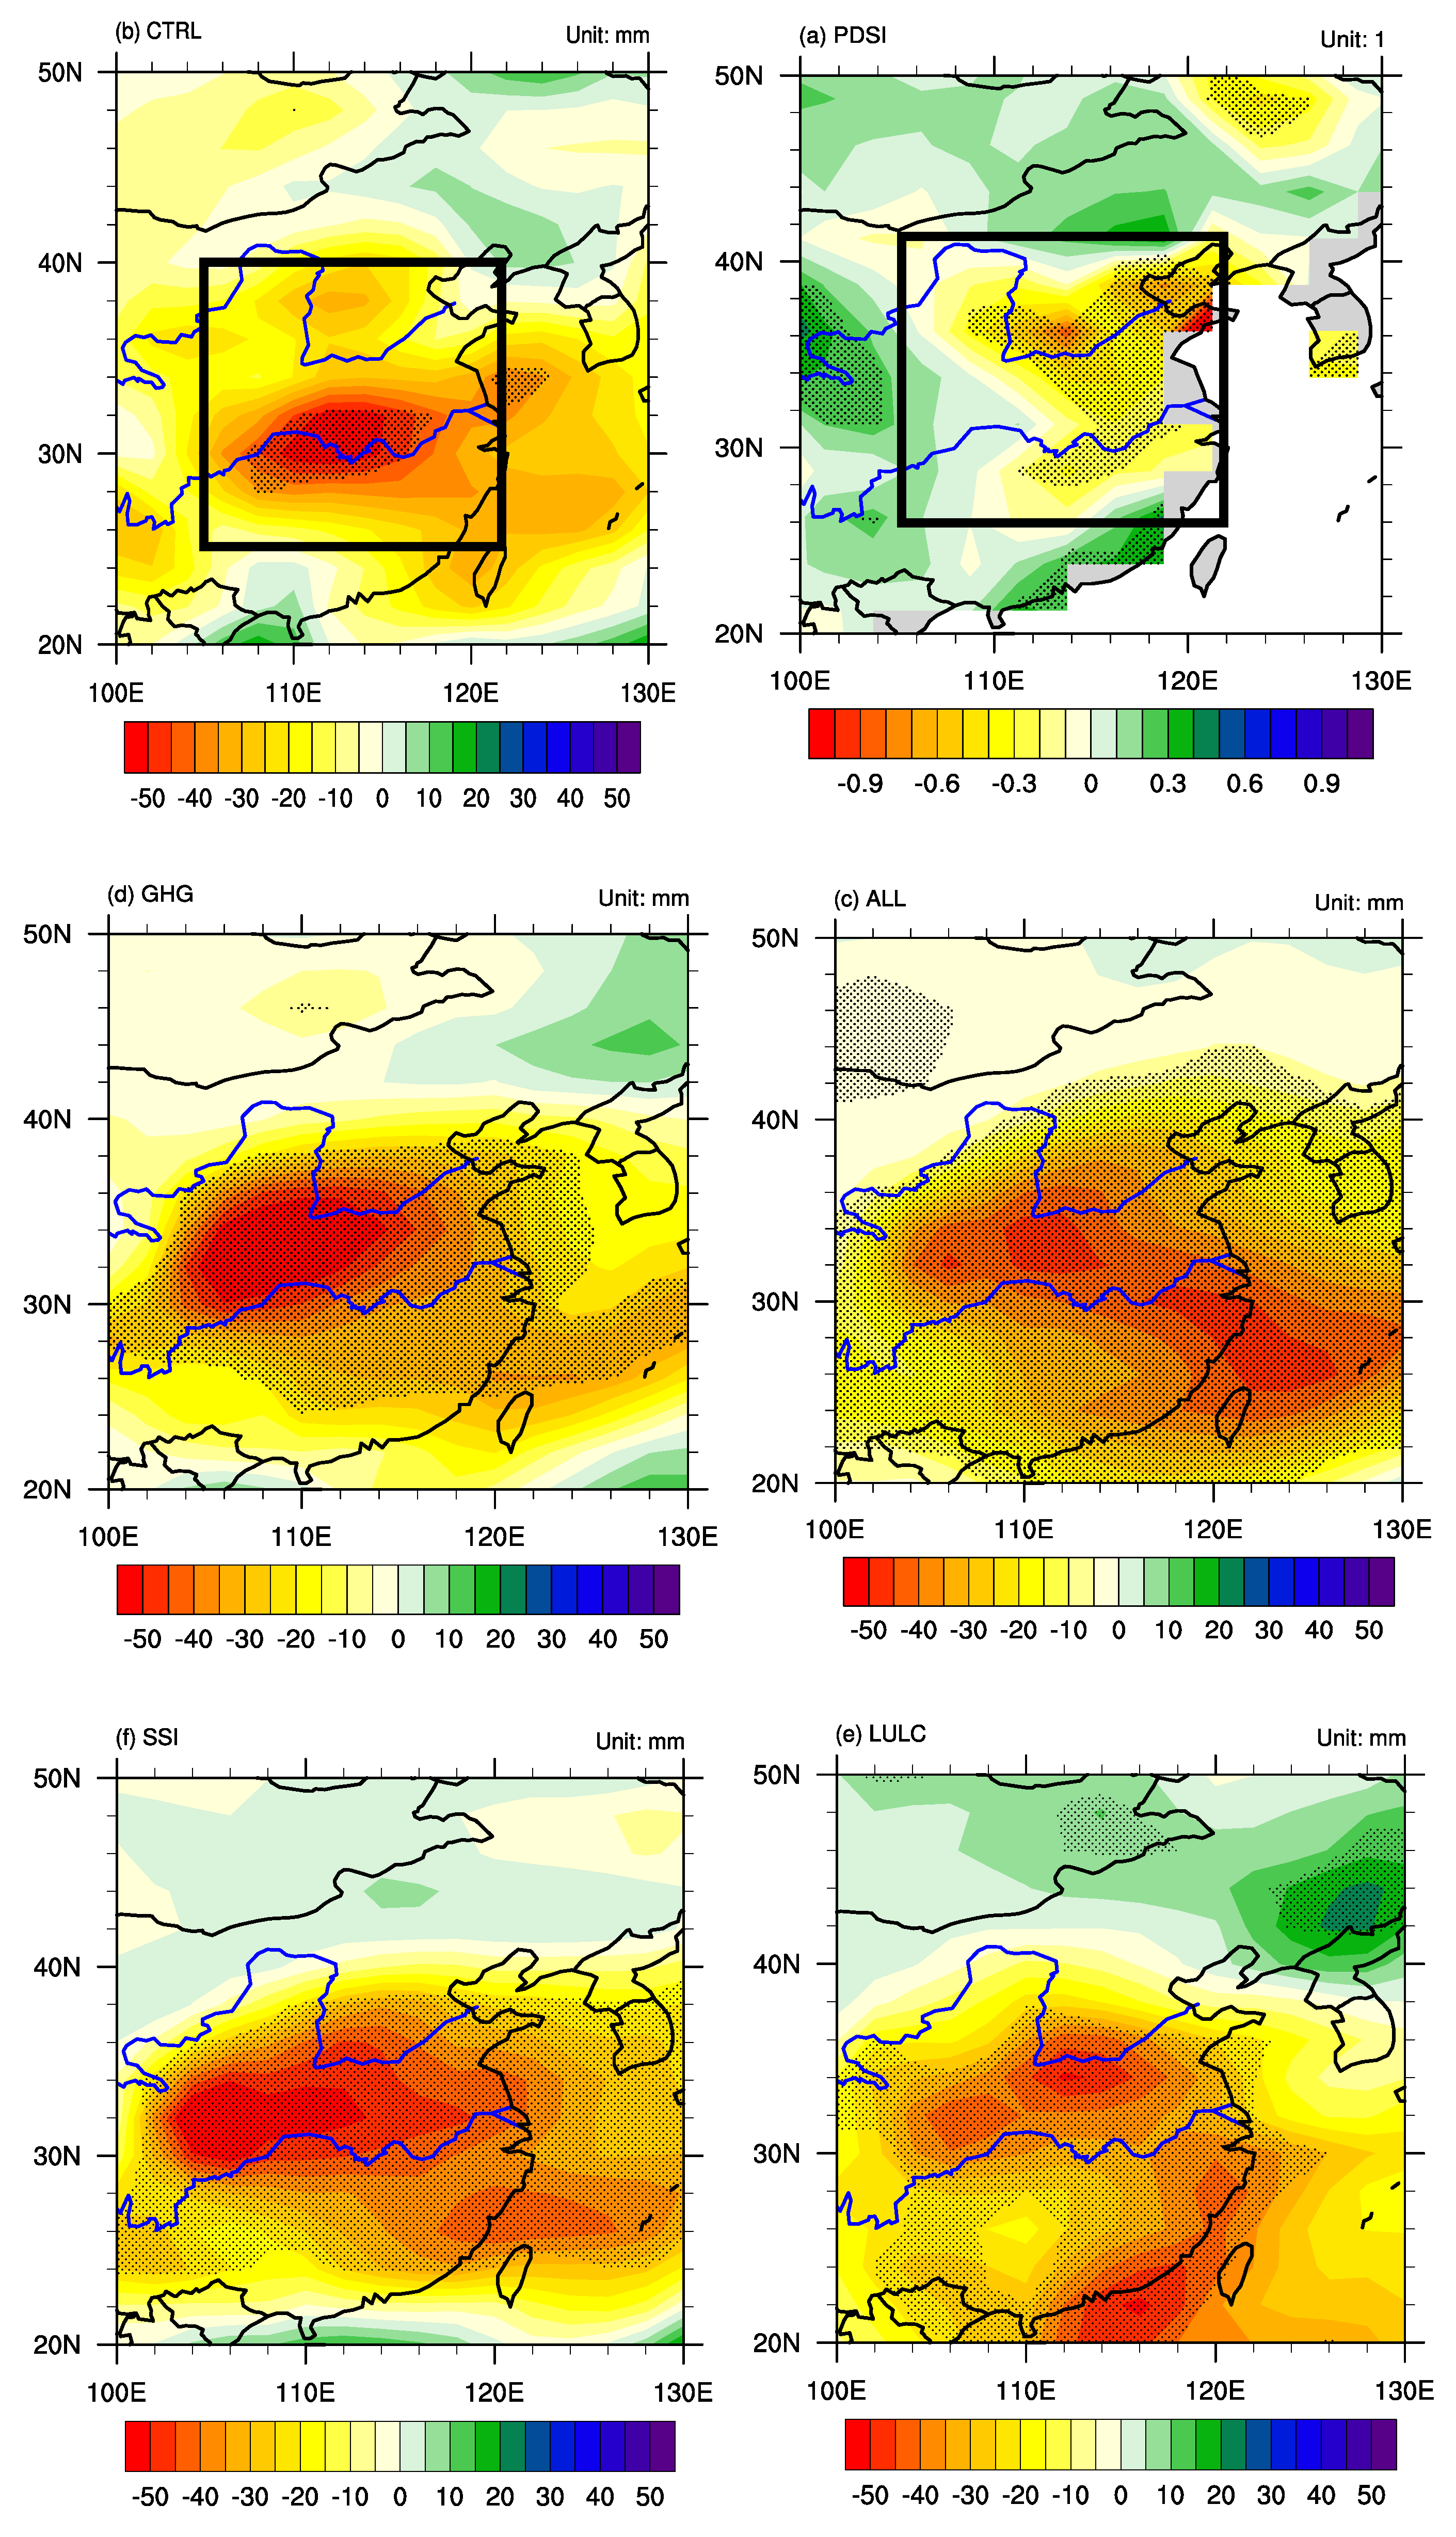
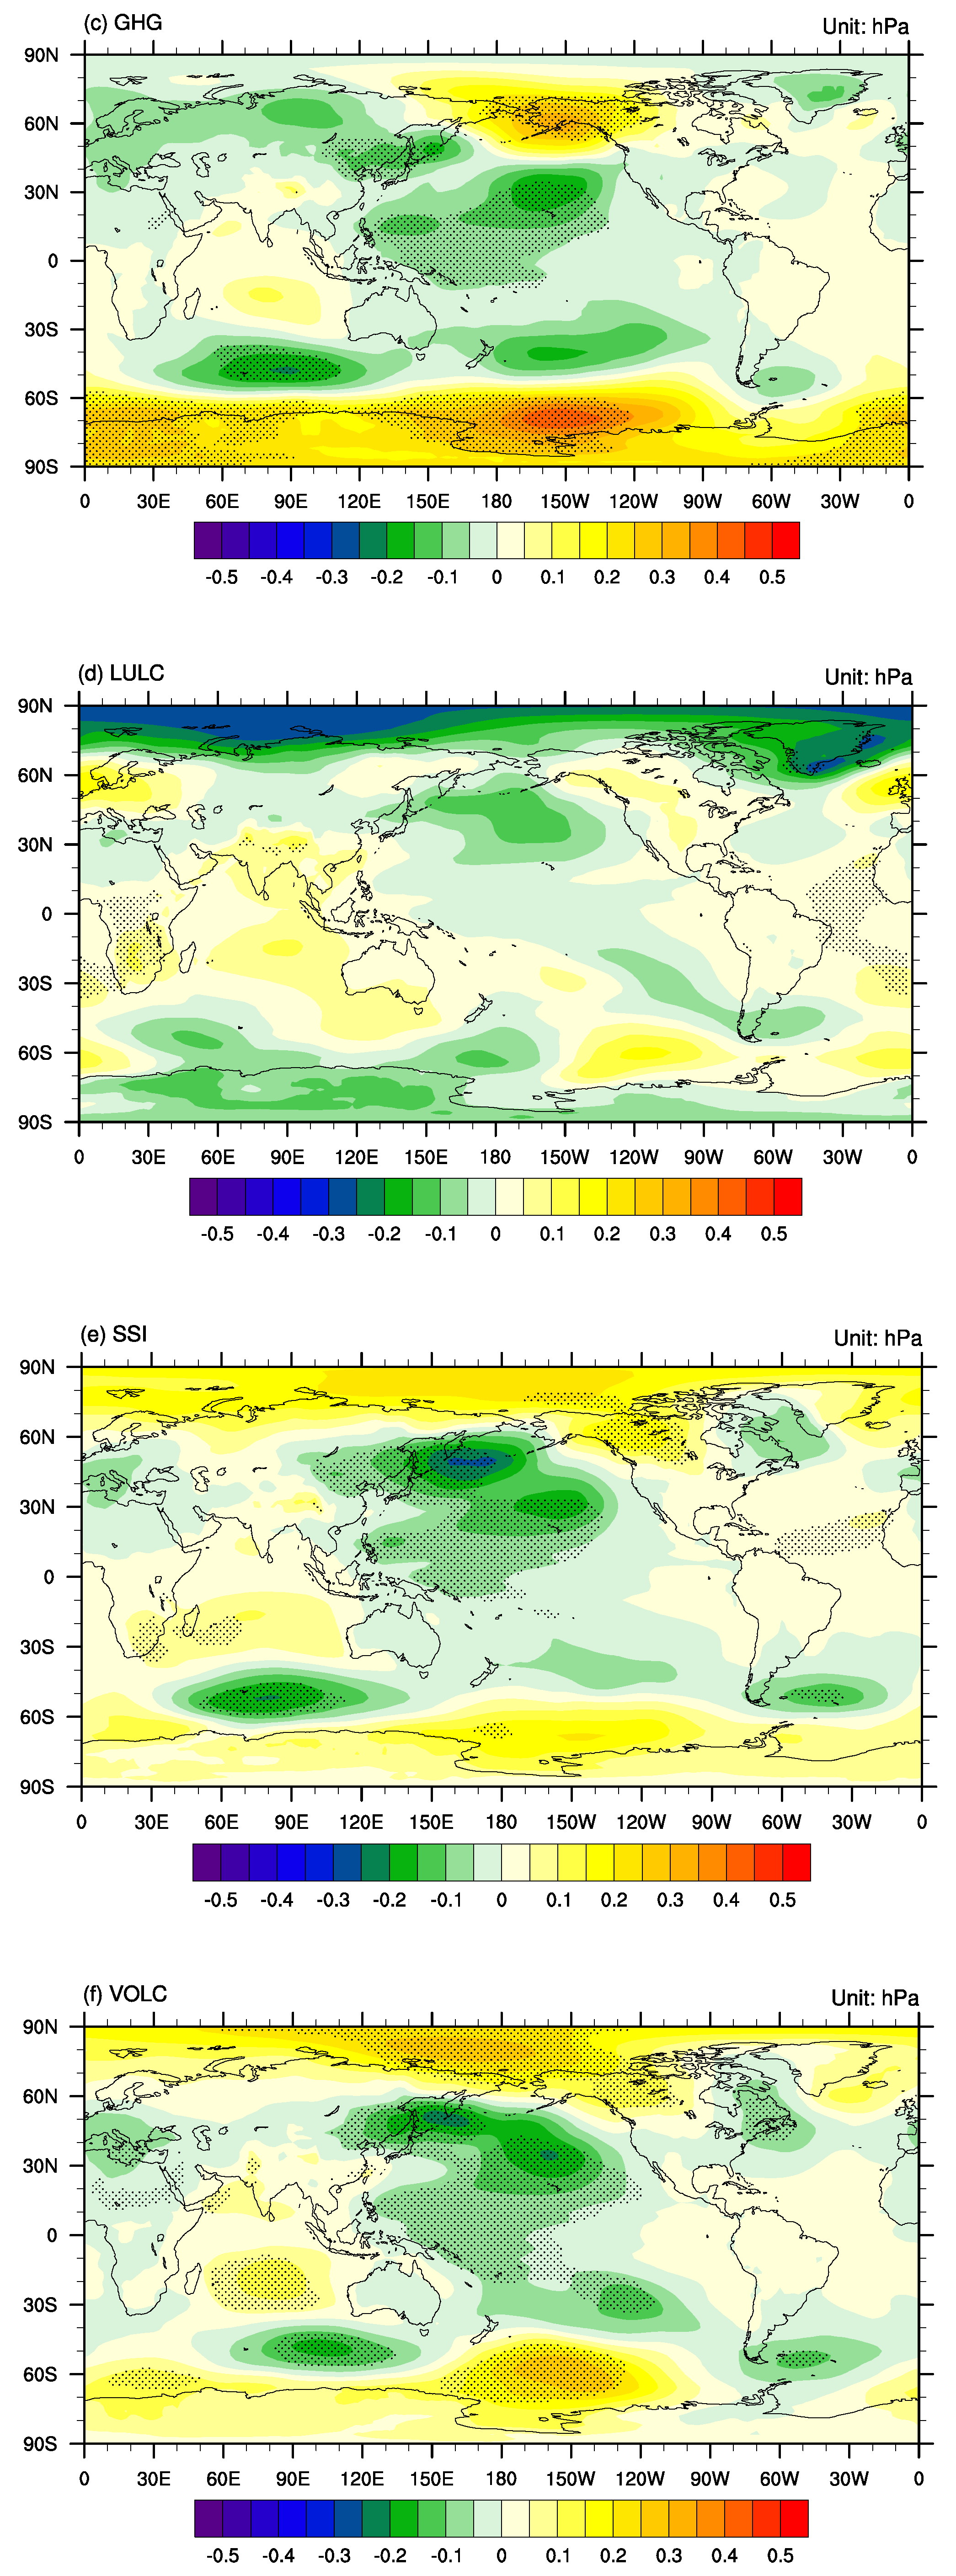
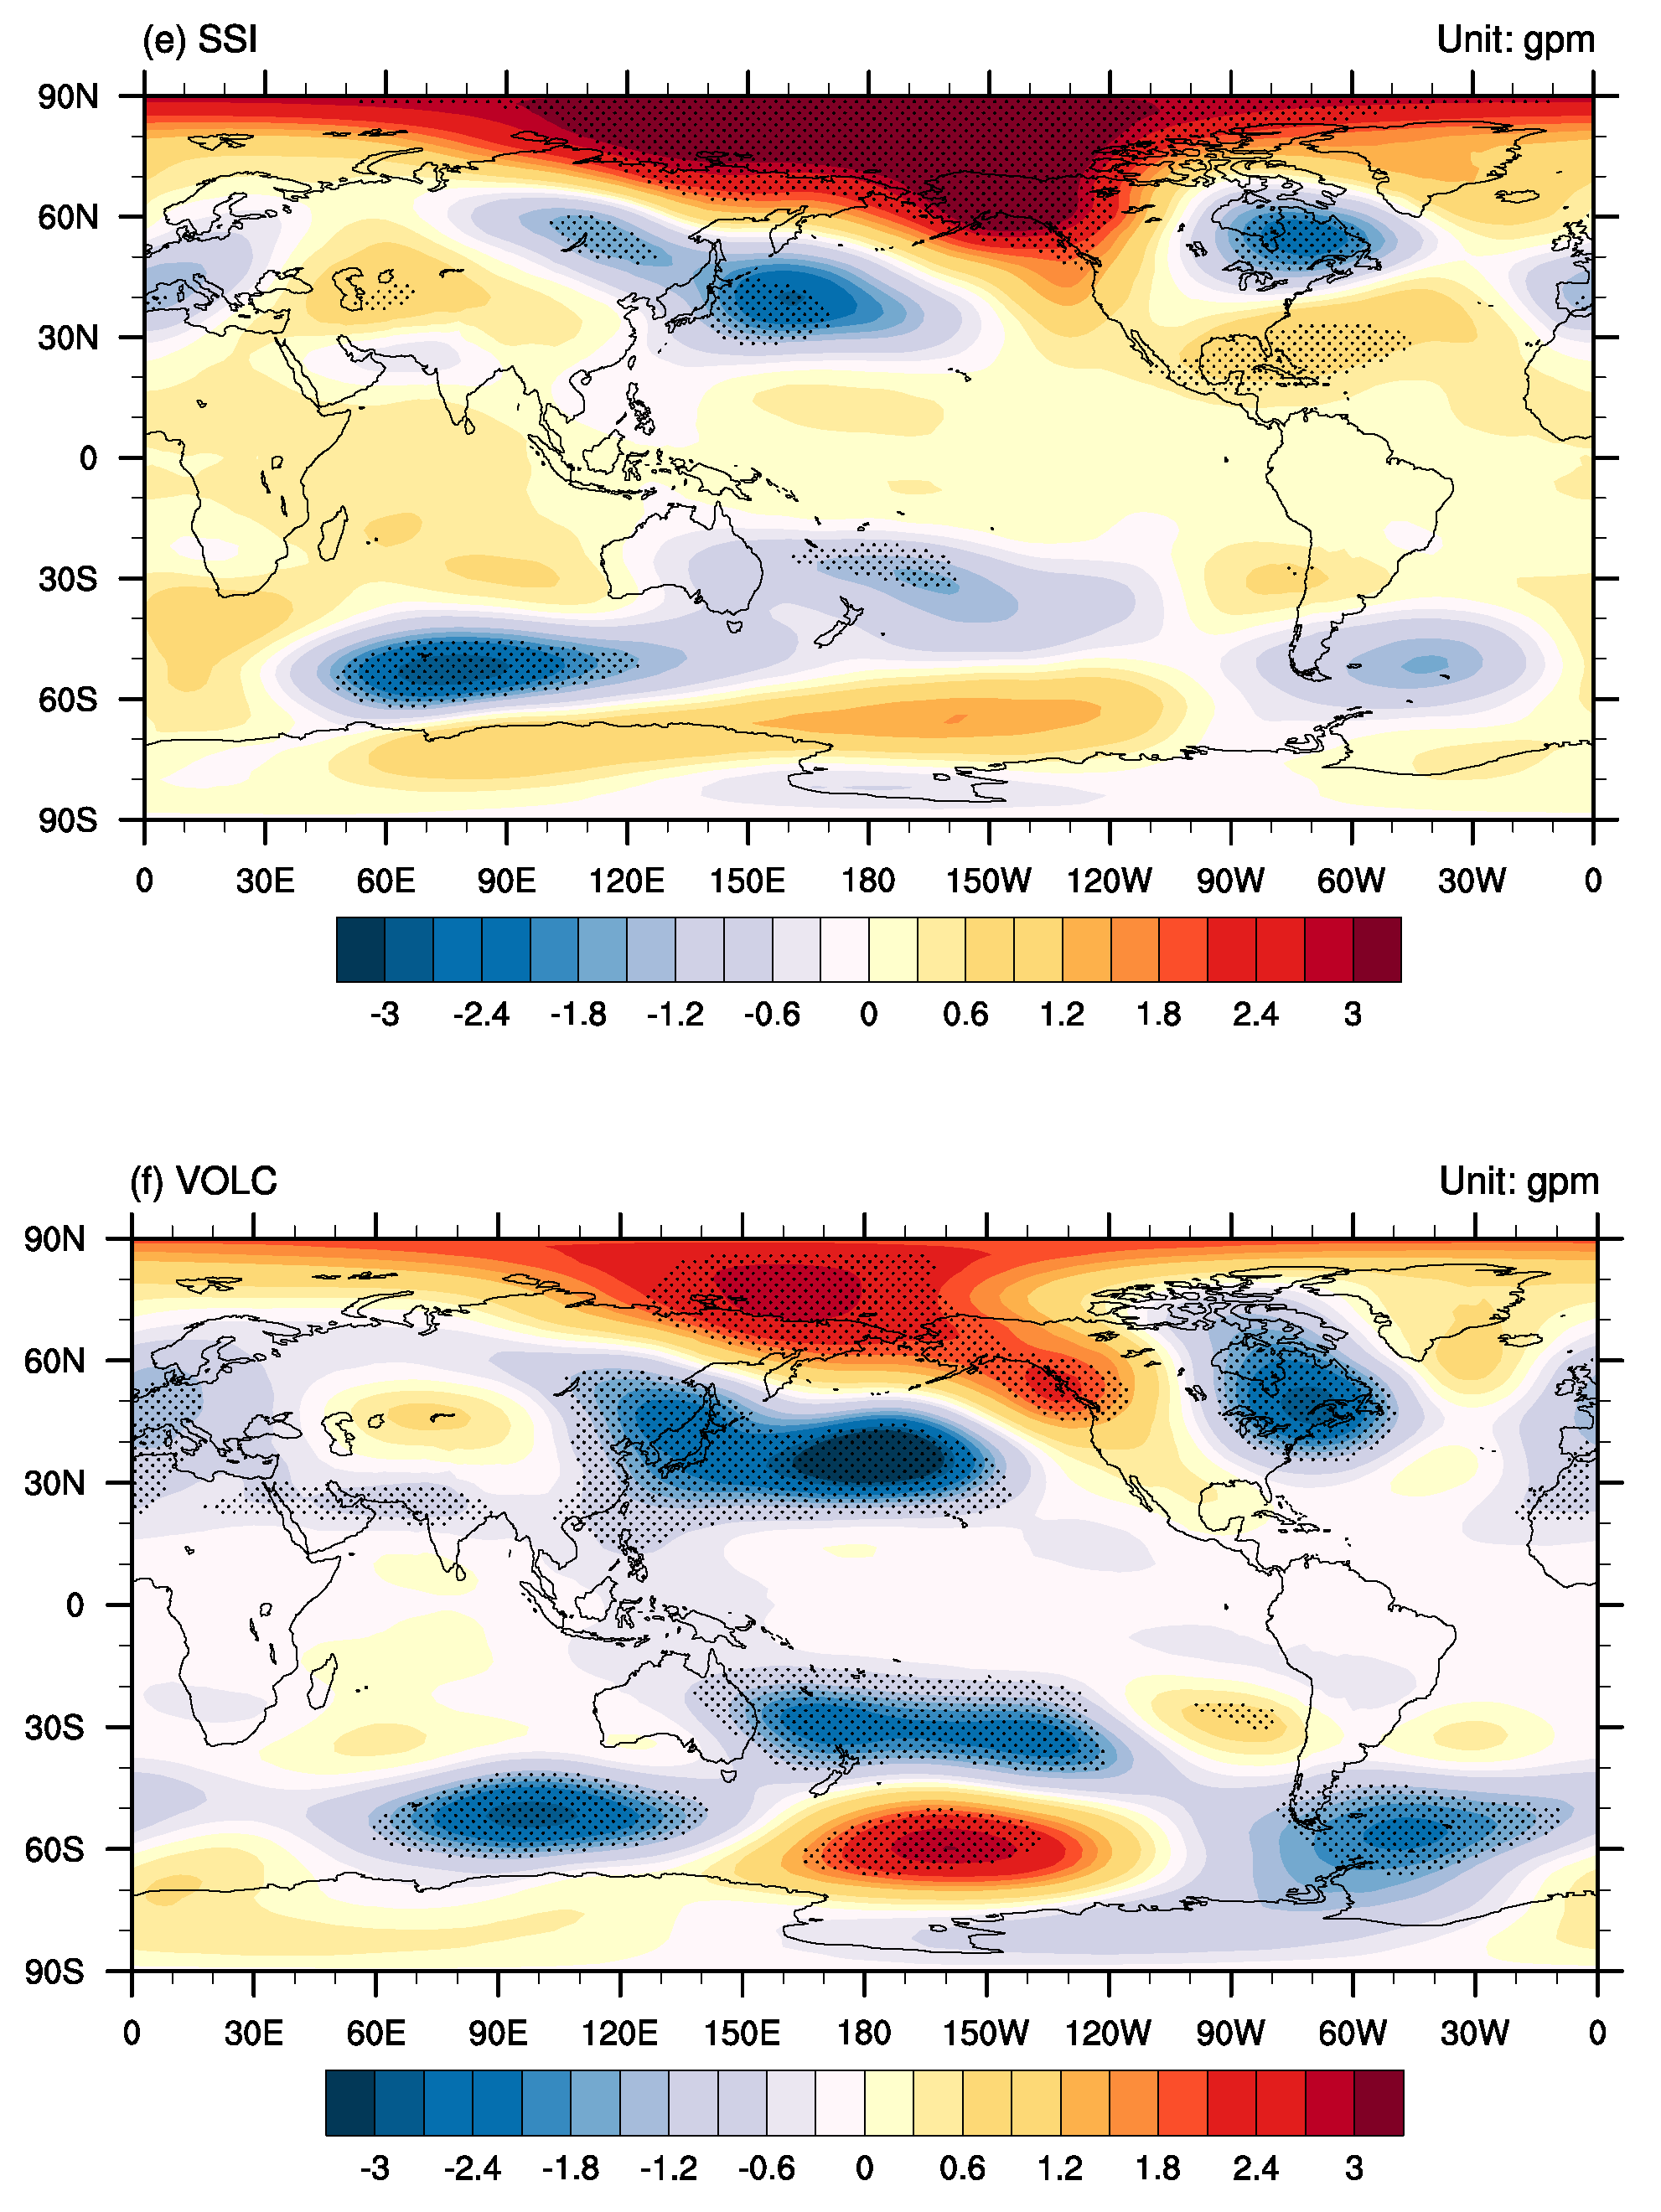
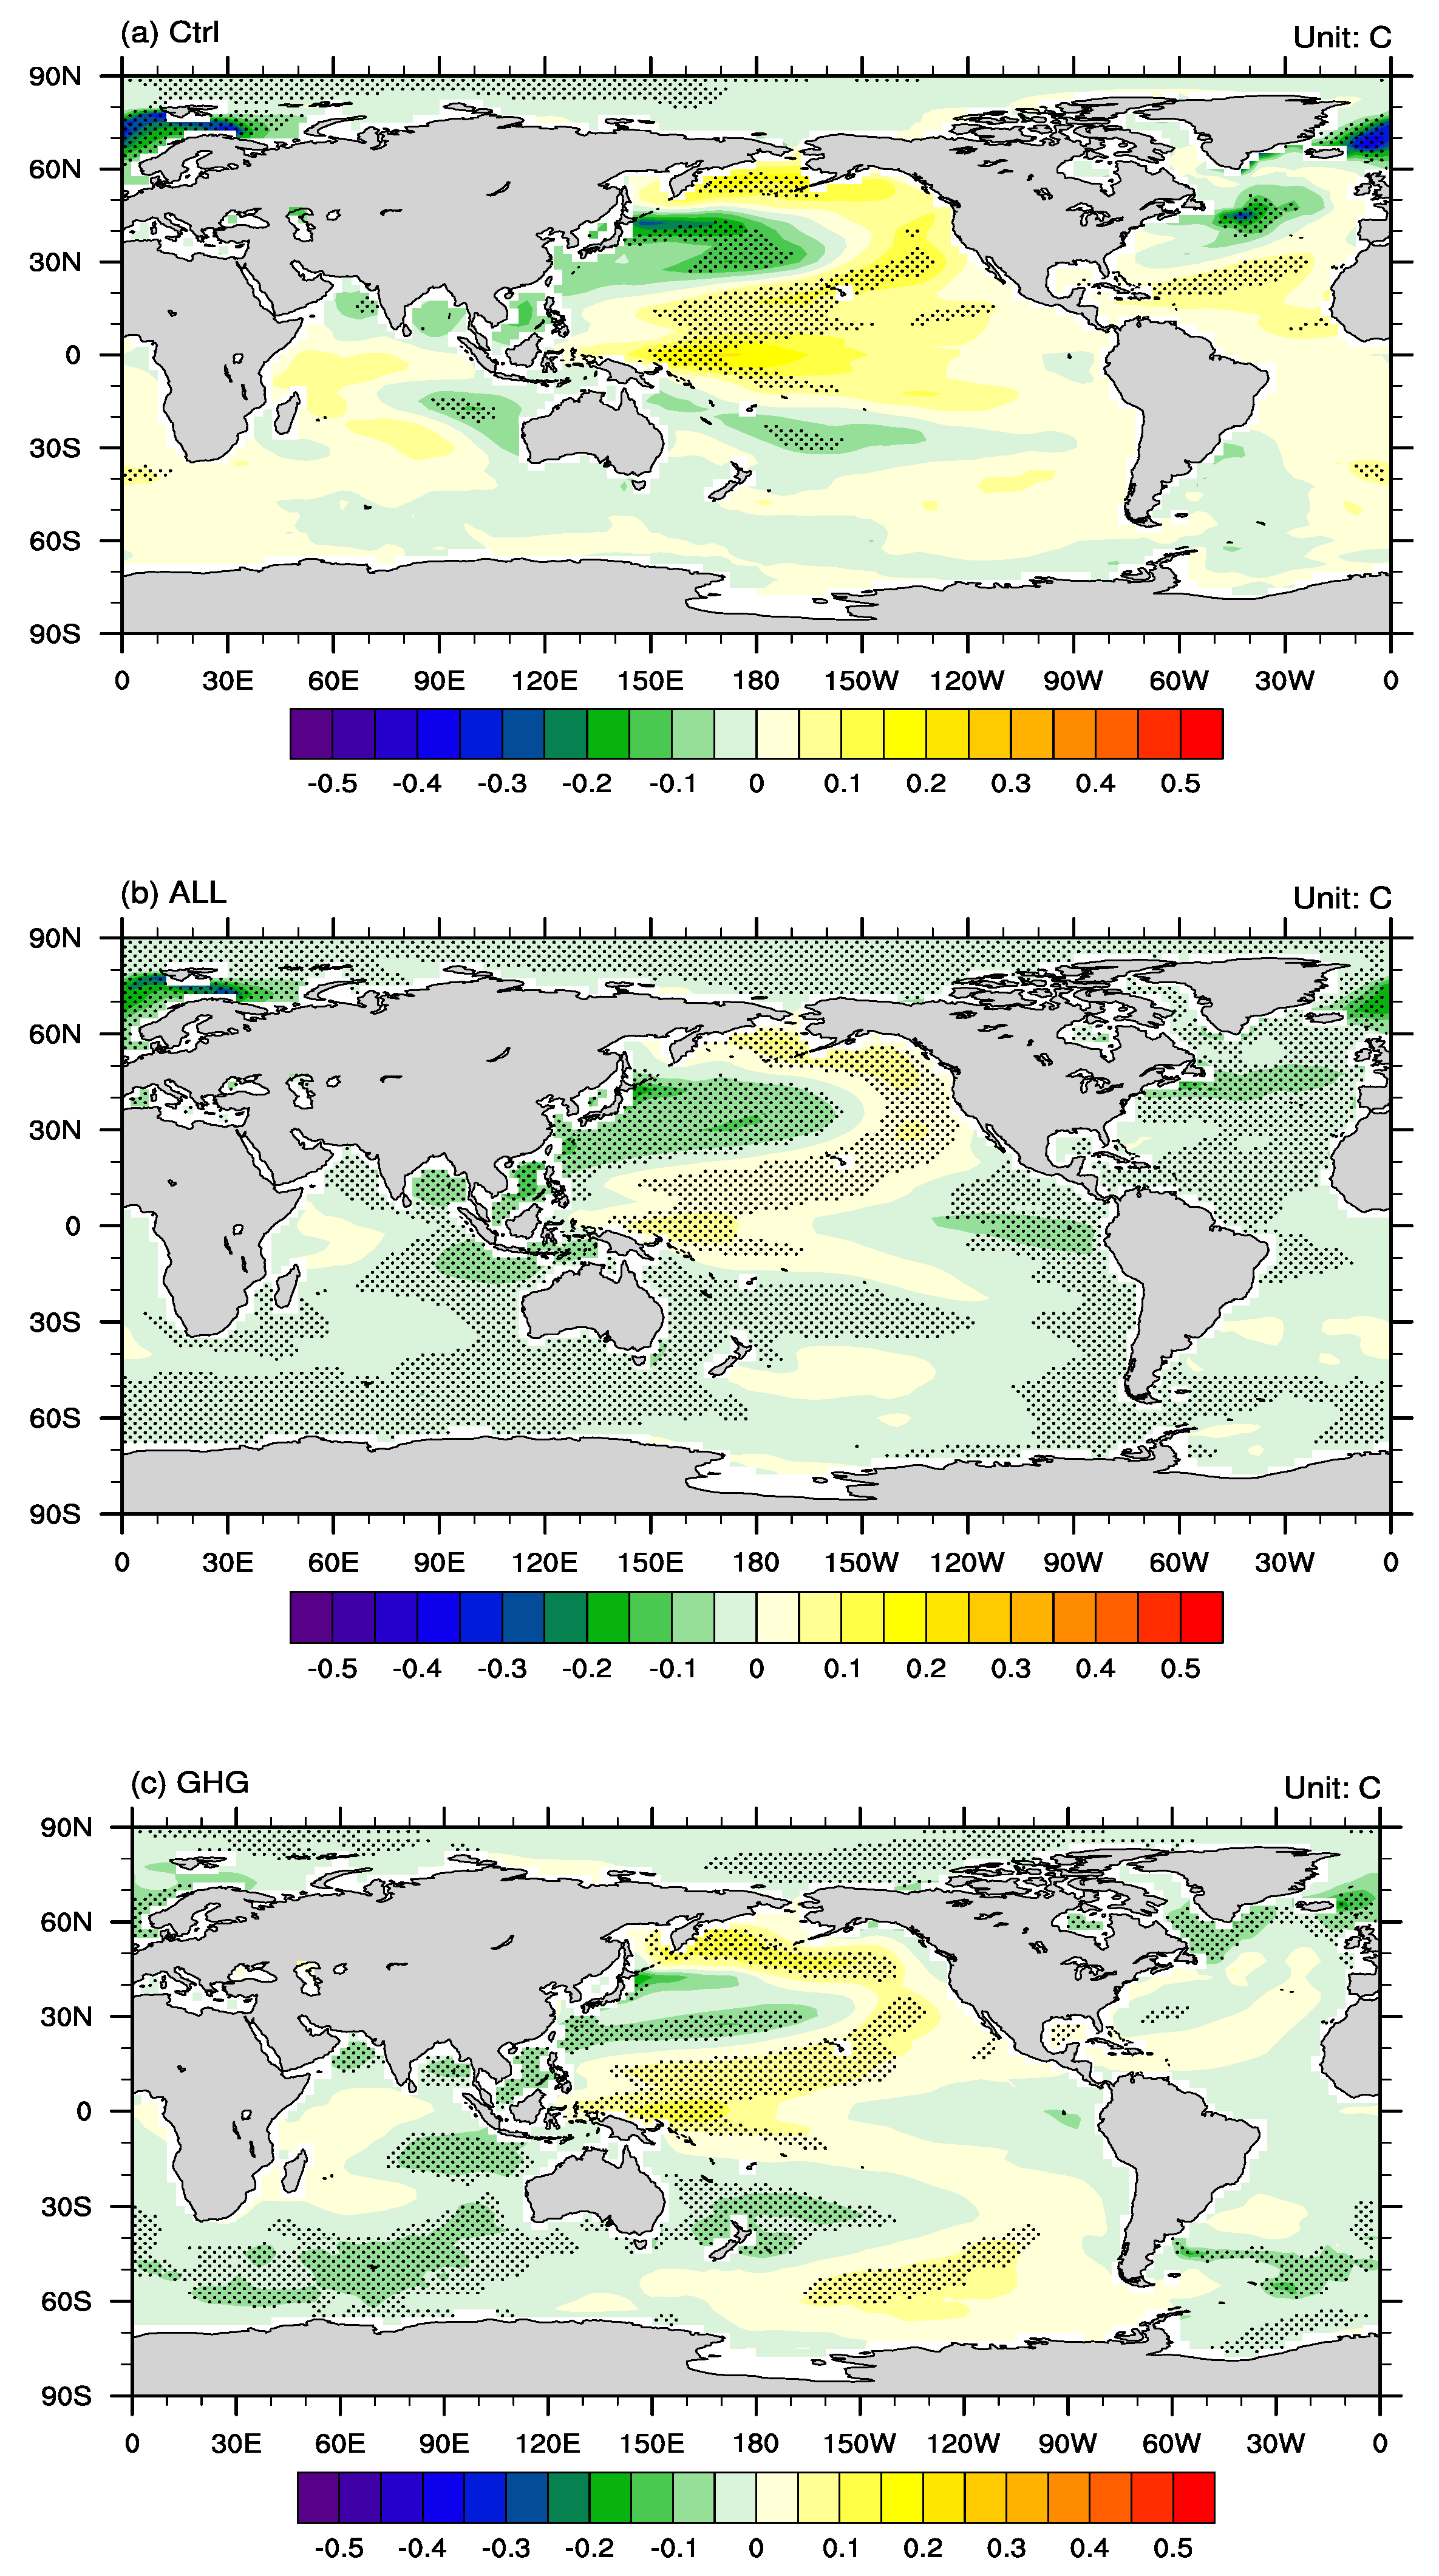
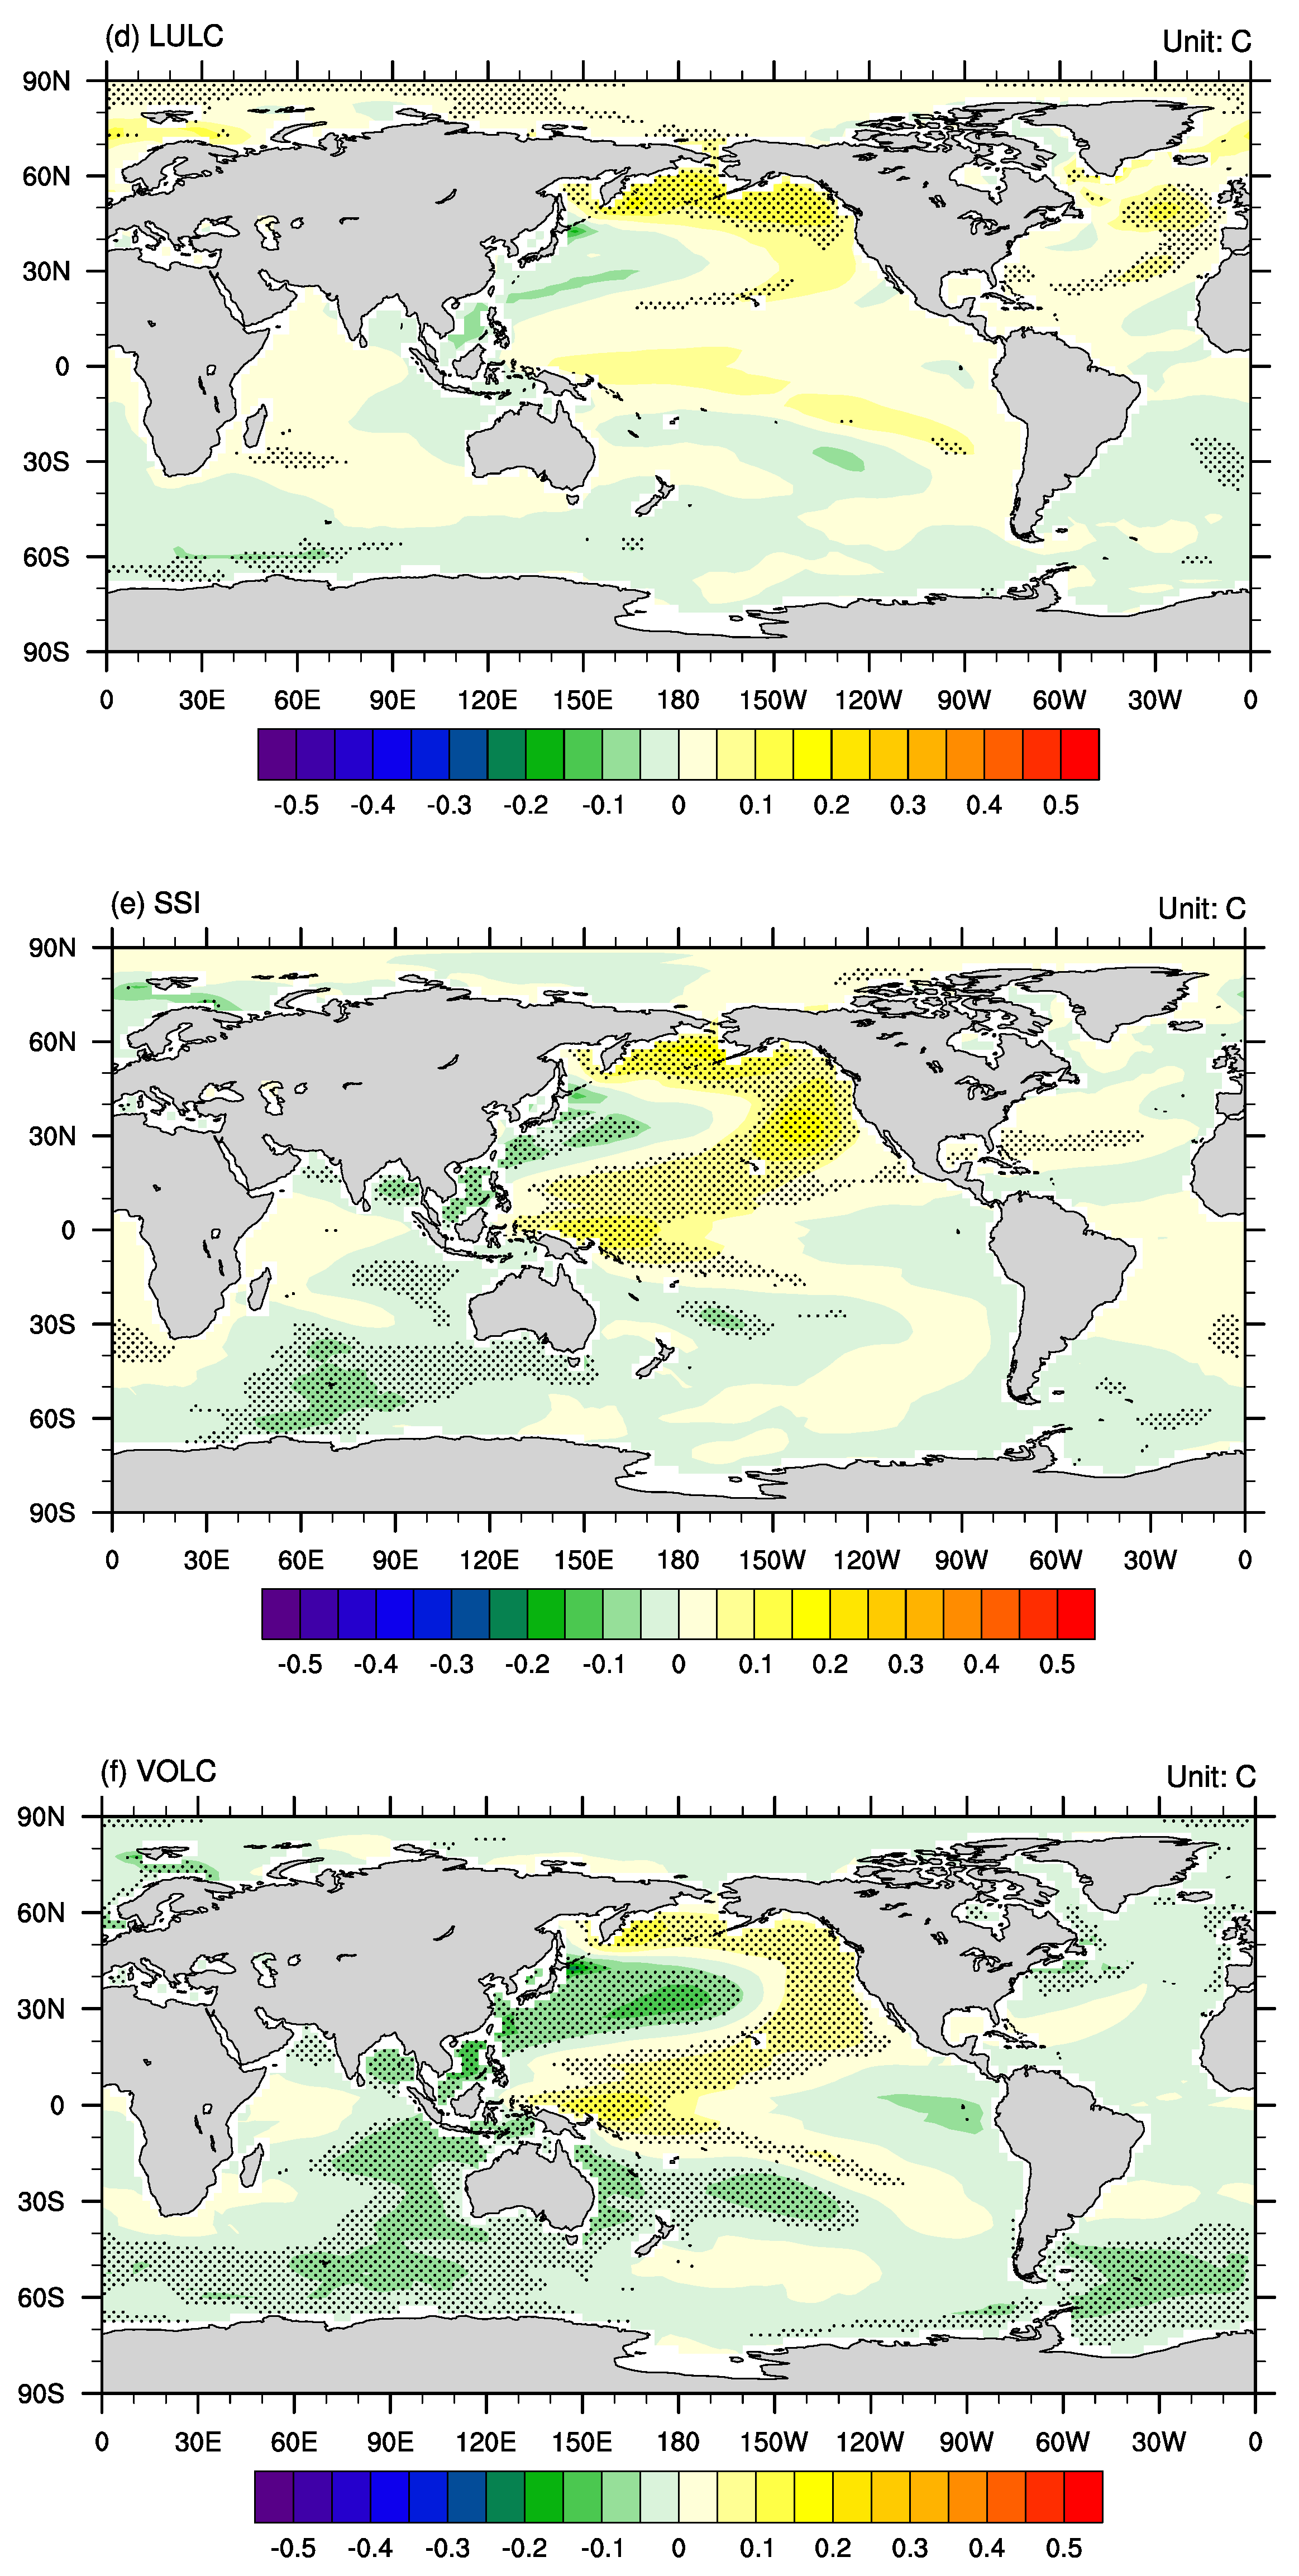
3.4. Influences of External Forcings on Megadroughts

The disagreement in the megadrought timing in the reconstruction data, CTRL run, and forced runs shown in Figure 1 suggests that, similar to previous studies [9], the megadroughts were initially triggered by internal climate variability (the occurrences of megadroughts have little to do with external forcing and primarily originate from internal climate variability). The megadroughts in the CTRL run have shorter durations than those in the reconstruction data (Figure 2a), which indicates that internal climate variability alone may not be able to explain the persistent nature of the megadroughts. Moreover, similar tripolar SST anomalies associated with most megadroughts in both the CTRL and forced runs (Figure 7) can persist through the duration of a megadrought (Figure 9). Thus, the longer megadrought durations found in the forced runs compared to the megadroughts in the CTRL run (Figure 2a) are because the durations of the tripolar SST anomalies derived from the external forcings persist longer in the forced runs (Figure 9).
The averaged magnitudes of the megadroughts from the reconstructed data, CTRL run, and forced runs are all approximately one standard deviation below the averages (Figure 2b,c), indicating that the external forcing likely does not play an important role in driving the mean megadrought severity. Moreover, the larger megadrought spatial extents with significant precipitation decreases in the forced runs compared to the megadroughts in the CTRL run (Figure 3) are due to more significant SST anomalies and corresponding SLP anomalies and 500 hPa geopotential height anomalies in the forced runs (Figure 5, Figure 6 and Figure 7).
Therefore, different from some previous studies that found no compelling evidence for an important and consistent role played by the external forcing in driving the simulated hydroclimate variability on decadal time scales [42], the megadroughts over eastern China are influenced by external forcings, especially for durations and spatial distributions. As found in other studies [58], the external forcings exert influences by changing the variability of the internal climate patterns existing in the CTRL run, such as the tripolar SST anomaly pattern. However, the responses of the climate system to the external forcings are different; for example, the responses to the LULC are usually smaller than the other forcings. Another interesting phenomenon is that for volcanic eruptions that usually show influences on interannual scales, these volcanic eruptions still show some influences on a multi-decadal scale, which is similar to findings of previous studies [36].

4. Conclusions

The CESM model simulated megadroughts usually have similar severity and frequency to megadroughts in the reconstructed data. However, these simulated megadroughts are not temporally synchronous with the megadroughts found in the reconstructed data, indicating that the internal climate variability plays an important role in triggering the simulated megadroughts.
The mean megadrought duration in the CTRL simulation is approximately 6 years (~20%) shorter than the duration of reconstruction data (p < 0.05), while the mean megadrought durations in ALL are closer to those of the reconstruction data, with a difference of approximately 2 years (~7%) and significantly longer than CTRL (p < 0.1). Among the four sensitivity experiments, mean megadrought durations from GHGs, SSI, and VOLC are similar to the ALL, but the mean megadrought durations from LULC are close to those of the CTRL. This indicates that the GHGs, SSI, and VOLC contributed to the megadrought durations. However, the possibility that part of these differences may also result from the inability of the CTRL run to sample megadrought, as well as the single-forcing experiments due to the small number of available iteration, could not be excluded.
When analyzing the mechanisms behind megadroughts, all the megadroughts are coherent with EASM weakening and EAWM strengthening with larger contributions from the EASM weakening, which are consistent with previous studies based on reconstruction data [23]. During EASM season, the megadroughts are characterized by the low-level circulation anomalies associated with the weakening of the western Pacific subtropical high (shown as cyclonic anomalies over the western North Pacific) and the rising pressure in the central eastern China. The circulation anomalies weaken the southwest monsoon over eastern China and thus the moisture transport and convergence over eastern China. During the EAWM season, the megadroughts are characterized by the low-level circulation anomalies associated with strengthening of the Aleutian Low, resulting the rain belt shifting to the south and precipitation decreases over the eastern China.
Another mechanism is the positive SLP anomalies over eastern China, which directly suppress precipitation. These positive SLP anomalies are part of a tripolar SLP pattern with negative SLP anomalies over northeastern and southeastern Asia, which result from a tripolar SST anomaly pattern with negative SST anomalies over the northwestern Pacific and positive SST anomalies over the Bering Sea and western tropical Pacific that are persistent on a multi-decadal scale. This tripolar SST anomaly pattern resembles the observed warm PDO pattern with some differences. This tripolar SST pattern could be a result of model bias.
Although the definition of megadrought used in the current study is based on persistence, which is slightly different from other definitions based on magnitude [2,58], the magnitudes of megadroughts in current study are about one standard deviation that are comparable with those studies. Moreover, when using definitions considering both magnitude and different scales of persistence (decadal to multi-decadal), the dominating mechanisms are similar to the current results (now shown), indicating that the mechanisms found in the current study are robust.
The physical mechanisms identified in this study can contribute to a better understanding of multi-decadal precipitation variability over eastern China, and advance understanding of background megadrought risk in a pre-anthropogenic climate. This study also provide insight about climate patterns in the CESM associated with megadrought in the EASM. Studying how external forcing affects these climate patterns may provide insights into how these patterns could shift under future warming. The external forcings (e.g., GHG slow decreases and volcanic eruptions) can increase the lengths of megadrought through magnifying the large-scale circulation patterns shown in this study. However, under future greenhouse gas driven warming, fast GHG increases may implement some opposite influences on the megadrought, comparing those external forcings under future greenhouse gas driven warming induced by cooling of the climate system, but this hypothesis definitely needs careful examination first.

Supplementary Materials

The following are available online at https://www.mdpi.com/2073-4433/10/1/7/s1, Figure S1: The seasonal cycle of the model simulated monthly precipitation from the CESM-LME. Figure S2: The time series of the simulated EASM season precipitation averaged over eastern China from the CTRL run (a, unit: mm/season), the first member of the ALL experiment (b, unit: mm/season). GHGs experiment (c, unit: mm/season), LULC experiment (d, unit: mm/season), SSI experiment (e, unit: mm/season), and VOLC experiment (f, unit: mm/season) with megadroughts highlighted in gray. The black solid lines indicate the mean values. The green dashed lines indicate the ±1 and ±2 standard deviations. Figure S3: The time series of the simulated non-EASM season precipitation averaged over eastern China from the CTRL run (a, unit: mm/season), the first member of the ALL experiment (b, unit: mm/season), GHGs experiment (c, unit: mm/season), LULC experiment (d, unit: mm/season), SSI experiment (e, unit: mm/season), and VOLC experiment (f, unit: mm/season) with megadroughts highlighted in gray. The black solid lines indicate the mean values. The green dashed lines indicate the ±1 and ±2 standard deviations. Figure S4: Simulated ensemble-averaged EASM precipitation anomalies over eastern China (unit: mm) from the long-term means of the CTRL run (a), ALL runs (b), GHG runs (c), LULC runs (d), SSI runs (e), and VOLC runs (d). Stippling indicates differences significant at the p = 0.05 level based on a t-test. The black rectangle indicates the location of the study region. The blue lines indicate the locations of Yellow River (upper one) and Yangtze River (bottom one). Figure S5: Simulated ensemble-averaged non-EASM precipitation anomalies over eastern China (unit: mm) from the long-term means of the CTRL run (a), ALL runs (b), GHG runs (c), LULC runs (d), SSI runs (e), and VOLC runs (d). Stippling indicates differences significant at the p = 0.05level based on a t-test. The black rectangle indicates the location of the study region. The blue lines indicate the locations of Yellow River (upper one) and Yangtze River (bottom one). Figure S6: Simulated ensemble-averaged wind field anomalies at 850 hPa (unit: m/s) during the EASM season from the long-term means of the CTRL run (a), ALL runs (b), GHG runs (c), LULC runs (d), SSI runs (e), and VOLC runs (f). The black rectangle indicates the location of the study region. The blue lines indicate the locations of Yellow River (upper one) and Yangtze River (bottom one). Figure S7: Simulated ensemble-averaged wind field anomalies at 850 hPa (unit: m/s) during the non-EASM season from the long-term means of the CTRL run (a), ALL runs (b), GHG runs (c), LULC runs (d), SSI runs (e), and VOLC runs (f). Figure S8: Simulated ensemble-averaged sea level pressure anomalies (unit: hPa) during the EASM from the long-term means of the CTRL run (a), ALL runs (b), GHG runs (c), LULC runs (d), SSI runs (e), and VOLC runs (f). Stippling indicates differences significant at the p = 0.05 level based on a t-test. Figure S9: Simulated ensemble-averaged sea level pressure anomalies (unit: hPa) during the non-EASM from the long-term means of the CTRL run (a), ALL runs (b), GHG runs (c), LULC runs (d), SSI runs (e), and VOLC runs (f). Stippling indicates differences significant at the p = 0.05 level based on a t-test. Figure S10: Simulated ensemble-averaged geopotential height anomalies at 500 hPa (unit: gpm) during the EASM season from the CTRL run (a), ALL runs (b), GHG runs (c), LULC runs (d), SSI runs (e), and VOLC runs (f). Stippling indicates differences significant at the p = 0.05 level based on a t-test. For clarity, the ranges of color bars are different. Figure S11: Regression patterns of SLP anomalies (unit: hPa) with respect to SST anomalies over the WT Pacific from the CTRL run. Stippling indicates regression significant at the p = 0.05 level based on a r-test.

Author Contributions

Conceptualization, L.N.; methodology, L.N., K.C., and M.Y.; formal analysis, L.N. and K.C.; investigation, L.N., K.C., M.Y., C.J., and Q.W.; writing—original draft preparation, L.N.; writing—review and editing, J.L., B.W., M.Y.; project administration, J.L.; funding acquisition, L.N.

Funding

This research was jointly supported by the National Key Research and Development Program of China (Grant No. 2016YFA0600401), the National Natural Science Foundation of China (Grant Nos. 41501210, 41420104002, 41671197, and 41631175), the Jiangsu Province Natural Science Foundation (Grant No. BK20150977), the Top-notch Academic Programs Project of Jiangsu Higher Education Institutions (Grant No. PPZY2015B115), the Program of Innovative Research Team of Jiangsu Higher Education Institutions of China and the Priority Academic Development Program of Jiangsu Higher Education Institutions (Grant No. 164320H116).

Acknowledgments

The CESM-LME data were generated by the CESM Paleoclimate Working Group at NCAR. The reconstructed dry-wet index over eastern China was provided by Jingyun Zheng at the Chinese Academy of Sciences.

Conflicts of Interest

The authors declare no conflict of interest.

References

  1. Hartmann, D.L.; Klein Tank, A.M.G.; Rusticucci, M.; Alexander, L.V.; Brönnimann, S.; Charabi, Y.; Dentener, F.J.; Dlugokencky, E.J.; Easterling, D.R.; Kaplan, A.; et al. Observations: Atmosphere and Surface. In Climate Change 2013 the Physical Science Basis: Working Group I Contribution to the Fifth Assessment Report of the Intergovernmental Panel on Climate Change; Cambridge University Press: Cambridge, UK, 2013; pp. 159–254. [Google Scholar]
  2. Ault, T.R.; Cole, J.E.; Overpeck, J.T.; Pederson, G.T.; Meko, D.M. Assessing the risk of persistent drought using climate model simulations and paleoclimate data. J. Clim. 2014, 27, 7529–7549. [Google Scholar] [CrossRef]
  3. Ault, T.R.; Mankin, J.S.; Cook, B.I.; Smerdon, J.E. Relative impacts of mitigation, temperature, and precipitation on 21st-century megadrought risk in the American Southwest. Sci. Adv. 2016, 2, e1600873. [Google Scholar] [CrossRef] [PubMed] [Green Version]
  4. Cook, B.I.; Cook, E.R.; Smerdon, J.E.; Seager, R.; Williams, A.P.; Coats, S.; Stahle, D.W.; Diaz, J.V. North American megadroughts in the Common Era: Reconstructions and simulations. Wiley Interdiscip. Rev. Clim. Chang. 2016, 7, 411–432. [Google Scholar] [CrossRef]
  5. Stevenson, S.; Timmermann, A.; Chikamoto, Y. Stochastically generated North American megadroughts. J. Clim. 2015, 28, 1865–1880. [Google Scholar] [CrossRef]
  6. Ault, T.R.; George, S.S.; Semerdon, J.E.; Coats, S.; Mankin, J.S.; Carrillo, C.M.; Cook, B.I.; Stevenson, S. A robust null hypothesis for the potential causes of megadrought in Western North America. J. Clim. 2018, 31, 3–24. [Google Scholar] [CrossRef]
  7. Seager, R.; Graham, N.; Herweijer, C.; Gordon, A.L.; Kushnir, Y.; Cook, E. Blueprints for Medieval hydroclimate. Quat. Sci. Rev. 2007, 26, 2322–2336. [Google Scholar] [CrossRef] [Green Version]
  8. Herweijer, C.; Seager, R. The global footprint of persistent extra-tropical drought in the instrumental era. Int. J. Climatol. 2008, 28, 1761–1774. [Google Scholar] [CrossRef] [Green Version]
  9. Hoerling, M.; Quan, X.-W.; Eischeid, J. Distinct causes for two principal U.S. droughts of the 20th century. Geophys. Res. Lett. 2009, 36, L19708. [Google Scholar] [CrossRef]
  10. Yang, Q.; Ma, Z.; Fan, X.; Yang, Z.; Xu, Z.; Wu, P. Decadal modulation of precipitation patterns over eastern China by sea surface temperature anomalies. J. Clim. 2017, 30, 7017–7033. [Google Scholar] [CrossRef]
  11. Seager, R.; Kushnir, Y.; Herweijer, C.; Naik, N.; Velez, J. Modeling of tropical forcing of persistent droughts and pluvials over western North America: 1856–2000. J. Clim. 2005, 18, 4065–4088. [Google Scholar] [CrossRef]
  12. Meehl, G.; Hu, A. Megadroughts in the Indian monsoon region and southwest North America and a mechanism for associated multidecadal Pacific sea surface temperature anomalies. J. Clim. 2006, 19, 1605–1623. [Google Scholar] [CrossRef]
  13. Nigam, S.; Guan, B.; Ruiz-Barradas, A. Key role of the Atlantic Multidecadal Oscillation in 20th century drought and wet periods over the Great Plains. Geophys. Res. Lett. 2011, 38, 239–255. [Google Scholar] [CrossRef]
  14. Cook, B.I.; Miller, R.L.; Seager, R. Amplification of the North American “Dust Bowl” drought through human-induced land degradation. Prod. Natl. Acad. Sci. USA 2009, 106, 4997–5001. [Google Scholar] [CrossRef] [PubMed]
  15. Wallace, J.M.; Gutzler, D.S. Teleconnections in the geopotential height field during the Northern Hemisphere winter. Mon. Weather Rev. 1987, 109, 784–812. [Google Scholar] [CrossRef]
  16. Barnston, A.G.; Livezey, R.E. Classification, seasonality, and persistence of low-frequency atmospheric circulation patterns. Mon. Weather Rev. 1987, 115, 1083–1126. [Google Scholar] [CrossRef]
  17. Mantua, N.J.; Hare, S.R.; Zhang, Y.; Wallace, J.M.; Francis, R.C. A Pacific interdecadal climate oscillation with impacts on salmon production. Bull. Am. Meteorol. Soc. 1997, 78, 1069–1079. [Google Scholar] [CrossRef]
  18. Trenberth, K.E. The definition of El Niño. Bull. Am. Meteorol. Soc. 1997, 78, 2771–2777. [Google Scholar] [CrossRef]
  19. Ning, L.; Bradley, R.S. Winter precipitation variability and corresponding teleconnections over the northeastern United States. J. Geophys. Res. Atmos. 2014, 119, 7931–7945. [Google Scholar] [CrossRef] [Green Version]
  20. Ning, L.; Bradley, R.S. Winter climate extremes over the northeastern United States and southeastern Canada and teleconnections with large-scale modes of climate variability. J. Clim. 2015, 28, 2475–2493. [Google Scholar] [CrossRef]
  21. Ning, L.; Bradley, R.S. Influence of eastern Pacific and central Pacific El Niño events on winter climate extremes over the eastern and central United State. Int. J. Climatol. 2015, 35, 4756–4770. [Google Scholar] [CrossRef]
  22. Cook, E.R.; Seager, R.; Cane, M.A.; Stahle, D.W. North American drought: Reconstructions, causes, and consequences. Earth Sci. Rev. 2007, 81, 93–134. [Google Scholar] [CrossRef]
  23. Cook, E.R.; Anchukaitis, K.J.; Buckley, B.M.; D’Arrigo, R.D.; Jacoby, G.C.; Wright, W.E. Asian monsoon failure and megadrought during the last millennium. Science 2010, 328, 486–489. [Google Scholar] [CrossRef] [PubMed]
  24. Zheng, J.; Wang, W.-C.; Man, Q.; Ge, Z.; Zhang, P. Precipitation variability and extreme events in eastern China during the past 1500 years. Terr. Atmos. Ocean. Sci. J. 2006, 17, 579–592. [Google Scholar] [CrossRef]
  25. Zhai, P.; Sun, A.; Ren, F.; Liu, X.; Gao, B.; Zhang, Q. Changes of climate extremes in China. Clim. Chang. 1999, 42, 203–218. [Google Scholar] [CrossRef]
  26. Ren, G.; Wu, H.; Chen, Z. Spatial patterns of change trend in rainfall of China. Quart. J. Appl. Meteorol. 2000, 11, 322–330. (In Chinese) [Google Scholar]
  27. Wang, B.; Ding, Q. Changes in global monsoon precipitation over the past 56 years. Geophys. Res. Lett. 2005, 33, L06711. [Google Scholar] [CrossRef]
  28. Ning, L.; Qian, Y. Interdecadal change of extreme precipitation over South China and its mechanism. Adv. Atmos. Sci. 2009, 26, 109–118. [Google Scholar] [CrossRef]
  29. Zhu, Y.; Liu, Y.; Ma, X.; Ren, L.; Singh, V.P. Drought Analysis in the Yellow River Basin Based on a Short-Scalar Palmer Drought Severity Index. Water 2018, 10, 1526. [Google Scholar] [CrossRef]
  30. Ning, L.; Liu, J.; Wang, B. How does South Asia High influence extreme precipitation over the eastern China? J. Geophys. Res. Atmos. 2017, 122, 4281–4298. [Google Scholar] [CrossRef]
  31. Gu, L.; Chen, J.; Xu, C.-Y.; Wang, H.-M.; Zhang, L. Synthetic Impacts of Internal Climate Variability and Anthropogenic Change on Future Meteorological Droughts over China. Water 2018, 10, 1702. [Google Scholar] [CrossRef]
  32. Li, J.; Wang, B. Origins of the decadal predictability of East Asian land summer monsoon rainfall. J. Clim. 2018, 31, 6229–6243. [Google Scholar] [CrossRef]
  33. Liu, J.; Wang, B.; Wang, H.; Kuang, X.; Ti, R. Forced response of the East Asian summer rainfall over the past millennium: Results from a coupled model simulation. Clim. Dyn. 2011, 36, 323–336. [Google Scholar] [CrossRef]
  34. Liu, J.; Wang, B.; Cane, M.A.; Yim, S.-Y.; Lee, J.-Y. Divergent global precipitation changes induced by natural versus anthropogenic forcing. Nature 2013, 493, 656–659. [Google Scholar] [CrossRef] [PubMed]
  35. Man, W.; Zhou, T.; Jungclaus, J.H. Effects of large volcanic eruptions on global summer climate and east Asian Monsoon changes during the last millennium: Analysis of MPI-ESM simulations. J. Clim. 2014, 27, 7394–7409. [Google Scholar] [CrossRef]
  36. Ning, L.; Liu, J.; Sun, W. Influences of volcanic eruptions on Asian Monsoon over the last 110 years. Sci. Rep. 2017, 7, 42626. [Google Scholar] [CrossRef] [PubMed]
  37. Shen, C.; Wang, W.; Hao, Z.; Gong, W. Exceptional drought events over Eastern China during last five centuries. Clim. Chang. 2007, 85, 453–471. [Google Scholar] [CrossRef]
  38. Peng, Y.; Shen, C.; Cheng, H.; Xu, Y. Modeling of severe persistent droughts over eastern China during the last millennium. Clim. Past 2014, 10, 1079–1091. [Google Scholar] [CrossRef] [Green Version]
  39. Steiger, N.J.; Smerdon, J.E.; Cook, E.R.; Cook, B.I. A reconstruction of global hydroclimate and dynamical variables over the Common Era. Nat. Sci. Data 2018, 5, 180086. [Google Scholar] [CrossRef]
  40. Sordo-Ward, A.; Bejarano, M.D.; Iglesias, A.; Asenjo, V.; Garrote, L. Analysis of Current and Future SPEI Droughts in the La Plata Basin Based on Results from the Regional Eta Climate Model. Water 2017, 9, 857. [Google Scholar] [CrossRef]
  41. Coats, S.; Smerdon, J.E.; Seager, R.; Cook, B.I.; González-Rouco, J.F. Megadroughts in southwestern North America in ECHO-G millennial simulations and their comparison to proxy drought reconstructions. J. Clim. 2013, 26, 7635–7649. [Google Scholar] [CrossRef]
  42. Coats, S.; Smerdon, J.E.; Cook, B.I.; Seager, R. Are simulated megadroughts in the North American Southwest forced? J. Clim. 2015, 28, 124–142. [Google Scholar] [CrossRef]
  43. Otto-Bliesner, B.L.; Brady, E.C.; Fasullo, J.; Jahn, A.; Landrum, L.; Stevenson, S.; Rosenbloom, N.A.; Mai, G. Strand. Climate Variability and Change since 850 C.E.: An Ensemble Approach with the Community Earth System Model (CESM). Bull. Am. Meteorol. Soc. 2016, 5, 735–754. [Google Scholar] [CrossRef]
  44. Wang, B.; Liu, J.; Kim, H.-J.; Webster, P.J.; Yim, S.-Y. Recent change of the global monsoon precipitation (1979–2008). Clim. Dyn. 2012, 39, 1123–1135. [Google Scholar] [CrossRef]
  45. Shi, J.; Yan, Q.; Wang, H. Timescale dependence of the relationship between the East Asian summer monsoon strength and precipitation over eastern China in the last millennium. Clim. Past 2018, 14, 577–591. [Google Scholar] [CrossRef] [Green Version]
  46. Wu, B.; Zhou, T.; Li, T. Impacts of the Pacific-Japan and circumglobal teleconnection patterns on the interdecadal variability of the East Asian summer monsoon. J. Clim. 2016, 29, 3253–3271. [Google Scholar] [CrossRef]
  47. Wu, B.; Lin, J.; Zhou, T. Interdecadal circumglobal teleconnection pattern during boreal summer. Atmos. Sci. Lett. 2016, 17, 446–452. [Google Scholar] [CrossRef] [Green Version]
  48. Wang, B.; Wu, R.; Fu, X. Pacific-East Asian teleconnection: How does ENSO affect East Asian climate? J. Clim. 2000, 13, 1517–1536. [Google Scholar] [CrossRef]
  49. Chen, W.; Feng, J.; Wu, R. Roles of ENSO and PDO in the Link of the East Asian Winter Monsoon to the following Summer Monsoon. J. Clim. 2013, 26, 622–635. [Google Scholar] [CrossRef]
  50. Zhang, L.; Zhou, T. Drought over East Asia: A review. J. Clim. 2015, 28, 3375–3399. [Google Scholar] [CrossRef]
  51. Trenberth, K.E.; Hurrell, J.W. Decadal atmosphere-ocean variations in the Pacific. Clim. Dyn. 2001, 9, 303–319. [Google Scholar] [CrossRef]
  52. Zhang, Y.; Wallace, J.M.; Battisti, D.S. ENSO-like interdecadal variability. J. Clim. 1997, 10, 1004–1020. [Google Scholar] [CrossRef]
  53. NewMan, M.; Alexander, M.A.; Ault, T.R.; Cobb, K.M.; Deser, C.; Di Lorenzo, E.; Mantua, N.J.; Miller, A.J.; Minobe, S.; Nakamura, H.; et al. The Pacific Decadal Oscillation, revisited. J. Clim. 2016, 29, 4399–4427. [Google Scholar] [CrossRef]
  54. Von Storch, H.; Zwiers, F.W. Statistical Analysis in Climate Research; Cambridge University Press: Cambridge, UK, 2001; pp. 1–455. [Google Scholar]
  55. Huybers, K.; Rupper, S.; Roe, G.H. Response of closed basin lakes to interannual climate variability. Clim. Dyn. 2016, 46, 3709–3723. [Google Scholar] [CrossRef]
  56. Matsuno, T. Quasi-geostrophic motions in the equatorial area. J. Meteorol. Soc. Jpn. 1966, 44, 25–43. [Google Scholar] [CrossRef]
  57. Gill, A.E. Some simple solutions for heat-induced tropical circulation. Quart. J. R. Meteorol. Soc. 1980, 106, 447–462. [Google Scholar] [CrossRef]
  58. Stevenson, S.; Overpeck, J.T.; Fasullo, J.; Coats, S.; Parsons, L.; Otto-Bliesner, B.; Ault, T.; Loope, G.; Cole, J. Climate variability, volcanic forcing, and last Millennium hydroclimate extremes. J. Clim. 2018, 31, 4309–4327. [Google Scholar] [CrossRef]
Figure 1. The time series of the reconstructed dry/wet index (a), simulated precipitation averaged over eastern China from the control (CTRL) run ((b), unit: mm/year), the first member of the all-forcing (ALL) experiment ((c), unit: mm/year), greenhouse gas (GHGs) experiment ((d), unit: mm/year), land use and land cover (LULC) experiment ((e), unit: mm/year), spectral solar irradiance (SSI) experiment ((f), unit: mm/year), and volcanic eruption (VOLC) experiment ((g), unit: mm/year) with megadroughts highlighted in gray. The black solid lines indicate the mean values. The green dashed lines indicate the ±1 and ±2 standard deviations.
Atmosphere 10 00007 g001aAtmosphere 10 00007 g001b
Figure 2. Comparison between reconstructed (black circle) and simulated megadrought lengths ((a), unit: day), standardized magnitude ((b), unit: 1), and absolute magnitude ((c), unit: mm) from the control (CTRL) run (black square), all-forcing (ALL) runs (blue), greenhouse gases (GHGs) runs (red), land use and land cover (LULC) runs (green), spectral solar irradiance (SSI) runs (pink), and volcanic eruption (VOLC) runs (orange). The boxes indicate the 25th and 75th percentiles of the distributions. The bars within the boxes indicate mean values. The whiskers indicate the full range of the distributions.
Atmosphere 10 00007 g002aAtmosphere 10 00007 g002b
Figure 3. Simulated ensemble-averaged annual precipitation anomalies during the megadrought years over eastern China (unit: mm) from the long-term means of the Palmer Drought Severity Index (PDSI) (a), control (CTRL) run (b), all-forcing (ALL) runs (c), greenhouse gas (GHG) runs (d), land use and land cover (LULC) runs (e), spectral solar irradiance (SSI) runs (f), spectral solar and volcanic eruption (VOLC) runs (g). Stippling indicates differences significant at the p = 0.05 level based on a t-test. The black rectangle indicates the location of the study region. The blue lines indicate the locations of Yellow River (upper blue line) and Yangtze River (lower blue line).
Atmosphere 10 00007 g003aAtmosphere 10 00007 g003b
Figure 4. Simulated ensemble-averaged annual wind field anomalies at 850 hPa (unit: m/s) during the megadrought years from the long-term means of the control (CTRL) run (a), all-forcing (ALL) runs (b), greenhouse gas (GHG) runs (c), land use and land cover (LULC) runs (d), spectral solar irradiance (SSI) runs (e), and volcanic eruption (VOLC) runs (f).
Atmosphere 10 00007 g004aAtmosphere 10 00007 g004b
Figure 5. Simulated ensemble-averaged annual sea level pressure anomalies (unit: hPa) during the megadrought years from the long-term means of the control (CTRL) run (a), all-forcing (ALL) runs (b), greenhouse gas (GHG) runs (c), land use and land cover (LULC) runs (d), spectral solar irradiance (SSI) runs (e), and volcanic eruption (VOLC) runs (f). Stippling indicates differences significant at the p = 0.05 level based on a t-test.
Atmosphere 10 00007 g005aAtmosphere 10 00007 g005b
Figure 6. Simulated ensemble-averaged annual geopotential height anomalies at 500 hPa (unit: gpm) during the megadrought years from the long-term means of the control (CTRL) run (a), all-forcing (ALL) runs (b), greenhouse gas (GHG) runs (c), land use and land cover (LULC) runs (d), spectral solar irradiance (SSI) runs (e), and volcanic eruption (VOLC) runs (f). Stippling indicates differences significant at the p = 0.05 level based on a t-test. For clarity, the ranges of color bars are different.
Atmosphere 10 00007 g006aAtmosphere 10 00007 g006b
Figure 7. Simulated ensemble-averaged annual SST anomalies (unit: °C) during the megadrought years from the long-term means of the control (CTRL) run (a), all-forcing (ALL) runs (b), greenhouse gas (GHG) runs (c), land use and land cover (LULC) runs (d), spectral solar irradiance (SSI) runs (e), and volcanic eruption (VOLC) runs (f). Stippling indicates differences significant at the p = 0.05 level based on a t-test.
Atmosphere 10 00007 g007aAtmosphere 10 00007 g007b
Figure 8. The third/second rotated empirical orthogonal function (REOF) spatial patterns and principle components of the global sea surface temperature (SST) from control (CTRL) (a,b) and all-forcing (ALL) (c,d) experiments.
Atmosphere 10 00007 g008
Figure 9. The percentages (unit: %) of megadroughts with sea surface temperature (SST) anomalies over the Bering Sea (a), NW Pacific (b), WT Pacific (c), and ET Pacific (d) significantly persisting throughout the entire drought period relative to the total megadrought events. For clarity, the ranges of y-axes are different.
Atmosphere 10 00007 g009
Figure 10. Regression patterns of sea level pressure (SLP) anomalies (ac, unit: hPa) and 500 hPa geopotential height anomalies (df, unit: gpm) with respect to sea surface temperature (SST) anomalies over the Bering Sea (a,d), NW Pacific (b,e) and WT Pacific (c,f) from the control (CTRL) run. Stippling indicates regression significant at the p = 0.05 level based on a r-test.
Atmosphere 10 00007 g010aAtmosphere 10 00007 g010b

