Abstract
Ambient air quality monitoring data and radar tracking sonde data were used to study the atmospheric boundary layer structure (ABLS) and its changing characteristics over Wuhan. The boundary layer structure index (BLSI), which can effectively describe the ABLS, was accordingly developed and its ability to describe the near-surface air quality was analyzed. The results can be summarized as follows. (1) An analysis of the ABLS during seriously polluted cases revealed that the ABLS was usually dry and warm with a small ventilation index (VI); meanwhile, the ABLS during clean cases was usually wet and cold with a large VI. (2) The correlation between the air quality and BLSI at 100~300 m was good and passed the confidence level limit at 99%. Moreover, the correlation coefficient increased with the altitude at 10~250 m and showed a downward trend at 250~500 m. The correlation between the BLSI at 250 m and the ground air quality was the most significant (r = 0.312), indicating that the layer ranging from 0 to 250 m is essential for determining the ground air quality. (3) The BLSI considers both the vertical diffusion capability and horizontal removal capability of the atmosphere. Therefore, it is highly capable of describing the ABLS and the ground air quality.
1. Introduction
China is the fastest-growing country in the world and consequently contains numerous types of industries. As such, most Chinese cities are currently facing serious air pollution issues. For instance, China is presently the largest emitter of black carbon in the world [,]. Wuhan (114° E, 30° N), a megacity in central China, is an important city both politically and economically. In recent years, the air quality of Wuhan has substantially worsened. In particular, the air quality throughout the autumn–winter season (i.e., November through to February of the following year) of 2013 was far worse than that of 2012 and consequently, the pollution of that season drew the attention of both the public and the government.
Data published by the Wuhan Environmental Protection Bureau (http://hbj.wuhan.gov.cn/) show that 563.242 billion cubic meters of industrial emissions were released into the atmosphere over Wuhan in 2013; the data also revealed that the industrial emissions in 2013 had fallen by 6.48% from the previous year. A total of 101,900 tons of sulfur dioxide emissions (down by 3.69% from the previous year) were also released in 2013. The total amount of nitrogen oxide emissions totaled 147,100 tons, which had fallen by 5.58% from the previous year, while the total motor vehicle emissions amounted to 5.00 million tons, which had increased by 3.31% over the previous year. A total of 25,700 tons of smoke (powder) dust were emitted from the city, which had fallen by 2.65% from the previous year and the total amount of motor vehicle smoke (aerosols) dust emissions was 4900 tons, which had fallen by 2.00% from the previous year.
Despite the decrease in pollutant emissions from 2012 to 2013, the air quality of 2013 was objectively worse than that of 2012. According to the Wuhan Environmental Protection Bureau (http://www.whepb.gov.cn/hbKqjcbg/index.jhtml), the number of days in 2013 with good ambient air quality (i.e., with an air quality index (AQI) of less than or equal to 100) over the urban areas of Wuhan reached only 43.8%, which was half of the number of good days observed in 2012. According to the National Ambient Air Quality Standard (NAAQS) of the People’s Republic of China (GB3095-2012), a second-grade standard assessment of the non-compliant items with regard to the ambient air quality over Wuhan in 2013 included nitrogen dioxide, PM10 and PM2.5. The primary pollutant in the ambient air was PM2.5, the annual average concentration of which was 94 , which exceeds the standard by 1.7 times and its daily average compliance rate was only 51.5%.
Therefore, the local atmospheric diffusion conditions and external transportation processes were obviously responsible for the poor 2013 air quality over Wuhan. Two meteorological factors (the vertical diffusion ability and horizontal removal ability of the atmospheric boundary layer (ABL)) primarily affect the air quality [,]. These two factors are mainly determined by the atmospheric stratification stability, which is closely related to near surface inversion and wind. Li et al., [] believed that both atmospheric horizontal transport and vertical diffusion ability should be taken into consideration when evaluating the atmospheric air pollution potential because either of them can cause heavy air pollution. A number of studies have suggested that the ground meteorological factors and the concentrations of pollutants are closely related [,,,].
However, the boundary layer structure is an important factor that must be considered when analyzing air quality [,,]. Previous studies have shown that wind speed and boundary layer height are key variables in analyzing the effect of ABL in the transport of pollutants [,,]; only a few studies have investigated the ABLS and its impact on the air quality in this region []. Accordingly, some studies have examined the relationships between the concentrations of air pollutants and the ABLS [,,,,], revealing intensive ground inversion as an important factor that contributes to poor air quality. Nevertheless, most of the data employed to investigate atmospheric stratification were composed of daily reanalysis data and sounding data, both of which have a low vertical resolution that greatly affects the results of detailed analyses of variations in meteorological elements with the altitude. Three additional variables, namely, the Richardson number Ri [,,], the stable energy EW [] and the convective available potential energy (CAPE) as a measure of the unstable energy [], have been used to study atmospheric stratification stability. It is worth noting that Ri, which considers both thermodynamic and kinetic factors, is considered to be the most effective index for describing low-level atmospheric stability. However, most of the correlation results between Ri and the ground air quality have not been satisfactory []. Likewise, both the CAPE and the EW parameter consider the ability of the boundary layer (BL) atmosphere to diffuse air pollutants from a thermodynamic point of view but does not consider the horizontal removal ability of wind speed. Therefore, many authors have alternatively used the pollution coefficient Pi [,] and ventilation index (VI) [,] to study the relationship between pollution and wind. However, both Pi and consider the ability of the boundary layer atmosphere to diffuse air pollutants from a kinetic point of view and do not consider the vertical diffusion capacity of the BL. None of them (CAPE, EW, Pi, VI) can fully describe the diffusion ability of the boundary layer. Consequently, very few studies have been conducted on air pollution meteorological indexes. A number of authors have used the parameter linking aerosol pollution and meteorological elements (PLAM) meteorological pollution index to analyze the relationships between ground meteorological elements and the concentrations of pollutants [,,,]. However, even though the correlations between the PLAM index and the concentrations of pollutants are very good, the PLAM index shares the same disadvantages as the CAPE and the EW parameter, which is that it cannot describe the ABLS because it utilizes only ground meteorological elements.
As a consequence, this study employed both observational data from meteorological stations and radar tracking sonde data with higher vertical resolutions to study the ABLS and its variation characteristics during seriously polluted days throughout the autumn–winter season (i.e., November through to February of the following year) at Wujiashan (WJS) station, which is in Wuhan, from 2013 to 2015. Based on the advantages and disadvantages of the methods utilized in previous studies, a new boundary layer structure index (BLSI) was developed that incorporated the considerations of both the vertical diffusion ability and the horizontal removal ability of the atmosphere at the boundary layer. Therefore, it can characterize the ABLS and its variation, resulting in a more effective description of changes in the ground air quality.
2. Materials and Methods
2.1. Materials
2.1.1. Ambient Air Quality Data
According to the third revision of the ambient air quality standards (GB3095-2012) published by the Chinese Ministry of Environmental Protection (MEP), AQI refers to the air quality index based on the real-time observation of six air pollutants: SO2, NO2, PM10, CO, O3 and PM2.5. AQI represents the maximum pollution sub index of the concentrations of six individual pollutants (Equations (1) and (2)). Higher values of AQI are associated with poorer air quality for that region. The air pollutant, which has the maximum AQI value, is then defined as the primary pollutant at that time. A “primary pollutant” is identified to measure the air pollutant which is the largest contributor to the air quality degradation.
where Ip is the air quality sub index for air pollutant p; C is the pollutant concentration; denotes the concentration breakpoint that is ≤ C; is the concentration breakpoint that is ≥ C; is the index breakpoint corresponding to ; and denotes the index breakpoint corresponding to .
The grading standard of the air quality was provided by the Environmental Protection Agency of China (Table 1).

Table 1.
Grading standard of air quality.
This study used data from the autumn–winter season (i.e., November through to February of the following year) from 2013 to 2015 to characterize the heavy pollution over Wujiashan (WJS) station in Wuhan, while data throughout the autumn–winter season from 2012 to 2015 were employed to calculate both the correlation between the ground air quality and the BLSI. Note that PM2.5 was first monitored and incorporated by the Wuhan Environmental Protection Bureau into the air quality index (AQI) on 27 December 2012. Therefore, the air pollution index (API) was used to describe the ground air quality before 2013 and the AQI was used to describe the ground air quality after 2013. The hourly data at WJS station (national control point) of both the API and the AQI were provided by the Wuhan Environmental Protection Agency and only API data at 0700 h Local Standard Time (LST) and AQI data at 0700 h LST were used in this paper. Both of these indexes provide non-dimensional, quantitative descriptions of the air quality conditions. The API is constructed from observational data comprising the concentrations of three pollutants: SO2, NO2 and PM10 (GB3095-1996 1996).
2.1.2. Sounding Data
The radar tracking sonde was used for comprehensive observation of high altitude atmosphere. The radar can measure five meteorological variables (i.e., wind direction, wind speed, temperature, atmosphere pressure and relative humidity) when incorporating with a digital electronic sonde. The digital electronic sonde consist of humicap, thermistor and air pressure sensors. The radar tracking sonde measures the wind speed and wind direction by tracking the sounding balloon. The sounding balloon is equipped with a wireless electronic answerer device (abbreviated as a responder). During the measurement, the radar tracking sonde sends an "inquiry signal" to the sounding balloon and the responder sends back an “answer signal.” Based on the time interval between each pair of inquiry and answer signals and the direction of the answer signal, the position of the sounding balloon at every moment can be determined, that is, its linear distance, azimuth and elevation angle from the radar. Then, according to the situation that the sounding balloon floats with the wind, the wind direction and wind speed of each altitude can be calculated. When the sounding balloon is lifted off with the digital electronic sonde, the digital electronic sonde sends out the temperature, atmosphere pressure and relative humidity wireless signal continuously during the ascent and is received by the radar skyline.
The radar tracking sonde data employed in this study were provided by the Wuhan Meteorological Bureau. The observation site was Cihui farm (CHF) station, which is 3 km away from the WJS station. Both the WJS and CHF stations are located in a suburban area without tall buildings and bustling commercial districts and these two stations share similar meteorological conditions. The daily observation times of the radar tracking sonde was 0200/0700/1900 h LST at a vertical resolution of 10 m. The 0200 h data lacked wind direction data. As the long-wave radiation loss before sunrise was the largest and meanwhile, the atmospheric stratification was most stable at this time, atmospheric diffusion conditions at 0700 h LST were usually worse than the atmospheric diffusion conditions at 1900 h LST. Therefore, the 0700 h LST data were chosen to study the ABLS. The observation period in this study ranged from 1 November 2012 to 28 February 2015. Serious quality control processes were applied to the sounding data by the Wuhan Meteorological Bureau prior to their use in this study and therefore, the changes in the wind direction, speed, temperature and humidity with the altitude could be credibly analyzed with the data.
2.2. Method
2.2.1. Proposed Boundary Layer Structure Index (BLSI)
Both the and CAPE consider the ability of the boundary layer (BL) to diffuse air pollutants from a thermodynamic point of view but do not consider the horizontal removal ability of wind speed. The and Pi consider the ability of the boundary layer atmosphere to diffuse air pollutants from a kinetic point of view but do not consider the vertical diffusion capacity of the BL. So neither of them can fully describe the diffusion ability of the boundary layer. Accordingly, a new BLSI capable of describing the ABLS and the variations in the ground air quality was developed:
where is the average wind speed at ground level (0 m) and at (unit is ); represents the average air density at ground level and (unit is kg); L denotes the condensation latent heat value of water vapor (L = 2500.6 ) represents the stable energy from the ground to the height H (unit is ) is the ventilation index (unit is ); and is used to ensure that the BLSI has no units.
Compared with the previously employed parameters and indexes (i.e., the EW and Pi parameters, the CAPE and the PLAM index), the BLSI considers both the vertical diffusion ability of the atmosphere (i.e., EW) and the horizontal removal ability of the boundary layer (i.e., VI) of the atmosphere in the boundary layer, thus, it can describe the diffusion ability of the BL more completely.
2.2.2. Calculation of BLSI
(1) Calculation of the stable energy: An inversion layer usually leads to a stable ABL and makes it difficult for the air pollutants released near the ground to be transported out of the ABL. Compared with inversion layer intensity and thickness, is a good tool to depict the stability of lower air, which includes the stability from the surface to a given altitude H []. Figure 1 shows the diagram for The equation for the stable energy following Shang et al. [] is as follows:
where represents the stable energy (unit is ; Cp is the specific heat capacity at constant pressure (Cp = 1.004 J/Kg/K); g is the gravitational constant of acceleration (g = 9.8 m); and P0 and PH are the atmospheric pressure at the ground and at a height H, respectively. TG is a function of H and h and is calculated by the increasing T with height from H to h (H0 ≤ h ≤ H) at the dry adiabatic lapse rate . T is the detected temperature and TH is the detected temperature at H.
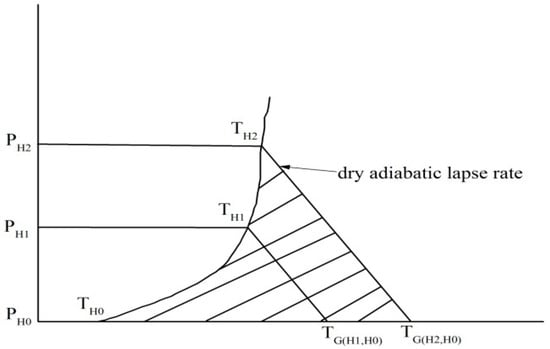
Figure 1.
Diagrams for stable energy. The line TH0-TH1-TH2 is the detected temperature, TG is a function of H and h and is calculated by the increasing T with height from H to h (H0 ≤ h ≤ H) at the dry adiabatic lapse rate . The area of the triangle TH0-TH1-TG(H1,H0) is the stable energy from H0 to H1 and the area of the triangle TH0-TH2-TG(H2,H0) is the stable energy from H0 to H2.
(2) Calculation of the ventilation index (VI): ABL height is a useful parameter to quantify ABL vertical diffusion ability [,]. Convective ABL height is referred to the height where the potential temperature begins to increase and stable ABL height is designated as the height where the first important vertical potential temperature gradient variation takes place []. Ventilation index (VI) provides information about the ventilation ability of the ABL [,]. The equation for the ventilation index following Pasch et al. [] is as follows:
where is the ventilation index (unit is ); HABL is the ABL height; i denotes the level at which the wind speed values are recorded represents the height of level i; and is the wind speed at level i.
(3) Calculation of air density: The air density was calculated as the moist air density using the simplified formula given in Zhao [] and Picard []:
where is the density of moist air (unit is ); P and are the atmospheric pressure and saturated vapor pressure, respectively (units are hPa); T is the detected temperature (unit is K) is the relative humidity (unit is %).
Then, can be calculated using the improved version of Magnus formula found in Dong and Cui []:
where t is the air temperature (unit is °C).
2.2.3. Back Trajectory
The HYbrid Single Particle Langrangian Integrated Trajectory (HYSPLIT4), offered by the National Oceanic and Atmospheric Administration (NOAA), was used to calculate the trajectories []. The model has relatively complete simulation of transport, diffusion and deposition of pollutants which can handle a variety of meteorological element input fields, multiple physical processes and different types of pollutant emission sources (http://www.arl.noaa.gov/HYSPLIT.php). In this study, HYSPLIT-WEB was used to track the air trajectories of WJS station for 72 h, with a view to obtain the qualitative description of the air transport path during the pollution process. Meteorological data input was from the National Centers for Environmental Prediction (NCEP) fields obtained from NOAA, which is available every 3 h with a 1° × 1° spatial resolution. Each trajectory was estimated at 500 m above ground level.
2.2.4. Potential Source Contribution Function (PSCF)
A PSCF method was also used in this study to determine the major contributing areas of PM2.5 in Wuhan. The basis of PSCF is that if a receptor site is located at a particular latitude and longitude, an air parcel back trajectory passing through that location indicates that the material from other sources can be transported through the trajectory to the receptor site [,,,]. It is defined by Equation (9).
where is the number of times that the trajectories passed through the cell (i,j) and is the number of times that the pollutant concentrations were higher at the receptor site than at the set criterion. In this study, the set criteria for PM2.5 of 75 µg/m3 was utilized in the PSCF calculation to identify the potential source areas (PSA) at distances which were more likely to have a larger impact than the local sources. To reduce uncertainties resulting from the effect of the simulation results of the grids with values of that were too small, an empirical weighting coefficient, (Equation (10)) was multiplied to the PSCF [,]. For the case in this study, was the average value () > 0) of the number of all trajectory terminal points in grids:
3. Results
3.1. Analysis of the Vertical Structure of the Boundary Layer during Seriously Polluted Days and Clean Days
A total of 23 seriously polluted cases (AQI ) and 62 clean cases (AQI were selected based on the AQI data acquired from the Wuhan Environment Protection Agency for the autumn–winter season from 2013 to 2015. The average AQI values for seriously polluted and clean cases were 342 and 72, respectively. Furthermore, the primary pollutant during the seriously polluted days was PM2.5. The ground meteorological elements data (temperature, relative humidity and wind velocity) at 0700 h LST on each of the 23 seriously polluted cases and each of the 62 clean cases were obtained from the 0700 h LST radar tracking sonde data (the temperature data, relative humidity data and wind velocity data at the ground). As it was too long to list all the ground meteorological elements data of each of the 23 seriously polluted cases and 62 clean cases in a table, only the summary statistics of the average ground meteorological variables are provided (Table 2). Summary statistics of the average ground meteorological variables showed that there was no significant difference between the seriously polluted and clean cases (Table 2) except that the frequency of calm wind cases. The frequency of calm wind cases on seriously polluted cases was 21.7%, which was much larger than that (4.9%) on the clean cases. Our previous works [] found that the ABLS during polluted cases was dry and warm and had weak low-level wind but a different scenario was seen on clean cases as the boundary layer was observed to be wet and cool and there is a dominance of strong winds. Hu (2015) emphasized the effects of boundary layer on air quality []. Therefore, we focused on the differences between the ABLSs of seriously polluted cases and clean cases.

Table 2.
Average ground meteorological element during seriously polluted cases and clean cases.
Figure 2a illustrates the average curves of the changes in each element with the height at 0700 h LST for the 23 seriously polluted cases. The average boundary layer showed a ground potential temperature of 3.11 °C and a very strong ground inversion with a potential temperature increase rate of 0.93 °C/100 m. Near the ground, relative humidity was 92% and at about 0–500 m, it was reduced to about 55% with a decreasing rate of 7.4%/100 m. At 500–3000 m, relative humidity was reduced to 40% with a decreasing rate of 0.6%/100 m. The wind at the ground was weak, with an average speed of about 1.48 m/s and it increased at an average angle of 30° up to an altitude of 500 m where it attained a speed of about 5.0 m/s. The increasing rate of wind speed at 0–500 m was 0.71 m/s for every 100 m and wind speed increased very slowly at 500–3000 m with an increasing rate of 0.20 m/s for every 100 m. The average VI for the 23 seriously polluted cases was 2451 m2/s. According to the above analysis, the potential temperature, relative humidity and wind speed trends changed significantly at a height of approximately 300 m.
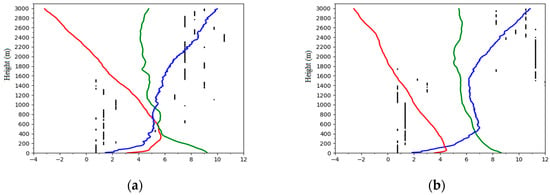
Figure 2.
Averaged vertical structure of the atmosphere for (a) 23 seriously polluted cases, averaged VI = 2451 m2/s, AQI = 342 (b) 62 clean cases, averaged VI = 4925 m2/s, AQI = 72. The line and scatter plot show the profile of temperature (red line, °C), relative humidity (green line, %), wind velocity (blue line, m/s) and wind direction (black scatter points, wind direction is the dominant wind direction at each height, °) for 23 seriously polluted cases and 62 clean cases in autumn-winter seasons (2013–2015). The number on the x-axis is the result after dividing the relative humidity value by 10 and wind direction angle by 30 while temperature and wind speed remain the same.
A different scenario can be seen in the average clean cases as the average AQI was 72, indicating a ‘good’ air quality (Table 1). Figure 2b shows the average curves of the changes in each element with the height at 0700 h LST for the 62 clean days. A very small ground inversion with a thickness of about 50 m was seen in the average ABLS (Figure 2b). Above it, there was a constant temperature drop up to the altitude of 3000 m. A wind speed of about 1.87 m/s was observed at the surface, which increased rapidly (increasing rate 1.1 m/s for every 100 m) to about 7.2 m/s at the altitude of 500 m. Above it, there was a constant wind speed decrease up to an altitude of 1600 m and the wind speed continued to increase to the altitude of 3000 m. Near the ground, relative humidity was 87% and at about 0–500 m, it was reduced to about 65% with a decreasing rate of 4.4%/100 m. At 500–3000 m, relative humidity was reduced to 53% with a decreasing rate of 0.48%/100 m. The average VI for the 23 seriously polluted cases was 4925 m2/s. The changing trends of the relative humidity and wind speed changed obviously at approximately 500 m.
The above analysis showed that on seriously polluted cases, the boundary layer was usually dry, warm and the VI was small. Meanwhile, compared to the seriously polluted cases, during clean cases, the boundary layer was usually wet, cool and the VI was large.
3.2. Analysis of PSA
Figure 3 shows the results of the PSCF analysis of Wuhan in the autumn–winter season from 2013 to 2015 where the pink color represents a high contribution level of PSA while the white color represents the low contribution of PM2.5 concentration. It can be seen that the distribution of the PSCF values showed characteristics of wide area and strong intensity. From the map, higher WPSCF values of above 0.7 were found in Anhui, Jiangsu, Shandong, Henan, Hunan, Jiangxi and prefecture-level cities around Wuhan and more than 0.8 was seen in the north and south of Anhui, northwestern Jiangxi, northeastern Hunan, central Hubei, northern Henan, western Shandong and northwestern Jiangsu. These areas have an important influence on PM2.5 concentration in Wuhan as the trajectories from these areas were the main contributor. Thus, these results signify that, apart from the condition of the ABL, the trans-boundary movement of air masses plays a significant role in determining the air quality of Wuhan City.
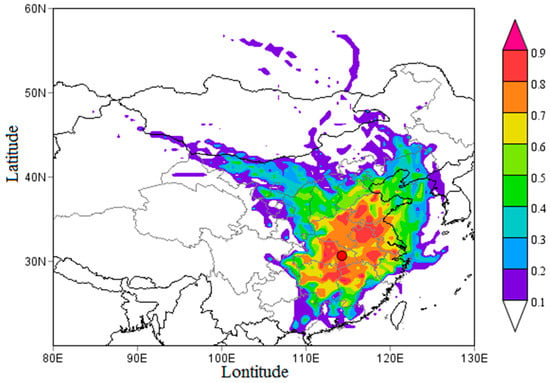
Figure 3.
Spatial distribution of Weight Potential Source Contribution Function (WPSCF) for PM2.5 in autumn-winter season in 2013–2016 in Wuhan (the orange point).
3.3. Analysis of a Heavy Pollution Period
There were frequent heavy pollution periods in the autumn–winter season from 2013 to 2015 in Wuhan, presenting the characteristics of a high concentration of pollutants and long duration. AQI data at 0700 h LST and sounding data at 0700 h LST of a continuous heavy pollution period in the morning were used to study the changing characteristics of the ABL during the occurrence, development and demise of the heavy pollution period.
Figure 4 shows the AQI at 0700 h LST, VI at 0700 h LST and EW at 550 m (the average height of the strongest inversion layer can be seen in Table S1) from 21 January 2014–4 February 2014 where the AQI of 23, 24 January 2014 and 2 February 2014 was higher than 300, indicating that these three days were seriously polluted days. From Figure 4, we can see that there was a negative correlation between VI and AQI (except 29 January 2014), that is, a high (low) VI corresponded to a small (big) AQI. On 29 January 2014, the VI was high, however, the AQI was also big. This was mainly because the AQI of this day was mainly affected by external air pollutants. Figure S1 is the results of 72-h backward trajectory on 29 January 2014 in Wuhan. From Figure S1, we can see that air mass came from the southwest (Hunan province) and then passed through Anhui Province; both provinces are PSAs with high contribution (Figure 3). Thus, this can aggravate the air pollution in Wuhan despite the VI being high, which means that the horizontal removal ability is very strong. There was a positive correlation between EW and AQI but the correlation between EW and AQI during the most polluted period (27–29 January 2014) was not very good, which was because to a large extent, the air quality on these days was also affected by external pollution and VI. We observed that the correlation between VI (EW) and AQI was not very good because VI (EW) does not take the vertical diffusion ability (EW) and external pollution into consideration. The correlation between EW and AQI was not very good because EW does not take the horizontal removal ability of the boundary layer (VI) and trans-boundary movement of the air pollutants into consideration.
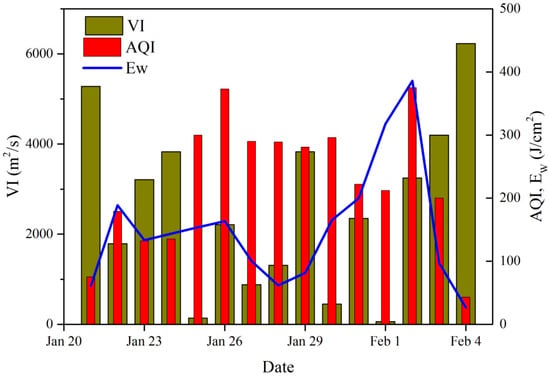
Figure 4.
AQI at 0700 h LST, VI at 0700 h LST and EW at 550 m in the heavy pollution period (21 January 2014–4 February 2014).
Figure 5 shows the sounding curve at 0700 h LST during this heavy pollution period. No inversion layer existed at the low level on 21 January 2014, indicating that the vertical diffusion capacity of atmosphere was very strong in this case and pollutants could be transported easily from the ground to the upper air. Strong winds are an important factor as it can sustain horizontal transportation of the pollutants, which were found within the BL. The VI was 5280 m2/s. Generally, the conditions of the diffusions were good, so the air quality was good on this day (Figure 5a).
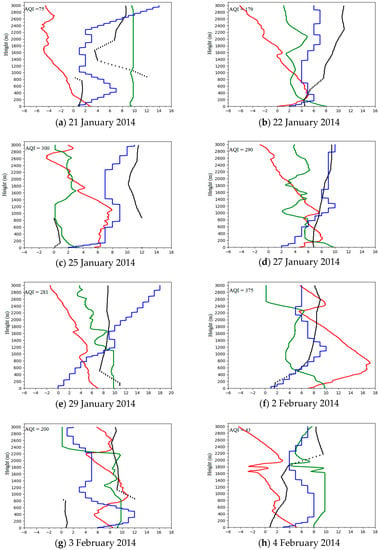
Figure 5.
Vertical structure of the atmosphere for (a) 21 January 2014, Ew = 121.87 (b) 22 January 2014, Ew = 51.51 (c) 25 January 2014, Ew = 121.87 (d) 27 January 2014, Ew = 121.87 (e) 29 January 2014, Ew = 121.87 (f) 2 February 2014, Ew = 121.87 (g) 3 February 2014, Ew = 121.87 (h) 4 February 2014, Ew = 121.87 . The line and scatter points show the profile of temperature (red line, °C), relative humidity (green line, %), wind velocity (blue line, m/s) and wind direction (black scatter plot, °) for the heavy pollution period (21 January 2014–4 February 2014). The number on the x-axis is the result after dividing the relative humidity value by 10 and wind direction angle by 30 while potential temperature and wind speed remain the same.
On 22–24 January 2014, the condition of boundary layer structure changed significantly. There was strong ground inversion with a thickness of 300 m and the temperature within the BL was higher when compared with the condition of 21 January 2014. The average VI on these days was 1487 m2/s, which was much smaller when compared with that on January 21. Vertical dispersion capacity was seen to have weakened significantly as well as the horizontal dispersion capacity. The BL of these days was much drier when compared to that of 22 January 2014. The “warm–dry” feature in the boundary layer persisted. Therefore, the air quality of these days were “slightly polluted” and “moderate polluted” (Figure 5b and Figure S2a,b).
The most significant changes began to be seen from 24 January 2014 at 0700 h LST. A thin ground inversion layer with a thickness of 50 m and a series of suspended inversion layers were seen to have developed at 50–1100 m on January 25 and the thickness of the ground inversion on 26 January 2014 was 500 m. The vertical dispersion capacity had weakened again on 25 and 26 January 2014 when compared to previous days. The dominant wind direction was NE on January 26. Note that the direction of the wind is one of the important factors in determining the air quality at the WJS station as there is a big coal-fired power station in NE (Yangluo Power Station) and the polluted areas are always downwind of the pollutant sources. The average VI of these two days was 1190 m2/s and the horizontal dispersion capacity within the BL was weakened again when compared to previous days. The BL of these two days were still very dry. Therefore, the air quality of these two days were both “seriously polluted” (Figure 5c and Figure S2c).
The next several days share similar characteristics of the ABLS (from 27 January 2014 to 1 February 2014 except for 29 and 31 January 2014): a thin ground inversion layer with a thickness of 50 m and a strong suspended inversion layer at around 100–300 m, small VI (average VI = 390 m2/s) and dry BL. Generally, the conditions of the diffusions were not good for the air pollutants to be diffused. On these days, the wind speed within the ABL height were very small and due to the accumulation effects of the pollutants, it was hard for the pollutants to diffuse, so the air quality of these days remained “heavily polluted” (Figure 5d and Figure S2d,e,g). 31 January 2014 and 2 February 2014 shared similar characteristics of the ABLS: strong intensity of ground inversion layer (almost 2 °C/100 m) and medium VI (average VI was 2800 m2/s) and dry BL. Generally, the conditions of the diffusions were bad. Note that on 2 February 2014, there was dominance of a NE wind at 0–200, which could transport the pollutants from Yangluo Power Station to WJS station. Therefore, the air quality was “heavily polluted” on 31 January 2014 and “seriously polluted” on 2 February 2014 (Figure S2f and Figure 5f).
Compared to the previous days, the condition of the BL on 29 January 2014 and 3 February 2014 looked to be better and it was expected that the air quality would improve but surprisingly, these two days were categorized as ‘heavily polluted’ with an AQI of 281 and 200, respectively. On 29 January 2014, there was no ground inversion layer but had a suspended inversion layer at 900–1100 m. The whole BL was seen to be wet. The VI was 3830 m2/s. Therefore, the vertical dispersion capacity was strong. It is worth noting that there was a calm wind at 0–50 m and the wind speed was low at 0–700 m, so the conditions were not good for the pollutant to be diffused (Figure 5e). Furthermore, as discussed at the beginning of Section 3.3, the air quality on 29 January 2014 was mainly influenced by external air pollutants from Hunan and Anhui Provinces. There was no ground inversion layer and a suspended inversion layer at 400–900 m, with strong winds within the ABL height (VI = 8320 m2/s) on 3 February. The dominant wind direction at 0–900 m was NE, which could transfer the pollutants from Yangluo Power Station to WJS station (Figure 5g). Results from the 72-h back trajectory (Figure S3) showed that winds passed through northern Anhui Province, which was the PSA with the highest contribution (Figure 3). Furthermore, the pollutant accumulation was at its highest level on these two days, partially due to the stability and long lifetime of PM2.5 [].
No inversion layer existed at the low level and only a thin suspended inversion layer existed within the BL on February 4, indicating that the vertical diffusion capacity of the atmosphere was very strong. Strong winds were found within the BL (the wind speed was 8 m/s at 300–900 m). The VI was 6230 m2/s. The BL was wet (Figure 5h). Generally, the conditions of the diffusions were good and both vertical dispersion capacity and the horizontal dispersion capacity were greatly strengthened, so the air quality was good on this day.
3.4. Unconventional Case Study
The and CAPE consider the ability of the BL to diffuse air pollutants from a thermodynamic point of view but do not consider the horizontal removal ability of wind speed. The and Pi consider the ability of the BL to diffuse air pollutants from a kinetic point of view but do not consider the vertical diffusion capacity of the BL. Therefore, neither of them can fully describe the diffusion ability of the BL. Figure 6 is the vertical structure of the atmosphere at 0700 h LST for 18 November 2012 and 11 December 2012. There was a thick and deep ground inversion layer, indicating that the vertical diffusion condition of the atmosphere was good, in which case the air quality was poor. However, it was a clean case because the VI was large in the morning, indicating that the horizontal removal ability was large and the horizontal removal ability of that case played a more important role than the vertical diffusion ability (Figure 6a). The VI was small on 11 December 2012, indicating that the horizontal removal ability of the atmosphere was small, in which case the air quality was poor. However, it was a clean case because the vertical diffusion condition of the atmosphere was good and vertical diffusion ability of the atmosphere played a more important role than the horizontal removal ability of the atmosphere. This, therefore, signifies the need to consider both the inversion layer and VI because neither of them can cause heavy air pollution, which is of the same opinion as Li [].

Figure 6.
Vertical structure of the atmosphere for (a) 18 November 2012, AQI = 98, VI = 4640 m2/s (b) 11 December 2012, AQI = 78, VI = 1960 m2/s. The line and scatter points show the profile of potential temperature (red line, °C), relative humidity (green line, %), wind velocity (blue line, m/s) and wind direction (black scatter plot, c). The number on the x-axis is the result after dividing the relative humidity value by 10 and wind direction angle by 30 while potential temperature and wind speed remain the same.
3.5. The Ability of the BLSI to Describe Changes in the Ground Air Quality
3.5.1. Correlations between the BLSI and the Air Quality
The values of the BLSI were calculated for heights of 10–500 m using the sounding data at 0700 h LST acquired from the Wuhan Meteorological Bureau during the autumn–winter season from 2012 to 2015. Subsequently, the correlations between the BLSI and the ground air quality were analyzed.
Table 3 shows that the correlation between the BLSI and the air quality at each altitude. The correlation passed the confidence level limit at 95% at 10–50 m and 350–400 m. It passed the confidence level limit at 99% at 100–300 m. The correlation coefficient (R) increased with the altitude at 10–250 m and then showed a declining trend at 250–500 m. The correlation between BLSI and air quality at 500 m failed to pass the confidence level limit at 90%. The maximum correlation coefficient was 0.312 at 250 m. Note that, both atmospheric boundary layer and trans-boundary movement of air pollutants play an important role in air quality (BLSI only takes boundary layer structure into consideration). Therefore, boundary layer structure is not the only factor that determines the air quality and what’s more, our research work found out that trans-boundary movement of air pollutants plays a significant role in seriously polluted cases (AQI 300) in autumn-winter season in Wuhan []. Moreover, the research period was in autumn-winter season where the pollution is usually heavy (in our paper only 62 out of 360 sampling days were clean days). Also, the sample size is big so the correlation coefficient may not be that impressive. Taking these factors into consideration, it is reasonable for the correlation not to be that impressive. The observed correlation coefficients suggest that the BLSI is reliable for describing the changes in the ground air quality. This is mainly because the BLSI takes both the vertical diffusion ability and the horizontal removal ability of the atmosphere into consideration, in which case BLSI can completely describe the diffusion ability of the boundary layer.

Table 3.
Correlation (R) between BLSI and ground air quality at each altitude.
3.5.2. The Ability of the BLSI to Describe the ABLS
As shown in Table 3, the correlation coefficients between the BLSI and air quality increased with an altitude between 10 and 250 m and showed a declining trend between 250 and 500 m. These results are consistent with the average curves of the changes in the meteorological elements with the height for 360 days (all sample days) shown in Figure 7. There was a strong ground inversion at 0–250 m where the diffusion ability of the atmosphere at 0–250 m was very weak but became strong at 250 m. In addition, the wind velocity changed from a rapid increase to a more gradual increase with increasing altitude at approximately 250 m, which means that the removal ability for wind at 0–250 m was very strong but became weak at 250 m. Moreover, the trend of the relative humidity changed from rapidly decreasing to slowly decreasing with increasing altitude at approximately 250 m. Thus, the height of approximately 250 m represents an important point at which the trends of temperature, wind velocity and relative humidity changed significantly. The analysis of the vertical structure of the boundary layer during seriously polluted days and clean days showed that the ABLS, especially the boundary layer at lower levels, had a more decisive influence on the ground air quality than the ground meteorological elements. Evidently, the layer at 0–250 m is essential for determining the ground air quality. Therefore, the correlation between the BLSI and the ground air quality was the best at 250 m (Table 2). Moreover, the AQI was calculated based on the ground concentrations of pollutants, the results of which revealed that it is possible that the ability of the BLSI to describe changes in the ground air quality is weakened at higher levels. Therefore, the correlation coefficient between the BLSI and the ground air quality showed a downward trend at 250–500 m; furthermore, it failed to pass the confidence level limit at 90% at 500 m. However, the BLSI takes both thermal and dynamic effects into consideration; that is, according to Equations (6) and (8), the calculation of EW contains the detected temperature profile up to H height, while the calculation of contains the wind velocity profile within the ABL height. Therefore, the BLSI is capable of effectively describing the ABLS.
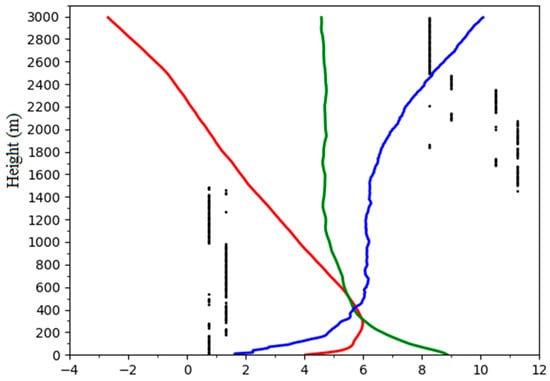
Figure 7.
Averaged vertical structure of the atmosphere for 360 days. The line and scatter plot show the profile of detected temperature (red line, °C), relative humidity (green line, %), wind velocity (blue line, m/s) and wind direction (black scatter points, wind direction is the dominant wind direction at each height, °). The number on the x-axis is the result after dividing the relative humidity value by 10 and wind direction angle by 30 while temperature and wind speed remain the same.
3.6. Case Study
3.6.1. A Seriously Polluted Case
To verify the ability of the BLSI to describe change in the ground air quality and the ABLS on seriously polluted cases, a heavy pollution period in the morning was selected for analysis. A total of 33 cases from 3 January 2013 to 4 February 2013 were chosen. The AQI values for 3 January 2013 and 4 February 2013 were 27 and 42, respectively, indicating that the ground air quality was “excellent”. The rest of the cases were all polluted cases: two cases were “slightly polluted”, five cases were “moderately polluted”, 20 cases were “heavily polluted” and four cases were “seriously polluted”
It is worth noting that the BLSI varies at different heights, thus, a specific height must be selected to determine the BLSI. The analysis of the vertical structure of the boundary layer during seriously polluted days and clean days demonstrates that the ground air quality is determined by the ABLS, particularly at low levels. Generally, the layer from the ground to the top of the inversion represents the low-level ABLS, which primarily determines the ground air quality [,]. Therefore, the BLSI at the top of the inversion layer was chosen to study the relationship between the BLSI and the ground air quality. Multi-layer inversion phenomena will be present in some weather conditions; therefore, only the strongest inversion could be counted []. The statistical results revealed that inversion occurred on 29 cases and that the average height of the top of the inversion layer was approximately 290 m; consequently, the BLSI at 300 m was chosen to study its relationship with the ground air quality. Figure 8 shows the changing sequences of the BLSI at 300 m and the AQI at 0700 h LST with time. Their trends were similar (except 3–12 January 2013), if not nearly identical and the correlation (R = 0.547) passed the confidence level limit at 99%. We divided this pollution period into two stages: the first stage (3–12 January 2013) and the second stage (13 January 2013–4 February 2013). Figure 9 is the cluster mean back trajectory result for this pollution period. It can be seen that the air mass all originated from northern Anhui Province (the PSA with the highest contribution (WPSCF values bigger than 0.8)) in the first stage (Figure 9a). However, in the second stage, the air mass all originated from PSAs with a much lower contribution and 51.04% of the trajectories did not go through the PSAs with the highest contribution (WPSCF values bigger than 0.8) (Figure 9b). Therefore, by comparing the two stages (Figure 9a,b), we can conclude that the external pollution plays a much bigger role in the first stage when compared with the second stage. The BLSI does not take external pollution into consideration, which is why the correlation between the BLSI and AQI in the first stage was worse than that in the second stage.
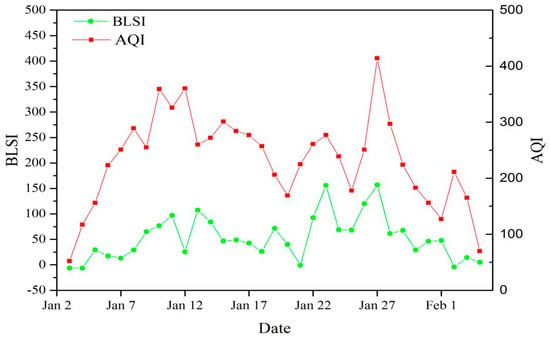
Figure 8.
Changes of sequence of BLSI at 300 m (green line, multiply by 106) and AQI (red line) with time during a seriously polluted period (3 January 2013–4 February 2013).
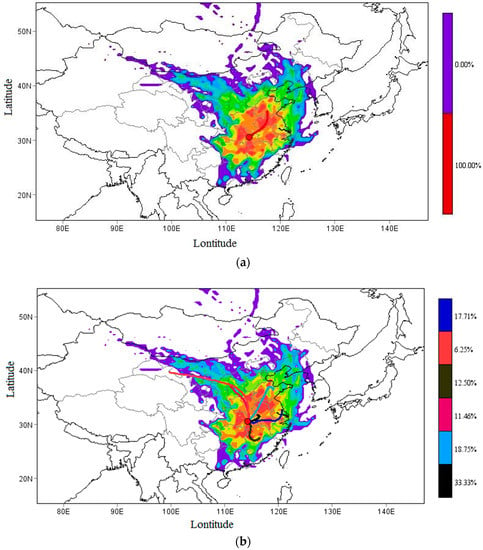
Figure 9.
WPSCF map showing Cluster-mean trajectory result for (a) first stage (3–12 January 2013), (b) second stage (13 January 2013–4 February 2013) of the heavy pollution period in Wuhan (the orange point).
3.6.2. A Relatively Clean Case
A relatively clean period in the morning with a total of 44 cases (18 November 2014–31 December 2014) was selected for analysis. The AQI ranged from 36 to 260. During this period of time, 14 cases were clean, 18 cases were “slightly polluted”, nine cases were “moderately polluted” and three cases were “heavily polluted”.
The BLSI at 300 m was calculated by using the same method as that used in Section 3.6.1 and “a seriously polluted case” was used to determine H. Figure 10 shows the changing sequences of the BLSI at 300 m and the AQI at 0700 h LST with time. Their trends were similar, if not nearly identical and the correlation (R = 0.430) passed the confidence level limit at 99%.
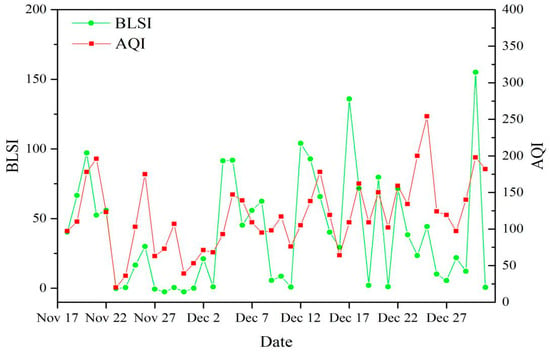
Figure 10.
Changes of sequence of BLSI at 300 m (green line, multiply by 106) and AQI (red line) with time during a relatively clean period (18 November 2014–31 December 2014).
3.6.3. A Forecast Case
To further study the ability of the BLSI to describe the changes in the air quality, its ability to forecast the AQI was also tested as described hereafter. The relatively clean period (18 November 2014–11 December 2014) above was used to build a forecasting model. We used the SPSS software to estimate the curve of the samples (linear, quadratic, cubic, power, logarithm, etc.) and found that the cubic relationship was the best. The regression results demonstrated a cubic relationship between the BLSI and the AQI during heavy pollution (Figure 11), the nonlinear regression model for which is as follows:
where y denotes the AQI; x denotes the BLSI; and a, b, c and d are the regression coefficients.
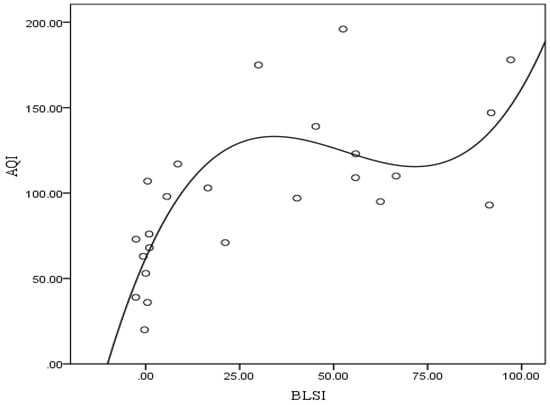
Figure 11.
Regression curve of BLSI (multiply by 103) and AQI.
The regression results showed that the AQI best fit with the BLSI at 300 m with a coefficient of determination (R2) of 0.563 and a model coefficient test value (Sigf) of 0.000 (p < 0.001), indicating that the regression was significant. The regression equation is as follows:
To test the ability of the BLSI to forecast the AQI using this equation, the AQI values at 0700 h LST from 12–31 December 2014 were predicted, the results of which were comparable with the observed AQI values (Figure 12). From Figure 12, it is evident that the ability of the BLSI to predict the AQI was substantial; although there was a small difference in the values, the trend was almost the same and the correlation coefficient between the predicted and observed AQI was R = 0.466, which passed the confidence level limit at 95%. The three major reasons for the differences between the predicted and observed AQI values are as follows. (1) the height of the top of the inversion layer was inconsistent among the different observation periods. Research conducted by [] revealed that the height of the boundary layer varies substantially under different weather conditions. (2) The factors affecting the local ground air quality included the cross-border transportation of external pollution, which was not considered within the BLSI. There were 11 cases when the observed AQI was higher than the predicted AQI and the two maximum value differences occurred on 24 and 25 December 2013. Figure S4a,b are the results of the 72-h back trajectory of 24 and 25 December 2013. Figure S4a,b show that the air mass entered Wuhan via northern (southern) Anhui and both areas are PSAs with the highest contribution (WPSCF values bigger than 0.8). Therefore, the observed AQI was much higher than the predicted AQI for these two cases. (3) The regression model is only a relatively idealized model that cannot fully represent the actual situation for complex atmospheric processes (e.g., due to the nonlinearity of such processes).
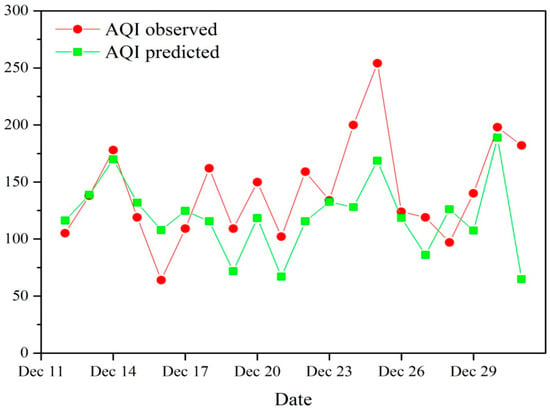
Figure 12.
Prediction ability test of nonlinear regression equation.
4. Conclusions
This study analyzed the characteristics of the ABLS and its relationship with the ground air quality over Wuhan during seriously polluted days and clean days by using ground air quality observation data, ground observation data from meteorological stations and radar tracking sonde data. The findings of this study revealed that the ABLS, especially the characteristics of the low-level boundary layer (particularly the temperature stratification and VI), had great effects on the ground air quality, based upon which the BLSI was developed. The main conclusions from this study are as follows. (1) An analysis of the ABLS during seriously polluted cases showed that the ABLS was dry and warm with a small VI; meanwhile, the ABLS during clean cases was wet and cold with a large VI. (2) The correlation between the air quality and BLSI at 100–300 m was good and passed the confidence level limit at 99%. Moreover, the correlation between the BLSI at 250 m and the air quality was the most significant, indicating that 0–250 m is the key layer that determines the ground air quality. (3) The BLSI considers both the vertical diffusion ability and the horizontal removal ability of the atmosphere in the boundary layer. Therefore, the BLSI can describe the ABLS and the changes in the ground air quality.
Nevertheless, the BLSI does have inadequacies that must be resolved. First, the BLSI does not consider the effects of the external transport of pollutants. Second, the parameter , which was used to remove the units in the BLSI calculation, slightly weakened the correlation between the BLSI and the ground air quality. Therefore, these inadequacies require additional research to further improve the BLSI.
Supplementary Materials
The following are available online at http://www.mdpi.com/2073-4433/10/1/3/s1, Figure S1: Air mass backward trajectory for 72 h at altitudes of 500 m of 29 January 2014. Figure S2. Vertical structure of the atmosphere for (a) 23 January 2014, EW = 229.39 J/cm2 (b) 24 January 2014, EW = 188.63 J/cm2 (c) 26 January 2014, EW = 163.38 J/cm2 (d) 28 January 2014, EW = 61.75 J/cm2 (e) 30 January 2014, EW = 165.22 J/cm2 (f) 31 January 2014, EW = 199.78 J/cm2 (g) 1 February 2014, EW = 317.76 J/cm2 in 2014. The line and scatter plot show the profile of temperature (red line, °C), relative humidity (green line, %), wind velocity (blue line, m/s), and wind direction (black scatter points, °) for the heavy pollution period (21 January 2014–4 February 2014). The number on the x-axis is the result after dividing the relative humidity value by 10 and wind direction angle by 30 while temperature and wind speed remain the same. Figure S3. Air mass backward trajectory for 72 h at altitudes of 500 m of 3 February 2014. Figure S4. Air mass backward trajectory for 72 h at altitudes of 500 m of (a) 24 December 2014 (b) 25 December 2014. Table S1. Statistical results of HABL height and inversion layer.
Author Contributions
Conceptualization, X.Z. and J.Q.; methodology, X.Z., Y.M., S.L., Z.Y. and J.Q.; software, X.Z. and S.L.; formal analysis, X.Z., Y.M., S.L., Z.Y. and J.Q.; resources, S.L. and J.Q.; data curation, Z.Y. and J.Q.; writing—original draft preparation, X.Z., Y.M. and J.Q.; writing—review and editing, X.Z., J.Q. and Y.M.; supervision, J.Q.
Funding
This research was funded by the National Key Research and Development Program of China (2017YFC0212603).
Acknowledgments
Thanks are owed to the Wuhan Meteorological Bureau for providing all of the radar tracking sonde data and ground meteorological data. The first author is grateful to his girlfriend Sheng Yaqing for continuous support during the preparation of this manuscript. Last but not least, we would like to thank three anonymous reviewers for their constructive comments which helped us to improve our work.
Conflicts of Interest
The authors declare no conflict of interest.
References
- Streets, D.G.; Gupta, S.; Waldhoff, S.T.; Wang, M.Q.; Bond, T.C.; Bo, Y. Black carbon emissions in China. Atmos. Environ. 2001, 35, 4281–4296. [Google Scholar] [CrossRef]
- Wang, R.; Tao, S.; Wang, W.; Liu, J.; Shen, H.; Shen, G.; Wang, B.; Liu, X.; Li, W.; Huang, Y. Black Carbon Emissions in China from 1949 to 2050. Environ. Sci. Technol. 2012, 46, 7595–7603. [Google Scholar] [CrossRef]
- Wu, D.; Tie, X.; Li, C.; Ying, Z.; Lau, K.H.; Huang, J.; Deng, X.; Bi, X. An extremely low visibility event over the Guangzhou region: A case study. Atmos. Environ. 2005, 39, 6568–6577. [Google Scholar] [CrossRef]
- Feng, Y.; Wang, A.; Wu, D.; Xu, X. The influence of tropical cyclone Melor on PM10 concentrations during an aerosol episode over the Pearl River Delta region of China: Numerical modeling versus observational analysis. Atmos. Environ. 2007, 41, 4349–4365. [Google Scholar] [CrossRef]
- Li, H.; Wang, B.; Fang, X.; Zhu, W.; Fan, Q.; Liao, Z.; Liu, J.; Zhang, A.; Fan, S. Combined effect of boundary layer recirculation factor and stable energy on local air quality in pearl river delta over southern China. J. Air Waste Manag. Assoc. 2018, 68, 685. [Google Scholar] [CrossRef] [PubMed]
- Xiao, Z.M.; Zhang, Y.F.; Hong, S.M.; Bi, X.H.; Jiao, L.; Feng, Y.C.; Wang, Y.Q. Estimation of the main factors influencing haze, based on a long-term monitoring campaign in Hangzhou, China. Aerosol Air Qual. Res. 2011, 11, 873–882. [Google Scholar] [CrossRef]
- Chu, H.J.; Yu, H.L.; Kuo, Y.M. Identifying spatial mixture distributions of PM2.5 and PM10 in Taiwan during and after a dust storm. Atmos. Environ. 2012, 54, 728–737. [Google Scholar] [CrossRef]
- Kuo, Y.M.; Wang, S.W.; Jang, C.S.; Yeh, N.; Yu, H.L. Identifying the factors influencing PM2.5 in southern Taiwan using dynamic factor analysis. Atmos. Environ. 2011, 45, 7276–7285. [Google Scholar] [CrossRef]
- Kuo, Y.M.; Chiu, C.H.; Yu, H.L. Influences of ambient air pollutants and meteorological conditions on ozone variations in Kaohsiung, Taiwan. Stoch. Environ. Res. Risk Assess. 2015, 29, 1037–1050. [Google Scholar] [CrossRef]
- Wu, M.; Wu, D.; Fan, Q.; Wang, B.M.; Li, H.W.; Fan, S.J. Observational studies of the meteorological characteristics associated with poor air quality over the Pearl River Delta in China. Atmos. Chem. Phys. 2013, 13, 10755–10766. [Google Scholar] [CrossRef]
- Hu, X.M.; Ma, Z.Q.; Lin, W.; Zhang, H.; Hu, J.; Wang, Y.; Xu, X.; Fuentes, J.D.; Xue, M. Impact of the Loess Plateau on the atmospheric boundary layer structure and air quality in the North China Plain: A case study. Sci. Total Environ. 2014, 499, 228–237. [Google Scholar] [CrossRef] [PubMed]
- Qu, W.; Wang, J.; Zhang, X.; Wang, Y.; Gao, S.; Zhao, C.; Sun, L.; Zhou, Y.; Wang, W.; Liu, X. Effect of weakened diurnal evolution of atmospheric boundary layer to air pollution over eastern China associated to aerosol, cloud—ABL feedback. Atmos. Environ. 2018, 185, 168–179. [Google Scholar] [CrossRef]
- Zhang, Y.; Jia, X.W.; Yang, X.; Wang, S.G.; Cheng, Y.F.; Yang, L.; Xiao, D.H. Characteristics of air pollution and its relationship with meteorological parameters in typical representative cities of China. J. Meteorol. Environ. 2017, 33, 70–79. [Google Scholar]
- Mbululo, Y.; Qin, J.; Yuan, Z.X. Evolution of atmospheric boundary layer structure and its relationship with air quality in Wuhan, China. Arab. J. Geosci. 2017, 10, 477. [Google Scholar] [CrossRef]
- Quan, J.; Tie, X.; Zhang, Q.; Liu, Q.; Li, X.; Gao, Y.; Zhao, D. Characteristics of heavy aerosol pollution during the 2012–2013 winter in Beijing, China. Atmos. Environ. 2014, 88, 83–89. [Google Scholar] [CrossRef]
- Fan, S.J.; Fan, Q.; Yu, W.; Luo, X.Y.; Wang, B.M.; Song, L.L.; Leong, K.L. Atmospheric boundary layer characteristics over the Pearl River Delta, China, during the summer of 2006: Measurement and model results. Atmos. Chem. Phys. Discuss. 2011, 11, 681–687. [Google Scholar] [CrossRef]
- Qiang, Z.; Hongyu, L.I. A Study of the Relationship between Air Pollutants and Inversion in the ABL over the City of Lanzhou. Adv. Atmos. Sci. 2011, 28, 879–886. [Google Scholar]
- Bruine, M.D.; Apituley, A.; Donovan, D.P.; Baltink, H.K.; Haij, M.J. De Pathfinder: Applying graph theory to consistent tracking of daytime mixed layer height with backscatter lidar. Atmos. Meas. Tech. 2017, 10, 1–26. [Google Scholar] [CrossRef]
- Wei, J.; Tang, G.; Zhu, X.; Wang, L.; Liu, Z.; Cheng, M.; Münkel, C.; Li, X.; Wang, Y. Thermal internal boundary layer and its effects on air pollutants during summer in a coastal city in North China. J. Environ. Sci. 2017, 70, 37–44. [Google Scholar] [CrossRef]
- Dong, X.; Fu, J.S.; Zhu, Q.; Sun, J.; Tan, J.; Keating, T.; Sekiya, T.; Sudo, K.; Emmons, L.; Tilmes, S.; et al. Long-range Transport Impacts on Surface Aerosol Concentrations and the Contributions to Haze Events in China: An HTAP2 Multi-Model Study. Atmos. Chem. Phys. 2018, 1–33. [Google Scholar]
- Desaubies, Y.; Smith, W.K. Statistics of Richardson Number and Instability in Oceanic Internal Waves. J. Phys. Oceanogr. 1982, 12, 1245–1259. [Google Scholar] [CrossRef]
- Grachev, A.A.; Andreas, E.L.; Fairall, C.W.; Guest, P.S.; Persson, P.O.G. The Critical Richardson Number and Limits of Applicability of Local Similarity Theory in the Stable Boundary Layer. Bound.-Layer Meteorol. 2013, 147, 51–82. [Google Scholar] [CrossRef]
- Molinari, J.; Duran, P.; Vollaro, D. Low Richardson Number in the Tropical Cyclone Outflow Layer. J. Atmos. Sci. 2014, 71, 3164–3179. [Google Scholar] [CrossRef]
- Shang, K.; Cun, D.A.; You, F.U.; Yang, D. The Stable Energy in Lanzhou City and the Relations between Air Pollution and It. Plateau Meteorol. 2001, 20, 76–81. [Google Scholar]
- Murugavel, P.; Pawar, S.D.; Gopalakrishnan, V. Trends of Convective Available Potential Energy over the Indian region and its effect on rainfall. Int. J. Climatol. 2012, 32, 1362–1372. [Google Scholar] [CrossRef]
- Wang, S.; Qi, B. The Characteristics of Wind and Its Influence on the Air Pollution in the Atmospheric Boundary Layer of the Urban Districts of Lanzhou in Cold Half Year. J. Lanzhou Univ. 1997, 33, 97–105. [Google Scholar]
- Xu, Y.; Zhang, C.; Wang, Q.; Centre, H.C. An Analysis of Relationship between Surface Layer Wind Characteristics and Atmospheric Pollution. Shanghai Environ. Sci. 2013, 5, 216–220. [Google Scholar]
- Ashrafi, K.; Shafie-Pour, M.; Kamalan, H. Estimating Temporal and Seasonal Variation of Ventilation Coefficients. Int. J. Environ. Res. 2009, 3, 637–644. [Google Scholar]
- Iyer, U.S.; Raj, P.E. Ventilation coefficient trends in the recent decades over four major Indian metropolitan cities. Proc. Indian Acad. Sci. Earth Planet. Sci. 2013, 122, 537–549. [Google Scholar] [CrossRef]
- Wang, J.; Wang, Y.; Liu, H.; Yang, Y.; Zhang, X.; Li, Y.; Zhang, Y.; Deng, G. Diagnostic identification of the impact of meteorological conditions on PM2.5 concentrations in Beijing. Atmos. Environ. 2013, 81, 158–165. [Google Scholar] [CrossRef]
- Yang, Y.; Wang, J.; Gong, S.; Zhang, X.; Wang, H.; Wang, Y.; Wang, J.; Li, D.; Guo, J. PLAM—A meteorological pollution index for air quality and its applications in fog-haze forecasts in north China. Atmos. Chem. Phys. 2016, 15, 9077–9106. [Google Scholar] [CrossRef]
- Zhang, X.Y.; Wang, J.Z.; Wang, Y.Q.; Liu, H.L.; Sun, J.Y.; Zhang, Y.M. Changes in chemical components of aerosol particles in different haze regions in China from 2006 to 2013 and contribution of meteorological factors. Atmos. Chem. Phys. 2015, 15, 12935–12952. [Google Scholar] [CrossRef]
- Zhong, J.; Zhang, X.; Wang, Y.; Sun, J.; Zhang, Y.; Wang, J.; Tan, K.; Shen, X.; Che, H.; Zhang, L.; et al. Relative Contributions of Boundary-Layer Meteorological Factors to the Explosive Growth of PM2.5 during the Red-Alert Heavy Pollution Episodes in Beijing in December 2016. J. Meteorol. Res. 2017, 31, 809–819. [Google Scholar] [CrossRef]
- Qu, Y.; Han, Y.; Wu, Y.; Gao, P.; Wang, T. Study of PBLH and Its Correlation with Particulate Matter from One-Year Observation over Nanjing, Southeast China. Remote Sens. 2017, 9, 668. [Google Scholar] [CrossRef]
- Dupont, E.; Menut, L.; Carissimo, B.; Pelon, J.; Flamant, P. Comparison between the atmospheric boundary layer in Paris and its rural suburbs during the ECLAP experiment. Atmos. Environ. 1999, 33, 979–994. [Google Scholar] [CrossRef]
- Pasch, A.N.; Macdonald, C.P.; Gilliam, R.C.; Knoderer, C.A.; Roberts, P.T. Meteorological characteristics associated with PM2.5 air pollution in Cleveland, Ohio, during the 2009–2010 Cleveland Multiple Air Pollutants Study. Atmos. Environ. 2011, 45, 7026–7035. [Google Scholar] [CrossRef]
- Zhao, S.H. Understanding of the method for calculating the density of dry and wet air. Hebei Coal. 1999, 3, 57–58. [Google Scholar]
- Picard, R.S. Revised formula for the density of moist air CIPM-2007. Metrologia 2008, 45, 149. [Google Scholar] [CrossRef]
- Dong, S. Analysis of calculating formula and improvement of empirical formula for saturation vapour pressure. Q. J. Appl. Meteorol. 1992, 3, 501–508. [Google Scholar]
- Stein, A.F.; Draxler, R.R.; Rolph, G.D.; Stunder, B.J.B.; Cohen, M.D.; Ngan, F. NOAA’s HYSPLIT Atmospheric Transport and Dispersion Modeling System. Bull. Am. Meteorol. Soc. 2016, 96, 2059–2077. [Google Scholar] [CrossRef]
- Zeng, Y.; Hopke, P.K. A study of the sources of acid precipitation in Ontario, Canada. Atmos. Environ. 1989, 23, 1499–1509. [Google Scholar] [CrossRef]
- Polissar, A.V.; Hopke, P.K.; Paatero, P.; Kaufmann, Y.J.; Hall, D.K.; Bodhaine, B.A.; Dutton, E.G.; Harris, J.M. The aerosol at Barrow, Alaska: Long-term trends and source locations. Atmos. Environ. 1999, 33, 2441–2458. [Google Scholar] [CrossRef]
- Wang, Y.Q.; Zhang, X.Y.; Draxler, R.R. TrajStat: GIS-based software that uses various trajectory statistical analysis methods to identify potential sources from long-term air pollution measurement data. Environ. Model. Softw. 2009, 24, 938–939. [Google Scholar] [CrossRef]
- Hu, X.M. Boundary Layer (Atmospheric) and Air Pollution|Air Pollution Meteorology. Encycl. Atmos. Sci. 2015, 1, 227–236. [Google Scholar]
- Lyu, X.P.; Wang, Z.W.; Cheng, H.R.; Zhang, F.; Zhang, G.; Wang, X.M.; Ling, Z.H.; Wang, N. Chemical characteristics of submicron particulates (PM1.0) in Wuhan, Central China. Atmos. Res. 2015, 161, 169–178. [Google Scholar] [CrossRef]
- Zheng, X.; Qin, J.; Liang, S.W. Effects of easterly small winds onheavy pollution periodsin autumn-winter in Wuhan, China. J. Nanjing Univ. Inf. Sci. Technol. 2018, 5, 536–546. [Google Scholar]
- Bian, L.G. Observational Study of Wind and Temperature Profiles of Urban Boundary Layer in Beijing Winter. Q. J. Appl. Meteorlolgy 2002, 13, 13–25. [Google Scholar]
- Zhang, Y.; Liu, S.; Ju, L.I.; Wang, Y. Relationship between PM10 Mass Concentration and Bulk Richardson Number in Beijing. Acta Sci. Nat. Univ. Pekin. 2009, 46, 192–198. [Google Scholar]
© 2018 by the authors. Licensee MDPI, Basel, Switzerland. This article is an open access article distributed under the terms and conditions of the Creative Commons Attribution (CC BY) license (http://creativecommons.org/licenses/by/4.0/).