Article

Effects of the Convective Triggering Process in a Cumulus Parameterization Scheme on the Diurnal Variation of Precipitation over East Asia

1
Korea Institute of Atmospheric Prediction Systems, Seoul 07071, Korea
2
Korea Polar Research Institute, Incheon 21990, Korea
*
Author to whom correspondence should be addressed.
Atmosphere 2019, 10(1), 28; https://doi.org/10.3390/atmos10010028
Submission received: 27 November 2018 / Revised: 7 January 2019 / Accepted: 8 January 2019 / Published: 12 January 2019
(This article belongs to the Section Meteorology)

Abstract

:
Effects of the convective triggering process in a cumulus parameterization scheme on the diurnal variation of precipitation over East Asia are examined using a regional climate model. Based on a cloud-resolving simulation showing the irrelevance of convective inhibition once convection is initiated and the sensitivity experiments to trigger conditions, the triggering process in the simplified Arakawa-Schubert (SAS) convection scheme is modified to use different convective initiation and termination conditions. The diurnal variation of precipitation frequency with the modified triggering process becomes in phase with the observed one, leading to a delayed afternoon peak in precipitation rate that is in better agreement with the observation. However, the bias in the phase of precipitation intensity is not resolved and the bias of excessive precipitation increases, indicating that adequate representation of not only the triggering process but also other moist convective processes that determine the strength of convection is required for further improvement in the simulation of the diurnal variation of precipitation.

1. Introduction

The diurnal variation of precipitation is one of the most important measures used to evaluate model performance in simulating precipitation, but has not been sufficiently well simulated by most current global and regional models. While observations generally show the diurnal peak of precipitation in the late afternoon over land areas, models tend to produce the daily maximum precipitation earlier and with an overestimated amount (e.g., [1,2]). Because the diurnal variation of precipitation involves many coupled physical processes such as surface exchange, turbulence, and convection and cloud-radiation interactions [2], the deficiencies of the model in reproducing the diurnal variation of precipitation are mainly attributed to uncertain and incomplete parameterization of physical processes and their interactions. Previous modeling studies have indicated a high sensitivity of the simulation of the diurnal variation of precipitation over land especially to cumulus parameterization schemes in terms of both phase and amplitude (e.g., [3,4,5]). By performing a series of physics sensitivity experiments, Koo and Hong (2010) [3] showed that the phase appears to be modulated by moist convective processes, while the amplitude is more strongly controlled by boundary layer processes. Gianotti et al. (2012) [6] pointed out that the main driver for the errors in reproducing the observed diurnal rainfall cycle is the atmospheric part of the model and not the land surface scheme.
Several recent studies have shown that a more realistic representation of moist convective processes (i.e., triggering process, cloud model, and closure method) can lead to an improvement in the simulated diurnal variation of precipitation. For example, Chao (2013) [7] developed a catastrophe-concept-based cumulus parameterization, in which the onset and termination of convection have different criteria and showed an improvement in the precipitation diurnal cycle over relatively flat land in a general circulation model. His idea is based on a cloud-resolving simulation that shows that convection is prevented until convective inhibition (CIN) becomes very small, but that once started, an increase in CIN presents no obstacle for convection to continue to exist. Note that the development of deep convection accompanies an increase of CIN in the afternoon because convective downdrafts transport cold and dry air to the boundary layer [8]. Stratton and Stirling (2012) [9] implemented an entrainment rate that is modified to take into account the inverse relationship between entrainment and the lifting condensation level (see their Equation (7) for the functional form), derived from idealized cloud-resolving model simulation. In their study, the representation of the diurnal cycle in a climate model is improved with little degradation of the mean fields. A marked improvement in the diurnal phase over land was also achieved by taking account of rapidly varying boundary forcing in a diagnostic convective available potential energy (CAPE) closure [10], or by using a closure based on the lifting power from subcloud processes, including boundary-layer thermals and cold pools [11].
This study aims to determine how much the simulation of the diurnal variation of precipitation can be changed by modifying the convective triggering process. The triggering process in a cumulus parameterization scheme is modified to use different convective initiation and termination conditions based on the concept proposed by Chao (2013) [7] and sensitivity experiments to trigger conditions. Then, its effects on the diurnal variation of precipitation over the East Asian land area are examined using a regional climate model. In Section 2, the model used in this study and the experimental design are described. In Section 3, the performance of a cumulus parameterization scheme in simulating the diurnal variation of precipitation is assessed, and the sensitivity to modification of the convective triggering process is investigated. A summary as well as conclusions follow in Section 4.

2. Model and Experimental Design

The model used in this study is the Advanced Research Weather Research and Forecasting (WRF-ARW) version 3.6 [12]. The physics parameterization schemes employed are the updated version of the simplified Arakawa-Schubert (SAS) convection scheme [13,14,15], the WRF single-moment 3-class (WSM3) microphysics scheme [16], a simple cloud-interactive shortwave radiation scheme [17], a rapid radiative transfer model (RRTM) for longwave radiation [18], the Yonsei University (YSU) boundary-layer scheme [19], and the unified Noah land surface model [20]. In the SAS convection scheme, three trigger conditions should be satisfied for convection to occur. (1) A parcel lifted from the updraft-originating level without entrainment must reach its level of free convection (LFC) within a critical depth (LFC1 trigger condition). The critical depth that crudely represents an upper limit of CIN is determined in proportion to the large-scale vertical velocity at the cloud base, ranging from 120 to 180 hPa (see Equations (1) and (2) of Lim et al. (2014) [15] for the functional form). (2) The pressure difference between the LFCs determined without and with entrainment must be smaller than 25 hPa to take into account the suppression of convection in the presence of dry subcloud layer (LFC2 trigger condition). Note that the entrainment rate in the subcloud layer is specified to be inversely proportional to the height with a proportionality coefficient of 0.1. (3) The cloud work function, which is a measure of the integrated cloud buoyancy, must be positive (CWF trigger condition).
To assess the model’s ability to simulate the diurnal variation of precipitation over the East Asian region including eastern China, the Korean Peninsula, Japan, eastern Mongolia, and some parts of southern Russia shown in Figure 1, 5-member ensemble simulations are performed for the summer monsoon period (June–July–August; JJA) of 2006. A model domain covering the East Asian region centered on the Korean Peninsula (see Figure 1) is used with a horizontal grid spacing of 50 km. The model has 30 vertical layers and a model top at 50 hPa. The ensemble members initiated at 0000 universal time coordinated (UTC) 21–25 May 2006 are integrated until 0000 UTC 2 September 2006 with a time step of 240 s. The first 7–11 days of each simulation are regarded as a spin-up period and not included in the analysis. The National Centers for Environmental Prediction (NCEP) final analysis (FNL) data with a horizontal resolution of 1° are used as initial conditions. Lateral boundary conditions are also provided by the FNL data and updated every 6 h. The sea surface temperature (SST) is updated daily by linearly interpolating the weekly optimum interpolation (OI) SST data [21] with a horizontal resolution of 1°.
The observed precipitation dataset used in this study is the Tropical Rainfall Measuring Mission (TRMM) Multi-satellite Precipitation Analysis (TMPA) 3B42 version 7 3-hourly precipitation product [22], which covers from 50° S to 50° N with a horizontal resolution of 0.25°. The TMPA data have been widely used in studying the diurnal variation of precipitation (e.g., [23]), and its reliability during the East Asian summer monsoon has been confirmed by comparison with rain gauge observations (e.g., [24,25]). The TMPA data are interpolated in space to the model grid size of 50 km. For comparison of observed and simulated diurnal variations of precipitation, the model output is saved every 90 min, and 3-hourly precipitation over the time range +90 min centered on the nominal UTC hours is calculated, as in the TMPA. Both observed and simulated 3-hourly precipitation data at the nominal UTC hours are interpolated in time to obtain a 1-hourly precipitation rate using a cubic spline method. Then, a 1-hourly precipitation rate at UTC hours is converted to that at local standard time (LST) hours considering the longitudinal dependence. In this study, we only focus on the diurnal variation of precipitation over land because little sensitivity to the convective triggering process is found over the ocean.

3. Results and Discussion

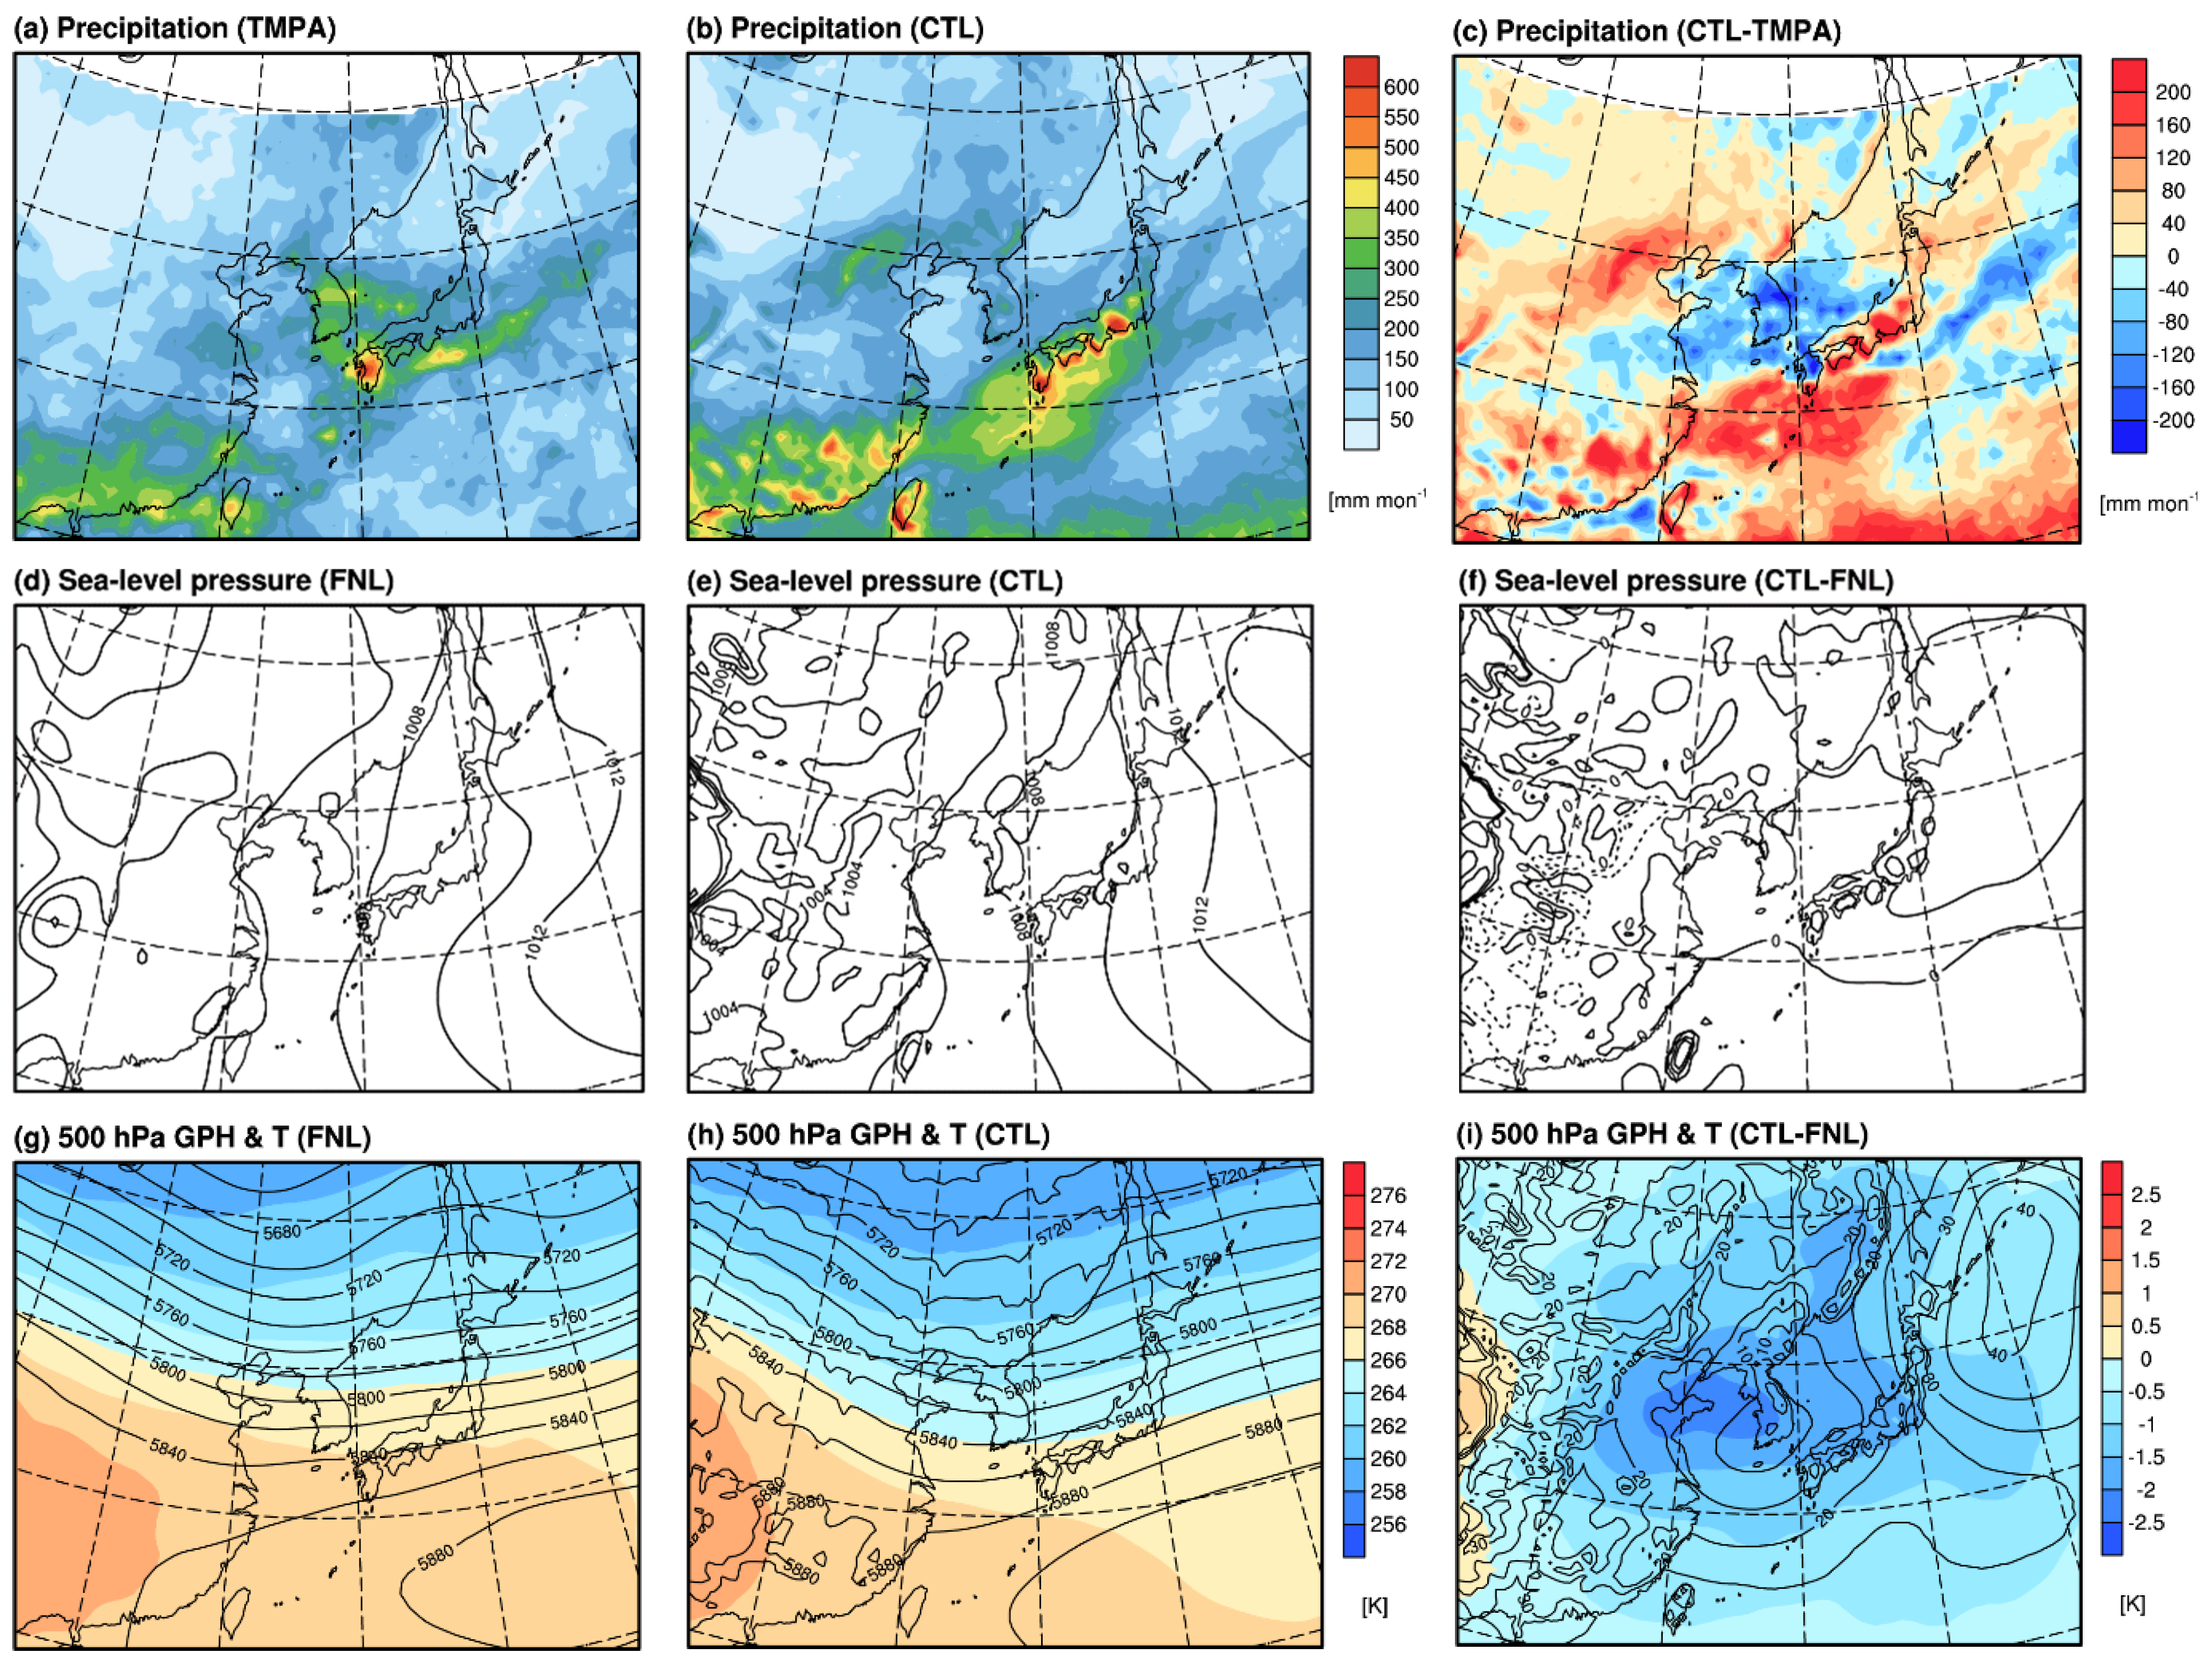
3.1. Evaluation of the SAS Convection Scheme over East Asia

The model performance in simulating the seasonal mean fields of precipitation and large-scale circulation over East Asia is evaluated first against the TMPA and FNL data, respectively. Figure 1 shows the spatial distribution of precipitation, sea-level pressure, and 500 hPa geopotential height and temperature averaged for JJA 2006. East-west oriented rainbands with heavy precipitation are observed across the Korean Peninsula, Japan, and the southern part of China during the East Asian summer monsoon period of 2006 (Figure 1a). The overall distribution of observed precipitation is reproduced in the ensemble mean of the control (CTL) experiments (Figure 1b). However, the amount of precipitation across the Korean Peninsula is underestimated, while that over Japan and southern China is overestimated (Figure 1c). In particular, precipitation over the sea south of Kyushu is much overestimated. This is caused by a stronger deepening of the simulated upper-level cold trough to the west of the Korean Peninsula compared to the FNL (Figure 1g–i) which prevents a westward extension of the subtropical Northwestern Pacific High at latitudes below 30° N, but results in excessive extension to the north (Figure 1d–f). The low-level southwesterly flow that transports warm and moist air toward Japan along the northwestern edge of the North Pacific High is directed more northward compared to the FNL (not shown), resulting in a difference in the orientation of the rainband near Japan between the TMPA observation and CTL experiment. It is found from additional experiments, in which the NCEP-Department of Energy (DOE) Atmospheric Model Intercomparison Project (AMIP-II) Reanalysis (RA2) data [26] are used as initial and lateral boundary conditions, that excessive precipitation over southern China and near the southern boundary of the model domain is attributable to the lateral boundary condition provided by the FNL data. In the experiment with the RA2 data, precipitation over southern China is significantly reduced and is underestimated, and that near the southern boundary of the domain is not produced as in the observation (not shown). This different response of the model to boundary conditions from the FNL and RA2 data is due to the difference in moisture fields between the two data. A comparison of 850 hPa relative humidity (RH) fields of the FNL and RA2 data shows that RH values of the FNL data are generally higher than those of the RA2 data over East Asia, especially in the southern part of the domain (up to 15% higher). Note that considering the model resolution, the FNL data are used as initial and boundary conditions in this study, rather than the RA2 data with a horizontal resolution of 2.5°. Also, the experiment with the FNL data shows better performance in simulating large-scale circulation.
The characteristics of observed and simulated diurnal variations of precipitation averaged over the East Asian land area are compared in Figure 2. It is clear from Figure 2a, which shows the time series of a spatially averaged precipitation rate for July 2006, that observed and simulated precipitation rates generally exhibit fluctuation on a daily time scale, but the fluctuation is greatly exaggerated in the CTL experiment. Note that even in days when the diurnal cyclic behavior of precipitation is not prominently observed from the TMPA data (e.g., from 18–20 July 2006), a strong diurnal cycle having a daily maximum in the afternoon is simulated in the model; this results in a large overestimation of daytime precipitation. These features are confirmed by analyzing the power spectral density (PSD) of precipitation rate (Figure 2b). The TMPA observation has distinct spectral peaks at 24 and 12 h periods, corresponding to diurnal and semi-diurnal cycles, respectively. In the CTL experiment, these two peaks are well reproduced, but their amplitudes, especially the PSD for the diurnal peak, are overestimated. The observed mean diurnal variation of precipitation over land for JJA 2006 (Figure 2c) shows two peaks, one in the late afternoon at 1600 LST and a weaker one in the early morning at 0500-0600 LST. The afternoon peak is also produced in the CTL experiment, but is significantly overestimated and occurs at 1400 LST, 2 h earlier than the observation. On the other hand, the early morning peak is not simulated. Choi et al. (2015) [4] showed that the simulated afternoon peak over the East Asian region occurs earlier than the observed one by 2–3 h also with other cumulus parameterization schemes such as the Kain-Fritch [27], Betts-Miller-Janjić [28], and Tiedtke [29,30] schemes. An analysis of the diurnal variations of convective and non-convective precipitation rates (Figure 3) indicates that in the model the afternoon peak over land is entirely attributable to convective precipitation, which results from increased atmospheric convective instability induced by surface heating in the daytime. Non-convective precipitation exhibits a diurnal cycle with an early morning peak at 0500-0600 LST, but its contribution to total precipitation is too small to produce the morning peak in total precipitation. Note that the ratio of convective to total precipitation in the simulation with the SAS convection scheme is higher than those with other cumulus parameterization schemes [4].
The diurnal variations of the frequency and intensity of precipitation are plotted in Figure 4 to examine their contribution to the diurnal variation of precipitation rate. Note that the product of precipitation frequency and intensity is the precipitation rate. In this calculation, the threshold of 0.1 mm h−1 is used to define measurable precipitation, which is the same as that of previous studies (e.g., [1,3]). The late afternoon peak in the observed precipitation rate shown in Figure 2c is induced not only by the frequent occurrence of precipitation in the afternoon with a maximum at 1500–1600 LST, but also by the increasing trend of precipitation intensity with time in the afternoon (from 1300 to 2000 LST). The maximum frequency of simulated precipitation appears at 1400 LST, 1–2 h earlier than that of the TMPA observation, contributing to the phase error in precipitation rate. The error of simulated intensity, which is out of phase with the observed one and has its maximum at 1400 LST coinciding with the maximum frequency, is also responsible for the earlier timing of the afternoon peak in precipitation rate. The typical deficiencies of an overestimation of precipitation frequency and an underestimation of precipitation intensity are also found in this study, consistent with previous modeling studies (e.g., [1,31]).

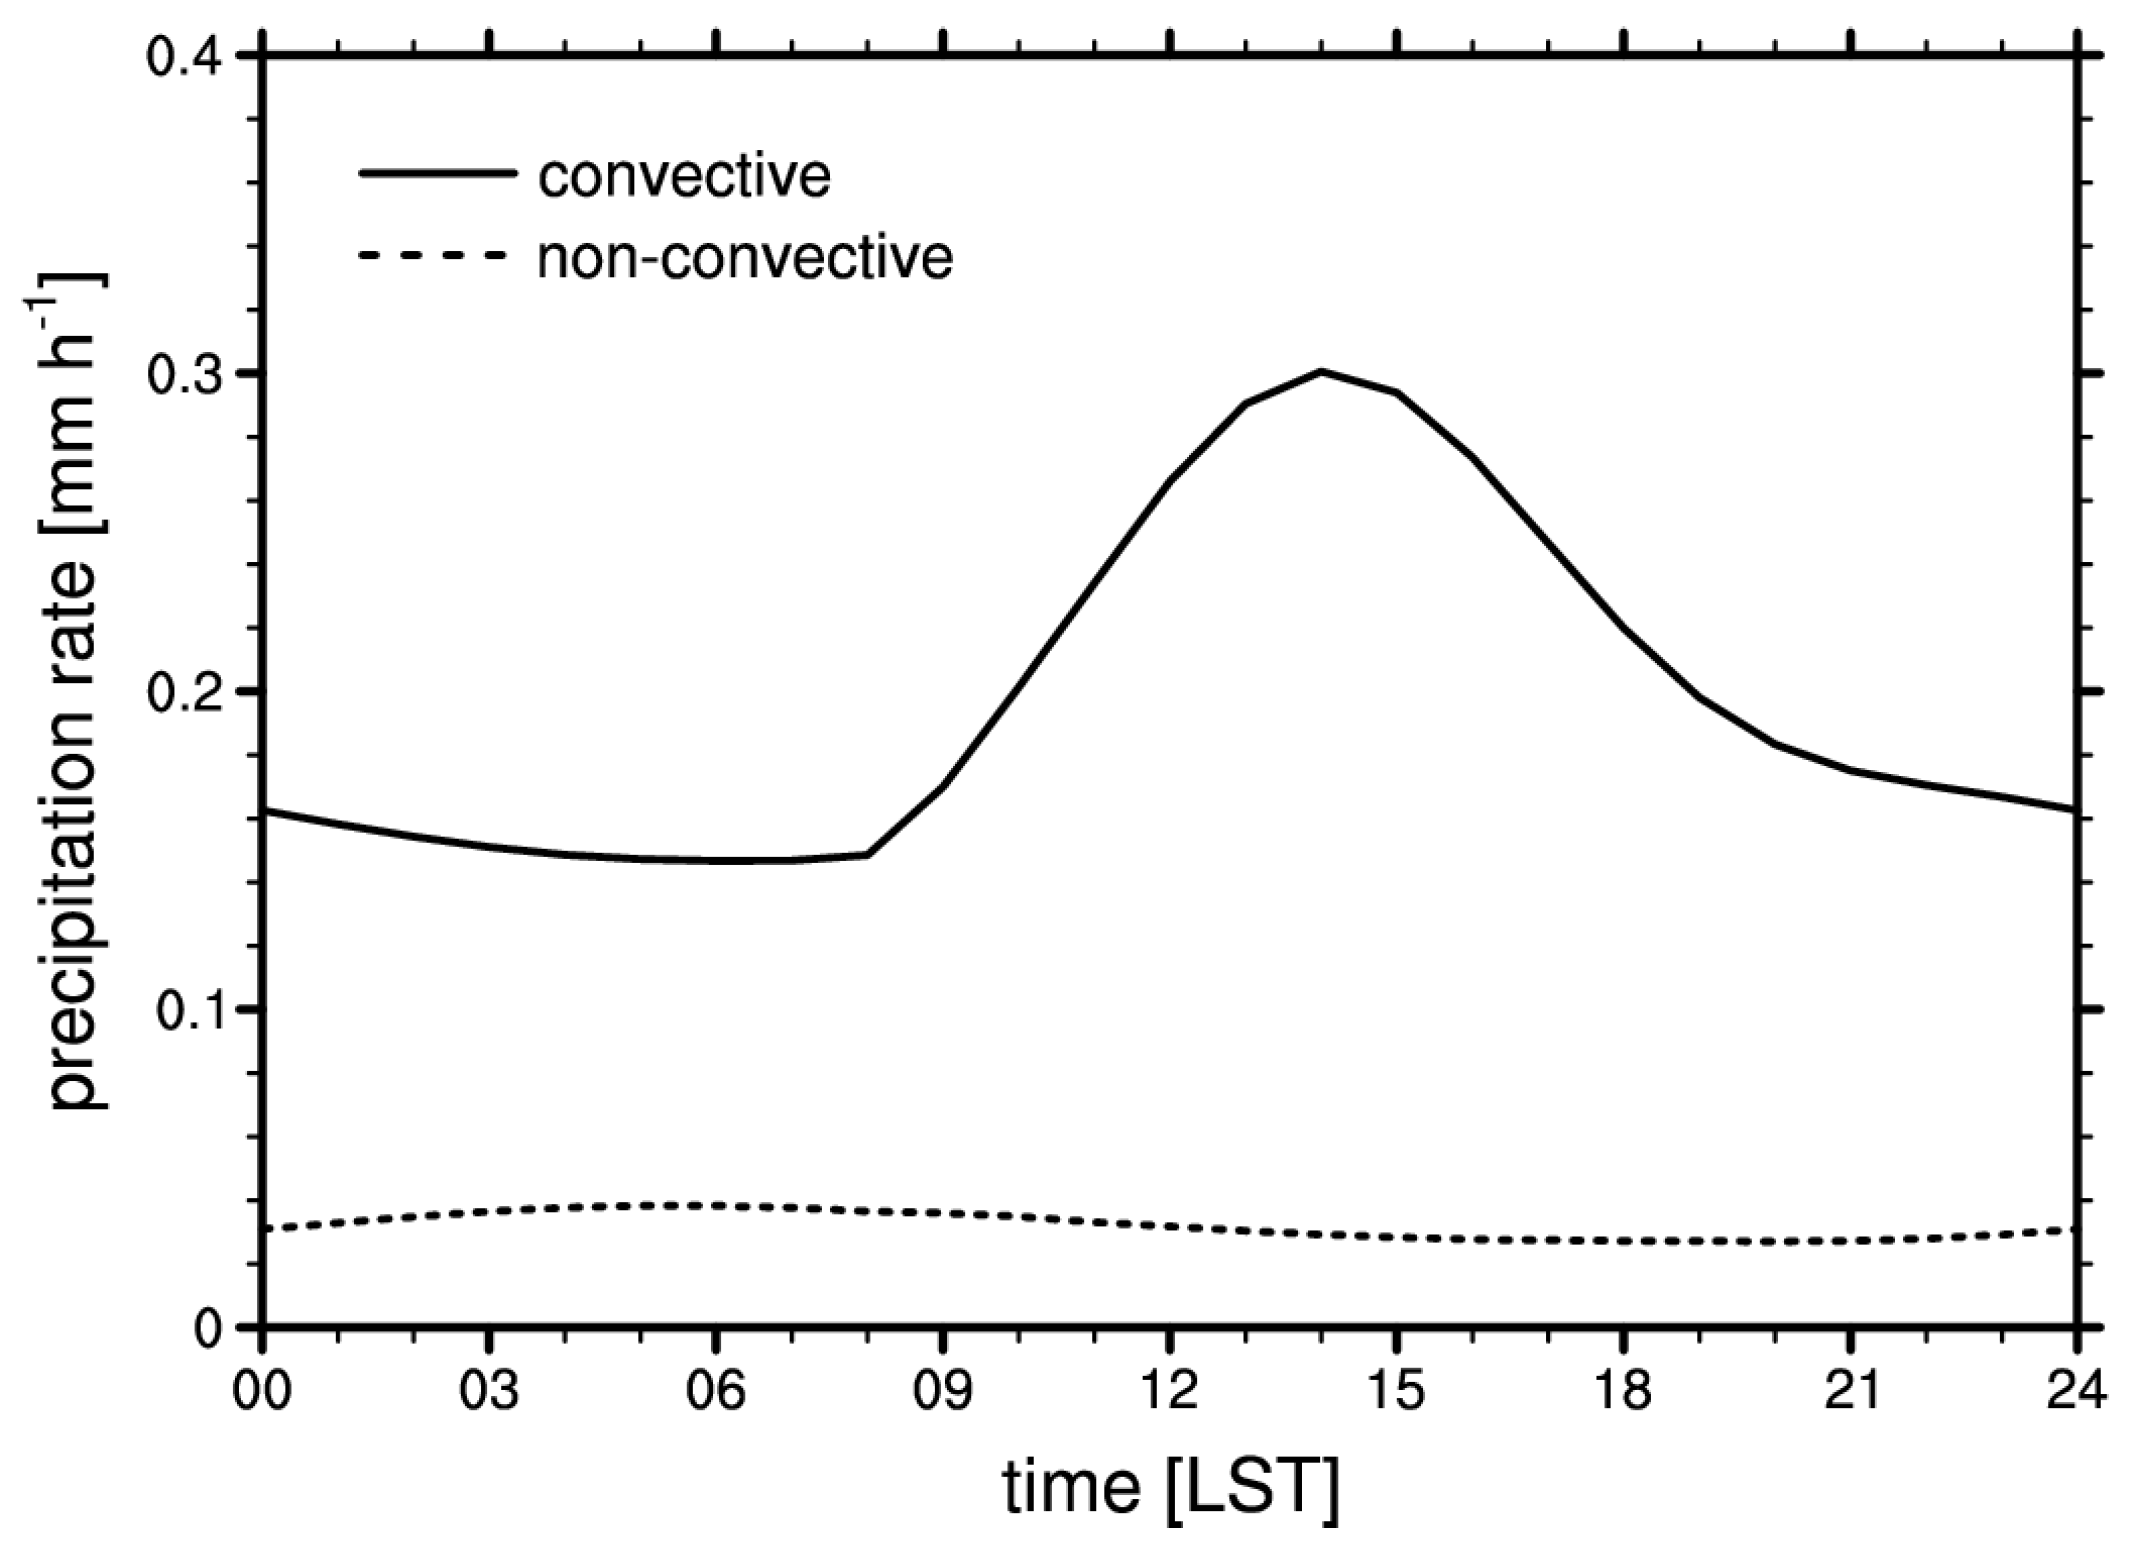
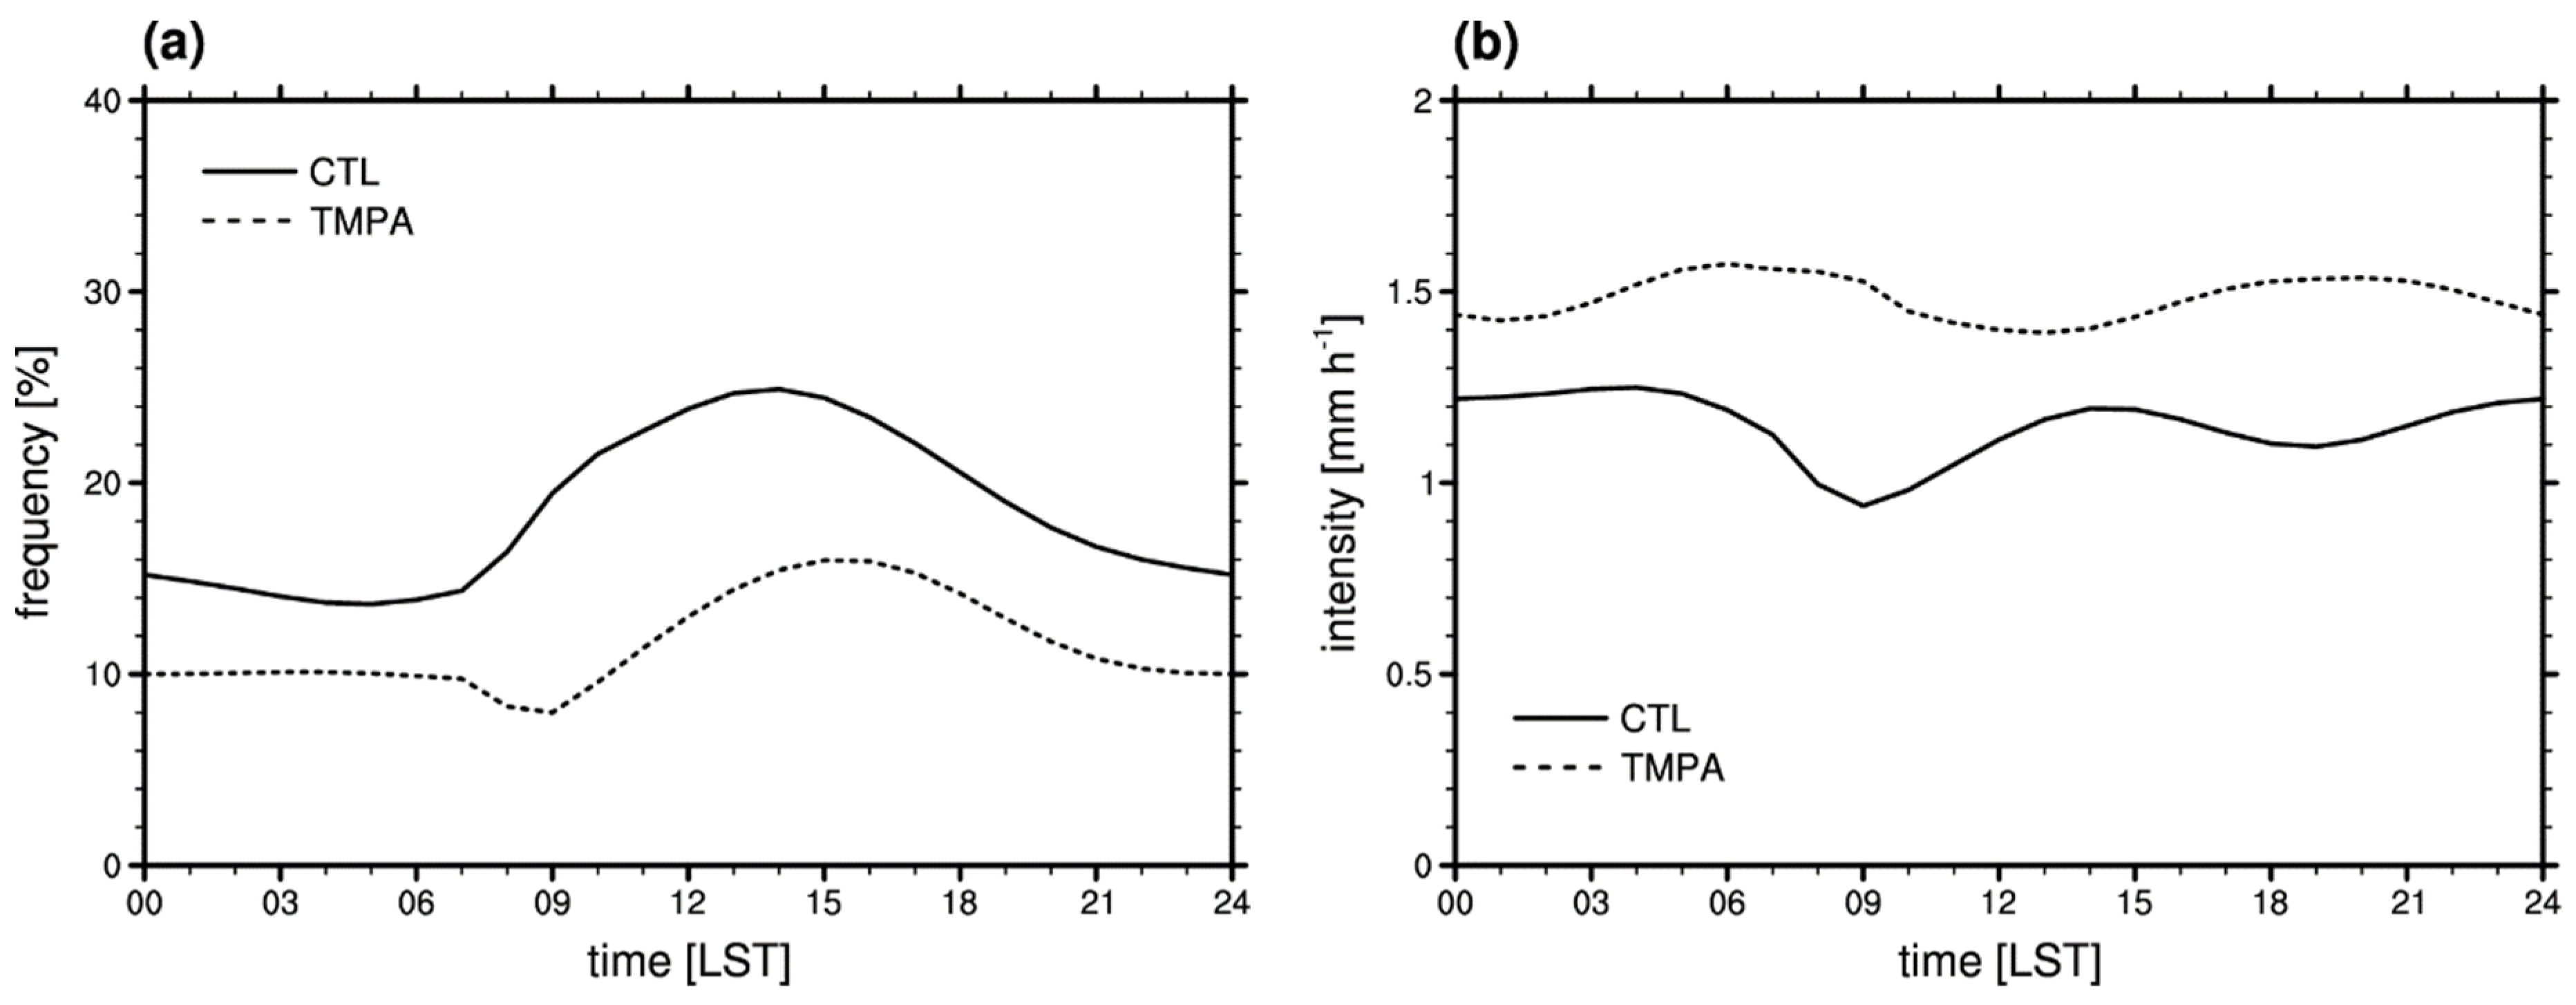
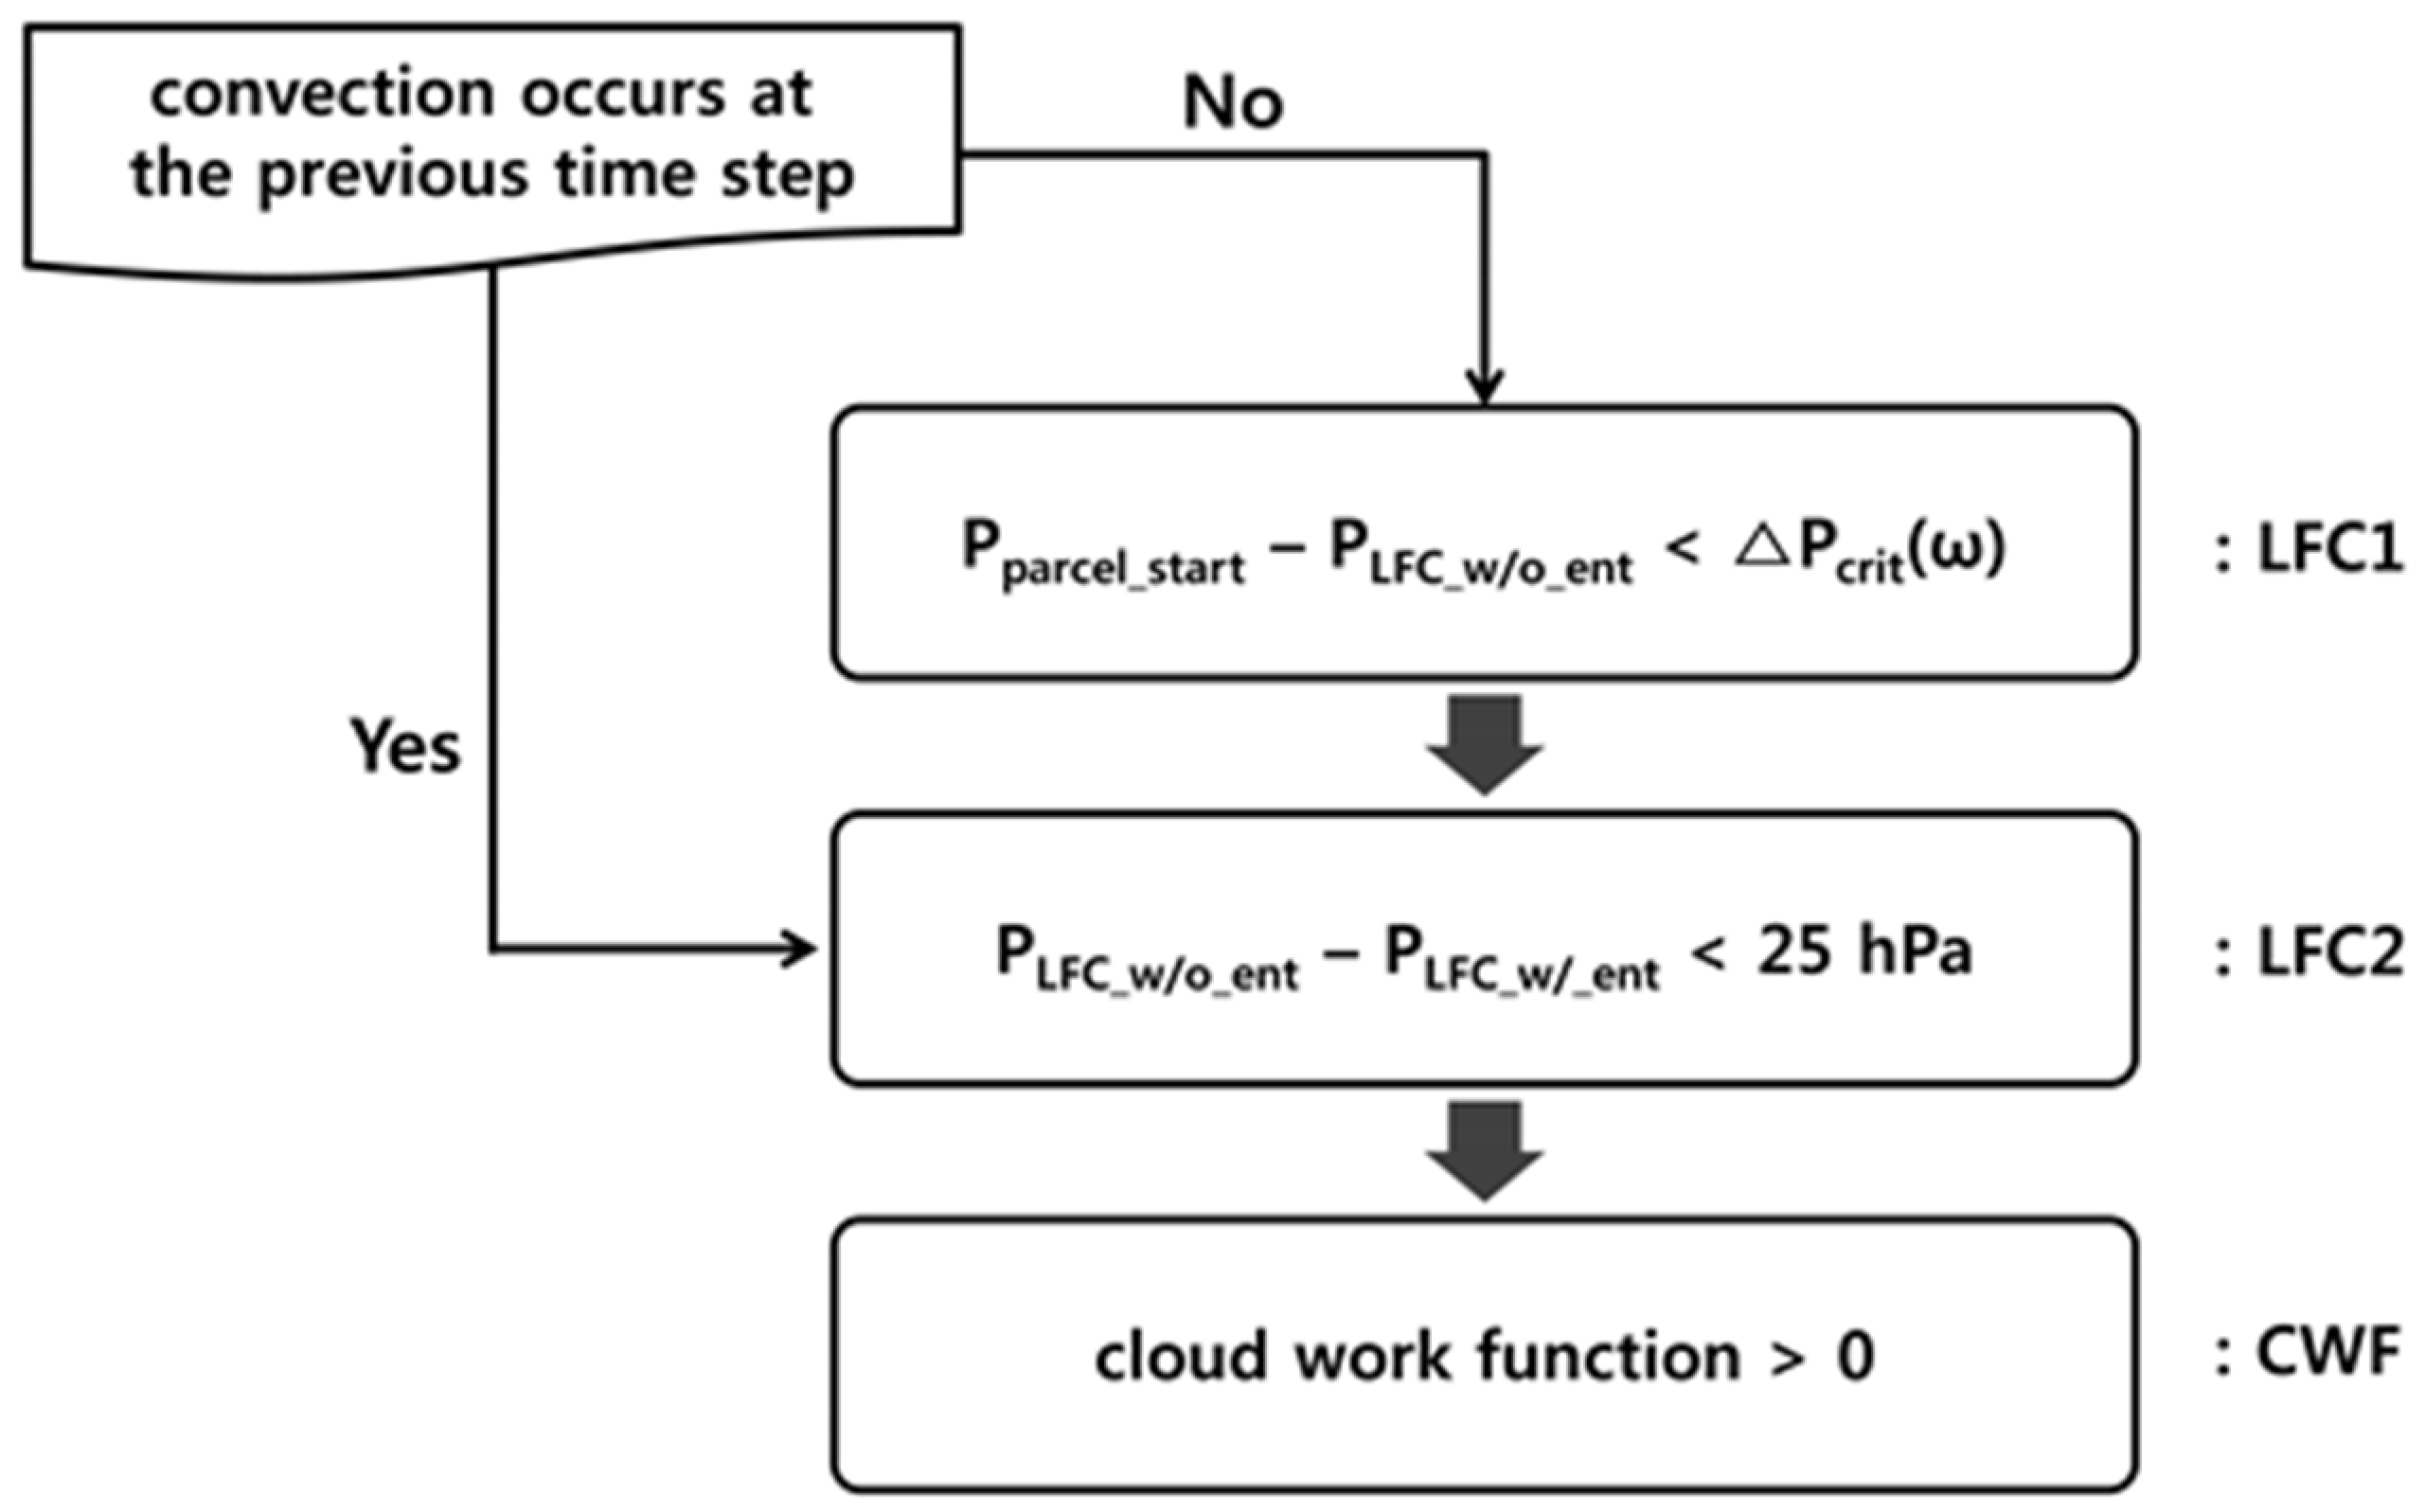
3.2. Sensitivity to the Convective Triggering Process

In this section, effects of the convective triggering process on the simulation of the diurnal variation of precipitation are investigated. Three sensitivity experiments that isolate the individual role of trigger conditions in the SAS convection scheme are conducted first to examine the impact of each trigger condition on the diurnal variation of precipitation. Figure 5 shows the time series and PSD of precipitation rate over the East Asian land area from the experiment without the LFC1 trigger condition (noLFC1) and experiment without the LFC2 trigger condition (noLFC2). In the noLFC1 experiment, the amplitude of the PSD for the diurnal peak is reduced, implying a less pronounced diurnal cyclic behavior of precipitation (Figure 5b), and daytime precipitation persists longer than that in the CTL experiment (Figure 5a). In contrast, the diurnal fluctuation of precipitation becomes more prominent without the LFC2 trigger condition, as shown by the much larger PSD at a period of 24 h (Figure 5c,d). Note that the correlation coefficient between the time series of observed and simulated precipitation rates is 0.519 in the noLFC2 experiment, which is much lower than those in the CTL and noLFC1 experiments (0.639 and 0.624, respectively). Furthermore, precipitation over the ocean near the southern boundary of the domain is excessively overestimated in the noLFC2 experiment (not shown), indicating the existence of dry layers below the cloud base over this region and that the LFC2 trigger condition is required in the SAS convection scheme for better performance in the diurnal variation and spatial distribution of precipitation. Meanwhile, little change is exhibited in the simulation results without the CWF trigger condition (not shown).
Based on the above sensitivity experiments and the concept proposed by Chao (2013) [7], which takes into account the irrelevance of CIN once convection is initiated, the convective triggering process in the SAS convection scheme is modified to use different initiation and termination conditions, as illustrated by the schematic diagram in Figure 6. If convection does not occur at the previous time step, all three trigger conditions should be satisfied for convection to be initiated, as in the original method. Otherwise, the LFC1 trigger condition, which is considered to crudely represent suppressed initiation of convection by the presence of CIN, is skipped to take into account the occurrence of deep convection accompanied by a large value of CIN in the afternoon, and only the LFC2 condition considering the effect of environmental humidity in the subcloud layer and the CWF (similar to CAPE) condition are used to determine whether convection is terminated or not. At night, this modification is not applied because precipitation during nighttime can be largely increased; instead, the threshold value for the LFC1 trigger condition is doubled.
Figure 7 shows the diurnal variations of precipitation rate, precipitation frequency, and precipitation intensity from the experiment with the modified convective triggering process (skipLFC1 experiment). The consideration of the occurrence of deep convection accompanied by a large CIN causes more frequent triggering of moist convection, and therefore more convective precipitation, in the late afternoon. Precipitation, most of which comes from convective precipitation, occurs most frequently at 1500–1600 LST (Figure 7b), which is delayed by 1–2 h compared to that of the CTL experiment (Figure 4a), resulting in the simulated diurnal variation of precipitation frequency being nearly in phase with the observed one. Note that, as expected, the frequency of precipitation is increased by weakened trigger conditions (i.e., by excluding the LFC1 trigger condition in the case where convection occurs at the previous time step). On the other hand, the modification of the triggering process that determines whether or not convection occurs has almost no effect on the phase of the diurnal variation of precipitation intensity (Figure 7c). The precipitation intensity of the skipLFC1 experiment is only slightly increased from 0500 to 1500 LST compared to that of the CTL experiment, and slightly reduced at other times. The afternoon peak in precipitation rate is delayed than the CTL experiment, which is better agreement with the TMPA observation (Figure 7a), as a result of the phase shift in the diurnal variation of precipitation frequency. However, it is not sufficiently delayed to be in phase with the observed one due to the phase error in precipitation intensity. Unlike the CTL experiment, the morning peak is also produced in the skipLFC1 experiment, though it is weak and occurs 1–2 h later than the TMPA observation.
Figure 8 shows the spatial distribution of the local time of daily maximum precipitation rate over East Asia. Over land, the CTL experiment generally produces the diurnal peak of precipitation in the afternoon from 1400 to 2000 LST (gray, yellow, and orange colors) and earlier than the observed afternoon peak. In the eastern Mongolian region, however, the diurnal peak in the CTL experiment occurs at night (red color), much later than the observation. In the skipLFC1 experiment, the afternoon peak tends to occur later than that in the CTL experiment over many land areas, especially over the southern part of China (from gray and yellow to yellow and orange colors), but earlier over eastern Mongolia (from red to yellow and orange colors), which is closer to the TMPA observation. The early morning peak observed in some parts of land areas is not reproduced well in both the CTL and skipLFC1 experiments. Note that no significant change is found in the timing of the early morning peak over the ocean with the modified triggering process.
The modification of convective triggering process also leads to large changes in the simulation of the seasonal mean fields of large-scale circulation and precipitation over East Asia during the summer monsoon period, as shown in Figure 9. The upper-level cold trough is less developed with the modified triggering process than that in the CTL experiment (Figure 1i and Figure 9f), causing the subtropical Northwestern Pacific High to be less extended to the north as in the observation (Figure 1f and Figure 9d). As a result, the direction of low-level southwesterly flow that transport warm and moist air toward Japan along the northwestern periphery of the North Pacific High is changed to be comparable to the observed one, resulting in reduced bias in the simulation of the spatial distribution of precipitation near Japan (Figure 1c and Figure 9b). Note that the amount of precipitation in the southern part of China is more overestimated in the skipLFC1 experiment than in the CTL experiment. However, in experiments in which lateral boundary forcing is provided by the RA2 data instead of the FNL data, the amount of precipitation over southern China in the skipLFC1 experiment is similar to that of the TMPA observation, while it is underestimated in the CTL experiment. Our main results that the diurnal variation of precipitation frequency with the modified triggering process becomes nearly in phase with the observed one, resulting in a delayed afternoon peak in precipitation rate, are also obtained with the RA2 data, but with the reduced error of excessive precipitation (not shown).

4. Summary and Conclusions

Effects of the convective triggering process on the simulation of the diurnal variation of precipitation during the East Asian summer monsoon are examined. Impact of individual condition of triggering process in the SAS convection scheme is analyzed first. Then, based on the analysis results, the trigger process is modified to employ the concept suggested by Chao (2013) [7], and the performance of the modified scheme is assessed.
In the experiment with the original trigger conditions, precipitation rate is underestimated over Korea and overestimated over Japan and southern China. In particular, the main reason of overestimated precipitation over the sea southwest of Japan is the displacement of the rainband caused by a stronger deepening of the upper-level cold trough and excessive northward extension of the subtropical Northwestern Pacific High. Daytime precipitation over land is largely overestimated due to highly exaggerated diurnal cyclic behavior of precipitation. In addition, the main peak occurring in the afternoon is simulated earlier than the observed one. This is attributable to the phase error in both frequency and intensity of precipitation. In the simulation, precipitation over land is dominated by convective precipitation, implying that the convective parameterization needs to be improved for more realistic simulation of precipitation.
The role of individual trigger condition is investigated by eliminating one particular condition among three trigger conditions: LFC1, LFC2, and CWF. The experiment without the LFC1 condition reproduces a less prominent diurnal cycle of precipitation, and this indicates that overestimated fluctuation with a daily cycle is partly related to this condition. Without the LFC2 condition, on the other hand, the diurnal cycle of precipitation becomes more pronounced and the bias in the temporal variation of precipitation increases, implying that the LFC2 condition is necessary for better simulation of precipitation. The effect of the CWF condition is not significant in the present simulations. A parameterization concept proposed by Chao (2013) [7], in which convection continues regardless of CIN once it is initiated and the termination of convection is determined by CAPE, is applied to the SAS scheme by skipping the LFC1 condition if convection already exists in the previous time step. The modification of the triggering process leads to a delayed afternoon peak of precipitation rate, which is simulated earlier than the observed one in the original experiment. This is mainly due to altered diurnal variation of precipitation frequency, which becomes nearly in phase with the observed one. The spatial pattern of precipitation is also changed by using the modified triggering process. In particular, overestimation of precipitation near Japan is alleviated due to less developed upper-level cold trough and a less northward extension of the Northwestern Pacific High.
This study shows that the phase of the diurnal variation of precipitation frequency over land can be improved by a more realistic representation of the convective triggering process, but to alleviate the phase error in precipitation intensity and excessive precipitation, it is necessary to properly represent other moist convective processes that determine the strength of convection. For example, the model performance in simulating the diurnal variation of precipitation can be further improved by taking into account rapidly varying boundary layer forcing or cold pool effects in a cumulus parameterization scheme. This will be investigated in future work.

Author Contributions

Conceptualization, J.-Y.H.; Software, S.-Y.K.; Investigation, J.-Y.H.; Data curation, I.-J.C.; Writing—original draft preparation, J.-Y.H. and S.-Y.K.; Writing—review and editing, J.-Y.H., S.-Y.K., I.-J.C. and E.K.J.; Visualization, J.-Y.H.

Funding

The fourth author was supported by Korea Polar Research Institute (KOPRI) research grant 20140410.

Acknowledgments

This work has been carried out through the R&D project on the development of global numerical weather prediction systems of the Korea Institute of Atmospheric Prediction Systems (KIAPS) funded by the Korea Meteorological Administration (KMA). The FNL and RA2 data and TMPA product are available from the Computational and Information Systems Laboratory (CISL) Research Data Archive (RDA) (http://rda.ucar.edu/dataset) and from the Goddard Space Flight Center Distributed Active Archive Center (ftp://disc2.nascom.nasa.gov/data/TRMM/Gridded/3B42_V7), respectively.

Conflicts of Interest

The authors declare no conflict of interest.

References

  1. Dai, A.; Giorgi, F.; Trenberth, K.E. Observed and model-simulated diurnal cycles of precipitation over the contiguous United States. J. Geophys. Res. 1999, 104, 6377–6402. [Google Scholar] [CrossRef] [Green Version]
  2. Bechtold, P.; Chaboureau, J.-P.; Beljaars, A.; Betts, K.; Köhler, M.; Miller, M.; Redelsperger, J.-L. The simulation of the diurnal cycle of convective precipitation over land in a global model. Q. J. R. Meteorol. Soc. 2004, 130, 3119–3137. [Google Scholar] [CrossRef] [Green Version]
  3. Koo, M.-S.; Hong, S.-Y. Diurnal variations of simulated precipitation over East Asia in two regional climate models. J. Geophys. Res. 2010, 115, D05105. [Google Scholar] [CrossRef]
  4. Choi, I.-J.; Jin, E.K.; Han, J.-Y.; Kim, S.-Y.; Kwon, Y. Sensitivity of diurnal variation in simulated precipitation during East Asian summer monsoon to cumulus parameterization schemes. J. Geophys. Res. Atmos. 2015, 120, 11971–11987. [Google Scholar] [CrossRef]
  5. Jin, E.K.; Choi, I.-J.; Kim, S.-Y.; Han, J.-Y. Impact of model resolution on the simulation of diurnal variation of precipitation over East Asia. J. Geophys. Res. Atmos. 2016, 121, 1652–1670. [Google Scholar] [CrossRef]
  6. Gianotti, R.L.; Ahang, D.; Eltahir, A.B. Assessment of the Regional Climate Model version 3 over the Maritime Continent using different cumulus parameterization and land surface schemes. J. Clim. 2012, 25, 638–656. [Google Scholar] [CrossRef]
  7. Chao, W.C. Catastrophe-concept-based cumulus parameterization: Correction of systematic errors in the precipitation diurnal cycle over land in a GCM. J. Atmos. Sci. 2013, 70, 3599–3614. [Google Scholar] [CrossRef]
  8. Guichard, F.; Petch, J.C.; Redelsperger, J.-L.; Bechtold, P.; Chaboureau, J.-P.; Cheinet, S.; Grabowski, W.; Grenier, H.; Jones, C.G.; Köhler, M.; et al. Modelling the diurnal cycle of deep precipitating convection over land with cloud-resolving models and single-column models. Q. J. R. Meteorol. Soc. 2004, 130, 3139–3172. [Google Scholar] [CrossRef] [Green Version]
  9. Stratton, R.A.; Stirling, A.J. Improving the diurnal cycle of convection in GCMs. Q. J. R. Meteorol. Soc. 2012, 138, 1121–1134. [Google Scholar] [CrossRef]
  10. Bechtold, P.; Semane, N.; Lopez, P.; Chaboureau, J.-P.; Beljaars, A.; Bormann, N. Representing equilibrium and nonequilibrium convection in large-scale models. J. Atmos. Sci. 2014, 71, 734–753. [Google Scholar] [CrossRef]
  11. Rio, C.; Grandpeix, J.-Y.; Hourdin, F.; Guichard, F.; Couvreux, F.; Lafore, J.-P.; Fridlind, A.; Mrowiec, A.; Roehring, R.; Rochetin, N.; et al. Control of deep convection by sub-cloud lifting processes: The ALP closure in the LMDZ5B general circulation model. Clim. Dyn. 2013, 40, 2271–2292. [Google Scholar] [CrossRef]
  12. Skamarock, W.C.; Klemp, J.B.; Dudhia, J.; Gill, D.O.; Barker, D.M.; Duda, M.G.; Huang, X.-Y.; Wang, W.; Powers, J.G. A Description of the Advanced Research WRF Version 3; NCAR Technical Note NCAR/TN-475+STR; Mesoscale and Microscale Meteorology (MMM) Division, NCAR: Boulder, CO, USA, 2008. [Google Scholar] [CrossRef]
  13. Pan, H.L.; Wu, W.-S. Implementing a Mass Flux Convective Parameterization Package for the NMC Medium-Range Forecast Model; NMC Office Note 409; National Oceanic and Atmospheric Administration (NOAA): Silver Spring, MD, USA, 1995; 40p. [Google Scholar]
  14. Han, J.; Pan, H.-L. Revision of convection and vertical diffusion schemes in the NCEP Global Forecast System. Weather Forecast. 2011, 26, 520–533. [Google Scholar] [CrossRef]
  15. Lim, K.-S.S.; Hong, S.-Y.; Yoon, J.-H.; Han, J. Simulation of the summer monsoon rainfall over East Asia using the NCEP GFS cumulus parameterization at different horizontal resolutions. Weather Forecast. 2014, 29, 1143–1154. [Google Scholar] [CrossRef]
  16. Hong, S.-Y.; Dudhia, J.; Chen, S.-H. A revised approach to ice microphysical processes for the bulk parameterization of clouds and precipitation. Mon. Weather Rev. 2004, 132, 103–120. [Google Scholar] [CrossRef]
  17. Dudhia, J. Numerical study of convection observed during the Winter Monsoon Experiment using a mesoscale two-dimensional model. J. Atmos. Sci. 1989, 46, 3077–3107. [Google Scholar] [CrossRef]
  18. Mlawer, E.J.; Taubman, S.J.; Brown, P.D.; Iacono, M.J.; Clough, S.A. Radiative transfer for inhomogeneous atmosphere: RRTM, a validated correlated-k model for the longwave. J. Geophys. Res. 1997, 102, 16663–16682. [Google Scholar] [CrossRef]
  19. Hong, S.-Y.; Noh, Y.; Dudhia, J. A new vertical diffusion package with an explicit treatment of entrainment processes. Mon. Weather Rev. 2006, 134, 2318–2341. [Google Scholar] [CrossRef]
  20. Chen, F.; Dudhia, J. Coupling an advanced land surface-hydrology model with the Penn State-NCAR MM5 modeling system. Part I: Model implementation and sensitivity. Mon. Weather Rev. 2001, 129, 569–585. [Google Scholar] [CrossRef]
  21. Reynods, R.W.; Rayner, N.A.; Smith, T.M.; Stokes, D.C.; Wang, W. An improved in situ and satellite SST analysis for climate. J. Clim. 2002, 15, 1609–1625. [Google Scholar] [CrossRef]
  22. Huffman, G.J.; Adler, R.F.; Bolvin, D.T.; Gu, G.; Nelkin, E.J.; Bowman, K.P.; Hong, Y.; Stocker, E.F.; Wolff, D.B. The TRMM multisatellite precipitation analysis (TMPA): Quasi-global, multiyear, combined-sensor precipitation estimates at fine scales. J. Hydrometeorol. 2007, 8, 38–55. [Google Scholar] [CrossRef]
  23. Wang, Y.; Zhou, L.; Hamilton, K. Effect of convective entrainment/detrainment on the simulation of the tropical precipitation diurnal cycle. Mon. Weather Rev. 2007, 135, 567–585. [Google Scholar] [CrossRef]
  24. Zhou, T.; Yu, R.; Chen, H.; Dai, A.; Pan, Y. Summer precipitation frequency, intensity, and diurnal cycle over China: A comparison of satellite data with rain gauge observations. J. Clim. 2008, 21, 3997–4010. [Google Scholar] [CrossRef]
  25. Koo, M.-S.; Hong, S.-Y.; Kim, J. An evaluation of the Tropical Rainfall Measuring Mission (TRMM) Multi-satellite Precipitation Analysis (TMPA) data over South Korea. Asia Pac. J. Atmos. Sci. 2009, 45, 265–282. [Google Scholar]
  26. Kanamitsu, M.; Ebisuzaki, W.; Woollen, J.; Yang, S.-K.; Hnilo, J.J.; Fiorino, M.; Potter, G.L. NCEP-DOE AMIP-II Reanalysis (R-2). Bull. Am. Meteorol. Soc. 2002, 83, 1631–1643. [Google Scholar] [CrossRef]
  27. Kain, J.S. The Kain-Fritsch convective parameterization: An update. J. Appl. Meteorol. 2004, 43, 170–181. [Google Scholar] [CrossRef]
  28. Janjić, Z.I. The step-mountain eta coordinate model: Further developments of the convection, viscous sublayer, and turbulence closure schemes. Mon. Weather Rev. 1994, 122, 927–945. [Google Scholar] [CrossRef]
  29. Tiedtke, M. A comprehensive mass flux scheme for cumulus parameterization in large-scale models. Mon. Weather Rev. 1989, 117, 1779–1800. [Google Scholar] [CrossRef]
  30. Zhang, C.; Wang, Y.; Hamilton, K. Improved representation of boundary layer clouds over the southeast Pacific in WRF-ARW using a modified Tiedtke cumulus parameterization scheme. Mon. Weather Rev. 2011, 139, 3489–3513. [Google Scholar] [CrossRef]
  31. Chen, M.; Dickinson, R.E.; Zeng, X.; Hahmann, A.N. Comparison of precipitation observed over the continental United States to that simulated by a climate model. J. Clim. 1996, 9, 2233–2249. [Google Scholar] [CrossRef]
Figure 1. Spatial distribution of precipitation (mm month−1; top) over East Asia averaged for June–July–August (JJA) 2006 from the (a) Tropical Rainfall Measuring Mission (TRMM) Multi-satellite Precipitation Analysis (TMPA) observation and (b) CTL experiment, and sea-level pressure (hPa; middle) and 500 hPa geopotential height (gpm; solid line) and temperature (K; shading) (bottom) from the (d,g) FNL data and (e,h) CTL experiment. (c, f, and i) The differences between the CTL experiment and observations are shown in the right column. Contour interval is 1 hPa in (f), with negative contours dashed.
Atmosphere 10 00028 g001
Figure 2. (a) Time series of spatially averaged precipitation rate (mm h−1) and (b) power spectral density (PSD) of precipitation rate plotted on a logarithmic scale as a function of period (mm2 h−2/s−1) for July 2006, and (c) mean diurnal variation of precipitation rate (mm h−1) for JJA 2006 averaged over the East Asian land area from the TMPA observation (dashed lines) and CTL experiment (solid lines). Note that precipitation rate is averaged over all grid points over land shown in Figure 1 at latitudes below 50° N where the TMPA data are available, and the PSD is averaged across the spectral bins of period with an interval of 1 h.
Atmosphere 10 00028 g002
Figure 3. Diurnal variations of convective (solid line) and non-convective (dashed line) precipitation rates (mm h−1) averaged for JJA 2006 over the East Asian land area from the CTL experiment.
Atmosphere 10 00028 g003
Figure 4. Diurnal variations of (a) precipitation frequency (%) and (b) precipitation intensity per precipitation occurrence (mm h−1) averaged for JJA 2006 over the East Asian land area from the TMPA observation (dashed lines) and CTL experiment (solid lines).
Atmosphere 10 00028 g004
Figure 5. Time series of spatially averaged precipitation rate (mm h−1; left) and PSD of precipitation rate plotted on a logarithmic scale as a function of period (mm2 h−2/s−1; right) for July 2006 over the East Asian land area from the TMPA observation (dashed line), experiment without the LFC1 trigger condition (blue solid line; top), and experiment without the LFC2 trigger condition (blue solid line; bottom). The result of the CTL experiment is also plotted for comparison as a black solid line.
Atmosphere 10 00028 g005
Figure 6. Schematic diagram of the modified triggering process in the simplified Arakawa-Schubert (SAS) convection scheme.
Atmosphere 10 00028 g006
Figure 7. Diurnal variations of (a) precipitation rate (mm h−1), (b) precipitation frequency (%), and (c) precipitation intensity per precipitation occurrence (mm h−1) averaged for JJA 2006 over the East Asian land area from the TMPA observation (dashed lines) and skipLFC1 experiment (blue solid lines). The result of the CTL experiment is also plotted for comparison as a black solid line.
Atmosphere 10 00028 g007
Figure 8. Spatial distribution of LST of daily maximum precipitation rate over East Asia averaged for JJA 2006 from the (a) TMPA observation, (b) CTL experiment, and (c) skipLFC1 experiment. The blue colors represent morning peaks, and the yellow to orange colors represent afternoon peaks.
Atmosphere 10 00028 g008
Figure 9. Spatial distribution of (a) precipitation (mm month−1), (c) sea-level pressure (hPa), and (e) 500 hPa geopotential height (gmp; solid lines) and temperature (K; shading) over East Asia averaged for JJA 2006 from the skipLFC1 experiment. (b, d, and f) The difference between the skipLFC1 experiment and observations are shown in the right column. Contour interval is 1 hPa in (d), with negative contours dashed.
Atmosphere 10 00028 g009aAtmosphere 10 00028 g009b

