Article

Variations in the Simulation of Climate Change Impact Indices due to Different Land Surface Schemes over the Mediterranean, Middle East and Northern Africa

by
Katiana Constantinidou
*,
George Zittis
and
Panos Hadjinicolaou
Energy, Environment and Water Research Center, The Cyprus Institute, 2121 Nicosia, Cyprus
*
Author to whom correspondence should be addressed.
Atmosphere 2019, 10(1), 26; https://doi.org/10.3390/atmos10010026
Submission received: 30 October 2018 / Revised: 19 December 2018 / Accepted: 8 January 2019 / Published: 12 January 2019

Abstract

:
The Eastern Mediterranean (EM) and the Middle East and North Africa (MENA) are projected to be exposed to extreme climatic conditions in the 21st century, which will likely induce adverse impacts in various sectors. Relevant climate change impact assessments utilise data from climate model projections and process-based impact models or simpler, index-based approaches. In this study, we explore the implied uncertainty from variations of climate change impact-related indices as induced by the modelled climate (WRF regional climate model) from different land surface schemes (Noah, NoahMP, CLM and RUC). The three climate change impact-related indicators examined here are the Radiative Index of Dryness (RID), the Fuel Dryness Index (Fd) and the Water-limited Yield (Yw). Our findings indicate that Noah simulates the highest values for both RID and Fd, while CLM gives the highest estimations for winter wheat Yw. The relative dispersion in the three indices derived by the different land schemes is not negligible, amounting, for the overall geographical domain of 25% for RID and Fd, and 10% for Yw. The dispersion is even larger for specific sub-regions.

1. Introduction

The region that encompasses the eastern Mediterranean (EM) and the Middle East and North Africa (MENA) is historically exposed to background high temperatures and dryness, which have been intensified in the recent past and are projected to lead to extreme climatic conditions occurring in this geographic location in the 21st century due to anthropogenic radiative forcing [1,2,3]. This will likely induce serious ecosystem and societal impacts in various sectors such as human health, agriculture, tourism, energy production and other areas [1,2,4].
Climate information at high spatial resolution is necessary to fully estimate the regional and local climate change effects, perform impact assessments and design adaptation strategies on a regional or national level [5]. This information on a regional scale is so far provided by the regional climate models (RCM), the output of which is affected by different sources of uncertainty [6,7]. Global climate model (GCM) output is used as lateral boundary conditions (LBC) for regional downscaling with the RCMs and unavoidably, the uncertainties associated with GCMs are transmitted to the projections of RCMs. In addition, RCMs themselves include uncertainties related to their own representation of dynamical and physical processes and spatial resolution [5].
Among the processes of the modelled climate system, land-atmosphere interactions play an important role in climate and its viability at various temporal and spatial scales through the exchange of heat, moisture and radiation between the ground and the air above [8]. Additionally, the associated memory effects can modulate the dynamics of the climate system [9], which has a direct influence on humans and ecosystems at the interface between the land and the atmosphere. Representation of land surface processes is therefore an important component of the climate models [10] and it is done using land surface schemes (LSS) that differ in the level of complexity of parameterization of various processes.
Insufficient understanding and incorporation of the various land-atmosphere feedbacks contribute to uncertain global climate model projections [11,12,13]. Davin [14] highlighted the lack of formal evidence that, the use of more detailed LSSs is translated into overall better regional climate model performance. Therefore, more systematic evaluations of LSSs coupled with RCMs is necessary to examine the relationship between the realism of land surface process representation and the overall climate model performance.
Changes in the prevailing climatic conditions in a region may have major consequences on society and natural ecosystems [1,4]. Impact assessments are very important and should be performed in order to project and evaluate the effects of climate change on different sectors. Impact models are usually forced by the output of global or regional climate models, the evaluation of which is difficult due to the uncertainty of the observations [15,16] and hence inter-comparison exercises such as the COordinated Downscaling EXperiment (CORDEX [17]) are of great importance. Assessing the effects of climate change using ecological models or indices potentially results in large cumulative errors due to errors and uncertainty passed sequentially from GCMs to RCMs and to impact models [18]. Instead, using impact models as additional sources of information to evaluate climate models in a non-linear way can be advantageous. In such a study [18], the authors used a process-based model of European beech (Fagus sylvatica L.) tree growth and forest ecosystem functioning and pointed to areas of improvements for the evaluated RCMs over France.
In the present study, the implied uncertainty of the variations of certain climate change impact related indices is explored as induced by the modelled climate from different land surface schemes. As the climatic conditions in the region of EM and MENA are expected to become warmer and drier, three indicators, related to climate-geographical zonality, are examined: climate classification and geobotanic zonality, with the Radiative Index of Dryness [19], forest fire risk with the Fuel dryness index [20] and agricultural production with AgroEcological Zones methodology—Water-limited yield of winter wheat [4]. The aforementioned indices are calculated using the output of six simulations performed by the Weather Research Forecast (WRF) RCM using four different LSSs (Noah, NoahMP, CLM and RUC) in a total of six sensitivity experiments for the period of 2000–2010 over the MENA-CORDEX domain at a 50-km horizontal resolution.

2. Data and Indices

2.1. Description of Simulations

Climatic parameters necessary for the calculation of the different impact-related indices are taken from simulations performed using the Weather Research Forecast (WRF) version 3.8.1 regional climate model over the MENA-CORDEX domain. In order to study the uncertainties of the modelled climate due to different land-surface schemes, six experiments were carried out for the period of 2000–2010 driven by the ERA-Interim re-analyses at 50-km horizontal resolution. The model configuration has been tested and optimised in previous studies [21,22]. From that version, the only component that has been replaced is the land surface scheme, where four different land surface schemes (LSS) were used (Noah [23], NoahMP [24], CLM [25] and RUC [26]).
A summary of the main characteristics of the four LSSs used in this work can expose the difference in the level of complexity among the schemes. Noah as the most commonly used LSS in the WRF modeling community (http://www2.mmm.ucar.edu/wrf/users/wrf_physics_survey.pdf), appears to be the simplest, where calculations are performed over the whole grid box considered as one combined surface layer, four vertical levels of soil, one bulk snow layer with the surface parameters to be taken from look-up tables [23]. NoahMP, the improved version of Noah, is next with three snow layers and also four soil levels, separates grid cells into vegetation and soil and a dynamic vegetation option for more realistic values of the surface parameters [24]. The Community Land Model (CLM) [25] and the Rapid Update Cycle (RUC) [26] include the most sophisticated snow (five layers in CLM and two layers in RUC), soil (up to ten and nine vertical levels respectively), surface parameters from satellite-based datasets and vegetation physics, and therefore are the most elaborated of the four schemes.
Six different experiments were setup and performed using WRF RCM version 3.8.1 over the MENA-CORDEX domain, driven by ERA-Interim reanalyses at a horizontal resolution of 50 km for the period of December 2000 to November 2010, using different land surface scheme options (Noah, NoahMP with the dynamic vegetation option turned off and on, CLM and RUC with six and nine soil layers). The eleven-month period of January to November 2000 was considered as spin-up time and was therefore excluded from the analysis. The properties of the six experiments are presented in Table 1. The daily output of these simulations (minimum, maximum and mean temperature; shortwave, longwave and net radiation; precipitation; latent and ground heat fluxes; relative humidity and wind speed) is then used to calculate three climate change impact-related indices that are described in detail in the following sub-section (Radiative Index of Dryness, Fuel Dryness Index and Water Limited Yield for winter wheat).

2.2. Impact Indices

Radiative Index of Dryness (RID):
For the region of EM and MENA, which is projected to become drier, it is important to calculate an aridity index, that involves the radiative and moisture conditions in the area. Budyko [19] introduced the radiative index of dryness (RID), which is a non-dimensional measure of the long-term balance between rainfall and net radiation [27], and it can be calculated by the following equation:
RID = r n λ H × p
where rn is the net radiation, λH the latent heat, and p the precipitation.
This index can be used as a metric of aridity related to the larger scale climate-geographical zonality and, together with the net radiation, to study the effects of water and energy availability on vegetation, soil and water dynamics [28], due to the fact that the variations of the related fluxes are affected by latitude, surface albedo, etc. [19,27]. Areas where climatic conditions are humid correspond to small values of RID and a greater presence of forests, whereas drier areas such as deserts and semi-arid regions take the highest values of this index.
In this work, annual mean values of the required parameters (net radiation, latent heat and precipitation) are taken from simulations performed by WRF RCM, for the period of time 2000–2010, and the radiative index of dryness is then calculated.
Fuel Dryness Index (Fd):
Prevailing climatic conditions together with the vegetation cover and therefore the land surface conditions of an area, are major elements that affect fire ignition and propagation. Areas with high temperatures and low precipitation are associated with low soil moisture content and therefore are more vulnerable to wildfires. Snyder [20] presents a fuel dryness index (Fd), which is a simple way (fitting our climatic time-scale context, using monthly values) to calculate fuel moisture content and hence assess the fire risk in a particular area. This method is based on biophysical principles associated with energy exchange on the surface, where available energy (net radiation—ground heat flux) is partitioned into sensible and latent heat exchanges.
Typically, net radiation (rn) and ground heat flux (G) are positive downwards and sensible (SH) and latent heat (LH) fluxes are positive upwards. When soil water is not a limiting factor, SH is small compared to LH, and available energy is a metric of maximum LH. Under dry surface conditions, soil water is a limiting factor; reduction of evaporation from the surface is caused and therefore LH decreases relative to the available energy.
The Fd index is calculated by the following equation:
Fd = 1 LH r n G
where LH is the latent heat flux, rn is the net radiation and G is the ground heat flux.
Fd approaches zero when fire potential is low, due to high values of ecosystem moisture, and it increases to one as the moisture is low and the chances of wildfire are higher [20]. A major advantage of the Fd index is that it gives a weighted measure of dryness of all surface fuels, compared to only-one material used in a ‘‘fire stick test’’ or in plant-leaf relative water content measurements.
Water-limited Yield (Yw):
Climate variability has an effect on crop yields [29,30], while long-term climate change likewise impacts the quantity and quality of crop production through processes driven by sunlight, temperature, water and carbon dioxide levels [31].
Following a framework of the analysis of large-scale shifts in cropping zones, the agro-ecological zones (AEZ) methodology developed by the Food and Agriculture Organization of the United Nations (FAO) and the International Institute for Applied Systems Analysis (IIASA) is implemented [32,33]. This methodology is used for specified management conditions and climate input to assess the suitability of crops and to quantify expected production of cropping activities relevant in the specific agro-ecological context.
Calculations of crop yields are made using the biomass and yield calculation model of the AEZ methodology. First, potential crop yields are calculated with regard to the prevailing temperature and radiation regimes in the relevant area (grid-boxes) suitable for cultivation of a particular crop. These suitable grid-boxes result from a crop-specific thermal suitability test, which is performed prior the potential yield calculation [4] (see table 1: optimum and sub-optimum conditions for durum wheat in [4]). Finally, using the potential yield together with a water-stress limiting factor (as a function of actual and maximum crop evapotranspiration, both accumulated within the four crop stages of crop growth cycle), the water-limited crop yield is derived (see details of calculations in [4]).
In this study, water-limited yield is calculated for the period of 2000–2010 over the region of EM and MENA, using as input climatic parameters the output of the simulations performed by WRF RCM with 6 different land-surface schemes and a horizontal resolution of 50 km. Durum wheat Triticum tirgidum is the selected crop, as being one of the oldest cultivars of winter wheat, originating in the eastern Mediterranean. The growing cycle is assumed to last 180 days, starting from the 1st of November until the 30th of April. The selected crop calendar is the same as that used in [4] and it is chosen because in the region of interest of this study, wheat is usually cultivated in this period, the beginning of which coincides with the start of the wet season [4,34].

3. Results

As it was above mentioned, Noah is the most commonly used LSS in the climate modeling community of WRF. It is therefore valuable to perform a comparison, presenting the three climate change impact-related indices of interest obtained by the five different LSSs and options as differences from the ones derived from the Noah output, which serves as the reference. The original, three-continent encompassing MENA-CORDEX domain used to drive the sensitivity simulations is too large for the climate indices’ differences to be assessed easily, and therefore we have excluded the less relevant areas of lower latitudes from near the equator up to 25 degrees North. Apart from the map views, results are also presented in tabular form, with area-averaged calculations for the more relevant sub-regions of western, central and eastern Mediterranean, Balkans, Anatolia and Mesopotamia (shown in Figure 1). For each of the three climatic indices and each sub-region, a mean value from the six experiments, the difference of the mean of each run from the overall mean value, two times the standard deviation and the “relative dispersion” are calculated and presented in following sections. This relative dispersion is defined as the quotient of two standard deviations and the overall mean value, and it is an indicator of LSS-induced uncertainty in the estimation of the indices.

3.1. Radiative Index of Dryness

The calculation of Radiative Index of Dryness (RID) requires annual means of net radiation, latent heat and the total precipitation. The results of this calculation are presented in Figure 2 averaged for the 10-year of output from for the Noah LSS (used as reference) and the difference between the other five schemes and Noah. Values of RID calculated by Noah are in good agreement with the map of the same index shown in Budyko et al 1974 [19] (their Figure 103). As also suggested in Table 31 of the same study [19], areas that have values of RID greater than three represent regions with extremely insufficient moisture and therefore are representative of desert zones. As semi-arid can be characterized, the areas for which calculated RID lies within the range of 3 >RID > 2. The Noah run (and all simulations) also includes RID values much higher than 4 in some model grid points, which are set to 4 as this is an upper theoretical limit for the full aridity, based on Budyko’s work.
Over the south-western part of the domain shown in Figure 2, RID calculated by the five LSSs deviate considerably from the desert zone which represents the result of Noah, with the most pronounced difference being with CLM, which is the most elaborated scheme, in terms of numbers of soil layers. This may not imply complete shift to a different geobotanic zone as these large RID differences are still related to high absolute RID. RUC (with six and nine soil layers) calculations of RID over the Nile’s Delta also deviate away from this zone and can be explained by the higher latent heat (Figure S1 of Supplementary Material (SM)) simulated over this area. The two options of NoahMP over the Iberian Peninsula result in higher values of RID compared with Noah, which is due to the lower values of both latent heat and precipitation (Figures S1 and S2 in SM) simulated by the two options of NoahMP in comparison to Noah.
A strong relationship that exists between the geographic zones and the net-radiation along with the RID is presented in Figure 3 as adapted from Budyko 1974 [19]. The same values of RID corresponding to different geographical zones are located in different latitudinal belts (represented by the net-radiation), which emphasizes the differences in the moisture regimes within these natural zones. The diagrams shown in Figure 4 are produced using the output of the six simulations and are graphically presenting the relationship between the net radiation and the radiative index of dryness. The graphs of both options of NoahMP and CLM are closer to the original ones by Budyko (1974) [19] shown in Figure 3, whereas the rest have a larger spread of the data points, suggesting that the desert zone (RID > 3) is simulated to be extended into other areas where net radiation is either higher or lower (different latitudinal zones). Therefore, Noah and RUC with six and nine soil layers simulate more arid conditions than the other runs for some parts of the domain.
Focusing on the sub-regions in which the domain is divided, mean values of all the six experiments and the difference (Δ) of each run from the overall mean value are presented in Table 2. In some regions, RID takes values higher than four, which classifies as dessert. Generally, in terms of the different LSSs, CLM and the two RUC options result in lower values of RID compared to the overall mean, which corresponds to less dry conditions simulated by these three experiments. Noah and NoahMP with dynamic vegetation turned off and on, on the other hand, calculate positive Δ in most of the regions with drier conditions in comparison with the mean. The same analysis is made regarding the whole domain shown in Figure 2. Noah seems to be the only scheme to have higher values of RID, as the rest represent less dry conditions over the whole domain, with the results using RUC with nine soil layers to be closer to the overall mean value.
In the same table, two times the standard deviation (2σ) is derived from the outcome of six experiments and an indication of the “relative dispersion” are also shown. The latter quantity is calculated by dividing 2σ by the mean value of RID of the 6 simulations, for each sub-region separately. This is used as an indicator of the uncertainty, which allows for objective comparison among the different experiments for the different sub-domains, by taking into account the background values for each sub-domain. This fraction is smaller for the continental areas of Anatolia and the Balkans and higher for the three Mediterranean sub-regions, implying a possible land-sea control of the variance of the LSS-derived RID index. The domain as a whole manifests a “relative dispersion” of ~1 in a defined range of RID from 0 to 4.

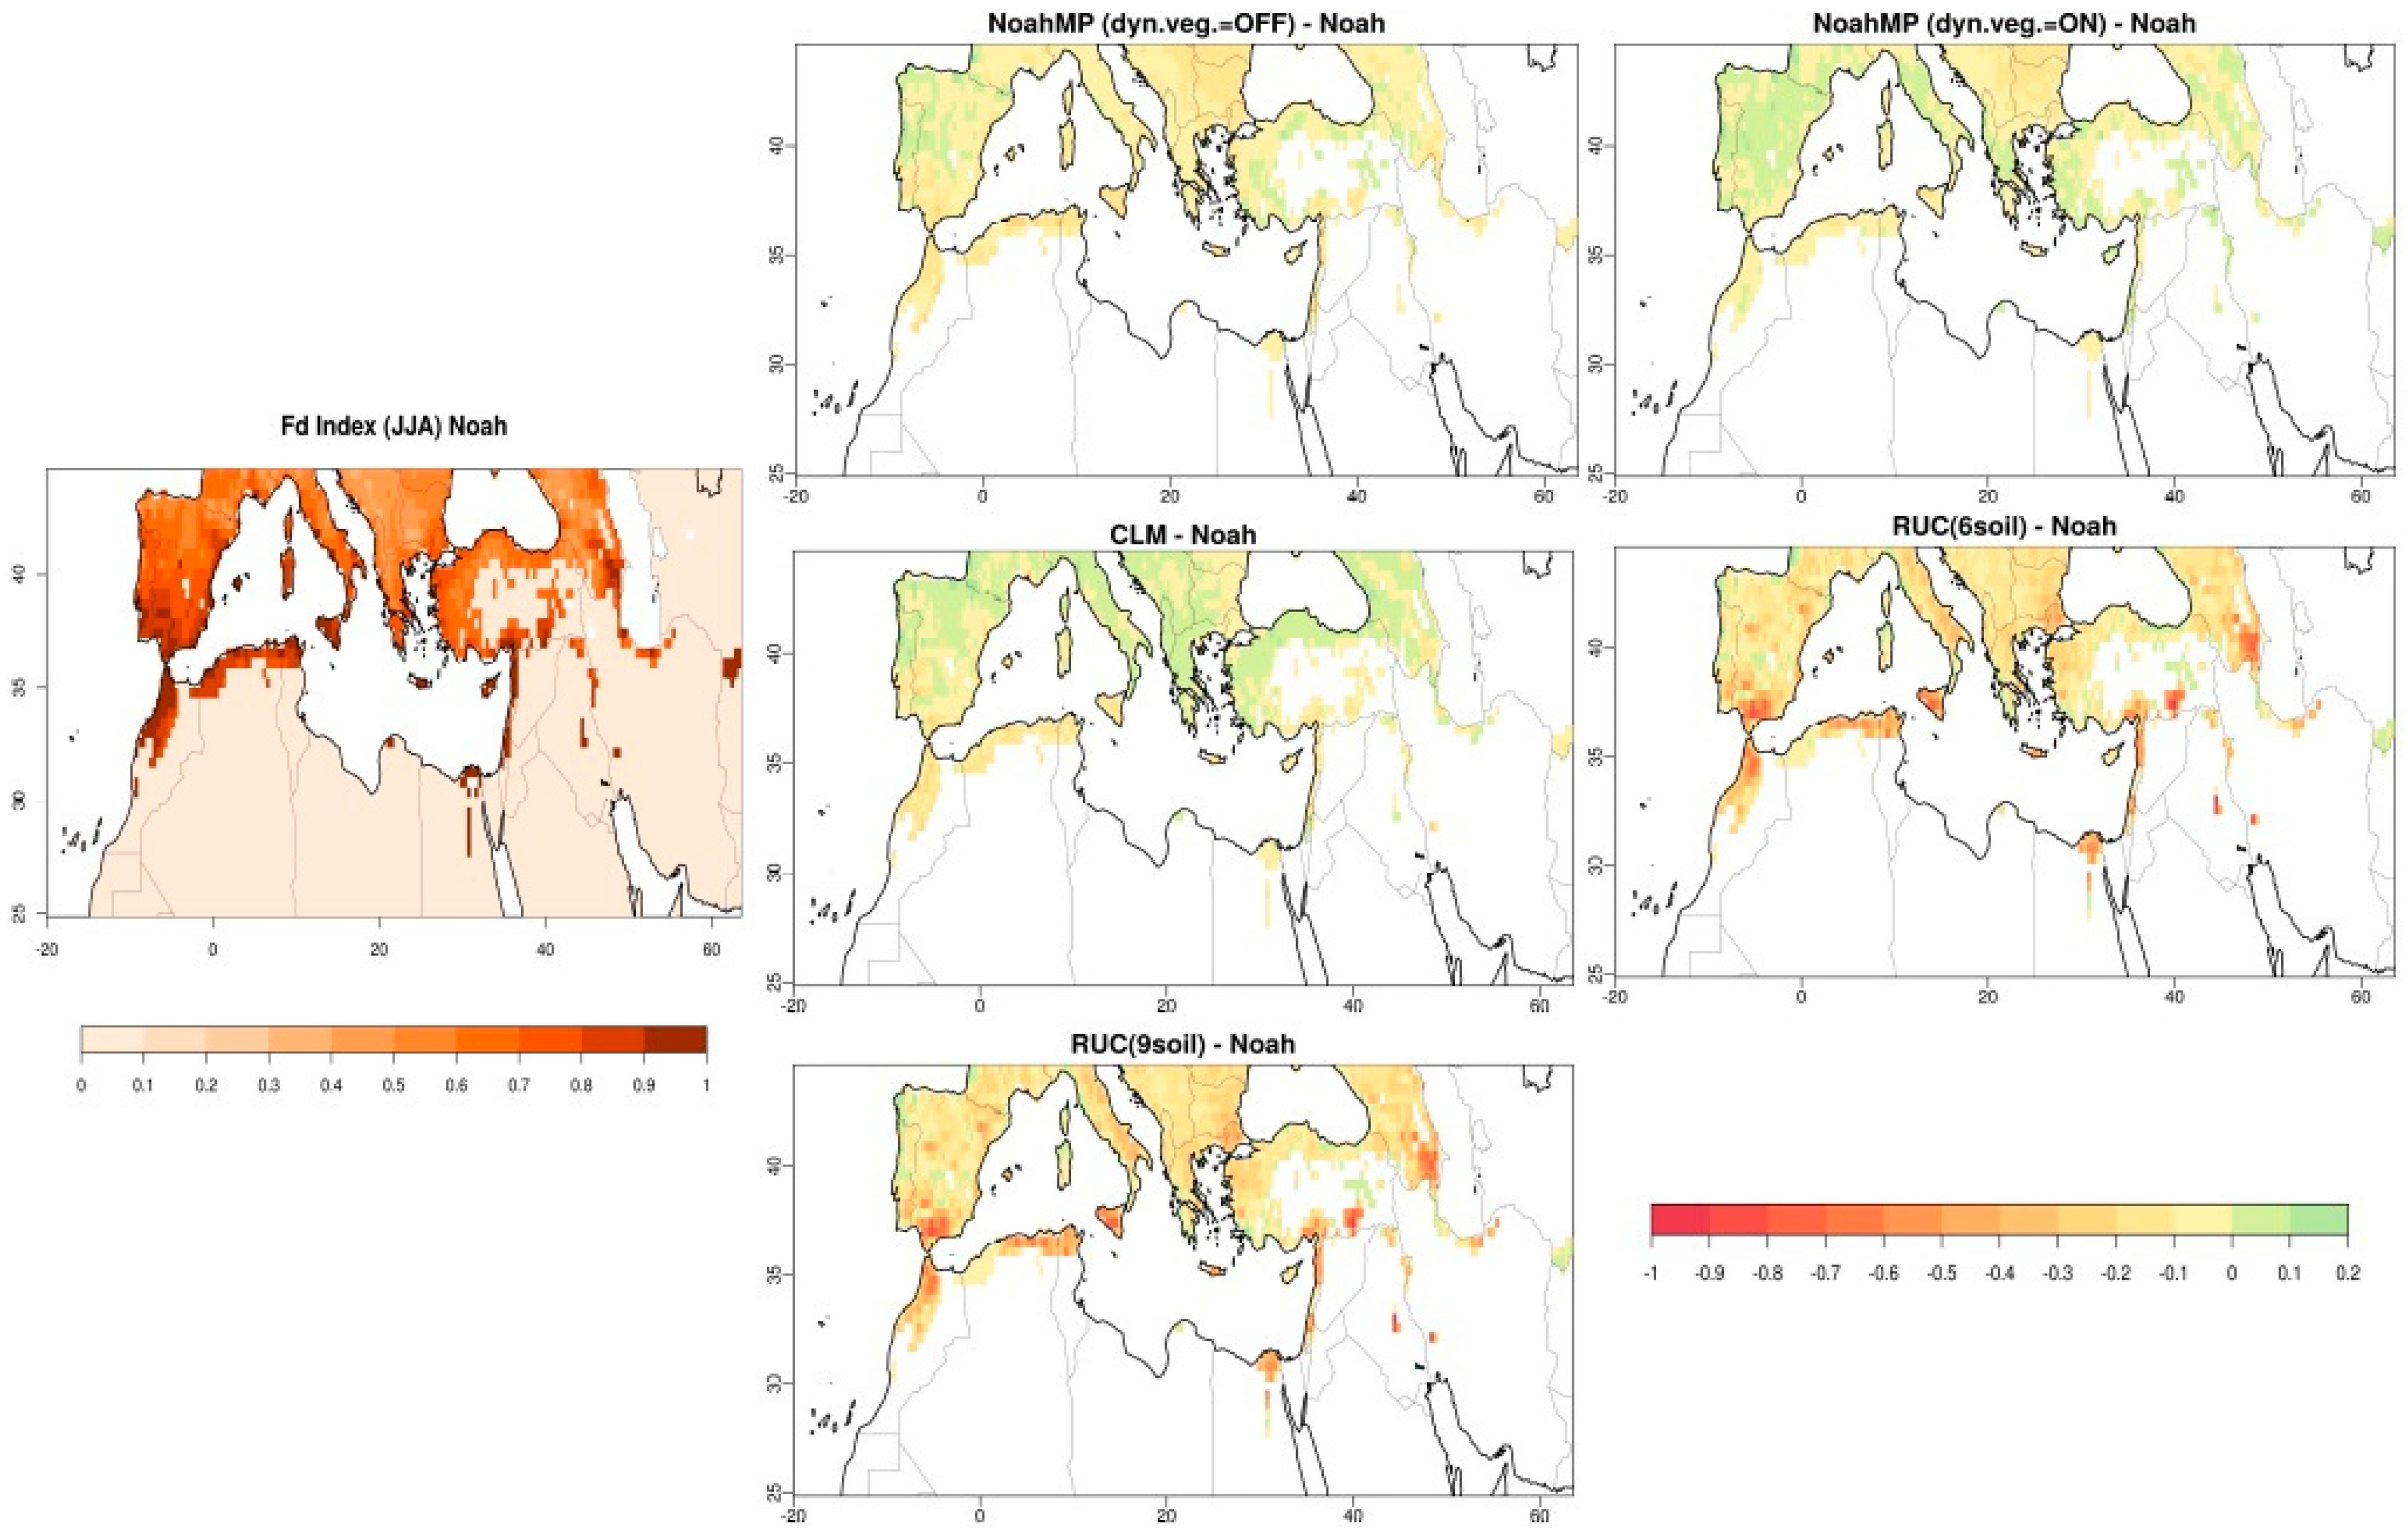
3.2. Fuel Dryness Index (Fd)

The level of dryness of a region is associated with its soil moisture content, which can be used to assess the fire risk in this particular area. Therefore, in this study, the Fuel Dryness Index (Fd) is calculated for the reduced MENA domain, with latent heat flux, net radiation and ground heat flux used as input climatic parameters. Prevailing climatic conditions together with the vegetation cover, are major elements that affect fire ignition and propagation. For this reason, the results of Fd calculations are masked by the WRF vegetation fraction for the boreal summer season (June, July, August—JJA) so that areas with no or very little vegetation (<20%) are excluded from calculations. Results are presented in Figure 5 as differences of each of five experiments against the reference Noah.
Fd approaches zero when fire potential is low, due to high values of ecosystem moisture, and it increases to one as the moisture is low and the chances of wildfire are higher [20]. Hence, in the reference experiment with the Noah scheme experiments, Fd has zero values in almost all the southern and eastern parts of the domain, due to the limited vegetation present in these areas. Conversely, in the Mediterranean countries and coastal area, the fire potential is simulated to be much higher.
Fd calculations using the CLM scheme deviate from the Noah simulations in a positive way, which is translated into higher fire potential in almost all the European part of the domain up to the Balkans. NoahMP with dynamic vegetation option turned on behaves in the same way over the Iberian Peninsula, Italy and Greece. All five LSSs, on the other hand, simulate less potential for fire in the coastal areas of Northern Africa with the most pronounced differences for the two options of RUC, which also include Sicily. All the above-mentioned differences are results of similar patterns in latent heat differences (Figure S3 in SM) simulated and used as input parameter for this index.
A sub-regional analysis is also made for the Fd index, using the same sub-domains as shown in Figure 1. The results are presented in Table 3, showing a mean value for each region of Fd for the summer period, averaged for 2000–2010 together with the difference of the average value of each simulation from the mean value of the six simulations, 2σ and the relative dispersion.
The most vulnerable areas to wild-fires seem to be the western Mediterranean together with the Balkans, while the Mesopotamian region is calculated to have the lowest fire potential of the six sub-domains presented here. Regarding the different LSSs in general, all of them calculate values of Fd close to the mean of each region. Both options of RUC though, have a negative delta, which can lead to the conclusion that they simulate low fire-risk for these smaller areas, compared to the rest of the schemes used in this study. Closer to the mean value are the results produced using NoahMP with dynamic vegetation off and on. The same calculations are made for the whole domain (as shown in the last column of Table 3), and Fd index behaves in the same way as described above with regards to the different schemes used.
The higher “relative dispersion” derived here as a fraction of the standard deviation and the mean value of Fd among the schemes is calculated for the region of Mesopotamia which is in a real sense the least vulnerable to fires, due to the fact that over most of this area the model vegetation fraction is very low. The calculations for Anatolia indicate the lowest uncertainty. It is also worth highlighting the fact that for the Mesopotamian region, 2σ is the lowest value that could lead to misleading conclusions regarding the uncertainty and it is more valuable to use the “relative dispersion” instead. Focusing on the different LSSs, RUC simulates the lowest values for this index over all six sub-regions, and Noah the highest. As for the whole domain, the fuel dryness index exhibits about 27 percent of relative dispersion (or degree of uncertainty).

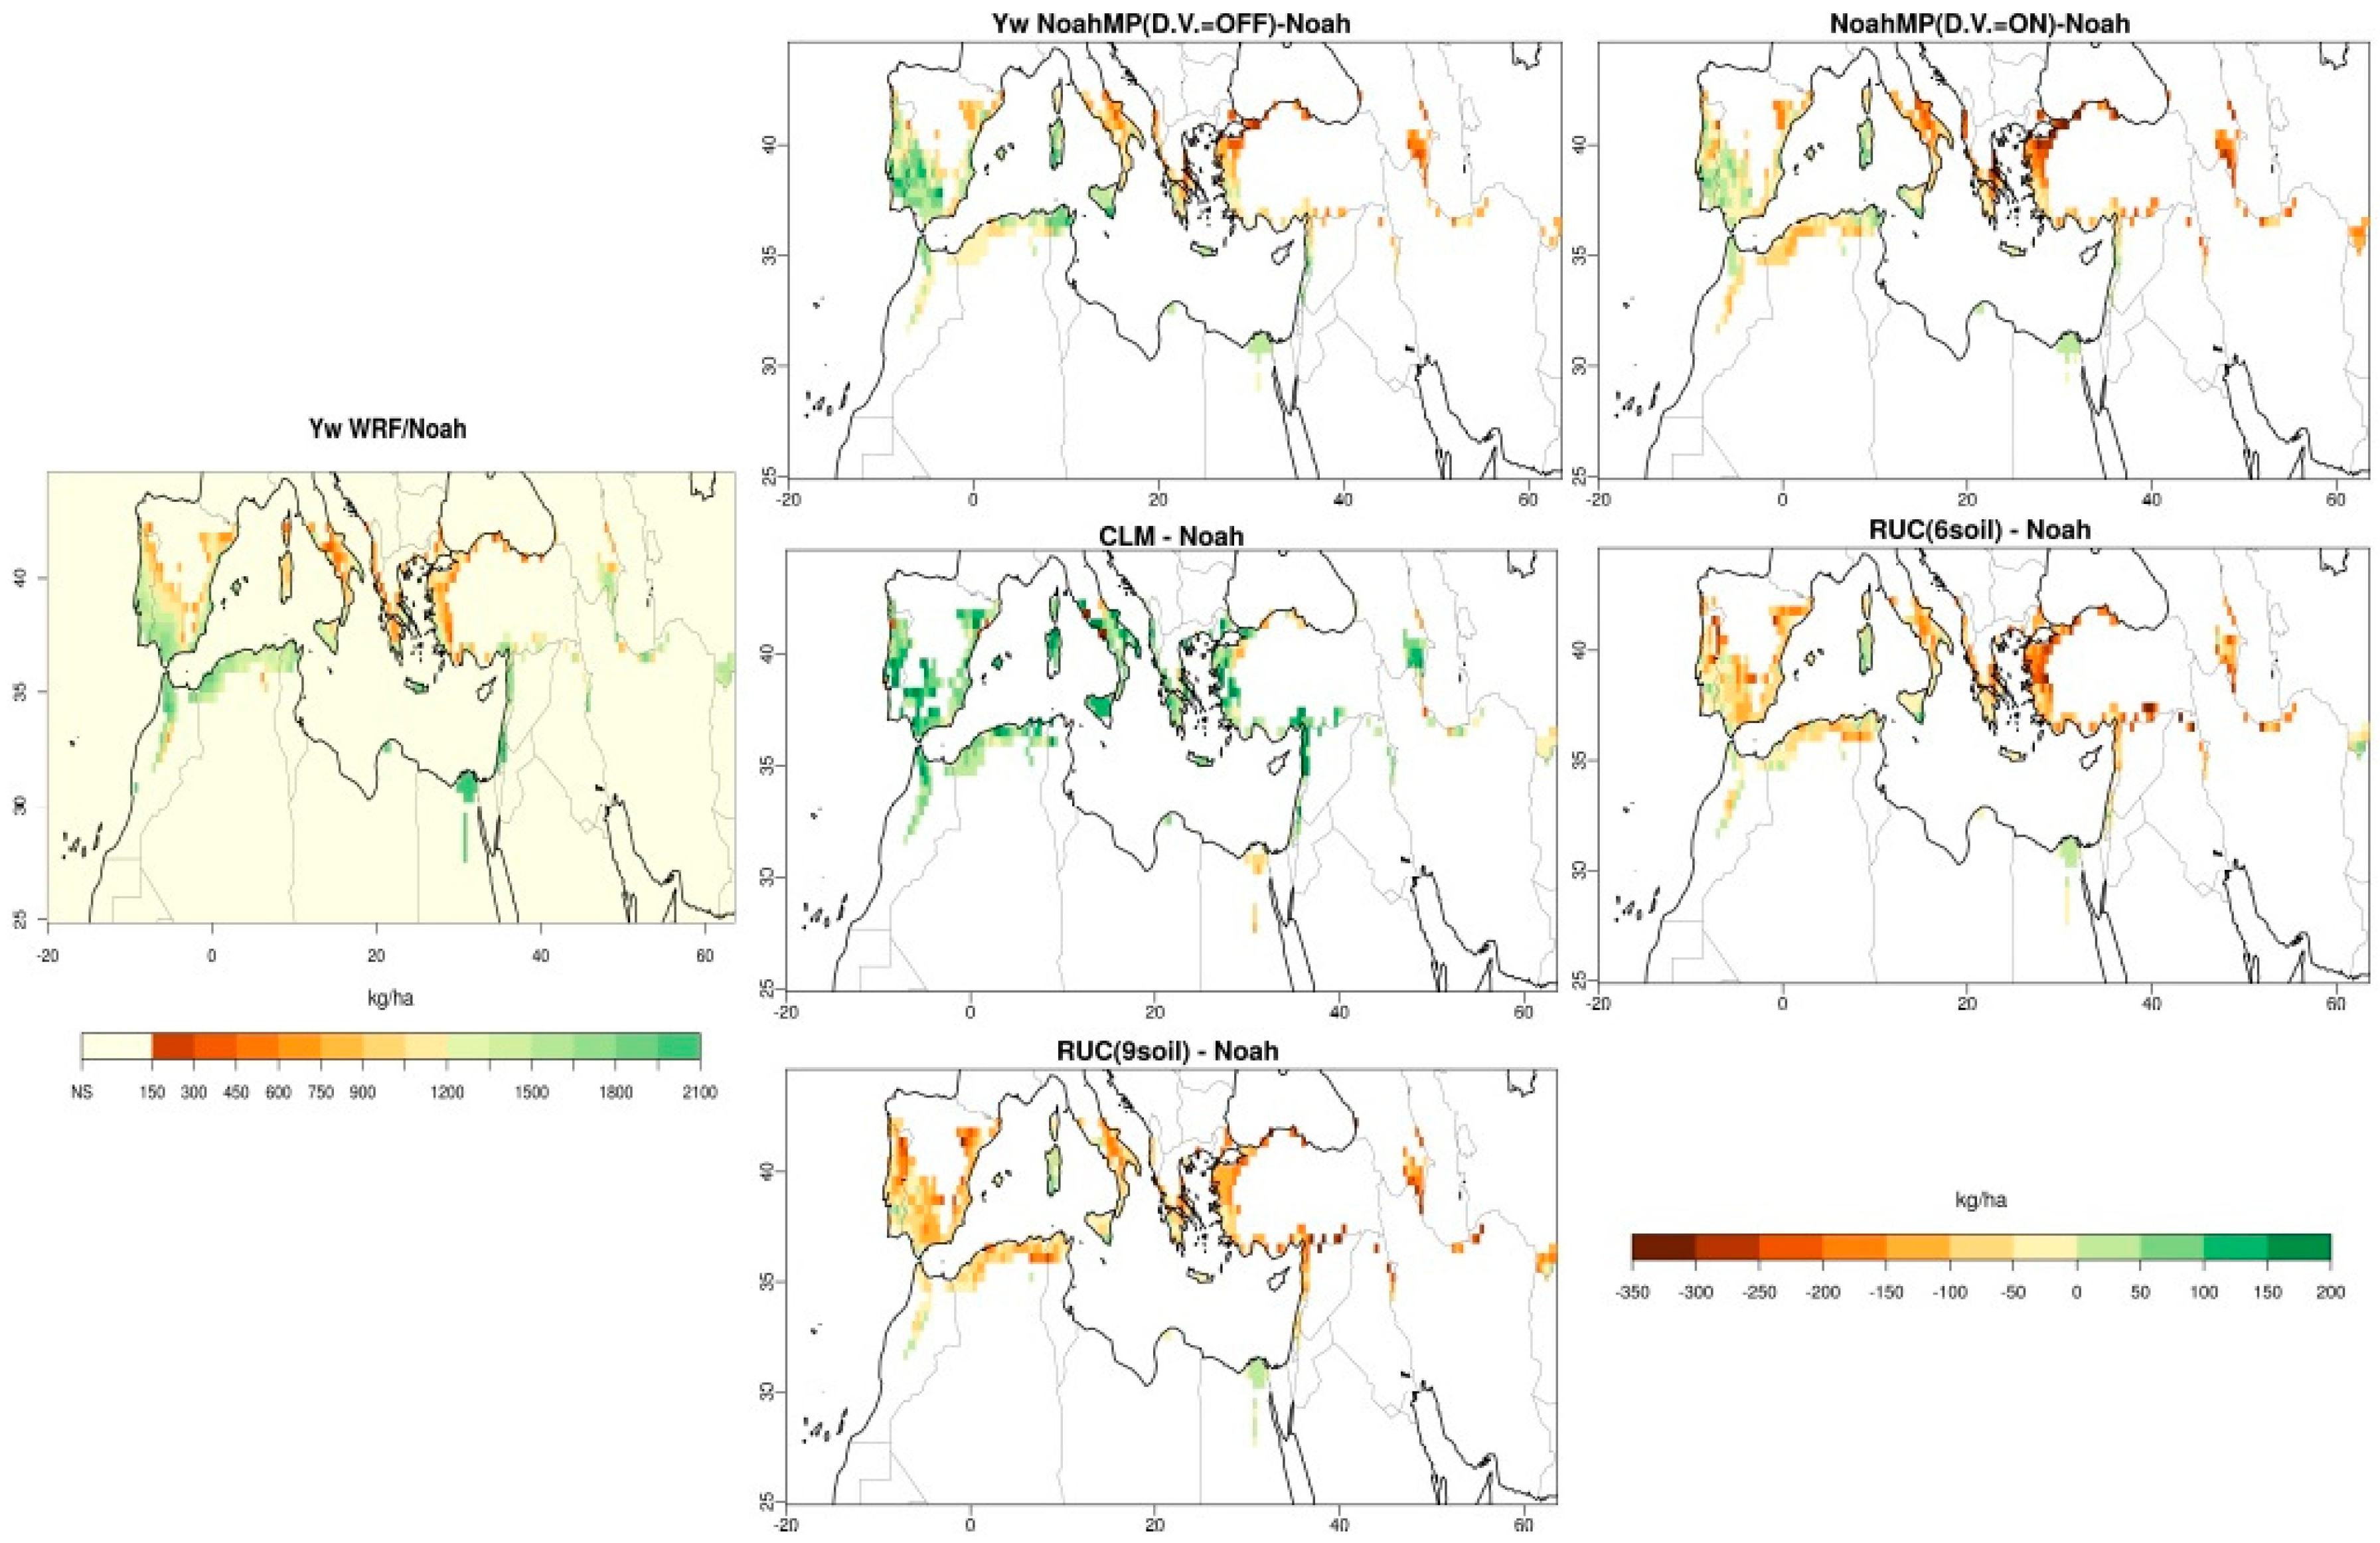
3.3. Water-Limited Yield (Yw)

Water-limited yield (Yw) of Durum (winter) wheat is calculated using the AEZ methodology for the growing period of 180 days, starting from the 1st of November and ending on the 30th of April (the same as in [4]). Daily climate data output is used as input for the calculations simulated by the WRF model for the 10-year period 2000–2010. In Figure 6 the results of Yw are presented in the same way as the previous shown indicators, after a vegetation fraction masking (the same as for Fd index) is performed. The southern and most of the northern part of the reduced MENA domain is not suitable for durum wheat cultivation (denoted as NS on the map of Yw using Noah), an outcome of the thermal suitability test performed [4]. The results of Yw presented in this study take into consideration only the simulated prevailing climatic conditions (and are not meant to be strictly comparable to the actual wheat production (from FAOSTAT) and spatial distribution of wheat cultivation [35]. CLM is the only LSS that calculates higher yields compared to the Noah in most of the suitable grid-boxes, while the rest show smaller amounts of yield, with the exception of the two NoahMP schemes over the southern part of the Iberian Peninsula and central Mediterranean (Corsica, Sardinia, Sicily and coastal area of Tunis). These differences correspond well to similar temperature change patterns (Figure S4 in SM), where warmer conditions in CLM compared to the reference Noah are associated with enhanced yields, while colder ones for the rest of the schemes result in reduced yields.
Mean values of Yw of the above-mentioned cultivar over the different sub-regions in the period of November–April, averaged for the 10-year period (December 2000–November 2010) for the six performed experiments along with the differences of the average for each experiment from the overall mean are listed in Table 4. Mainly, yield in the area of Mesopotamia seems to take the lowest simulated values, whereas the western Mediterranean is estimated to have higher yields. With regards to the different LSSs used for the calculations of Yw, overall RUC with six soil layers produces the values that deviate the most from the mean value for most of the sub-regions studied here. CLM on the other hand gives the highest values for all the Mediterranean regions.
The relative dispersion derived from the six simulations reveals that Eastern Mediterranean yields of durum wheat are the less variable according to these estimations, and calculations for the region of Mesopotamia lie on the other edge with the larger dispersion among the different simulations. The MENA domain, as a whole, seems to have relatively low relative dispersion and therefore “uncertainty” of about 10%.

4. Summary and Conclusions

This study investigated the variations in the estimation of three climate change-related indices from regional climate model output due to different land surface schemes. These indices are the Radiative Index of Dryness, the Fuel Dryness Index and the Water-limited Yield of winter wheat. Six simulations were performed using the WRF RCM over the MENA-CORDEX domain driven by ERA-Interim reanalysis data for the period of 2000–2010 using four different LSS (Noah, NoahMP, CLM and RUC). Our findings demonstrate that indices directly related to certain impact sectors (including rainfed agriculture, forest fires) are found to be sensitive to the choice of land surface schemes employed.
The effect on aridity was studied by calculating the Radiative Index of Dryness, introduced by Budyko to define geobotanical zones based on surface climate variables. CLM is the scheme that simulates values of RID that deviate the most from the outcome using Noah, which is considered as reference in the comparison presented in this work. CLM also has the lowest negative difference when compared with the overall mean of each sub-domain, which corresponds to less dry simulated conditions. The relative dispersion, defined as the fraction of 2σ and the overall mean value of the six experiments, was found to be 1 for the whole MENA domain under study (in a RID defined range between 0 to 4). Although this value would imply a considerable variation within the RID scale, it varied only a little for the low RID Anatolia and the Balkans and its larger dispersion for the other high RID sub-regions did not warrant a geobotanic zone shift.
The Fuel Dryness Index used to assess the fire potential of the region during the summer season, shows that the most vulnerable areas are the western Mediterranean and the Balkans. In the comparison made against Noah, CLM and both options of NoahMP in the northern part of the domain deviate positively from the reference, simulating higher fire potential. RUC gives the most pronounced negative differences over the coast of the North African region from the Noah experiment, representing reduced fire potential. Noah is the LSS that gives the highest and RUC the lowest values of this index. These differences can be ascribed to the corresponding changes in available surface moisture, as represented by the modelled latent heat flux. The LSS-induced dispersion in the Fuel Dryness Index (defined range of 0 to 1) was considerable, as it was between 0.2 to 0.4, and for the whole MENA region studied, about 25%.
From the calculations performed for the water-limited yield of winter wheat, the southern and most of the northern parts of the domain turn out to be not (thermally) suitable for cultivation. In the suitable areas, the Water Limited Yield simulated with all the LSS with the exception of CLM resulted in lower values compared to Noah. These differences fit well with similar temperature change patterns, where colder conditions simulated by all different LSSs (except CLM, which simulates the opposite) when compared to Noah, are associated with reduced yields of durum wheat (despite the respective increased simulated precipitation). Yield in the area of Mesopotamia seems to take the lowest simulated values, whereas the western Mediterranean is estimated to have higher yields. A MENA area relative dispersion of about 10% may not indicate large yield differences overall, but for specific sub-regions, this was larger (up to 40%).
Regional assessments of climate change impacts rely, apart from detailed impact sector models, on simpler approaches or indices. This study demonstrated the non-negligible effect of the choice of the land-surface parameterizations on model output-derived climate change relevant impact indices, such as wheat yield, fire risk and climatic zoning over the Mediterranean and most of the MENA region. It was therefore shown that a degree of uncertainty in those indices should be expected because of the land surface treatment (which is a part of the model physics uncertainty). A detailed sensitivity analysis of the modelled surface climate due to the different LSSs, with recommendations for the most suitable one for the WRF downscaling experiments over MENA, will be the subject of a separate study.

Supplementary Materials

The following are available online at https://www.mdpi.com/2073-4433/10/1/26/s1.

Author Contributions

Conceptualization, K.C. and P.H.; methodology, K.C. and P.H.; formal analysis, K.C., P.H. and G.Z.; data curation, K.C. and G.Z.; writing—original draft preparation, K.C.; writing—review and editing, P.H. and G.Z.; supervision, P.H.

Funding

K.C. received financial support by the Cyprus Institute, within the framework of her Doctoral research for the Ph.D. Program on Energy, Environment and Atmospheric Sciences.

Acknowledgments

We thank three anonymous reviewers for their valuable comments. Statistical analysis and figures were produced using the R-Project statistical-graphical software avialable at http://www.R-project.org. The model simulations were performed in the Cy-Tera supercomputer at the Cyprus Institute’s High Performance Computing Facility.

Conflicts of Interest

The authors declare no conflict of interest.

References

  1. Lelieveld, J.; Hadjinicolaou, P.; Kostopoulou, E.; Chenoweth, J.; El Maayar, M.; Giannakopoulos, C.; Hannides, C.; Lange, M.A.; Tanarhte, M.; Tyrlis, E.; et al. Climate change and impacts in the eastern Mediterranean and the Middle East. Clim. Chang. 2012, 114, 667–687. [Google Scholar] [CrossRef] [PubMed]
  2. Zittis, G.; Hadjinicolaou, P.; Fnais, M.; Lelieveld, J. Projected changes in heat wave characteristics in the eastern Mediterranean and the Middle East. Reg. Environ. Chang. 2016, 16, 1863–1876. [Google Scholar] [CrossRef]
  3. Lelieveld, J.; Proestos, Y.; Hadjinicolaou, P.; Tanarhte, M.; Tyrlis, E.; Zittis, G. Strongly increasing heat extremes in the Middle East and North Africa (MENA) in the 21st century. Clim. Chang. 2016, 137, 245–260. [Google Scholar] [CrossRef] [Green Version]
  4. Constantinidou, K.; Hadjinicolaou, P.; Zittis, G.; Lelieveld, J. Effects of climate change on the yield of winter wheat in the eastern Mediterranean and Middle East. Clim. Res. 2016, 69, 129–141. [Google Scholar] [CrossRef]
  5. Giorgi, F.; Gutowski, W.J., Jr. Regional dynamical downscaling and the CORDEX initiative. Annu. Rev. Environ. Resour. 2015, 40, 467–490. [Google Scholar] [CrossRef]
  6. Laprise, R. Regional climate modeling. J. Comput. Phys. 2008, 227, 3641–3666. [Google Scholar] [CrossRef]
  7. Rummukainen, M. State-of-the-art with regional climate models. Wiley Interdiscip. Rev. Clim. Chang. 2010, 1, 82–96. [Google Scholar] [CrossRef]
  8. Betts, A.K. Land-Surface-Atmosphere Coupling in Observations and Models. J. Adv. Model. Earth Syst. 2009, 1, 4. [Google Scholar] [CrossRef]
  9. Seneviratne, S.I.; Stöckli, R. The Role of Land–Atmosphere Interactions for Climate Variability in Europe. In Climate Variability and Extremes during the Past 100 Years; Brönnimann, S., Luterbacher, J., Ewen, T., Diaz, H., Stolarski, R., Neu, U., Eds.; Springer: Dordrecht, The Netherlands, 2008. [Google Scholar]
  10. Seneviratne, S.I.; Corti, T.; Davin, E.L.; Hirschi, M.; Jaeger, E.B.; Lehner, I.; Orlowsky, B.; Teuling, A.J. Investigating soil moisture-climate interactions in a changing climate: A review. Earth-Sci. Rev. 2010, 99, 125–161. [Google Scholar] [CrossRef]
  11. Cheng, W.; Moore, J.C.; Cao, L.; Ji, D.; Zhao, L. Simulated climate effects of desert irrigation geoengineering. Sci. Rep. 2017, 7, 46443. [Google Scholar] [CrossRef] [Green Version]
  12. Lin, Y.; Dong, W.; Zhang, M.; Xie, Y.; Xue, W.; Huang, J.; Luo, Y. Causes of model dry and warm bias over central U.S. and impact on climate projections. Nat. Commun. 2017, 8, 881. [Google Scholar] [CrossRef] [PubMed] [Green Version]
  13. Sippel, S.; Zscheischler, J.; Mahecha, M.D.; Orth, R.; Reichstein, M.; Vogel, M.; Seneviratne, S.I. Refining multi-model projections of temperature extremes by evaluation against land–atmosphere coupling diagnostics. Earth Syst. Dyn. 2017, 8, 387–403. [Google Scholar] [CrossRef]
  14. Davin, E.L.; Maisonnave, E.; Seneviratne, S.I. Is land surface processes representation a possible weak link in current Regional Climate Models? Environ. Res. Lett. 2016, 11, 074027. [Google Scholar] [CrossRef] [Green Version]
  15. Tanarhte, M.; Hadjinicolaou, P.; Lelieveld, J. Intercomparison of temperature and precipitation data sets based on observations in the Mediterranean and the Middle East. J. Geophys. Res. 2012, 117, D12102. [Google Scholar] [CrossRef]
  16. Zittis, G. Observed rainfall trends and precipitation uncertainty in the vicinity of the Mediterranean, Middle East and North Africa. Theor. Appl. Climatol. 2017. [Google Scholar] [CrossRef]
  17. Giorgi, F.; Jones, C.; Asrar, G.R. Addressing climate information needs at the regional level? The CORDEX Framework. WMO Bull. 2009, 58, 175–183. [Google Scholar]
  18. Stéfanon, M.; Martin-StPaul, N.K.; Leadley, P.; Bastin, S.; Dell’Aquila, A.; Drobinski, P.; Gallardo, C. Testing climate models using an impact model: What are the advantages? Clim. Chang. 2015, 131, 649–661. [Google Scholar] [CrossRef]
  19. Budyko, M.I. Chapter VI: Climatic factors of geographic zonality. Geophys. J. Int. 1974, 18, 317–370. [Google Scholar]
  20. Snyder, R.L.; Spano, D.; Duce, P.; Baldocchi, D.; Xu, L. A fuel dryness index for grassland fire-danger assessment. Agric. For. Meteorol. 2006, 139, 1–11. [Google Scholar] [CrossRef]
  21. Zittis, G.; Hadjinicolaou, P.; Lelieveld, J. Comparison of WRF physics parameterizations over the MENA-CORDEX domain. Am. J. Clim. Chang. 2014, 3, 490–511. [Google Scholar] [CrossRef]
  22. Zittis, G.; Hadjinicolaou, P. The effect of radiation parametererization schemes on surface temperature in regional climate simulations over the MENA-CORDEX domain. Int. J. Climatol. 2017, 37, 3847–3862. [Google Scholar] [CrossRef]
  23. Tewari, M.; Chen, F.; Wang, W.; Dudhia, J.; LeMone, M.A.; Mitchell, K.; Ek, M.; Gayno, G.; Wegiel, J.; Cuenca, R.H. Implementation and verification of the unified NOAH land surface model in the WRF model. In Proceedings of the 20th Conference on Weather Analysis and Forecasting, Seattle, WA, USA, 12–16 January 2004; In Proceedings of the 16th Conference on Numerical Weather Prediction, Seattle, WA, USA, 12–16 January 2004. pp. 11–15. [Google Scholar]
  24. Niu, G.Y.; Yang, Z.L.; Mitchell, K.E.; Chen, F.; Ek, M.B.; Barlage, M.; Kumar, A.; Manning, K.; Niyogi, D.; Rosero, E.; et al. The community Noah land surface model with multiparameterization options (Noah-MP): 1. Model description and evaluation with local—Scale measurements. J. Geophys. Res. 2011, 116, D12109. [Google Scholar] [CrossRef]
  25. Oleson, K.W.; Lawrence, D.M.; Gordon, B.; Flanner, M.G.; Kluzek, E.; Peter, J.; Levis, S.; Swenson, S.C.; Thornton, E.; Feddema, J.; et al. Technical Description of Version 4 of the Community Land Model (CLM); NCAR Tech. Note NCAR/TN–478+STR; National Center for Atmospheric Research: Boulder, CO, USA, 2010; 266p. [Google Scholar]
  26. Benjamin, S.G.; Grell, G.A.; Brown, J.M.; Smirnova, T.G.; Bleck, R. Mesoscale weather prediction with the RUC hybrid isentropic-terrain-following coordinate model. Mon. Weather Rev. 2004, 132, 473–494. [Google Scholar] [CrossRef]
  27. Nyman, P.; Sherwin, C.; Langhans, C.; Sheridan, G.; Lane, P. Downscaling regional climate data to calculate the radiative index of dryness in complex terrain. Aust. Metrol. Oceanogr. J. 2014, 64, 109–122. [Google Scholar] [CrossRef]
  28. Berry, S.L.; Farquhar, G.D.; Roderick, M.L. Co-Evolution of Climate, Soil and Vegetation. Encyclopedia of Hydrological Sciences; John Wiley & Sons, Ltd.: Hoboken, NJ, USA, 2006. [Google Scholar]
  29. Ciais, P.; Reichstein, M.; Viovy, N.; Granier, A.; Ogée, J.; Allard, V.; Aubinet, M.; Buchmann, N.; Bernhofer, C.; Carrara, A.; et al. Europe-wide reduction in primary productivity caused by the heat and drought in 2003. Nature 2005, 437, 529–533. [Google Scholar] [CrossRef] [PubMed]
  30. Iizumi, T.; Luo, J.J.; Challinor, A.J.; Sakurai, G.; Yokozawa, M.; Sakuma, H.; Brown, M.E.; Yamagata, T. Impacts of El Niño Southern Oscillation on the global yields of major crops. Nat. Commun. 2014, 5, 3712. [Google Scholar] [CrossRef] [PubMed] [Green Version]
  31. Olesen, J.E.; Bindi, M. Consequences of climate change for European agricultural productivity, land use and policy. Eur. J. Agron. 2002, 16, 239–262. [Google Scholar] [CrossRef]
  32. Fischer, G.; van Velthuizen, H.; Shah, M.; Nachtergaele, F. Global Agro-Ecological Assessment for Agriculture in the 21st Century: Methodology and Results; IIASA Research Report RR-02; International Institute for Applied Systems Analysis: Laxenburg, Austria, 2002. [Google Scholar]
  33. Teixeira, E.I.; Fischer, G.; van Velthuizen, H.; Walter, C.; Ewert, F. Global hot-spots of heat stress on agricultural crops due to climate change. Agric. For. Meteorol. 2013, 170, 206–215. [Google Scholar] [CrossRef]
  34. Sacks, J.W.; Deryng, D.; Foley, J.; Ramankutty, N. Crop planting dates: An analysis of global patterns. Glob. Ecol. Biogeogr. 2010, 19, 607–620. [Google Scholar] [CrossRef]
  35. Zampieri, M.; Ceglar, A.; Dentener, F.; Toreti, A. Wheat yield loss attributable to heat waves, drought and water excess at the global, national and subnational scales. Environ. Res. Lett. 2017, 12, 064008. [Google Scholar] [CrossRef] [Green Version]
Figure 1. Orography of the MENA domain used in the analysis, with the 6 sub-regions (Anatolia, Balkans, western, central & eastern Mediterranean and Mesopotamia).
Atmosphere 10 00026 g001
Figure 2. Annual radiative index of dryness (RID) averaged for December 2000–November 2010 by Noah (on the right-hand side) and the differences in RID by NoahMP dyn. Veg. = OFF & ON, CLM and RUC 6 and 9 soil layers from Noah.
Atmosphere 10 00026 g002
Figure 3. Diagram of the geobotanic zonality (adapted from Budyko et al 1974).
Atmosphere 10 00026 g003
Figure 4. Annual means of Radiative Index of Dryness (x-axis) vs. annual means of net radiation (y-axis).
Atmosphere 10 00026 g004
Figure 5. Fuel dryness index (Fd) for the summer period (JJA) averaged for 2000–2010 by Noah (on the right-hand side) and the differences in Fd by NoahMP dyn. Veg. = OFF & ON, CLM and RUC 6 and 9 soil layers from Noah.
Atmosphere 10 00026 g005
Figure 6. Water-limited yield (Yw) for durum (winter) wheat for the growing period of 1 November–30 April averaged for 2000–2010 by Noah (on the right-hand side) and the differences of Yw by NoahMP dyn. Veg.= OFF & ON, CLM and RUC 6 and 9 soil layers from Noah.
Atmosphere 10 00026 g006
Table 1. Description of the six performed experiments.
Experiment No.Land Surface SchemeNumber of Soil Layers
Run 1Noah4
Run 2Noah-MP
Dynamic vegetation = OFF
4
Run 3Noah-MP
Dynamic vegetation = ON
4
Run 4CLM10
Run 5RUC6
Run 6RUC9
Table 2. Mean values of RID derived from the six experiments, the difference (Δ) of each run from the overall mean value, two times standard deviation and the “relative dispersion” for the six sub-domains (Anatolia, Balkans, western, central & eastern Mediterranean and Mesopotamia) and the reduced MENA domain.
RIDanatbalkwmedcmedemedmesoWhole Domain
Mean (r1:r6)0.3010.1765.84611.47327.3798.2123.511
ΔNoah0.1100.064−3.6187.59434.3976.6607.038
ΔNoahMP
(dyn.veg. = off)
0.0010.0089.1144.0970.670−0.149−1.464
ΔNoahMP
(dyn.veg. = on)
−0.023−0.0129.5954.6080.028−0.071−1.450
ΔCLM−0.0520.004−5.120−6.715−19.813−4.905−2.529
ΔRUC (6soil)−0.015−0.031−4.945−4.626−7.700−1.216−0.978
ΔRUC (9soil)−0.022−0.034−5.027−4.959−7.581−0.318−0.616
2*σ0.1140.07214.53612.22436.8017.4843.507
Rel. Disp.0.3790.4092.4871.0651.3440.9110.999
Table 3. Mean values of Fd derived from the six experiments, the difference (Δ) of each run from the overall mean value, two times standard deviation and the “relative dispersion” for the six sub-domains (Anatolia, Balkans, western, central & eastern Mediterranean and Mesopotamia) and the reduced MENA domain.
FdanatbalkwmedcmedemedmesoWhole Domain
Mean (r1:r6)0.3320.4170.4530.1070.1200.0390.154
ΔNoah0.0230.1010.0530.0230.0170.0060.018
ΔNoahMP
(dyn.veg. = off)
0.015−0.0280.0150.0040.0110.0040.005
ΔNoahMP
(dyn.veg. = on)
0.0190.0060.0480.0150.0150.0070.014
ΔCLM0.0300.0870.0300.0110.0110.0040.014
ΔRUC (6soil)−0.040−0.079−0.071−0.026−0.027−0.011−0.025
ΔRUC (9soil)−0.046−0.086−0.076−0.027−0.026−0.010−0.026
2*σ0.0680.1600.1170.0430.0420.0160.041
Rel. Disp.0.2050.3840.2580.4020.3500.4060.265
Table 4. Mean values of Yw for durum wheat derived from the six experiments, the difference (Δ) of each run from the overall mean value, two times standard deviation and the “relative dispersion” for the six sub-domains (Anatolia, Balkans, western, central & eastern Mediterranean and Mesopotamia) and the reduced MENA domain.
YwanatbalkwmedcmedemedmesoWhole Domain
Mean (r1:r6)701.225737.064803.143354.810487.29560.329241.175
ΔNoah0.31426.18025.75912.0392.900−2.5192.287
ΔNoahMP
(dyn.veg. = off)
100.22022.3573.994−5.81414.0329.7823.942
ΔNoahMP
(dyn.veg. = on)
17.929−35.8166.455−11.8230.7705.657−21.633
ΔCLM33.07688.14191.37936.84417.9465.11926.918
ΔRUC (6soil)−171.354−127.924−72.245−8.818−23.2781.734−4.329
ΔRUC (9soil)19.81427.062−55.341−22.429−12.370−19.773−7.186
2*σ181.581147.875117.82442.49131.27721.05622.056
Rel. unc.0.2590.2010.1470.1200.0640.3490.091

