Article

Qualitative and Quantitative Investigation of Multiple Large Eddy Simulation Aspects for Pollutant Dispersion in Street Canyons Using OpenFOAM

by
Arsenios E. Chatzimichailidis
1,
Christos D. Argyropoulos
2,
Marc J. Assael
1 and
Konstantinos E. Kakosimos
3,*
1
Department of Chemical Engineering, Aristotle University of Thessaloniki, GR54636 Thessaloniki, Greece
2
System Reliability & Industrial Safety Lab, Institute of Nuclear & Radiological Sciences & Technology, Energy and Safety, National Centre for Scientific Research “Demokritos”, GR15310 Athens, Greece
3
Department of Chemical Engineering and Mary Kay O’Connor Process Safety Center, Texas A&M University at Qatar, Education City, PO BOX 23874 Doha, Qatar
*
Author to whom correspondence should be addressed.
Atmosphere 2019, 10(1), 17; https://doi.org/10.3390/atmos10010017
Submission received: 22 November 2018 / Revised: 14 December 2018 / Accepted: 18 December 2018 / Published: 7 January 2019
(This article belongs to the Special Issue Pollutant Dispersion in the Atmospheric Boundary Layer)

Abstract

:
Air pollution is probably the single largest environment risk to health and urban streets are the localized, relevant hotspots. Numerous studies reviewed the state-of-the-art models, proposed best-practice guidelines and explored, using various software, how different approaches (e.g., Reynolds-averaged Navier–Stokes (RANS), large eddy simulations (LES)) inter-compare. Open source tools are continuously attracting interest but lack of similar, extensive and comprehensive investigations. At the same time, their configuration varies significantly among the related studies leading to non-reproducible results. Therefore, the typical quasi-2D street canyon geometry was selected to employ the well-known open-source software OpenFOAM and to investigate and validate the main parameters affecting LES transient simulation of a pollutant dispersion. In brief, domain height slightly affected street level concentration but source height had a major impact. All sub-grid scale models predicted the velocity profiles adequately, but the k-equation SGS model best-resolved pollutant dispersion. Finally, an easily reproducible LES configuration is proposed that provided a satisfactory compromise between computational demands and accuracy.

1. Introduction

Air pollution is a well-known problem of modern cities and despite the great on pollutant control technology, it is still very difficult to ensure the elimination of the anticipated consequences in environment and human population. Therefore, the need for studying air pollution becomes apparent, since it is recognized as one of the main reasons of a large number of deaths [1]. Air pollution can be studied systematically by adopting various experimental and numerical methods, such as small air quality models (AQMs) [2], wind tunnel experiments [3], field measurements [4], computational fluid dynamics (CFD) models [5,6,7], and semi-empirical models [8,9].
Turbulence modelling is a core issue to address in CFD and it poses unique challenges for flows in the urban infrastructure [10]. The large size of buildings and high velocities of the atmospheric boundary layer result in highly turbulent flows [11], which are computationally expensive to simulate [12]. Depending on the selected CFD technique, the whole spectrum of turbulent motions can either be resolved, modeled, or a combination of both.
Solutions of the Navier–Stokes equations for turbulent flows can be obtained using various numerical and analytical approaches, providing with different level of accuracy in each case. The most ‘accurate’ approach is the direct numerical simulation (DNS), which involves the numerical solution of the full spectrum of turbulence without the need of any modeling [13]. Even though DNS provides a high-fidelity representation of the physical phenomena, it is unfeasible for urban-scale flows and it is usually executed for flows with low Reynolds numbers owe to its high-computational cost [14]. On the other end, the Reynolds-averaged Navier–Stokes (RANS) simulation is a more feasible method that provides a time-averaged representation (or steady-state solution) of the studied phenomena with less demands in terms of computer speed and memory [15]. RANS (and unsteady-RANS) approach employs the Reynolds decomposition, a mathematical technique that separates the flow properties into the average and fluctuating components. This decomposition introduces the Reynolds-stress tensor, creating the well-known ‘closure problem’, which is solved by the addition of a turbulence model.
Another modelling approach, which demands less computational resources than DNS and resolves turbulence with more accuracy than unsteady-RANS, is the large eddy simulation (LES) method. LES begins with the filtering of Navier–Stokes equations, which divides turbulence into the large-scale resolved part and the sub-grid scale (SGS) modelled part [13]. The LES approach provides a time-dependent solution of the problem, with more details than RANS, as LES resolves a larger percentage of turbulence spectrum [16]. RANS and LES are the most common techniques to simulate atmospheric flows between buildings [17,18]. The general notion is that LES can capture the simulated phenomena with greater details, but it requires increasing computational power and time [19]. Due to their transient solution, LES can provide better prediction for the maximum values of concentrations, which is important for simulations involving toxic materials [20]. Moreover, LES is proven to provide results that are validated with experimental data from water channels [21,22], as well as wind tunnels [17,23,24,25]. Regarding the quasi-2D LES setup, there are many applied LES configurations. For example, Chung and Liu [26] employed the classic Smagorinsky SGS model [27], with the selected value of the Smagorinsky constant (Cs) being taken equal to 0.135. Moreover, Li studied the effect of the aspect ratio (AR) and heated walls to the flow and dispersion, for AR from 2 to 10 [21], using the one-equation SGS model by Moeng and Sullivan [28], which solves an additional transport equation for the SGS turbulence kinetic energy. At the solid boundaries, a 1/7 power-law wall model [29] was applied. The flow field was validated against water channel experimental data [30], while the concentration field was compared with wind tunnel measurements [31,32,33], presenting good agreement in all cases. Furthermore, Cai performed LES with the RAMS code [34] to investigate street canyon flow for quasi-2D [35] and 3D geometries [36]. The standard Smagorinsky model was adopted for the SGS modelling, with Cs equal to 0.1. The value of the constant was further tested by Cui et al. [37] to show that larger Cs values can cause excessive dissipation, while smaller ones create numerical errors. The obtained numerical results were compared with available wind tunnel experimental data [3,38,39] for the quasi-2D geometry [40] and water channel experimental data [41,42] for the 3D geometry.
Additionally, LES has been coupled with simplified and computationally affordable custom models of photochemical reactions under neutral atmospheric conditions in order to validate simple chemical AQMs [43]. For a deep street canyon (AR = 2), Zhong et al. [22] implemented the typical boundary conditions and compared the results with water channel data by Li et al. [30]. The k-equation eddy-viscosity SGS model [44] along with the logarithmic law of the rough wall [45] were used for the LES method. The obtained datasets of the spatial and temporal distributions of the reacting pollutants were used for validating a simple chemical box model [46].
Recently, Kikumoto and Ooka [47] performed a high resolution LES study for the investigation of turbulent dispersion in a unity street canyon, with the aim to reproduce a physical experiment of passive tracer dispersion. They predicted the mean and root-mean-square (RMS) velocity and concentration levels, exhibiting fair agreement with the experimental data, except from slight underestimation for the concentration fluctuations near the source. The same work suggests that the LES method could eventually replace wind tunnel experiments, although with the burden of extremely high grid resolution.
In all these studies, the main objective was to simulate a street canyon flow using LES, while only in very few of them was there an attempt to describe and fully justify the appropriate LES configuration (e.g., SGS models, grid resolution, time-step and boundary conditions, among others) for the considered problem. To spend more time studying the employed phenomena, available CFD commercial codes are treated as black boxes and past works or guidelines are followed without adequate explanation or justification.
Therefore, in this study we selected a simple, yet important, street canyon geometry (described in Section 2) to conduct a comprehensive investigation, with verification and validation, of various parameters affecting LES. The open-source code OpenFOAM v5.0 [48] has been utilized for this investigation (details discussed in Section 3), for a typical quasi-2D geometry in ‘real’ scale, i.e., the height of buildings is set to 10 m. The investigated parameters are the domain height, the grid resolution, time step, Reynolds number, source height, four of the available SGS models, and three different wall functions. The obtained results for each parameter are qualitatively and quantitatively analyzed to understand its impact and identify the most suitable modelling configuration (presented in Section 4). Results are also compared extensively with available experimental and numerical data from the literature. Finally, the most important findings are summarized along with potential future studies (listed in Section 5).

2. Physical Problem

Many cities have complex layouts, created by a diverse variety of structures, ranging from the usual cubical buildings to skyscrapers and stadiums. Depending on the computational power and the scope of the work, the computational grid may contain whole cities, building blocks or street canyon(s), which is the basic structural unit of the city. Figure 1a presents the special (ideal case) of an ‘infinite length’ (L) street canyon, formed by two (rows of) rectangular parallelepiped buildings with height (H) and width (B), and a perpendicular wind direction (left to right). Because of the infinite length and the resulted symmetry, this is considered as a quasi-2D geometry.
Both the height and width of the buildings are set to 10 m, while the street width (W) can vary to depending on the studied AR (here in AR = 1). In the streamwise direction, the computational domain begins from the second half of the upwind and ends at the first half of the downwind building. In the spanwise direction, half (H/2) of the buildings’ width is contained, effectively simulating a ‘slice’ of the street canyon. The upper boundary extends at five building heights (5H); more details in a following section.
Since the studied area is the smallest possible and the geometry is simple and ideal, the creation of a high resolution, fully structured, hexahedral mesh is easy and applicable. Structured hexahedral meshes discretize the computational domain more efficiently [49] and can have cells aligned with the flow direction, thus achieving smaller numerical errors [50] and better spatial convergence [51]. The height and width of the buildings are discretized with 120 and 60 cells, respectively, and the depth of the street is set to 60 cells, satisfying the demand for 3D LES. The cells are smaller near the solid boundaries, to resolve the flow characteristics of the wall boundary layer, reaching a 0.0038 m width. The Reynolds number (Re = Uref⋅H/v) is around 3,200,000, calculated using the reference velocity Uref at the top (5 m⋅s−1), the kinematic viscosity of air, v, and the building height H.

3. Model Description

3.1. Governing Equations

The current study is carried out by using the LES methodology [52]. The unsteady, three-dimensional incompressible filtered Navier–Stokes equations [16] can be written in Cartesian tensor notation as follows.
Filtered continuity equation
u ¯ i x i = 0
Filtered momentum equations
u ¯ i t + u ¯ i u ¯ j x j = 1 ρ p ¯ x i τ i j x j + v 2 u ¯ i x j x j
where u ¯ i is the filtered mean velocity component in the i-direction, u ¯ j is the filtered mean velocity component in the j-direction, xi,j is the distance in the i- and j- directions, p ¯ is the filtered pressure, v is the kinematic molecular viscosity, ρ is the density, t is the time and the subscript indices i, j (= 1, 2, 3) denote the three space coordinates. τ i j is the SGS stress tensor and is analysed by the Leonard decomposition [53] as
τ i j = u i u j ¯ u ¯ i u ¯ j = L i j + C i j + R i j = ( u ¯ i u ¯ j ¯ u ¯ i u ¯ j ) + ( u ¯ i u j ¯ + u i u ¯ j ¯ ) + u i u j ¯
where L i j is the Leonard term, C i j is the Cross term and R i j is the Reynolds term. Each term represents physical interactions between the resolved and modelled scales of the flow that arise from the LES approach [13].
The coupled pressure and velocity are solved with the PISO (Pressure-Implicit with Splitting of Operators) algorithm by Issa [54]. The pressure equation is treated implicitly by the PCG solver using the DIC preconditioner, while the momentum equation is resolved by a simple solver, namely smoothsolver in OpenFOAM, along with the GaussSeidel smoother. The terms of the equations are discretized with second-order numerical approximations, according to the standard practice [55]. The time first derivative is discretized with the backward difference scheme (backward in OpenFOAM), while the UMIST scheme [56] is employed for the convective terms. The gradient and the Laplacian terms are discretized using the central difference schemes, Gauss linear and Gauss linear corrected [48], respectively.
The sub-grid part of turbulence is represented by the SGS stress tensor (τij) and can be modelled with various methods. A common approach is the Boussinesq approximation, which assumes that the deviatoric part of the SGS tensor is proportional to the resolved strain rate tensor S ¯ i j , through the eddy viscosity, vsgs,
τ i j d = τ i j 1 3 τ k k δ i j = 2 v sgs S ¯ i j
where τ i j d is the deviatoric part, τij is the normal component and τkk is the shear component of the SGS stress tensor. δij is the Kronecker delta and 1 3 τ k k δ i j is the hydrostatic tensor, which is embedded in the modified filtered pressure term. The resolved strain rate tensor S ¯ i j is written as
S ¯ i j = 1 2 ( u ¯ i x j + u ¯ j x i )
Doing so, the problem of unresolved modelled turbulence has been transformed to the calculation of eddy viscosity vsgs. In the present study, the considered SGS models are presented in Section 3.2.
Finally, the selected incompressible solver pisoFoam [48] was modified to solve the convection– diffusion equation for a passive scalar, at every time-step.
Convection—diffusion equation
C t = 2 ( D total C ) ( u ¯ i C ) + P
where C is the concentration, P are the characteristics of the pollutant source (i.e., geometry and emission rate) and Dtotal is the total diffusion coefficient
D total = D + v sgs S c t
where D is the molecular diffusion coefficient, vsgs is the eddy viscosity, and Sct is the turbulent Schmidt number. The value of Sct is taken equal to 0.7, in accordance with previous atmospheric dispersion studies [22,57], while D was equal to 1.64⋅10−5 m2⋅s−1, which is the molecular diffusion coefficient for, a typical pollutant, CO2 at 25 °C [58].

3.2. SGS Modeling

3.2.1. Standard Smagorinsky Model

The standard Smagorinsky model [27] is the most well-known SGS model and constitutes the base for the development of many other SGS models. The main equation of the model based on the eddy-viscosity hypothesis can be written as
ν sgs = ( C s Δ ) 2 | S ¯ |
where Cs is the Smagorinsky coefficient, | S | = 2 S ¯ i j S ¯ i j is the magnitude of the resolved strain rate tensor and Δ is the filter width, usually associated with the cell dimensions Δi, Δ = (ΔxΔyΔz) 1/3.
The behavior of the standard Smagorinsky depends heavily on its constant, Cs, and suffers from many weaknesses (e.g., backscatter phenomenon, tuning of Cs and requirement of a damping function). The model also fails to eliminate the eddy viscosity near to the wall boundaries and the requirement of the van Driest damping function [59] is necessary to reduce the Cs value to zero and ensure the no-slip boundary condition.

3.2.2. WALE Model

The variations of the Smagorinsky model calculate the SGS turbulence, based on its connection with the symmetric part of the velocity gradient tensor, i.e., the resolved strain rate tensor, effectively capturing the vortex deformation. The local strain and rotation rates of the smallest resolved turbulence scales are taking into account in the WALE model by Ducros et al. [60]. It is reported that WALE reproduces the transition from laminar to turbulent flow and the correct scaling of turbulence close to the walls without the requirement of a damping function [61]. According to the WALE model the eddy viscosity is given by
ν sgs = ( C w Δ ) 2 ( S i j d S i j d ) 3 / 2 ( S ¯ i j S ¯ i j ) 5 / 2 + ( S i j d S i j d ) 5 / 4
where Δ is the usual grid length and Cw = 0.325 is the WALE constant. S i j d is the deviatoric symmetric part of the square for the resolved velocity gradient tensor and is defined as
S i j d = 1 2 ( g ¯ i j 2 + g ¯ j i 2 ) 1 3 δ i j g ¯ k k 2
where g ¯ i j = u ¯ i / x j are the velocity gradients.

3.2.3. k-Equation Model

The above-mentioned algebraic models connect vsgs to the local instantaneous resolved velocity gradients. On the other hand, there are regions with low resolved gradients, but high SGS kinetic energy because of convection from regions with high sub-grid scale turbulence [62]. A common approach to capture the historic effects of production, dissipation, and diffusion of the SGS kinetic energy (ksgs) is the resolving of its transport equation. The k-equation model by Yoshizawa and Horiuti [63] resolves the transport equation of k sgs = 1 2 ( u k u k ¯ u ¯ k u ¯ k ) leads to
k sgs t + k sgs u ¯ j x j = x j [ ( v + ν sgs ) k sgs x j ] τ i j S ¯ i j C e k sgs 3 / 2 Δ
and the eddy viscosity is given by
ν sgs = C k k sgs 1 / 2 Δ
where v is the laminar viscosity, Ck (= 0.094) and Ce (= 1.048) are the model constants. The terms in the right hand of Equation (11) represent the diffusion, production and dissipation of ksgs, respectively. The constants Ck and Ce are calculated with the assumption of balance between SGS energy production and dissipation rates [64], similar to the standard Smagorinsky model, presenting the same limitations. Consequently, improved versions of the k-equation model have been proposed to calculate the constants dynamically, depending on the local turbulence.

3.2.4. Dynamic k-Equation Model

The localised dynamic k-equation model by Kim and Menon [65] employs a similar operation to that introduced by Lilly [66] for the dynamic Smagorinsky model. A second test filter Δ ^ = 2 Δ ¯ and the Germano identity are used to derive equations that relate the values of Ck and Ce to quantities resolved at the test filter scale [67]
C k ,   dynamic = 1 2 L i j σ i j σ i j σ i j
where
σ i j = k test 1 / 2 S ¯ i j Δ ^
k test = 1 2 ( u k u k ¯ ^ u ¯ k ^ u ¯ k ^ )
and
C e ,   dynamic = ( v + v sgs ) ( u ¯ i x j u ¯ i x j ^ u ¯ i ^ x j u ¯ i ^ x j ) Δ ^ k test 3 / 2

3.3. Boundary Conditions

In the streamwise direction, periodic boundary conditions were imposed (cyclic in OpenFOAM) for all the flow variables, i.e., U, p, vsgs, and C. The main flow was recycled from the outlet boundary patch to the inlet, ensuring that the boundary conditions are time-dependent, a requisite for LES [68]. To initialize the turbulence, a single velocity vector with the value of the reference velocity (5 m⋅s−1) was imposed to the whole computational grid. The simulation of the wind flow begun and gradually the turbulence inside the street canyon dissipated forming the expected recirculating vortex, while the turbulence in the upper atmosphere created a realistic wind profile. The simulation ran for a sufficient time span, in which the obtained average velocity was statistically correct, when compared with experimental data and the flow was judged as realistic (i.e., the instantaneous snapshots of velocity showed no indications of laminar flow). Only after that, the emission of the pollutants from the source begun. This method is well-established in similar works, e.g., [21,22,37]. The recycling of the concentration was countered by overwriting C at the inlet patch, at every time-step with the utility scalarFixedValueConstraint, available after OpenFOAM 3.0.
Another option for the streamwise boundaries could be the mapped boundary conditions, in which the user can choose which parameters will be recycled. These conditions were used extensively by the authors in OpenFOAM v2.3.1, with the results of flow being statistically valid for AR = 1 and 0.5. The method was also used successfully for AR = 0.33, but for AR = 0.25 a recirculating flow was found to develop just after the inlet patch above the upwind building. As solution progressed, this flow was amplified, eventually causing the simulation to diverge. The reason for this was not investigated further neither this method was tested in newer versions. Therefore, cyclic conditions have been employed which proved more stable in either versions of OpenFOAM, v2.3.1 and v5.0. At the top of the domain, the symmetry boundary condition (symmetryPlane in OpenFOAM) was set, following the common practice for the quasi-2D setup, e.g., [22,40,69]. This means that the normal velocity on this patch is assigned to zero and for the scalars there is a zero-normal gradient.
Periodic conditions are used also for the spanwise direction, again as the common practice for the quasi-2D configuration. The recycling of the random small velocity vectors from patch to patch is not affecting the main flow. Furthermore, tests with symmetry for these patches resulted in unnatural flows. The wall boundaries were set to no-slip condition for the velocity field (fixedValue in OpenFOAM)
U ¯ i = 0 ;   U ¯ j = 0 ;   U ¯ k = 0
where U ¯ is the filtered velocity component and i, j and k are the three x, y and z-coordinates, respectively. The fixed gradient (zeroGradient in OpenFOAM) was used for the scalar parameters.
φ x i = 0 ;   φ x j = 0 ;   φ x k = 0
where φ is the scalar quantity, i.e., p, vsgs, and C.
For high Re flows or relatively coarse grids, depending on the non-dimensional distance from the wall to the first grid point (y+), special treatment should be employed for the flow characteristics on the wall boundaries [13]. OpenFOAM provides a variety of wall functions to handle flow characteristics on walls [70]. Herein, two functions studied combined with the standard Smagorinsky model to calculate the value of turbulent viscosity vsgs on the walls. The equation that relates vsgs to y+ is
v sgs = v ( κ y + ln ( E y + ) 1 )
where κ = 0.41 is the von Karman’s constant and E = 9.8 is a constant that describes the velocity profile near the wall.
The well-known wall function by Launder and Spalding [71] is implemented in OpenFOAM v5.0 as nutUSpaldingWallFunction, for which y+ is calculated as a function of the dimensionless velocity u+
y + = u + + 1 E [ e κ u + 1 κ u + 1 2 ( κ u + ) 2 1 6 ( κ u + ) 3 ]
A simple logarithmic wall function (nutkWallFunction) was also tested, that estimates vsgs using Equation (20) for values of y+ > 11, or else assumes vsgs = 0.

3.4. Computational Details

The solution of LES provides dynamic time-series, which are usually averaged over a feasible and representative time-span. Previous works have specified this time-span, as a function of Uref and a characteristic length. For example, Li et al. [69] used 400 H/Uref to reach a “pseudo-steady state” and another 300 H/Uref to collect the appropriate statistics. Employing a similar logic for turbulence generation, Boppana et al. [72] used the streamwise length of the domain Lx to determine the respective time-spans as 120 and 200 Lx/Uref. For this work, the fully developed flow field was obtained after 150 H/Uref, while the statistics were collected over 650 H/Uref (or 325 Lx/Uref, or 1300 s). The computational cost for these calculations requires the employment of high-performance computing (HPC). Indicatively, the fine grid required a computational time of three months using 240 CPU cores, which for the medium grid dropped to seventeen days, this time employing 192 CPU cores.

4. Results and Discussion

This section presents the detailed results of the investigation along with the qualitative analysis and quantitative comparison with literature data. The results relay to average and instantaneous values of the velocity and to averaged concentrations, for the wind flow and pollutant dispersion, respectively. At first, the investigation is based on a standard model configuration employing the Standard Smagorinsky model and the van Driest wall function, over a coarse resolution grid (80-cells across the street canyon; 768,000 in total) and a time-step of 1 × 10⁻³ s. As the investigation progresses, the model configuration is updated.
Both experimental and numerical literature data are used to compare with own results. For the velocity components the experimental data by Li et al. [30] and the numerical data (also LES) by Li [73] are employed. For the pollutant concentrations the experimental data by Pavageau and Schatzmann [31], Meroney et al. [32], Pavageau [33], and Hoydysh and Dabberdt [74] are employed. The quantitative comparison follows well-known metrics (i.e., FAC2, FB, and NMSE) proposed by collaborative projects such as the COST Action 732 [75], according to the works of Hanna [76] and Chang and Hanna [77], and recently for the validation of LES, e.g., [25,78,79].

4.1. Domain Height

Best practice guidelines suggest that the external boundary patches should be far away from the investigated area, typically around five times the average building height [55]. In similar studies, this area has been taken equal to 1H [80], 2H [22], 3H [69], or 4H [81] building heights. This dimension controls the available space for the wind flow (velocity profile) to be developed. It is important to be large enough, so the profile can resemble the ‘stratification’ of the urban boundary layer. The first option for a larger upper atmosphere height is to increase the number of cells proportionally, which consequently increases the computational cost for the less studied part of the flow. The second option is to keep the same number of cells and adjust the cell-to-cell ratio, so that the cells at the roof level inside the street canyon and the upper atmosphere match the same size. Here, the second option was selected. Also, note that the inlet, outlet, front, and back patches did not follow this recommendation owe to the cyclic boundary conditions.
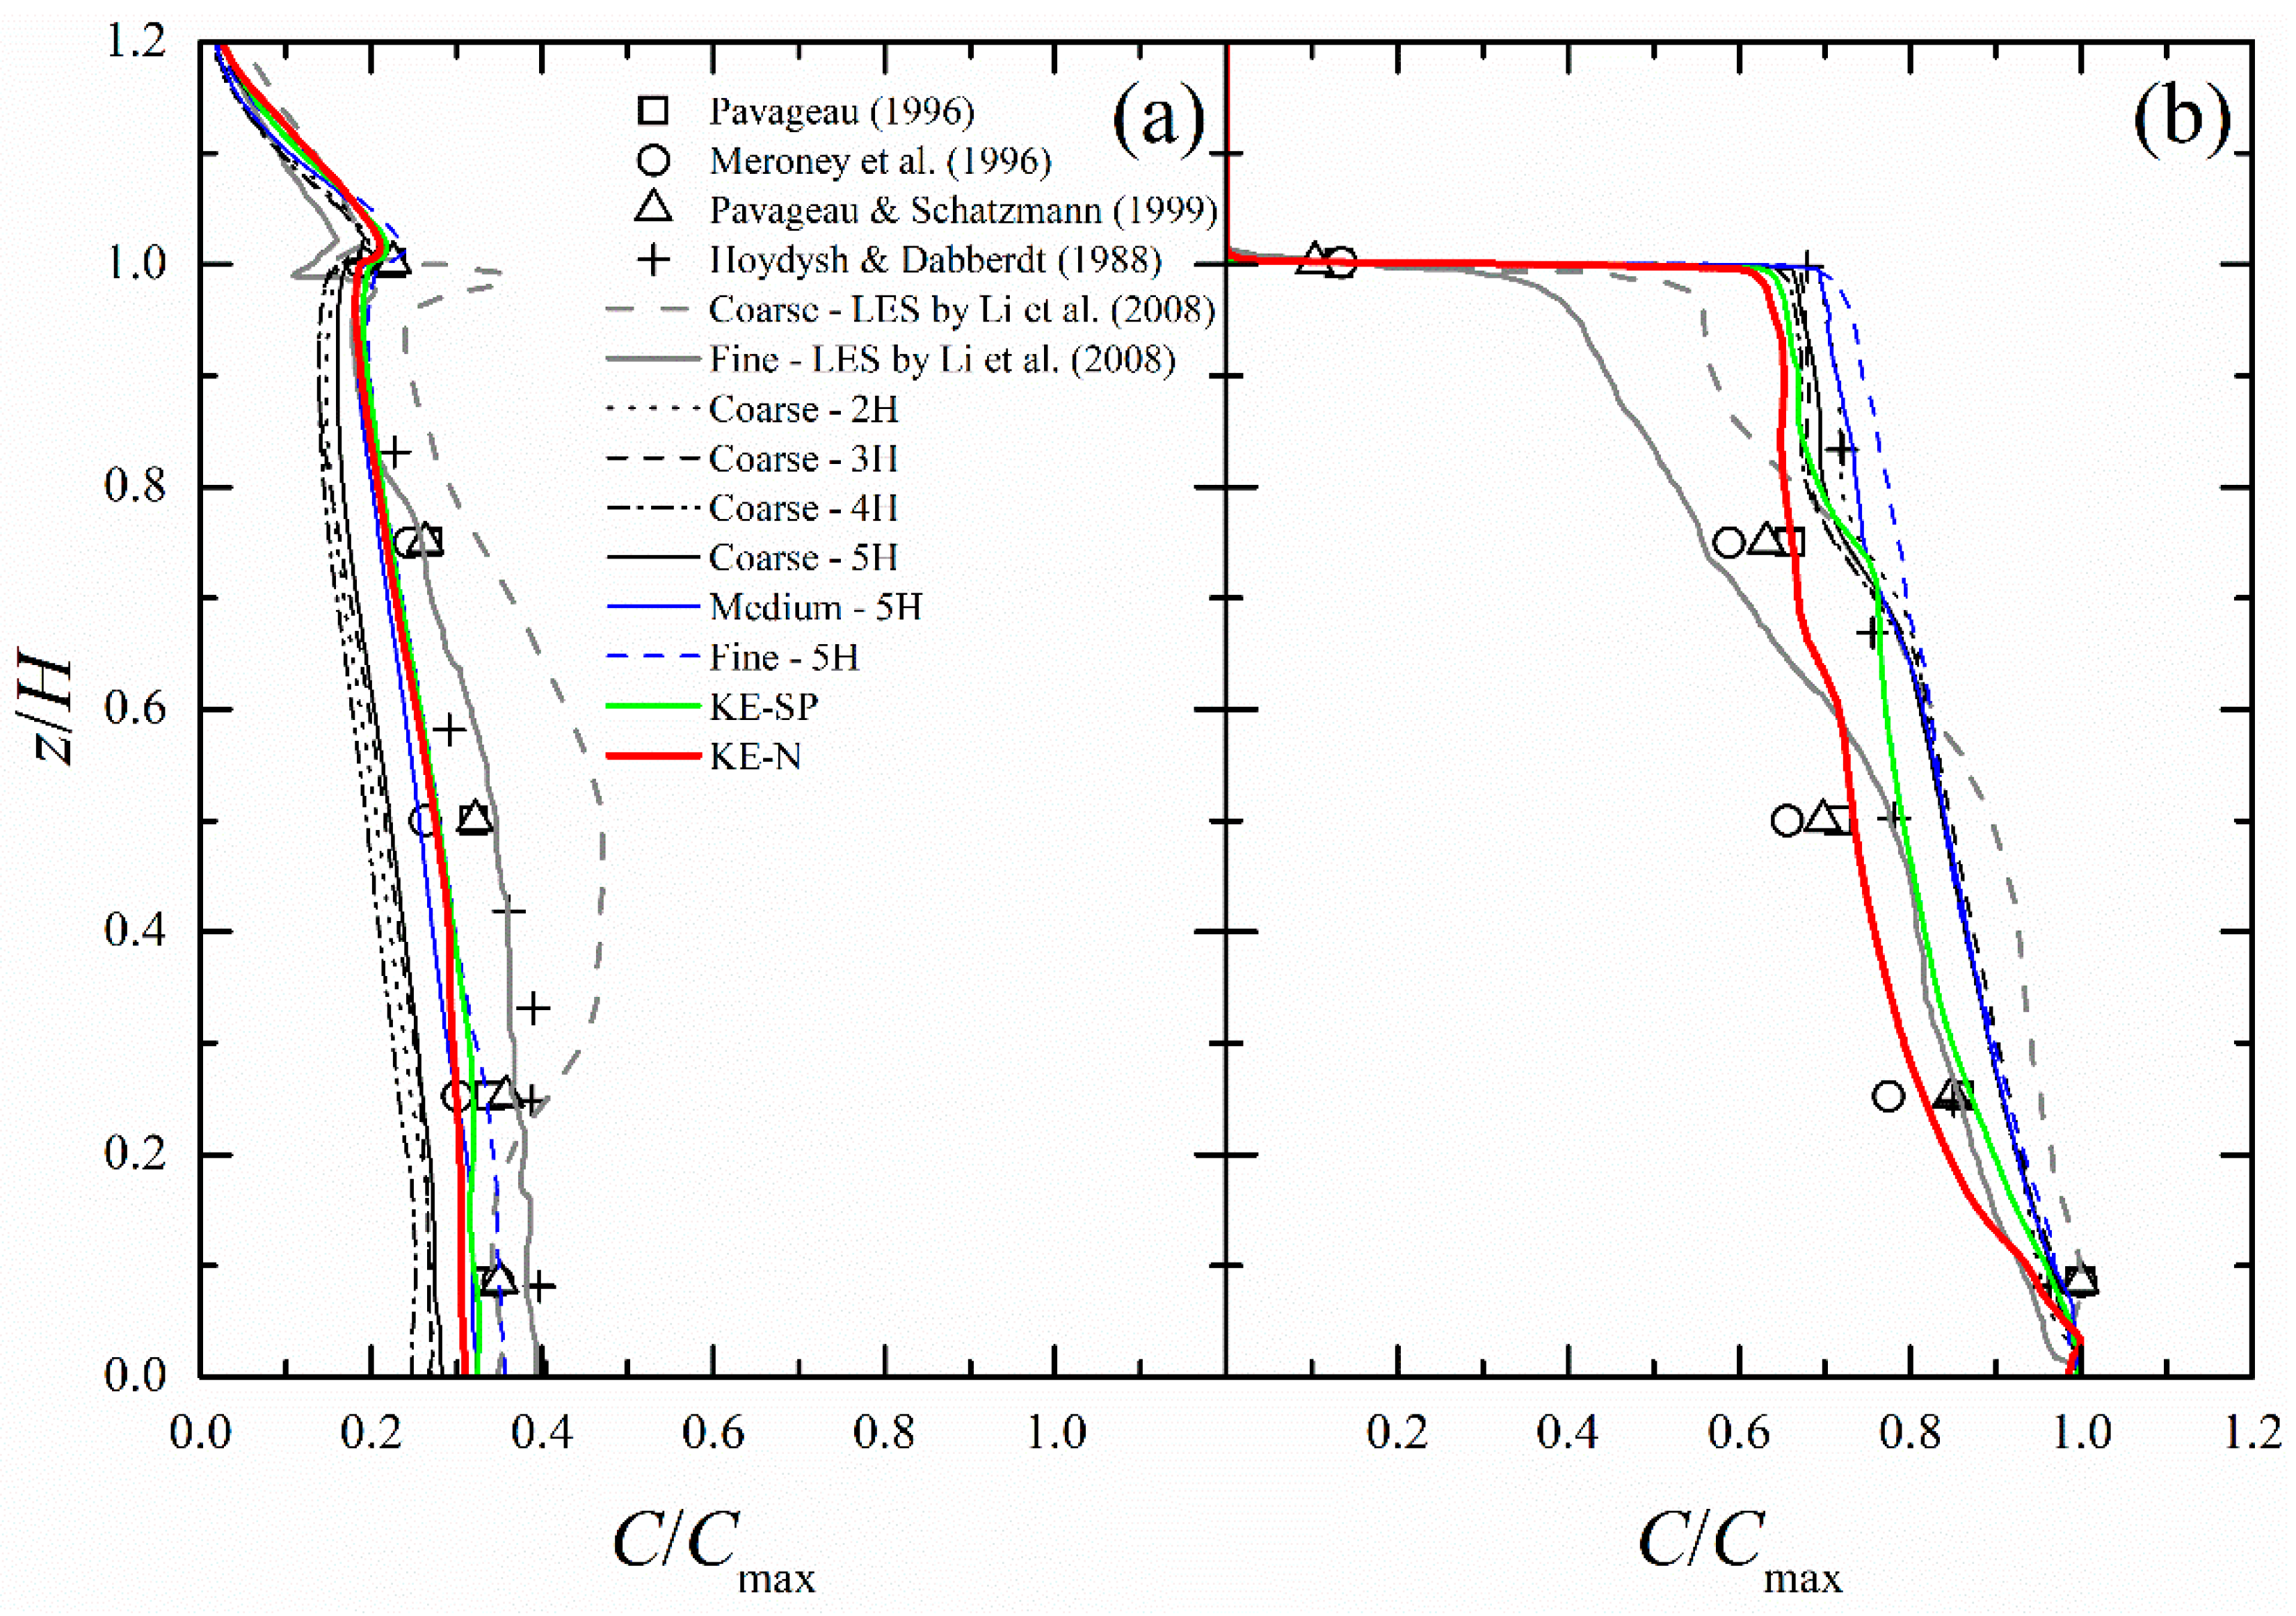
Therefore, a sensitivity analysis was conducted using 2H, 3H, 4H, and 5H to determine the appropriate height. The grid resolution was kept at 80 cells per building height to compromise between accuracy and computational cost for the 2H–5H, however, a medium (120 cells) and a fine (180 cells) grid were also examined for 5H. More details on the grid resolution are presented in the next section. Figure 2 presents the average concentrations (normalised by Cmax) on the two walls of the unity street canyon compared with experimental data by Pavageau and Schatzmann [31], Meroney et al. [32], Pavageau [33], and Hoydysh and Dabberdt [74]. The LES results by Li [73] are also exhibited for comparison.
The concentration results for the upwind wall are in fair agreement with the experimental data and the obtained values for the four upper atmosphere heights are nearly identical, while the largest variation is observed at the upper part of the canyon. For the downwind wall, the results for 2H, 3H, and 4H are different among them, while for 5H are marginally closer to the experimental data. The results for the downwind wall are affected more than those for the upwind side, as this side is characterized by the entrainment of clean air from the upper atmosphere, which is in turn controlled by the wind velocity profile. For example, the transition of the flow from the top of the domain to the shear layer for the 2H is more abrupt and unnatural than that of 5H. On the other hand, the upwind side is influenced by the phenomena developed inside the canyon, mainly the recirculating vortex that dominates the flow. It is concluded that the experimental data are replicated better in the 5H case due to the larger available area which allows for a less-constrained development of the wind flow.

4.2. Grid Resolution

A grid sensitivity analysis was conducted to quantify the error induced by discretization, utilizing the grid convergence index (GCI) [82] and the LES index of quality (or LES_IQ) [83].
The GCI estimates an error in a ‘loose statistical sense’ for measuring the effect of a change on the grid resolution, i.e., the refinement/transition from one grid to another and can be calculated as
G C I fine = F s | e 21 | r 21 p 1 ;   e 21 = f 2 f 1
where Fs is the safety factor, r is the refinement ratio, and p is the order accuracy of the used method, while f1 and f2 are the solutions from each used grid. Three grids with increasing density, i.e., a constant refinement ratio of 1.5 with Fs = 1.25, were tested following the common practice [12,20,84,85]: a coarse grid of 768,000 cells (Δx = Δz = 0.125 m, Δy = 0.063 m), a medium grid of 2,592,000 cells (Δx = Δz = 0.083 m, Δy = 0.042 m) and a fine grid of 8,748,000 cells (Δx = Δz = 0.056 m, Δy = 0.028 m). Note that the adopted numerical schemes for the discretization are second order accurate (p = 2).
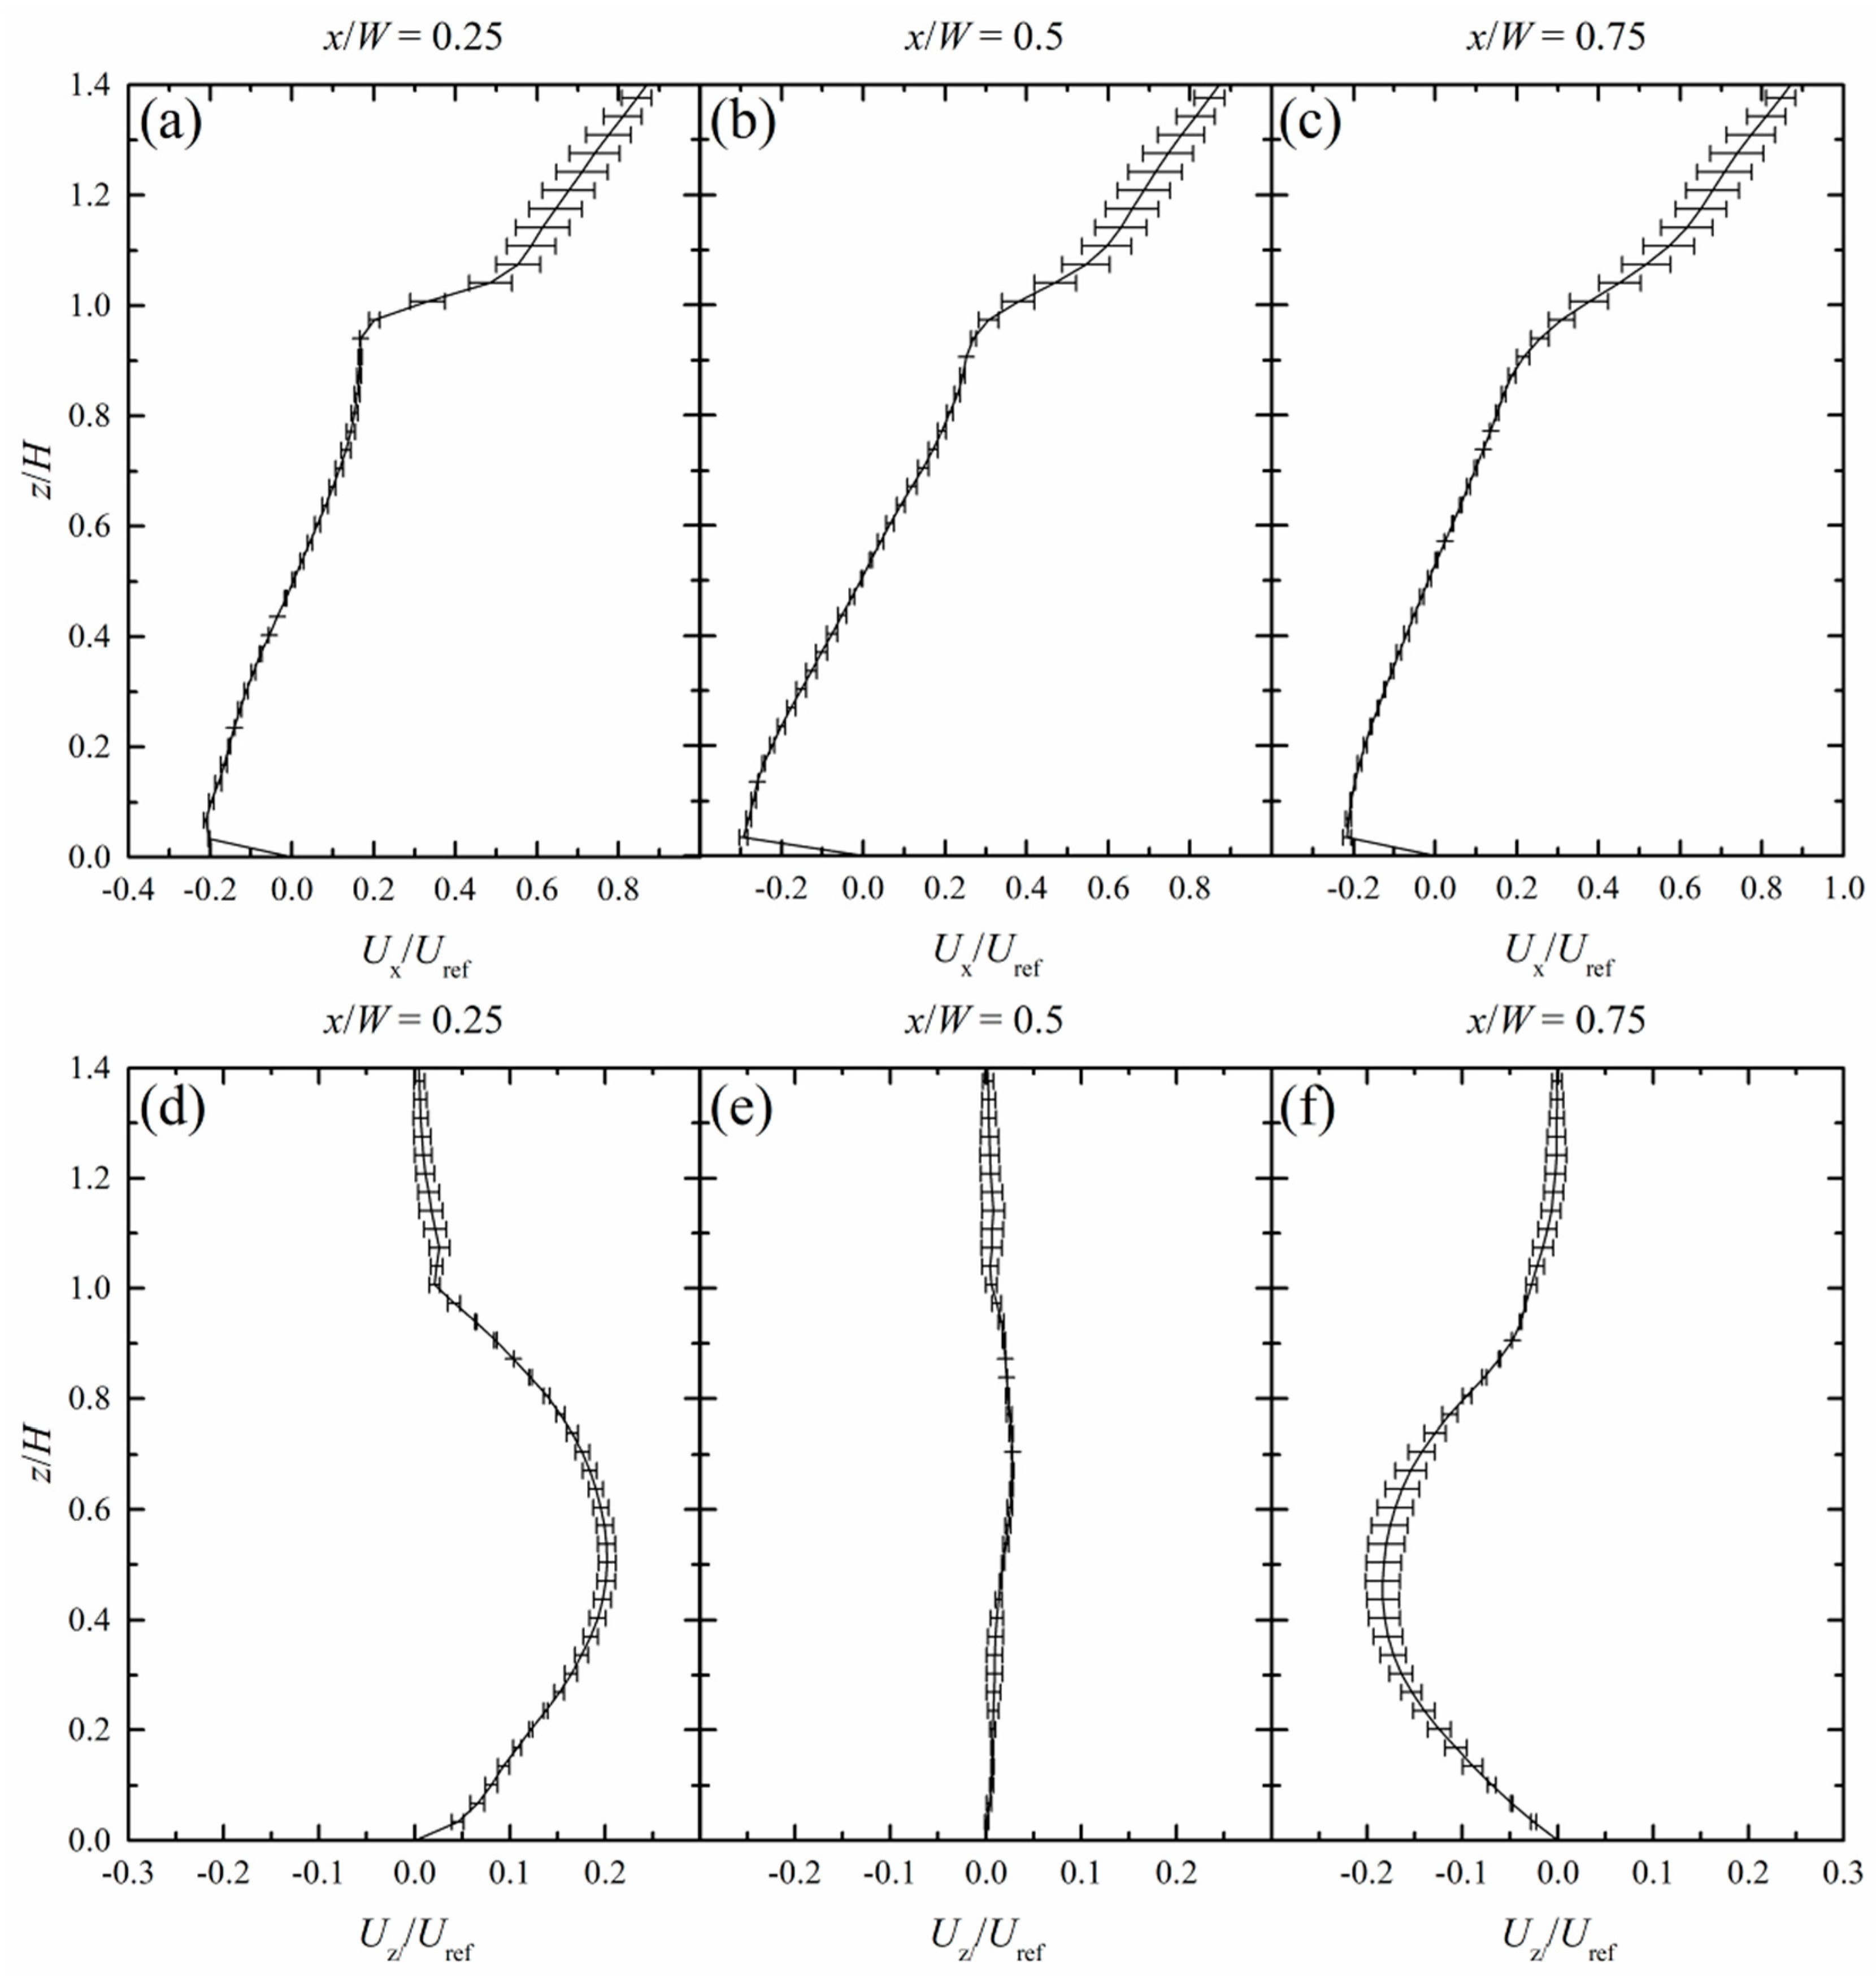
The grid-induced error was inspected at three areas, the relatively low-resolution area in the middle of the canyon and the denser upwind and downwind areas, where the polluted air removal and clean air entrainment occur, respectively. Thus, the GCI was calculated in the middle vertical plane of the grid (y/L = 0.5) for three profiles across the canyon-width at x/W = 0.25, 0.50, and 0.75, respectively. The GCIfine values for the medium to fine grid refinement are presented in Figure 3.
The GCIfine values are proportionally larger for Uz/Uref than Ux/Uref, although the absolute values are smaller for the first. The larger differences for Uz/Uref are observed in the middle height of the canyon, where the grid is relatively coarse, as shown in Figure 3d,f. On the other hand, for Ux/Uref the lower GCIfine values are calculated inside the canyon area, while abnormally high values are identified in the area above the buildings (Figure 3a–c), although the velocity at the top of the domain is virtually the same (~5.1 m/s) for all the grids. This could be linked with the observation that the velocity profile for the fine grid adapts more abruptly towards the street canyon.
The GCImedium (not presented here; for the coarse to medium grid refinement) was found to be in all cases larger than that of the fine grid. For example, the average GCImedium for the Uz/Uref inside the canyon was calculated as 1.8, 0.5, and 1.1% for the three vertical profiles, while the values for GCIfine were found to be 0.6, 0.3, and 1%, respectively. This trend is also valid for the Ux/Uref, with the values for GCImedium were found to be equal to 1.1, 1.9, and 1.3% for the three vertical lines, while the values for GCIfine were recorded as 0.7, 1, and 0.7%, respectively. As expected, the transition from the medium to fine grid gives smaller differences than the transition from the coarse to the medium. Nevertheless, the GCIfine is less than 1%, implying that the medium grid is sufficient for the wind flow solution.
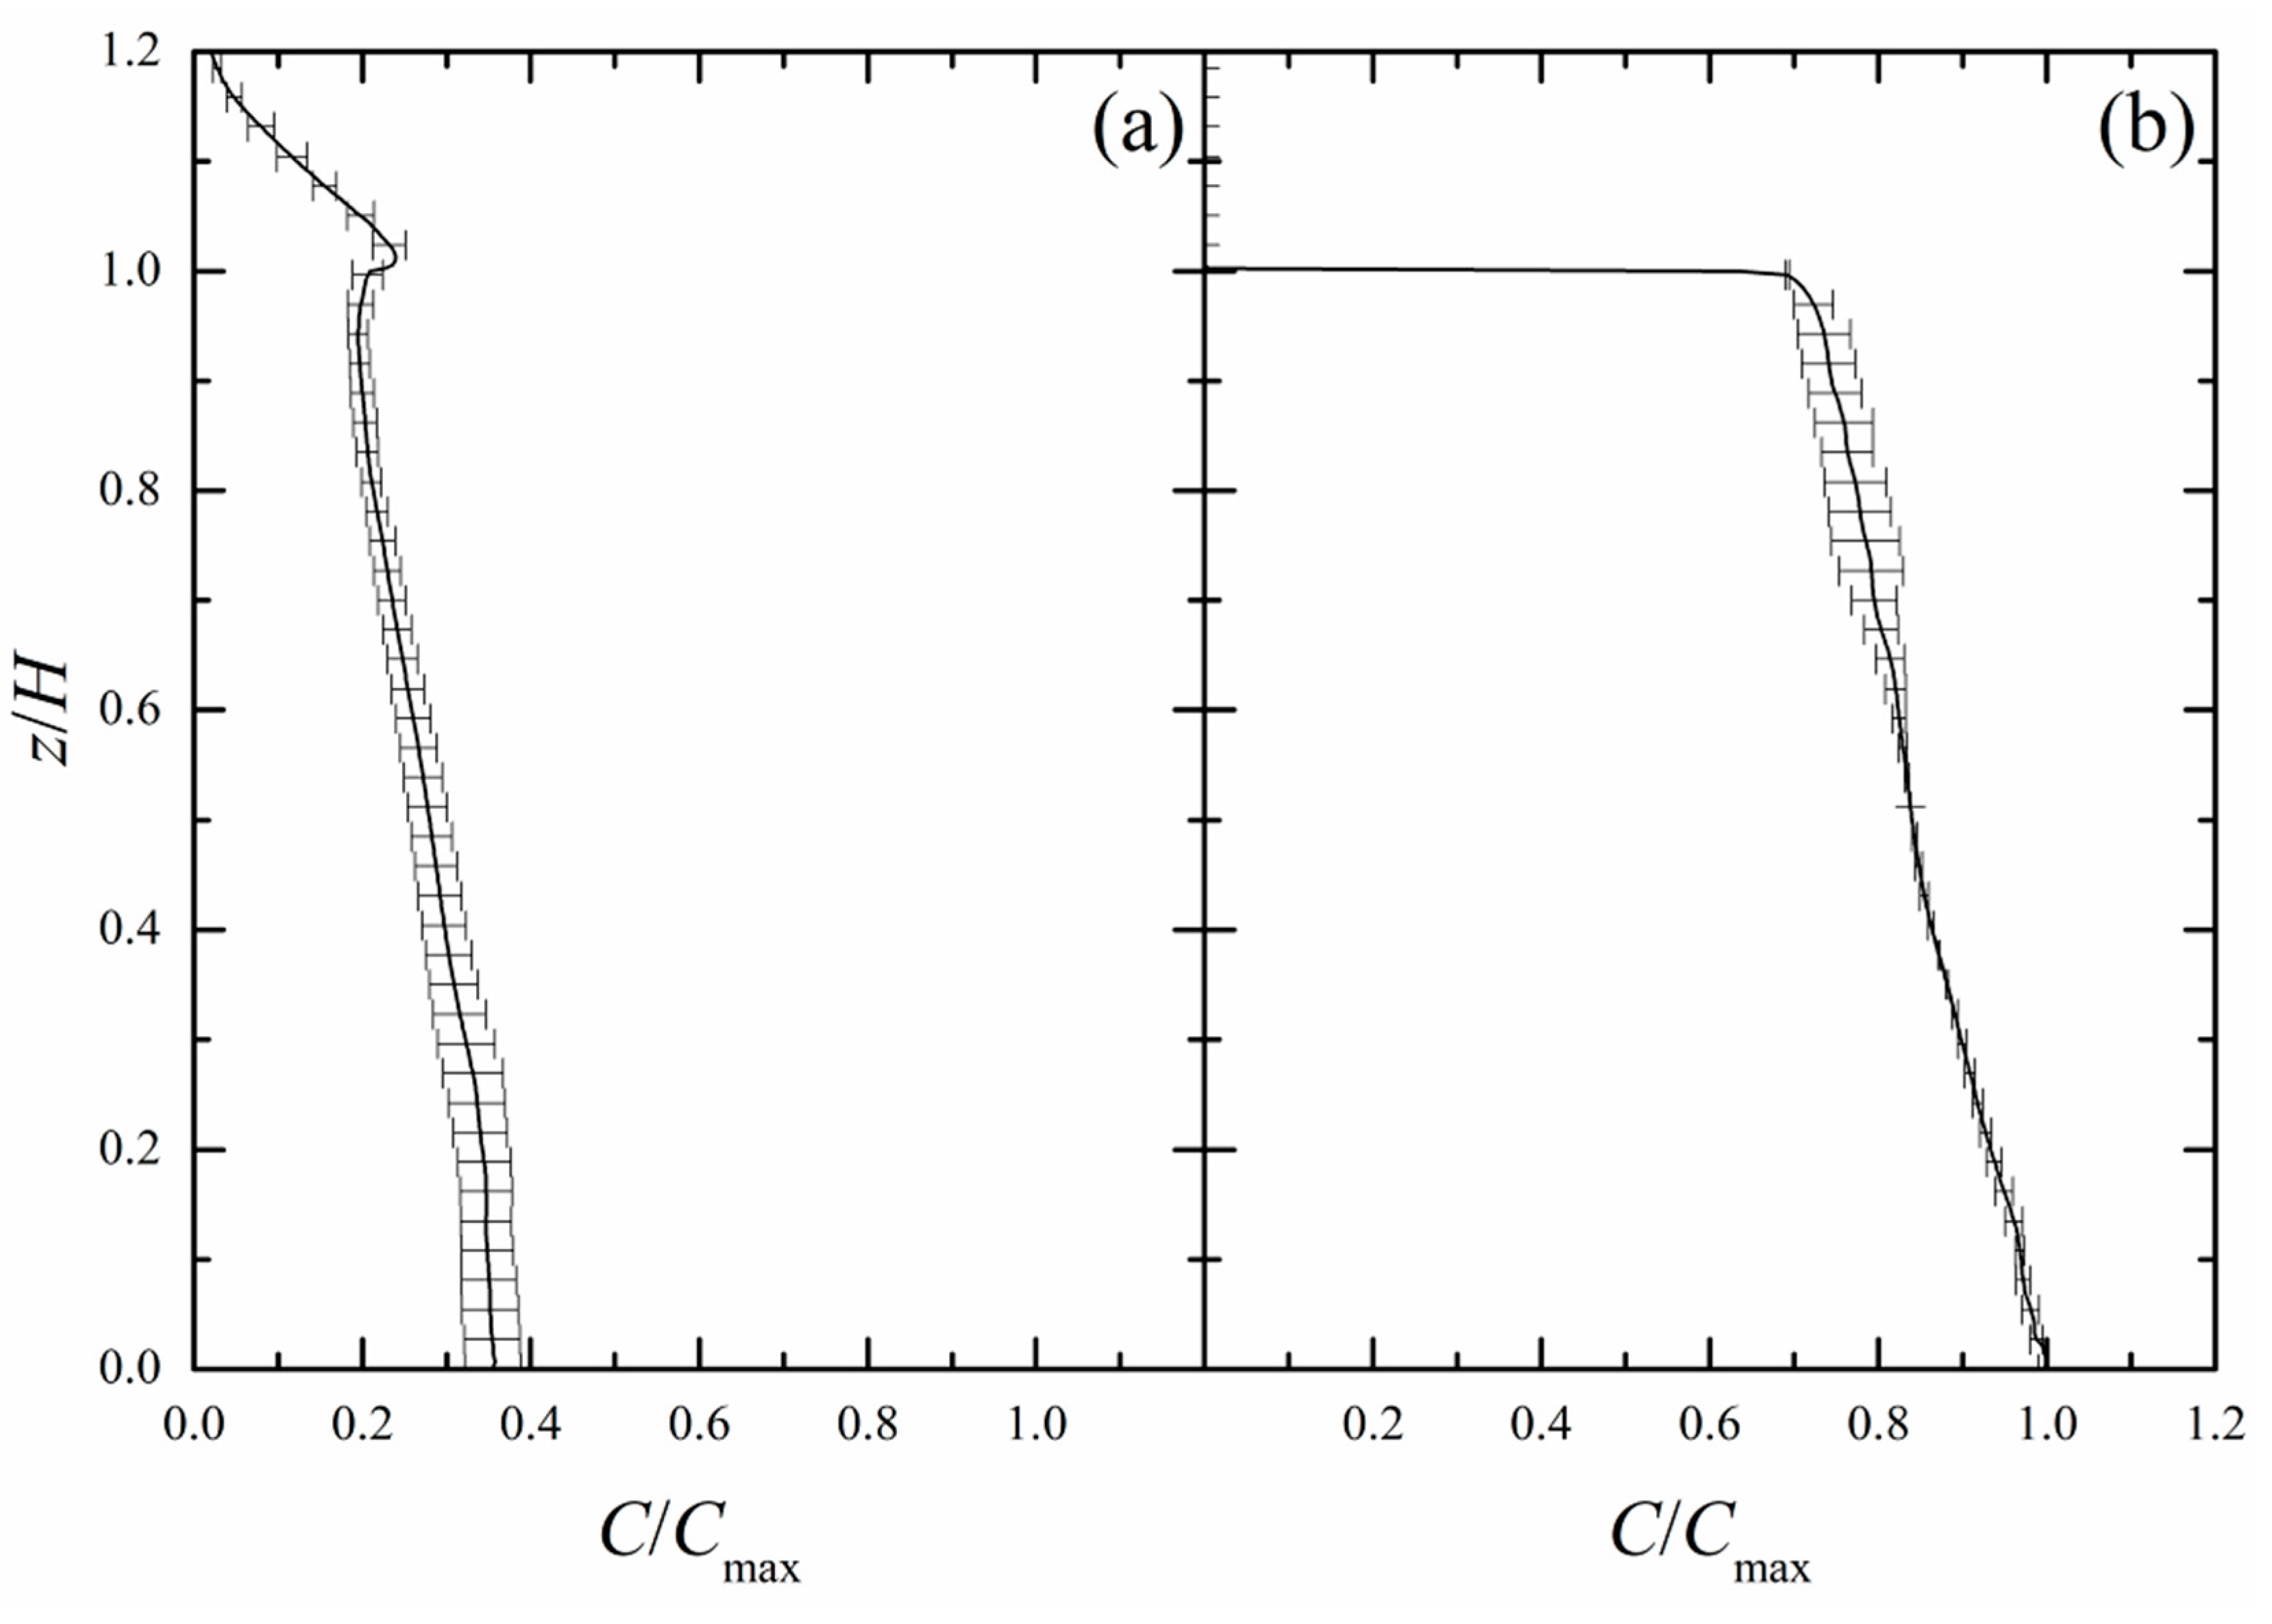
The average concentration profiles of the numerical and experimental data for the two canyon walls are compared in Figure 2. As the grid resolution increases, the concentration of the downwind wall approaches the experimental and numerical values. The best results obtained from the fine grid, although the results from the medium grid are also in good agreement with the experiments. For the upwind wall and from the ground up to z/H = 0.6, the three solutions are identical and larger than the experimental results, while they differ for the distance until the roof height. For the part from z/H = 0.7 up to the roof, the results of the coarse grid are closer to the experimental, while the medium grid exhibits reasonable agreement. The results for GCI for C/Cmax are presented in Figure 4.
For C/Cmax, the average GCImedium was calculated as 0.8% and 3.1% for the upwind and the downwind walls, respectively. The GCIfine was reduced even more for the downwind wall at 2.2%, but was increased for the upwind wall at 1.2%. Nevertheless, this discrepancy reveals the drawbacks of GCI, as the transition from medium to fine just moved the results closer to the experimental, as shown in Figure 2.
While, the use of GCI determined that the uncertainty induced by grid is low enough, other metrics are required to find out the percentage of the resolved turbulence. According to Pope [86], LES is properly employed, when 80% of the turbulence kinetic energy is resolved, a value that will be examined using the LES index of quality (or LES_IQ) by Celik et al. [83], with the equation involving the laminar ν and turbulent viscosity νsgs
L E S _ I Q v = k resolved k total = 1 1 + 0.05 ( v + v s g s v ) 0.53
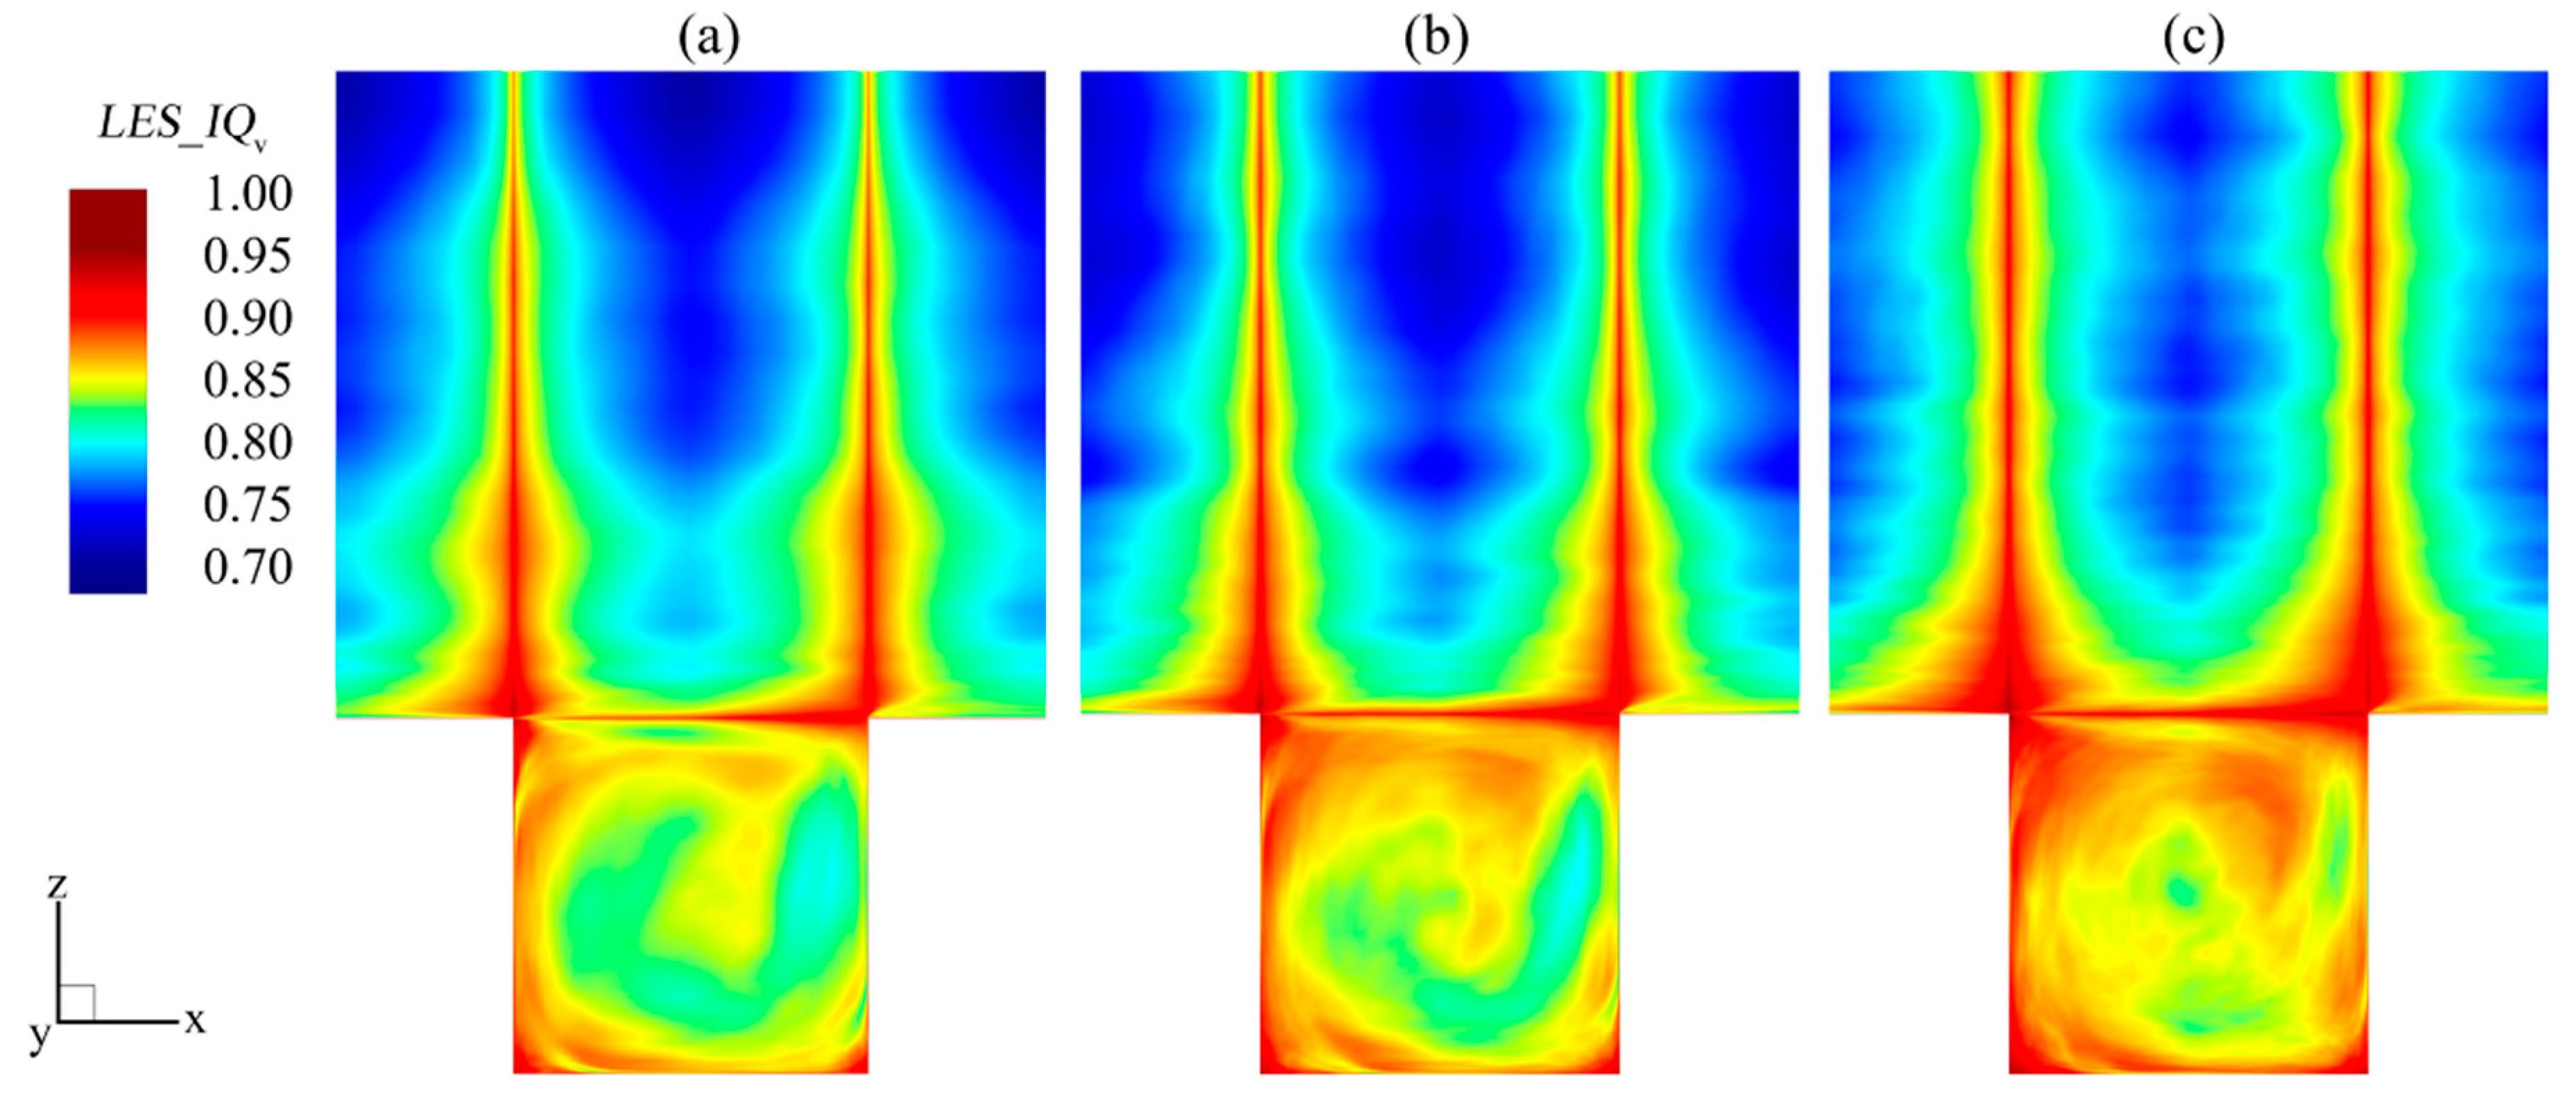
In Figure 5, it is observed that a region of relatively lower LES_IQv exists in front of the downwind building for the selected three grids. This is the area where occurs the entrainment of clean air and is characterized by intensive turbulence. Therefore, very coarse grids may have difficulties to resolve the turbulence kinetic energy at the acceptable 80% for this area, which does not occur for the selected grids. Another area of intense turbulence is the shear layer between the roofs, where LES_IQv exceeds 85% for all resolutions, due to the dense grid. Outside the street canyon, LES_IQv has significantly lower values than inside the canyon, reaching 70% for the coarse grid in Figure 5a. Similarly, in the same area, the medium and the fine grid in Figure 5b,c present their lower values at 75% and 80%, respectively. On the other hand, this should not affect the quality when using the medium grid, because the main area of interest is inside street canyon.
For the coarse grid in Figure 5a, the LES_IQv is higher than 85% inside the canyon, while the lower values around 80% are in the outside area. As for the medium grid in Figure 5b, the turbulence is resolved at more than 85% inside the street canyon, while the percentage is over 90% for the walls and the shear layer. The value of LES_IQv is lower than the 80% (lower limit) at the outside area and approximately at one building height above the roofs. Again, this should be acceptable because turbulence is resolved at the areas that matter the most for this study. Finally, inside the street canyon the fine grid demonstrates values higher than 88%, while the values close to the wall reach to 95%, as shown in Figure 5c.
The use of LES_IQv provides valuable insights about the resolving of turbulence in the relatively high resolutions, usually utilized for the quasi-2D setup. The resolution of the coarse grid proved not sufficient for an LES study at the Re of 3,200,000. The medium grid performed satisfactory for the street canyon area, while showed some deficiencies for the upper region. The fine grid provided excellent compliance with the 80% limit for both areas. Nevertheless, the medium grid is judged to be a fair compromise between the required computational time and level of resolving turbulence.

4.3. Time-Step

Along with the spatial discretization, the selection of the appropriate time-step (Δt) must also ensure that the evolution of the small vortex structures will be described [68]. Employing a structured grid generally leads to smaller time-step requirements. The small cells on the building walls combined with the hexahedral structured grid result in unnecessarily very small cells outside the street canyon, where velocity reaches its maximum. In turn, very small time-steps are required to maintain reasonably low Courant–Friedrichs–Lewy (CFL) number throughout the domain. A typical example of this situation can be found at Figure S1 of the supplementary material.
In this study, for the medium grid and Uref = 5 m·s−1, three different Δt values were examined, namely 6 × 10⁻⁴ s, 8 × 10⁻⁴ s, and 9 × 10⁻⁴ s. Any value larger than 9 × 10⁻⁴ s caused numerical instabilities, leading to diverging solutions.
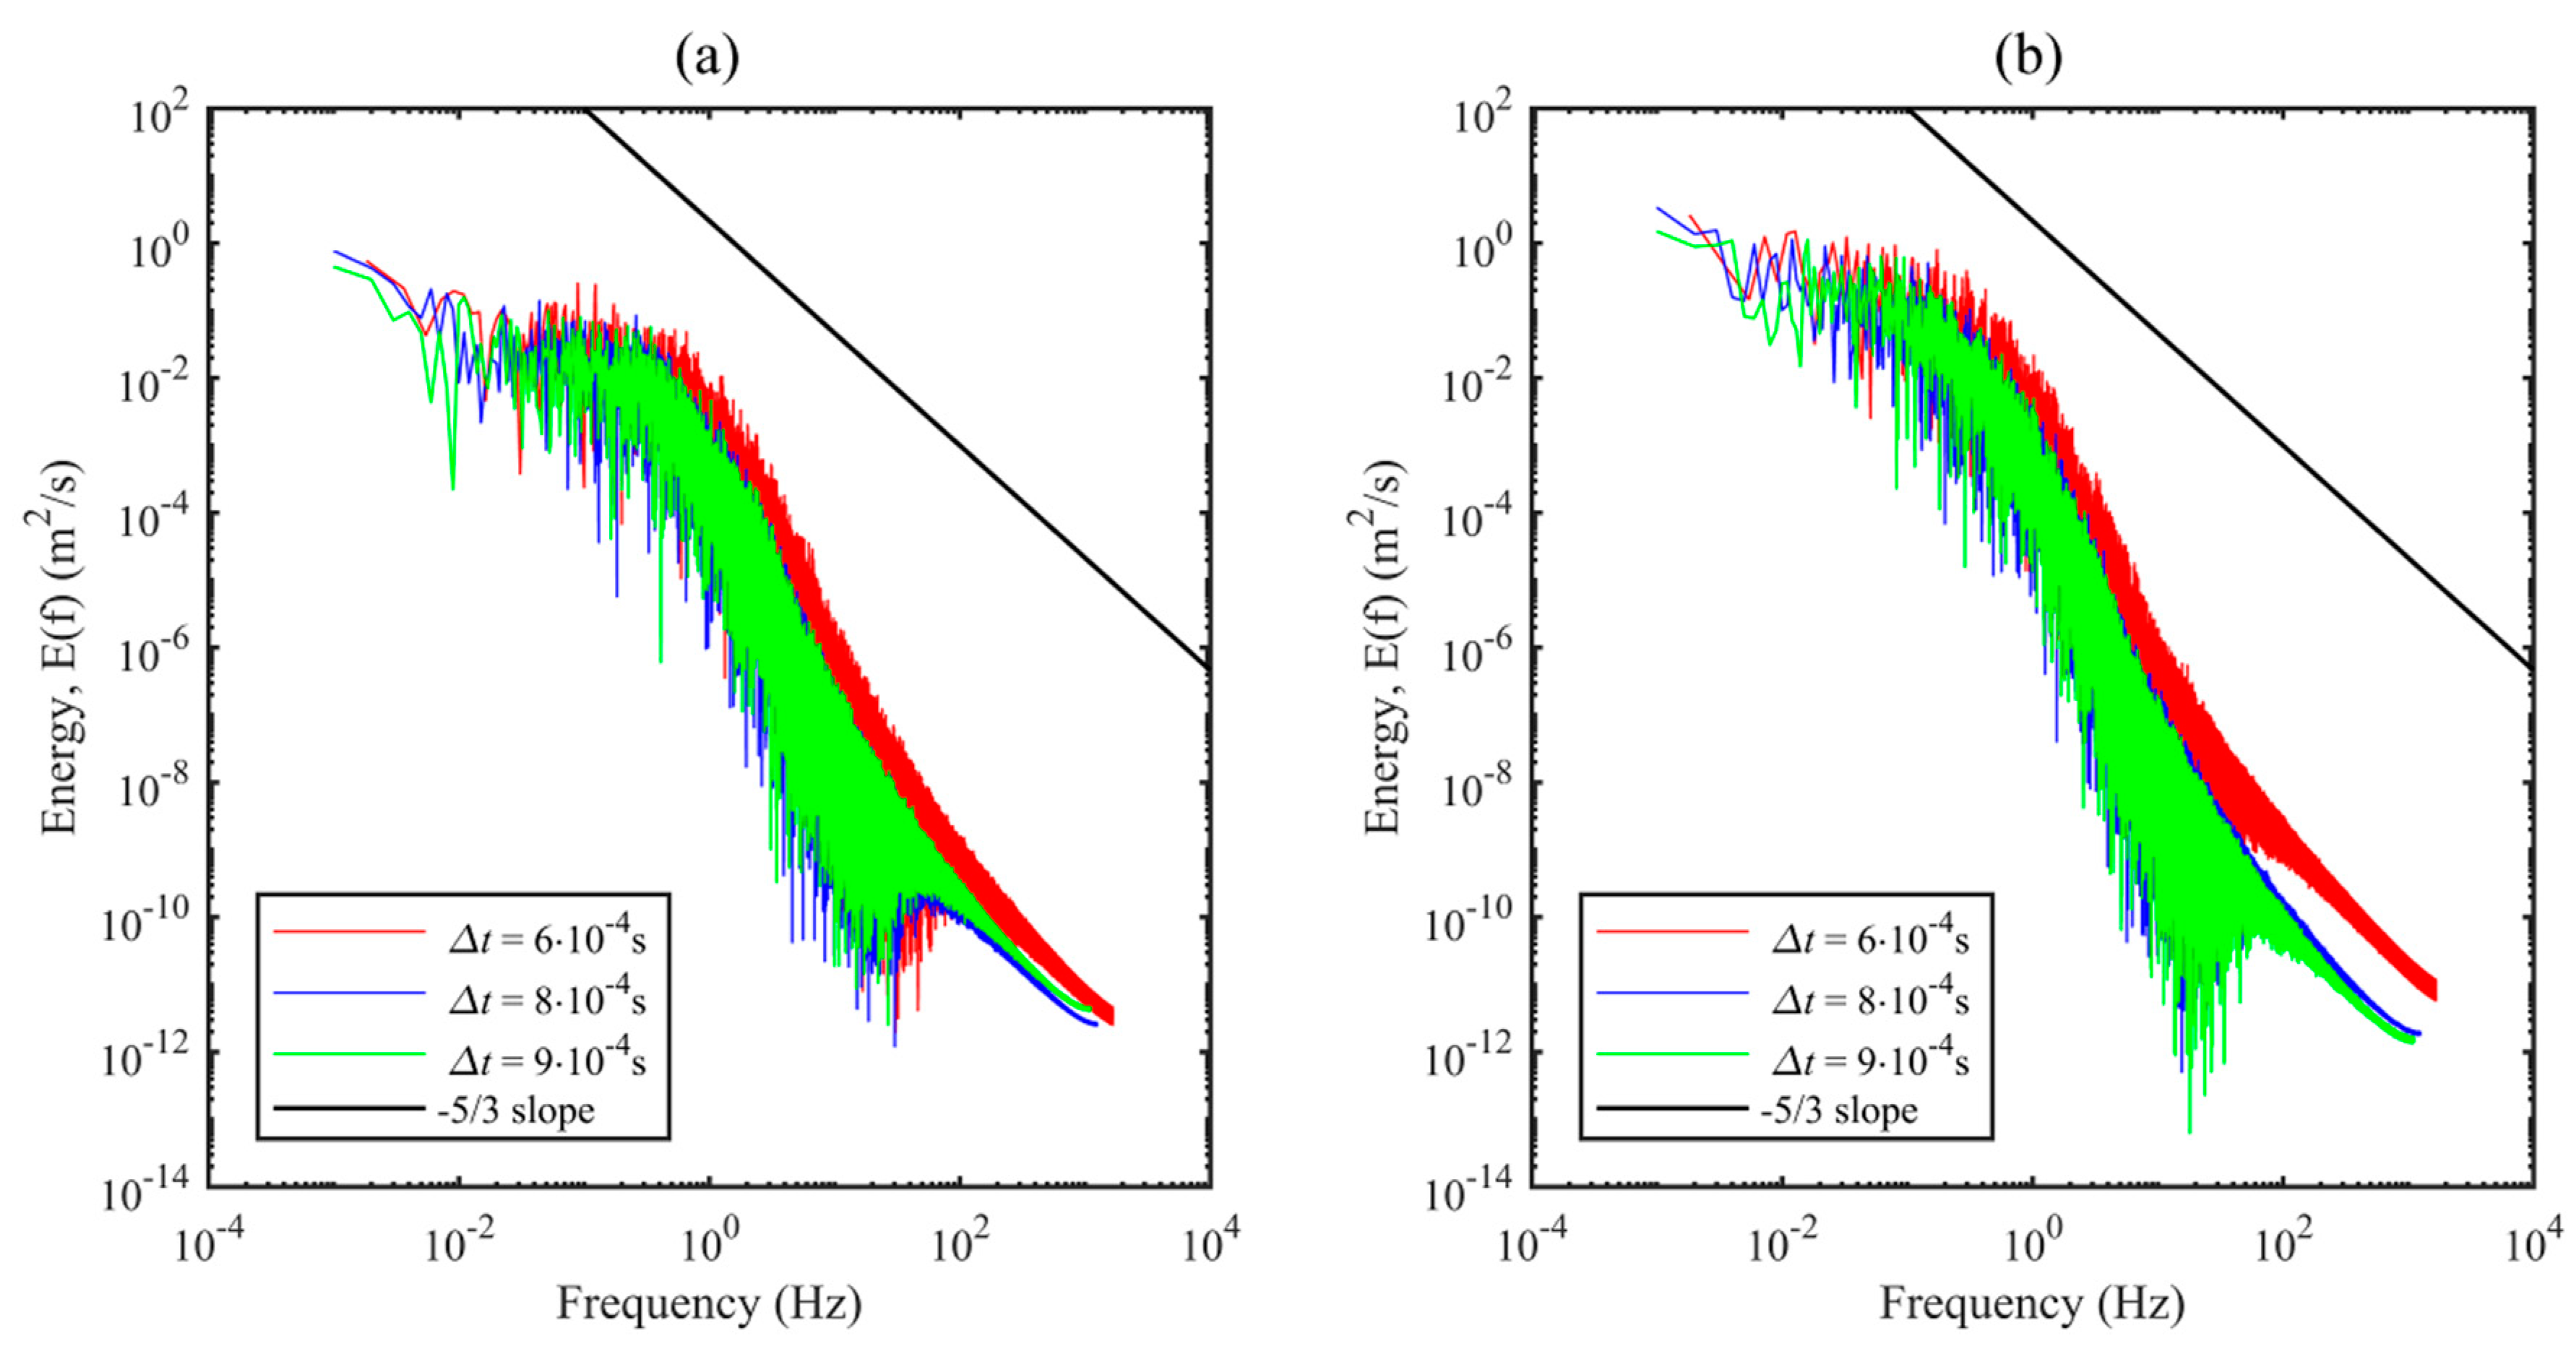
Following the works of Kornhass et al. [87] and Ai and Mak [88], the obtained velocity time-series for the three time-steps were transformed to the frequency domain using the fast Fourier transformation (FFT) technique. Figure 6 presents the spectra of turbulence energy generated for the Ux and Uz velocity components, for a point in the upwind side with x/W = 0.1 and z/H = 0.9.
For both velocity components in Figure 6a,b, the frequencies present only small differences in their minimum and maximum values for the three Δt values. This is expected, as the values of the Δt are close to each other. Six frequency scales from 10−3 to 103 Hz are covered, reaching the significant high frequencies that represent the small-scale turbulence. Furthermore, the inertial sub-range of turbulence is covered between 1 and 10 Hz for both Ux and Uz, while turbulence is shown to dissipate faster for larger frequencies.
In Figure 6a, the power amplitudes for Ux exhibit small differences among the three selected Δt values. The coverage of the high frequencies occurs slightly more for the smaller Δt (2000 Hz), while the difference for the medium and large Δt is very small (1600 Hz instead of 1400 Hz). The same maximum frequencies are observed for Uz in Figure 6b. On the other hand, the calculated power amplitude is slightly larger for the smaller Δt = 6 × 10⁻⁴ s, while the result for the medium and large Δt is the same.
For all cases of Δt and velocity components, the turbulence spectra present a coverage of the inertial sub-range of turbulence, up to higher frequencies in the dissipation range. As a fair compromise between the coverage of the small-scale turbulence and computational cost, the medium Δt = 6 × 10⁻⁴ s is selected for the rest of the study.

4.4. Reynolds Number

The high values of wind velocity and building height result into high Reynolds numbers (Re) of atmospheric flows. Wind tunnel studies by Snyder [89] set the critical Re number at 11,000, based on the reference velocity of the free stream and building height. Later experiments either followed the aforementioned critical number [90], or directed to larger Re numbers, e.g., 19,000 [17], 37,000 [91], 44,000 [92], and 56,000 [3]. Recently Cui et al. [93] reviewed the latest Re values reported in the literature and available CFD simulations with regard to the critical Re number, proposing a critical value of 32,000. At the same time, following such critical values do not result to validation issues since most available validation datasets have been produced in wind tunnels where ‘low’ Re is a constraint. To re-examine the effect of Re, we selected three reference wind velocities, namely 0.15 m⋅s−1 (Re = 96,000), 1.5 m⋅s−1 (Re = 960,000) and 5 m⋅s−1 (Re = 3,200,000). The normalized average magnitude of velocity (Umean/Uref) and dimensionless concentration (C/Cmax) are averaged over a time-span of 300 H/Uref, as shown in Figure 7, to employ equivalent mixing scales.
The similarity criterion is generally satisfied for the normalised velocity, as shown in Figure 7a–c, however, some differences also appear. In Figure 7b,c, the magnitude of the wind speed for the larger Re numbers at 960,000 and 3,200,000 is nearly identical, while for Re = 96,000 the height in which U/Uref = 0.5 is lower than the former two. As Re increases, the shear layer between the roofs is slight widening, while large vortex in the center of the canyon is reinforced, thus reducing the size of the three smaller ones. Moreover, the magnitude of velocity on the downwind wall is increasing along with velocity, meaning that the entrainment of clean air gets proportionally stronger with the increase of Re.
On the other hand, the impact on the pollutant dispersion is profound. The normalized concentration C/Cmax changes for the three Re numbers, as presented in Figure 7d–f. The patterns of pollution are similar, but the frequency of the small concentrations changes drastically from Re = 960,000 and 3,200,000 to Re = 96,000 (Figure S2 of the Supplementary Material). The larger values of C/Cmax at Re = 96,000 are observed near the ground, at the height of the source. At Re = 960,000 and 3,200,000 pollution gets more mixed inside the canyon, with higher concentrations observed at the upwind side of the canyon and the upwind wall, respectively. Finally, it is noted that for Re = 96,000, C/Cmax values close to zero are simulated for the downwind side of the canyon.
The average normalized velocity for the three compared Re numbers showed discrepancies for the flow field, even though the notion of Re independency is generally confirmed. The results for concentration showed their clear dependency on Re number, as expected. Even though 3,200,000 is a high value of Re to simulate, the values for a real city geometry can be even higher, because of the large average height of the buildings. To keep the study as realistic as possible, the reference velocity at 5 m⋅s−1 was chosen.

4.5. Source Height

A brief discussion regarding the pollutant source is presented. Having to simulate the effect of traffic pollution, we assume a line source, even though area sources have also been reported in the literature [94,95]. In OpenFOAM, the emission characteristics of the source are specified in the file fvOptions, inside the utility scalarSemiImplicitSource, while the topology is created with the topoSet utility [48].
The value for the mass emission rate was set to 620 g km−1⋅h−1 and it represents a realistic emission rate of NOx for continuous canyon traffic [22]. Li et al. [69] claimed that the laminar layer formed on the walls creates a bottleneck to the dispersion of pollutants. This resistance creates non-physical results, when the volume of the source is located entirely inside the laminar layer of the wall. Thus, the height and width of the source should be investigated.
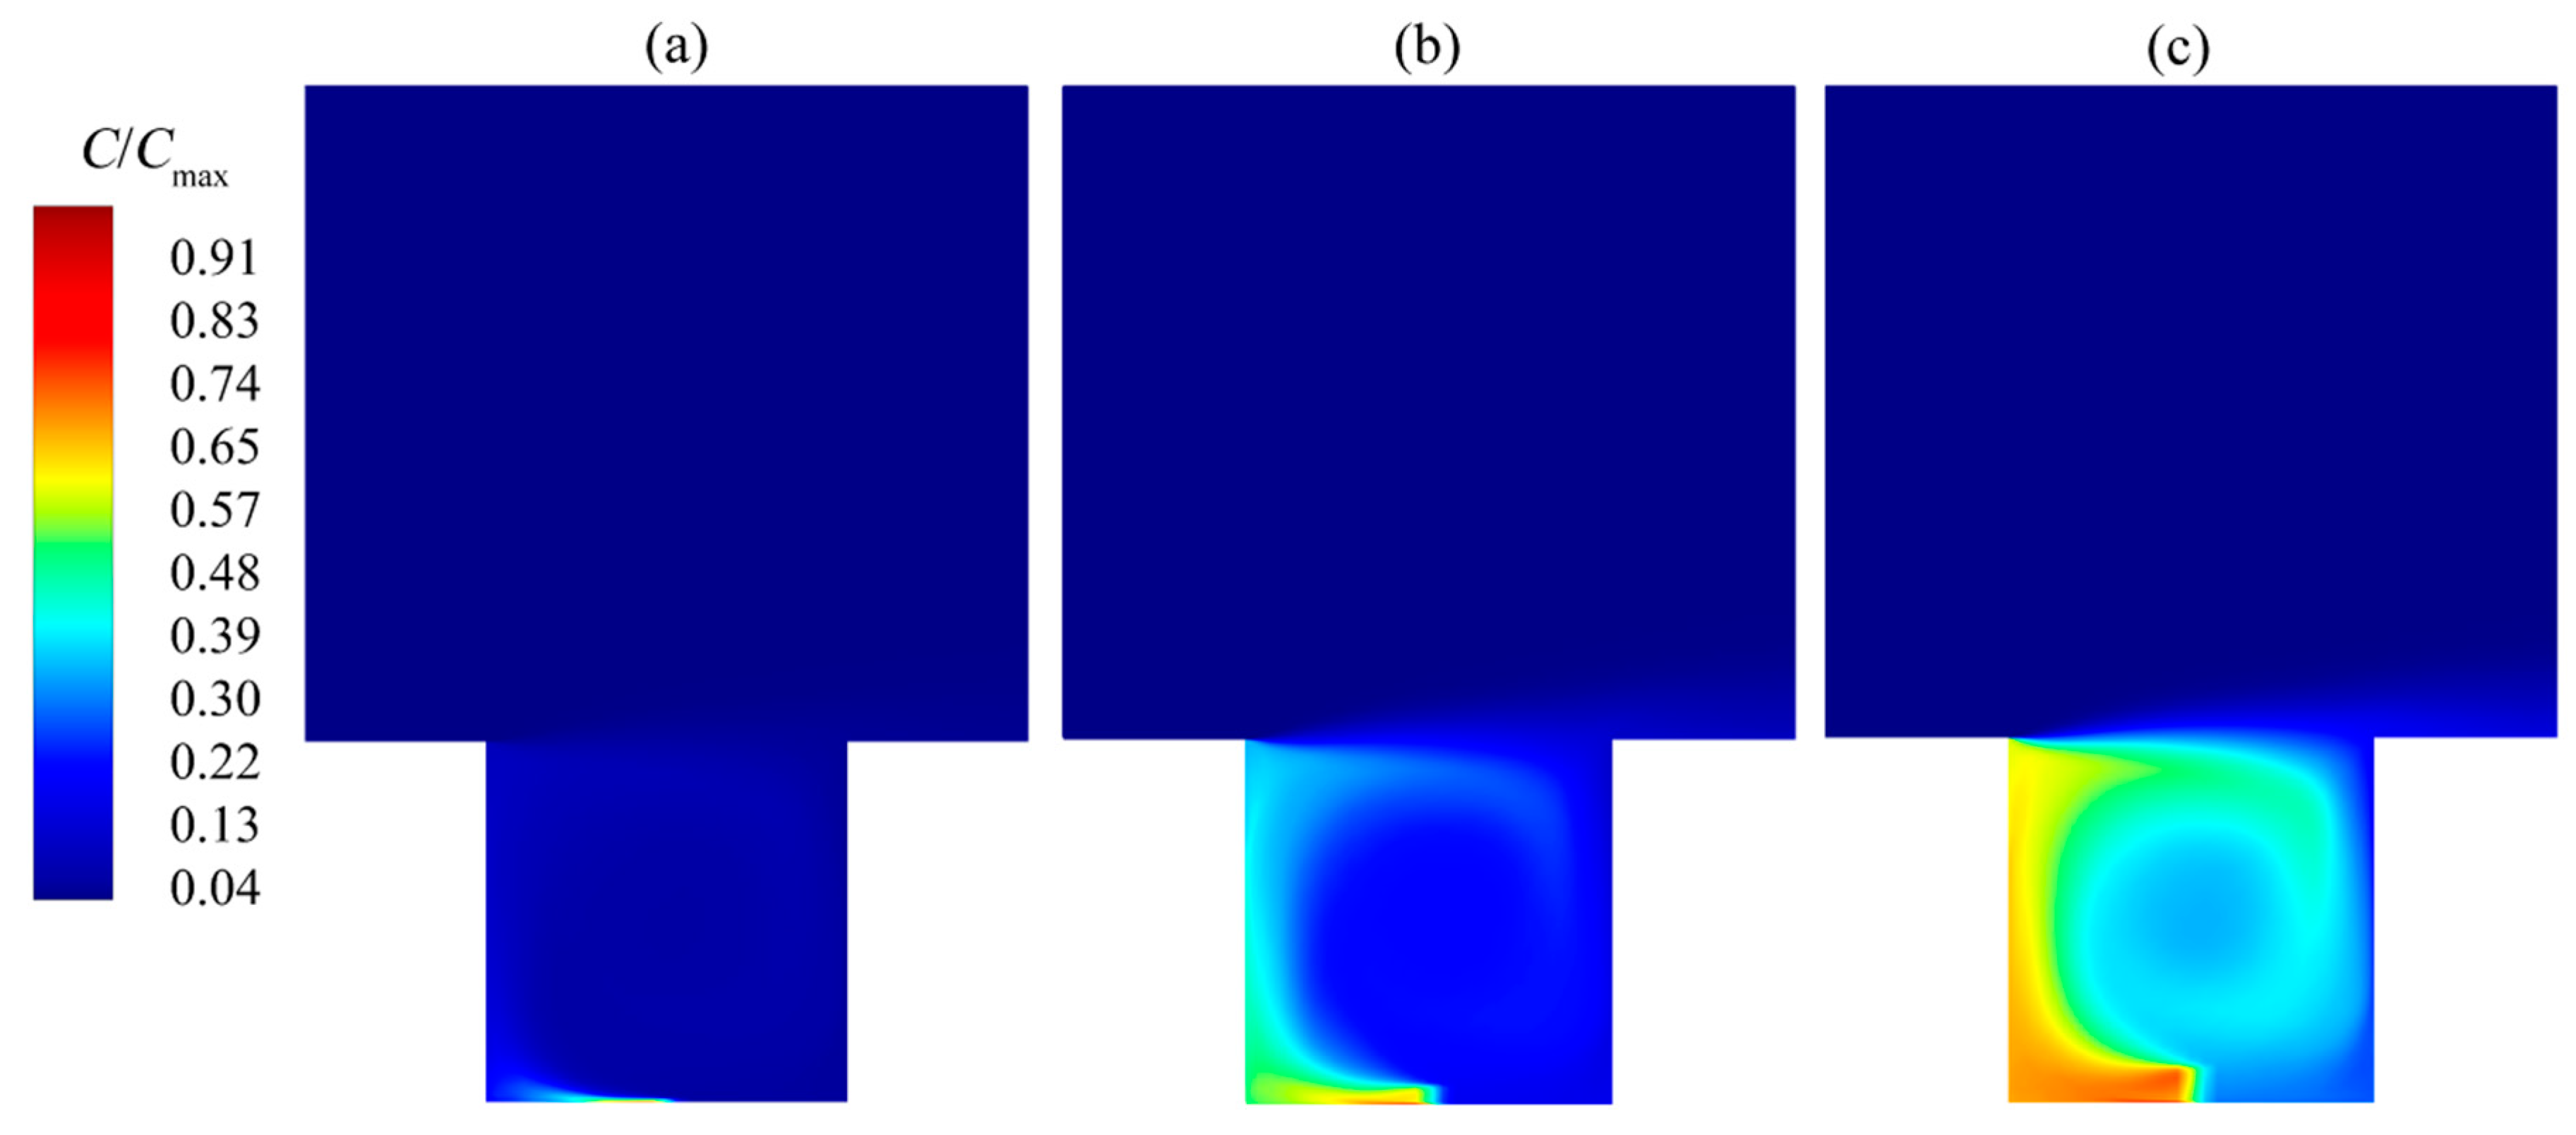
In the present study, the source is located at the middle of the canyon, so its width is set to two cells, which differs slightly depending on the grid (see Figure 1). Six potential source heights were examined, namely 0.005, 0.01, 0.1, 0.5, 0.75, and 1 m. The mass emission rate is kept steady for all source heights, by setting the selection volumeMode as absolute inside the utility scalarSemiImplicitSource. Figure 8 presents the normalized C/Cmax values after 900 s for three indicative source heights.
Initially, the source height was set to 0.1 m above the ground that clearly resides in the wall boundary, as shown in Figure 8a. As a result, the pollutant is weakly dispersed, but gathered at the bottom of the street. Then, the source height was increased to 0.5 m (Figure 8b), resulting in a dispersion pattern similar to the experimental data, such as those by Pavageau and Schatzmann [31]. Finally, Figure 8c depicts the results of C/Cmax for the source height equal to 1 m, presenting a broader dispersion pattern. The results for 1 m improved the agreement with the experimental values for the downwind side, but increased the difference for the upwind side disproportionally. Thus, the source height of 0.5 m was selected as the optimal solution to both overcome the effect of the wall boundary layer and resemble the experimental data, even though the 1 m source height may also be considered a valid option.

4.6. Turbulence Modelling

Four SGS models (standard Smagorinsky, WALE, k-equation and localised dynamic k-equation) and three of the available wall functions (van Driest damping function, Spalding’s law, and the simple logarithmic law) were tested in OpenFOAM v5.0. The considered scenarios are presented in Table 1.
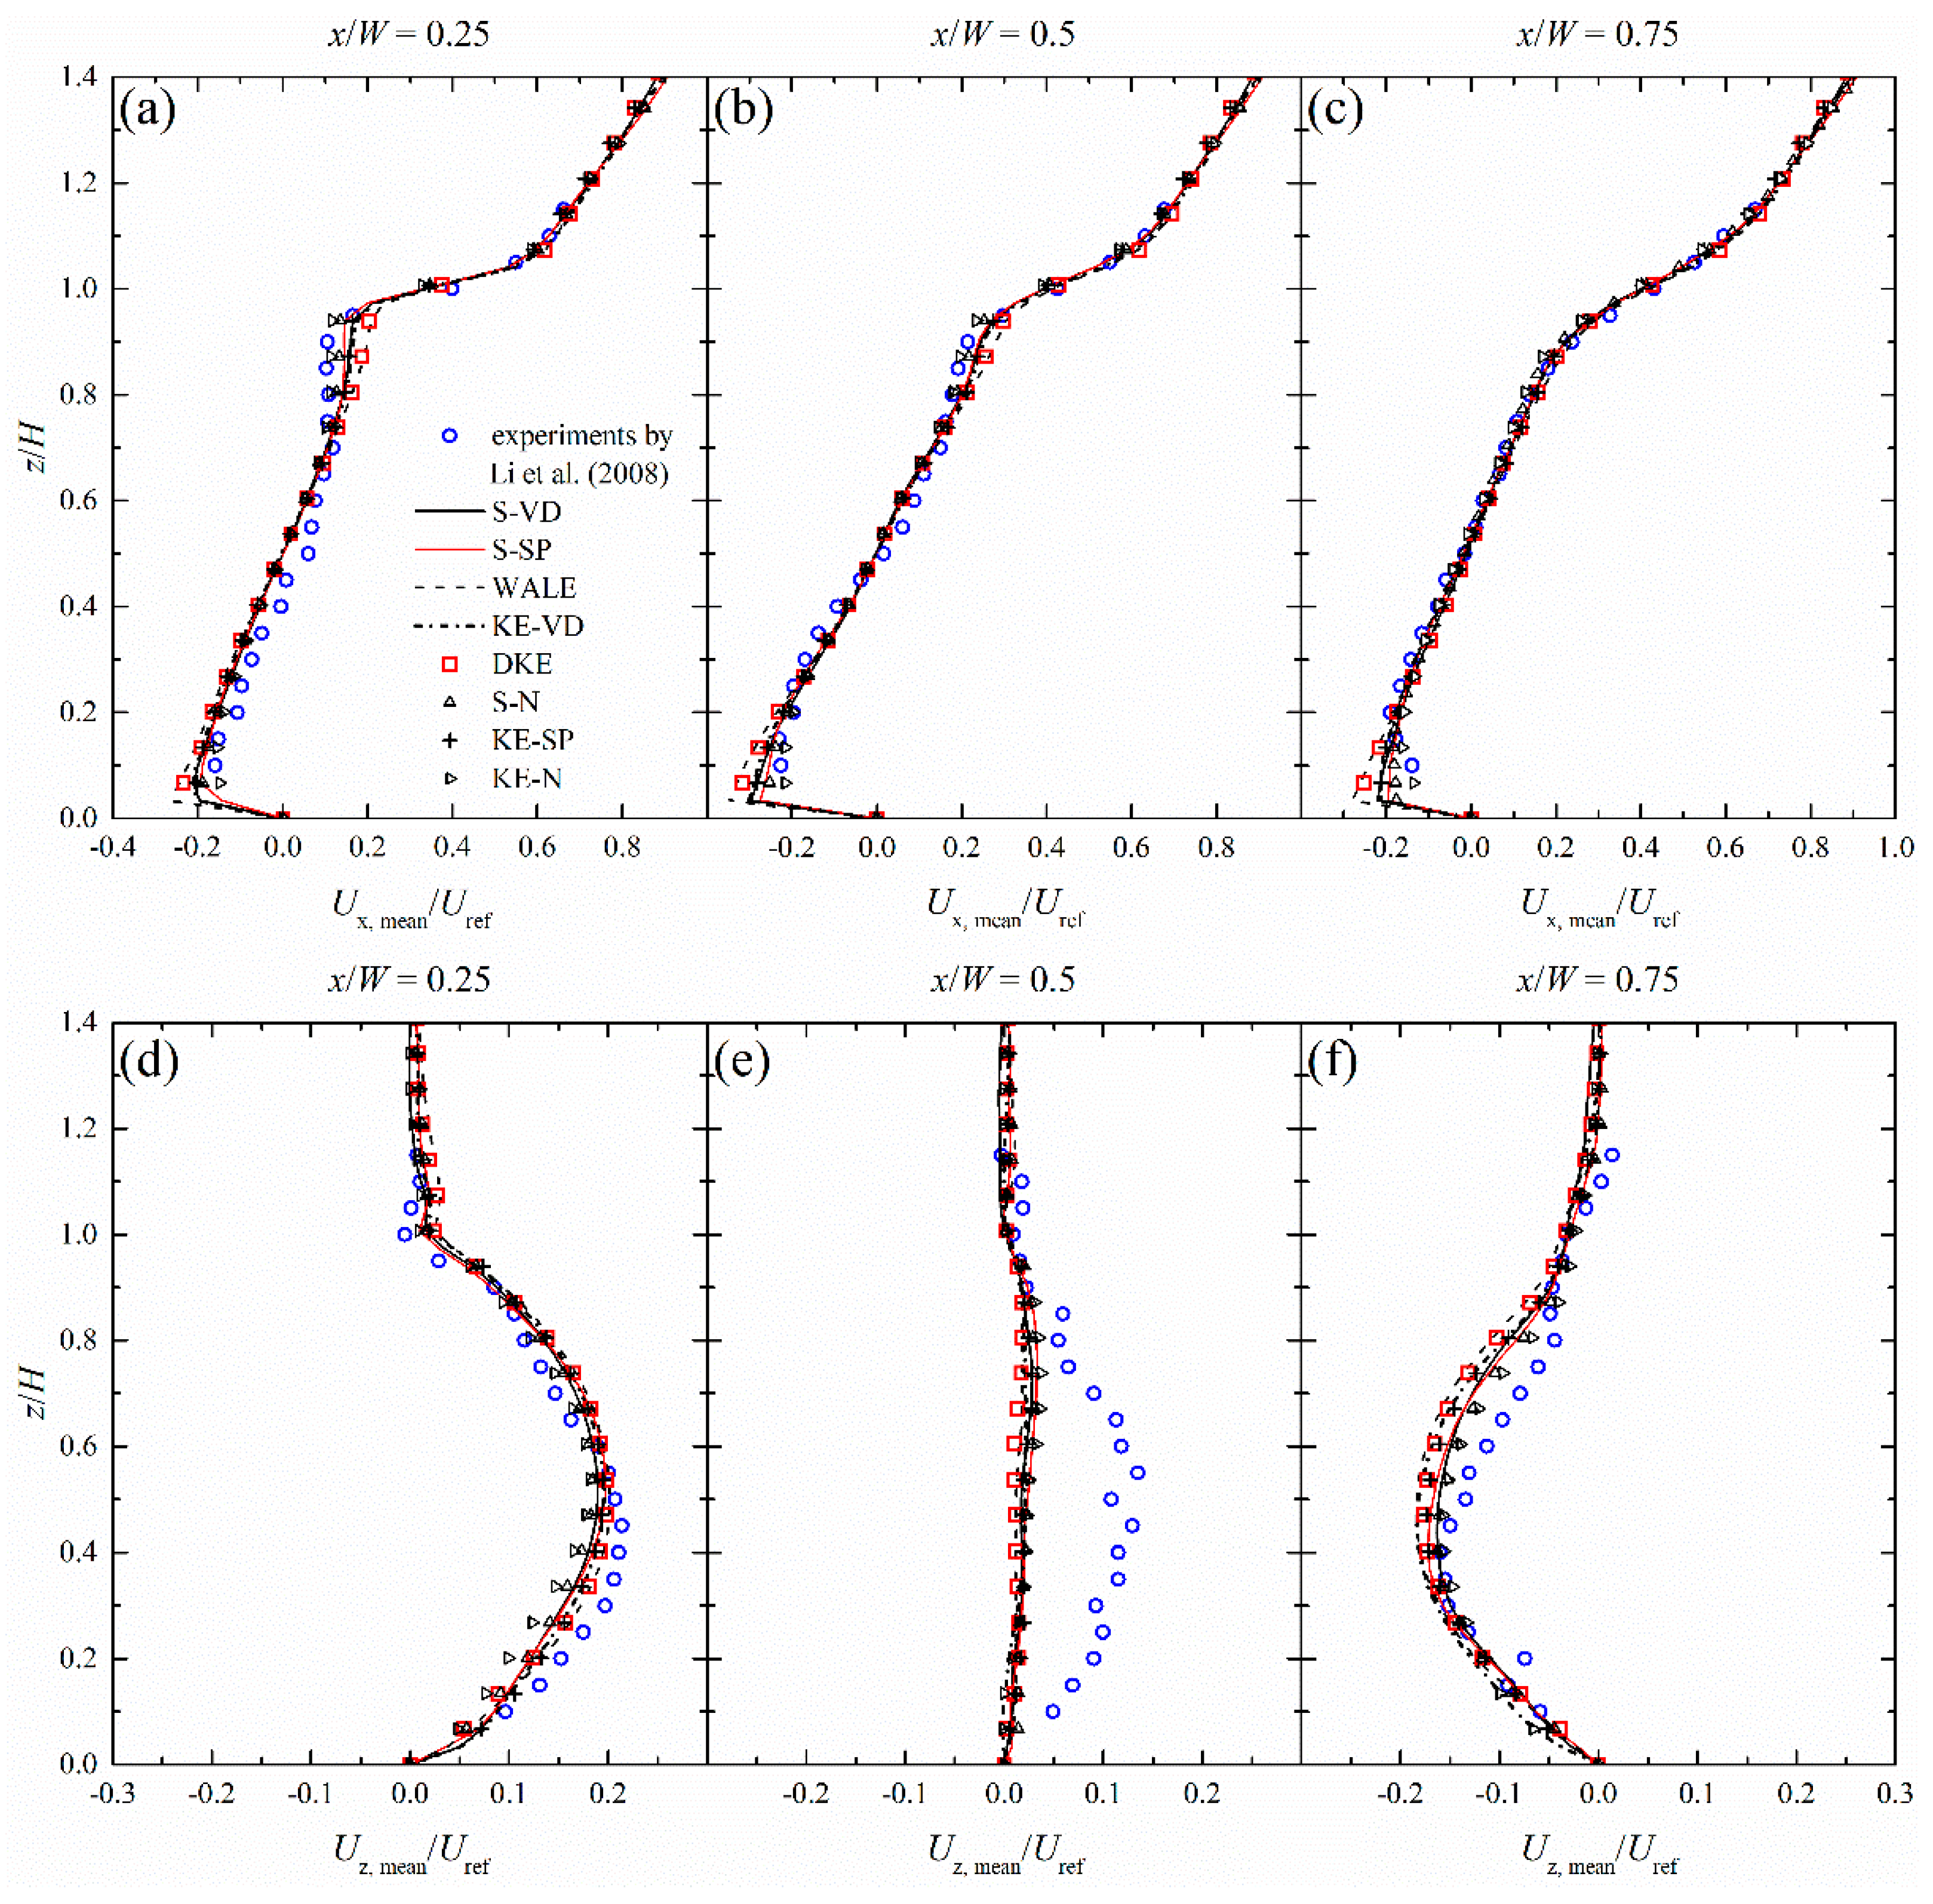
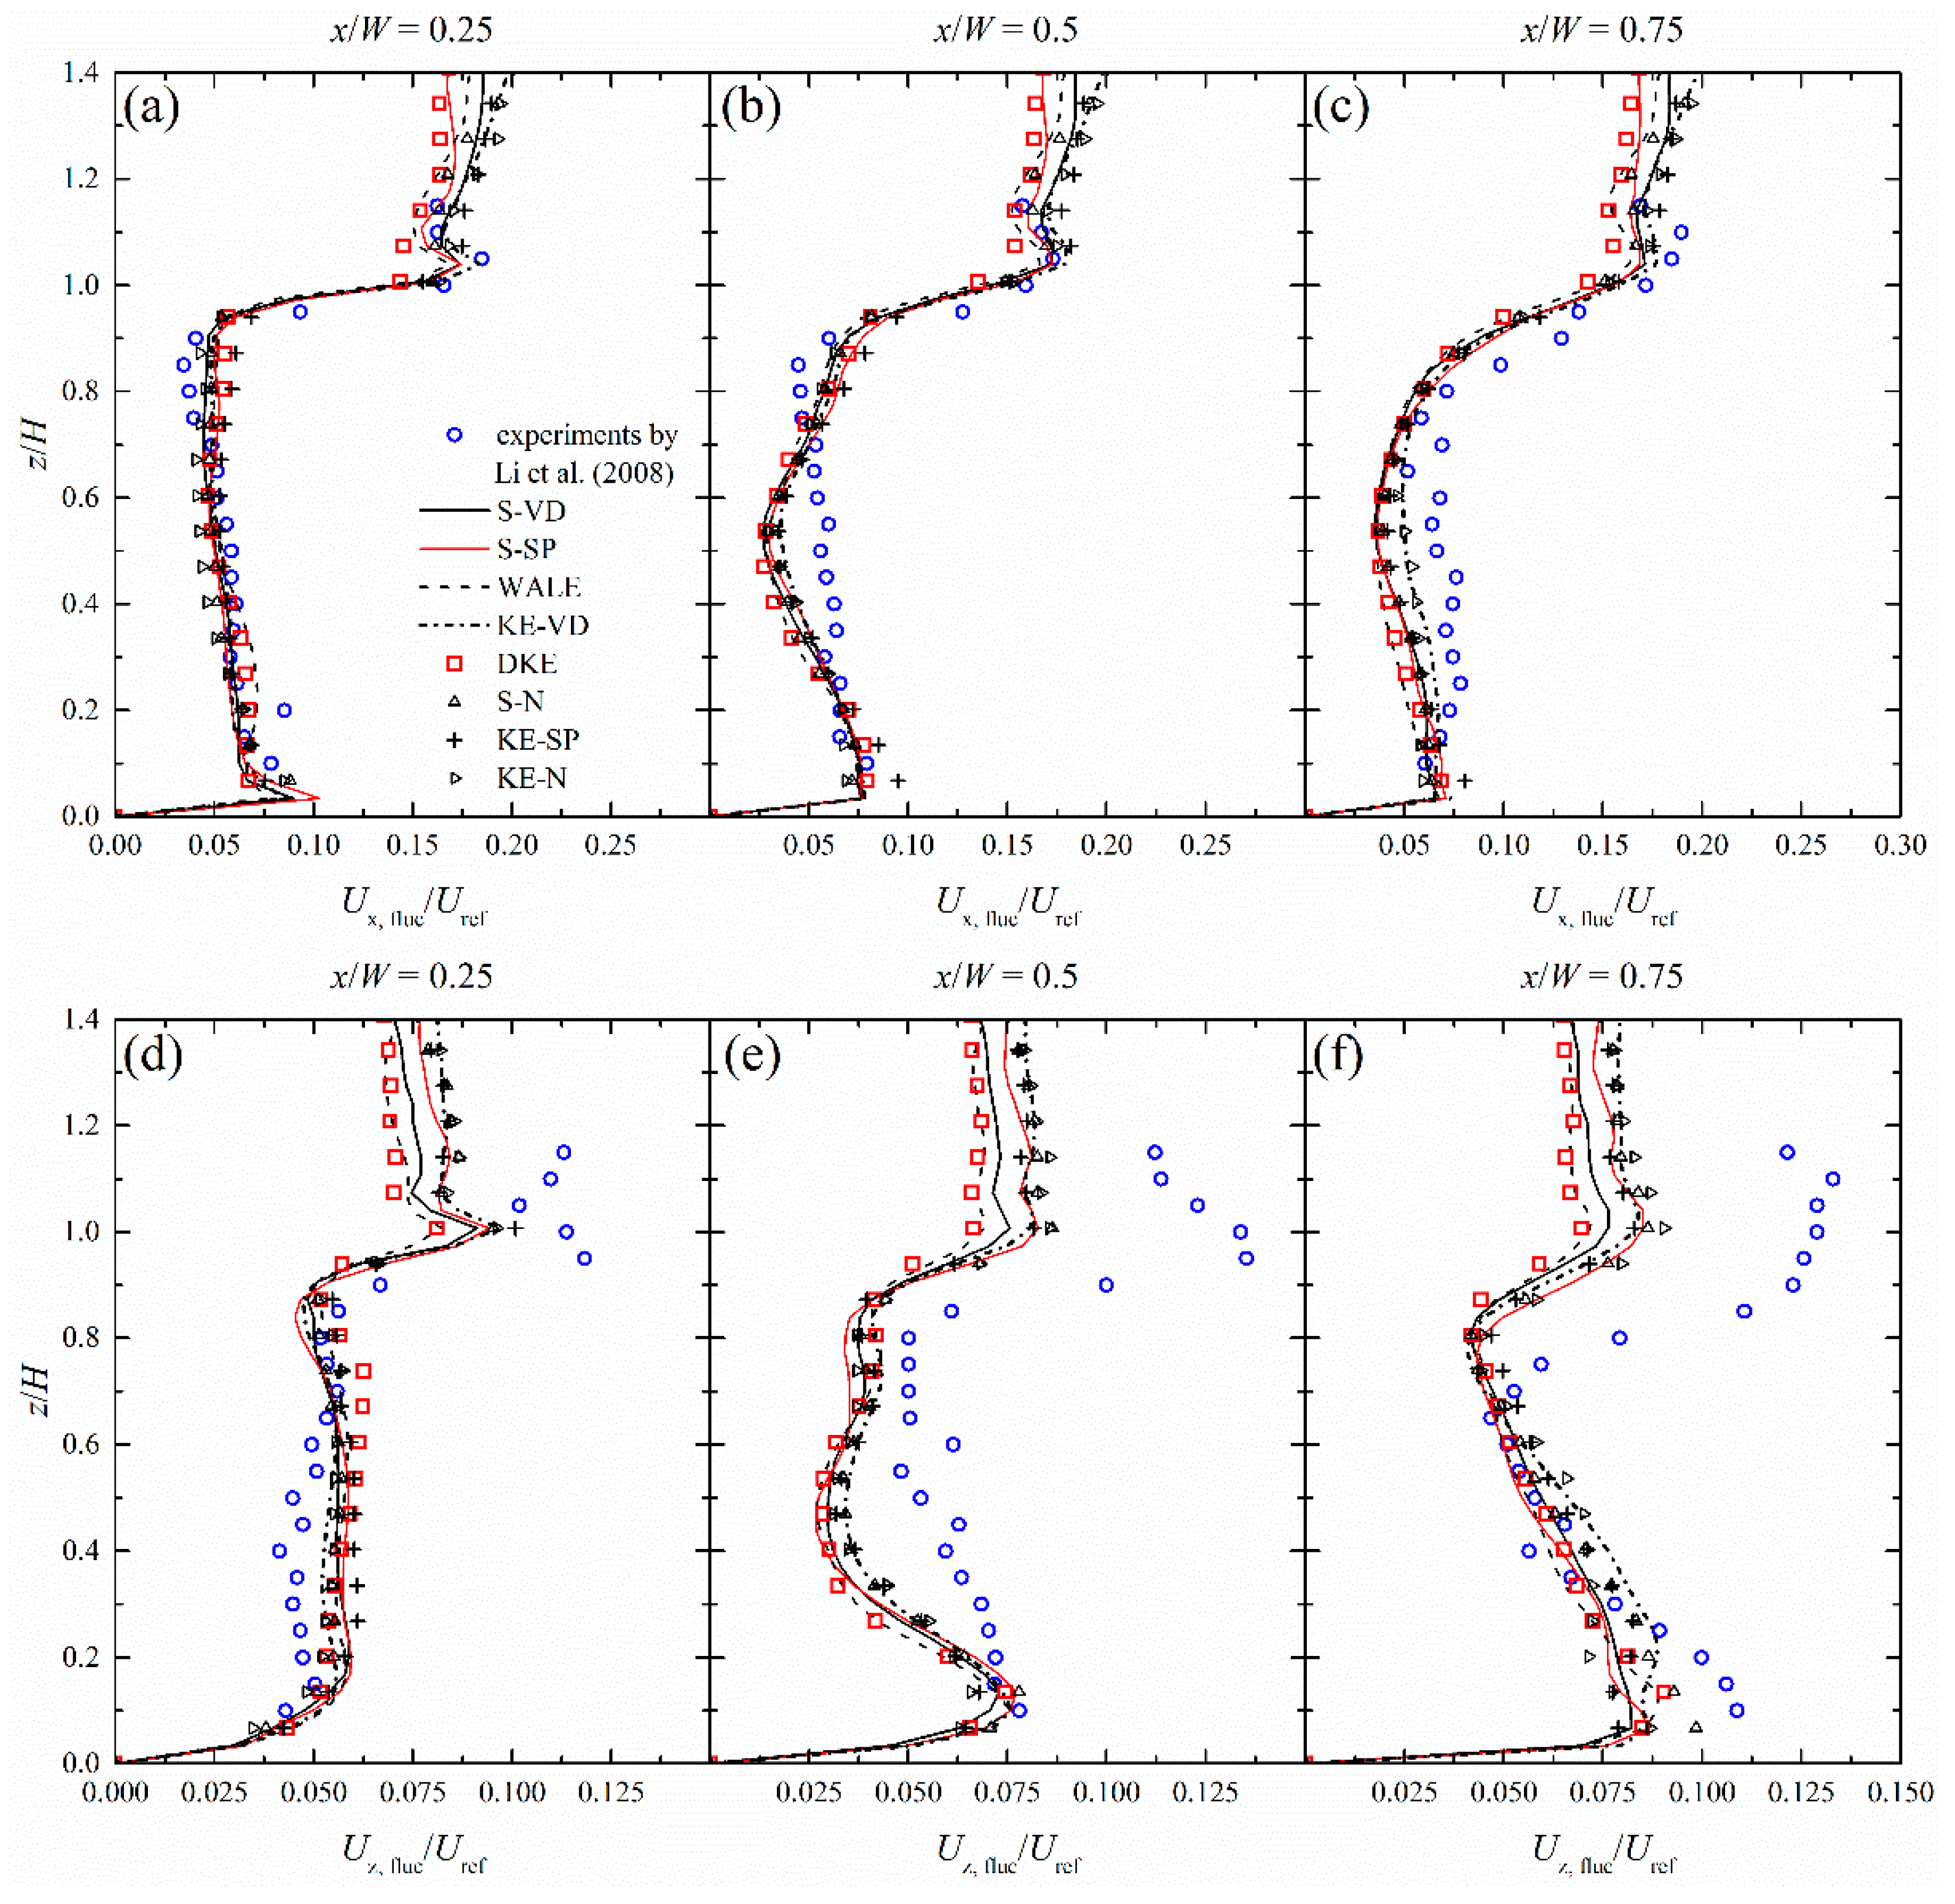
The results of the simulations are shown in Figure 9 and Figure 10, presenting the averages and fluctuations of U- and W-components, respectively. Three vertical lines at x/W = 0.25, 0.50, and 0.75 of the canyon width were chosen for the comparison of numerical data obtained with the available experimental data by Li et al. [30].
In Figure 9, there are no significant differences for the average Ux, between the applied models and the experimental data. The largest discrepancies are observed for Uz in the middle of the canyon (x/W = 0.50), which applies to all the employed combinations. Mismatch from the experimental data is also observed for Uz at x/W = 0.75, for the region between z/H = 0.4 and 0.8. For this case, the best prediction is obtained for KE-N, while the worst case represents WALE. Generally, the calculation for U was proved to be more accurate than that of W.
This trend is also appeared for the velocity fluctuations, as shown in Figure 10. For this case, a disparity between the predictions and experiments appears as we move from x/W = 0.25 to 0.75. The capture of Ux,fluc at x/W = 0.25 is in a good agreement with the available experimental data for all combinations, while for Uz,fluc exists an over-prediction for the area between z/H = 0.1 and 0.7. For the line in the middle, the Ux,fluc is over-predicted and under-predicted at the regions above and below z/H = 0.7, respectively, while Uz,fluc is under-predicted for all the height. Finally, Ux,fluc at x/W = 0.75 is generally under-estimated along the height of the canyon, but close to the experiments. On the other hand, the Uz,fluc presents the worst discrepancies among the considered comparisons for the region higher than z/H = 0.7. In this area occurs the entrainment of clean air where the presence of turbulence is intensive and coincides with the area of lower LES_IQv (Figure 5b). The averages and fluctuations for Ux and Uz are compared with [30] in two more locations inside the canyon, at the Figures S3 and S4 of the supplementary material. For the predicted averaged Ux and Uz fluctuations, DKE model’s predictions present the largest mismatch compared to the experimental measurements, while KE-N model results are again approaching closer to the experimental data for all considered cases.
The most interesting observations obtained from the results of C/Cmax, some of which are presented in Figure 2. The concentrations for the downwind wall are very close to each other and under-estimated for all the used combinations. For the upwind wall, the results differentiate a lot, with the largest over-prediction obtained from D-KE and WALE. Results obtained from S-V, S-SP, K-VD, and KE-N present almost identical performance and closer to the experimental but still resulting in over-prediction of the concentration field, while the last model exhibits slightly better performance. The C/Cmax results of all the employed SGS models and wall functions can be found in of the Figure S5 supplementary material.
K-SP and KE-N models exhibit the best predictions, as shown in Figure 2. Their results for the downwind side are in fair agreement with the experiments, while the K-SP model gives better predictions for the heights below z/H = 0.4. However, KE-N achieved the best improvement for the upwind side, out-performing the other combinations. Hence, the use of the k-equation model, together with the simple logarithmic nutkWallFunction (KE-N), is proposed herein.

4.7. Validation Metrics

The validation metrics FAC2, NMSE, and FB are employed to obtain a quantitative measure of the quality of the selected KE-N simulation, which was determined herein as the most suitable option for the prediction of the average concentration (in Section 4.6). The averages and the fluctuations of velocity components, at 200 points, were compared with the available experimental data by Li et al. [30], while the LES results by Li [73] were also used for comparison. The concentration results were validated against the experimental data by Pavageau and Schatzmann [31], Meroney et al. [32], Pavageau [33], and Hoydysh and Dabberdt [74]; for a total of 24 points. For the following definitions, Oi are the observed values in experiments, and Pi are the predicted values from the obtained LES, while “[ ]” denotes the averaged values.
1. Factor of two or FAC2
F A C 2 = 1 N i = 1 N n i
where ni = 1, for 0.5 ≤ Pi/Oi ≤ 2, or else ni = 0.
2. Normalized mean square error (NMSE)
N M S E = [ ( O i P i ) 2 ] [ O i ] [ P i ]
3. Fractional bias (FB)
F B = [ O i ] [ P i ] 0.5 ( [ O i ] [ P i ] )
All the employed metrics are summarized in Table 2.
FAC2 estimates the percentage of the predictions, which are within a factor of two of the observations, based on the ratio of the predicted and observed value [75]. It was employed for Ux and Uz presenting a value of 0.85 for the horizontal velocity, the result for the vertical component is lower at 0.68 and the total FAC2 is 0.77. The ideal value is the unity, but values above 0.5 [77] and 0.8 [78] are also acceptable.
Total NSME for both velocity components was found to be 0.25, while individually for Ux and Uz was calculated as 0.19 and 0.30, respectively. For this metric, the ideal value is zero, but NMSE < 1.5 [77] and NMSE < 4 [75] are likewise reported as acceptable limits. By these measures, the NMSE gives the higher level of confidence to our results. It is important to mention that the NSME does not have sense for parameters with negative and positive values [75], nevertheless, we tested it because 184 of the 200 points of our comparison have the same sign.
Regarding the concentration calculation, two ways are generally used. The first is the normalized concentration (C*), employed to account for Re and strength of the source, described by Schatzmann and Leitl [96]
C * = C U ref H Q / L
where C is the simulated concentration in Kg·m−3, Uref is the reference wind velocity, H is the characteristic building height and Q/L is the strength of the source in Kg·m−1·s−1.
The second approach is the dimensionless concentration (C/Cmax), where C is divided by the maximum value in the domain, usually residing at the upwind wall. C* is used most of the times, even though the normalizing quantities vary, such as H2 instead of HL and volumetric flow of the source instead of mass rate [93]. In most of our cases, we applied the dimensionless concentration C/Cmax, which was observed to reach a steady state value at around 500 H/Uref.
The three employed metrics for the dimensionless concentrations C/Cmax show excellent results. FAC2 is 0.8 for the upwind wall, while it reaches the absolute unity for the downwind wall. The NMSE is very close to the optimal zero, presenting 0.05 and 0.04 for the upwind and downwind walls, respectively. Finally, FB gave the largest values at 0.15 for the downwind wall, while it was around 0.06 for the upwind wall that satisfies the recommended levels.

4.8. Turbulence Statistics

The energy spectra for the middle of the canyon were computed to examine the quality of our LES approach. Several works have utilized energy spectra to examine the ability of LES to reproduce realistic results. These are compared either against wind tunnel data [17,24], or among different LES parameterizations (e.g., methods for the production of turbulence [97], grid resolutions, and Re number [98]).
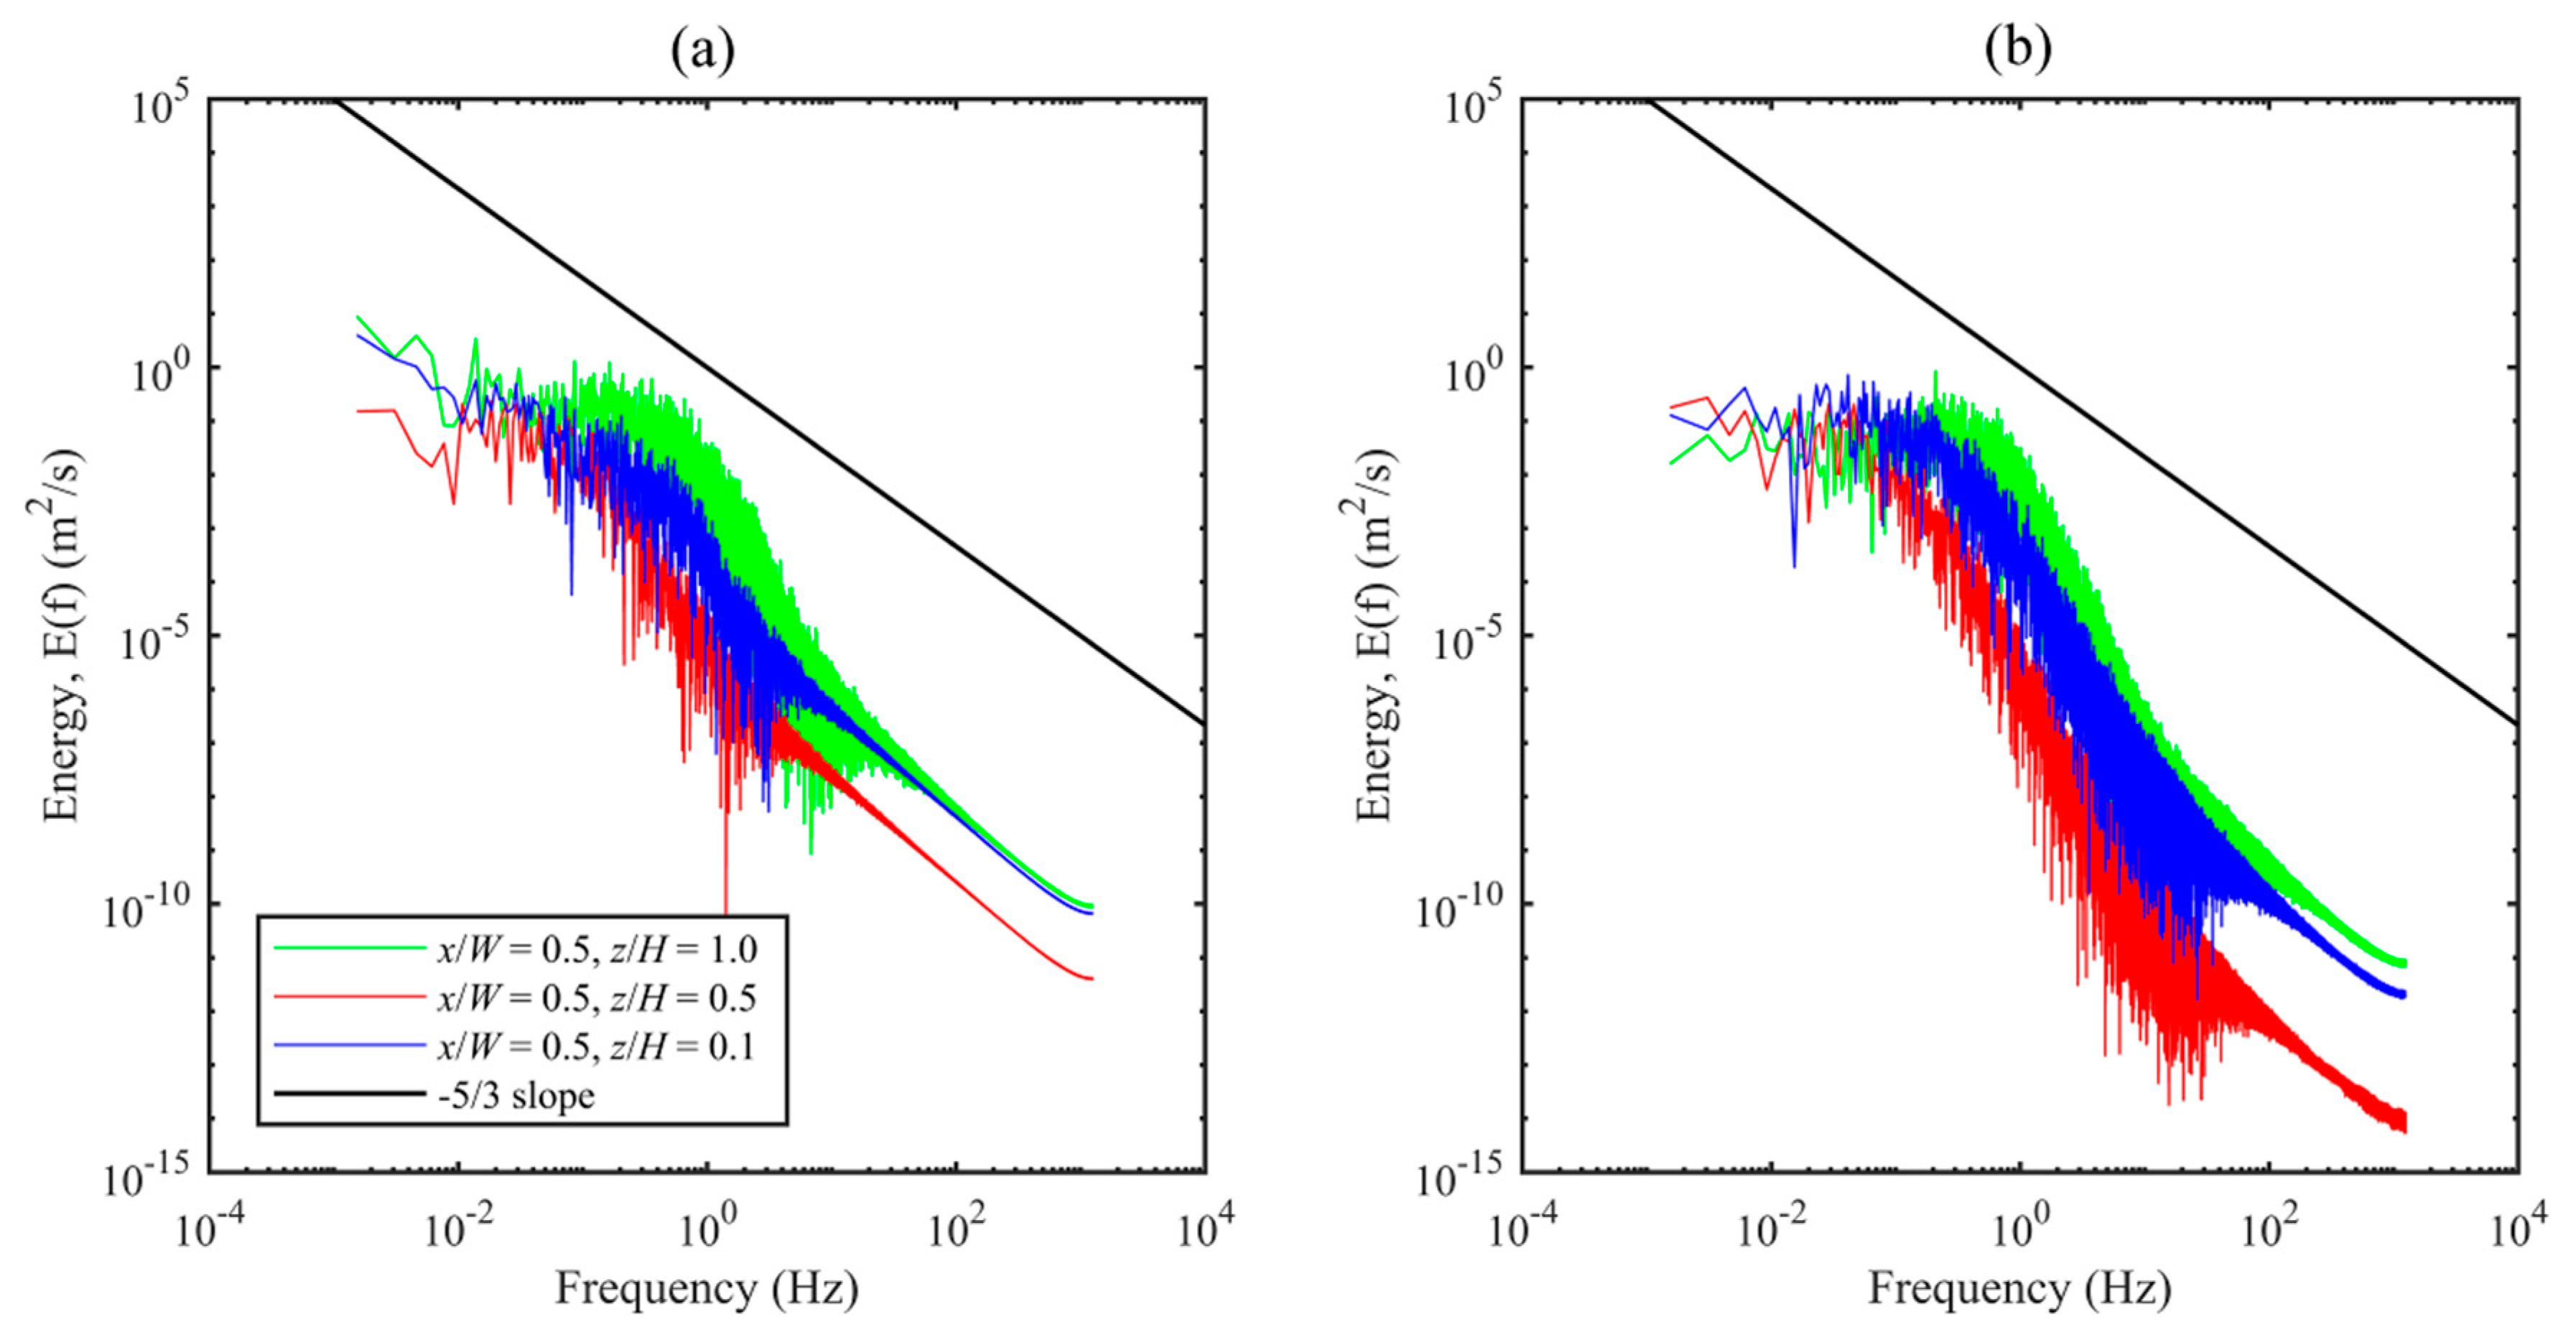
Figure 11 presents the energy spectra for three heights in the middle of the canyon (x/W = 0.5), at z/H = 0.1, 0.5, and 1.0, where cells have relatively larger size compared to close the walls. For all the cases the amplitudes of the spectra correspond to the magnitude of the local velocity. The spectrum for Ux at the top of the canyon is parallel to the 5/3 slope described by Kolmogorov, between 0.3 and 2 Hz, indicating the existence of the inertial sub-range in a narrow band. On the other hand, for the regions with the dense grid near the wall (z/H = 0.1) and the lower velocities in the middle height (z/H = 0.5), the spectra follow the −5/3 slope throughout the six orders of frequency, except from an area between 1 and 10 Hz. The spectra for Uz are presented in Figure 11b and they show a very narrow inertial sub-range between 0.8 and 4 Hz. For higher frequencies and smaller turbulence scales the slope is steeper, implying that turbulence decays faster than expected. This may explain the inability of all combinations to predict Uz in the middle of the canyon (see Figure 9) and can be attributed either on grid resolution or the numerical schemes.

5. Conclusions

This study focused on the LES of wind flow and pollutant dispersion in an ideal quasi-2D street canyon, using the open-source CFD code OpenFOAM v5.0. Initially, the computational domain height, the grid resolution and time-step were studied, to examine the quality of the LES approach. Moreover, the effect of Re and the height of the pollutant source were investigated, to find out their possible impact to the validation results. After establishing the details about the grid, the Re number and the source setup, the effect of turbulence modelling was analyzed. Four well-known SGS models that are implemented in OpenFOAM were tested, together with three standard wall-functions, to cover for the excess values of y+. The results were compared with available experimental and numerical data. The main conclusions are:
  • The height of the domain indicated a small effect for the concentration in the downwind side, while had no effect for the upwind wall. Both effects diminished for the case with 5 H, which was selected for the height of the upper atmosphere.
  • The grid resolution with 120 cells per building height was selected. The use of the LES_IQv index showed that turbulence kinetic energy was resolved at more than 80% for the area of the canyon, while the lower values at the street level are in the downwind side of the canyon.
  • The use of energy spectra showed small differences in the coverage of the turbulence scales for the examined time-steps, as expected, because the time-steps had very close values. Smaller values were not tested. A CFL value below 0.1 was kept for the most period of the numerical simulation and the largest part of the computational domain.
  • All the SGS models reproduced the average velocity at an acceptable level. Horizontal velocity Ux is generally resolved better than vertical velocity Uz. Some discrepancies were observed for the fluctuations of velocity, again the larger differences were occurred for Uz.
  • On the other hand, pollutant dispersion was most affected by the SGS model, with best results obtained with the k-equation model and nutKwallfunction.
  • The height of the source can be critical to the dispersion of the pollutants and subsequently the validation process. If the selected height is located inside the laminar layer of the wall boundary layer on the ground, then dispersion will be artificially hindered. The selected source height overcame this issue and resulted to a better agreement with the experimental data. However, this is a known challenge of numerical models and a recurring issue in the literature, that requires better consideration in future experimental studies.
  • Three Re numbers were studied to examine its effect on the results. As expected, the normalized average velocity was nearly identical for the three cases. On the other hand, the average dimensionless concentration was affected and not proportionally to the Re number increase. The y+ at the ground reached an average value of 2.7 and a maximum value of 6, while the respective values for the lateral building walls at 3.7 and 21. These values do not cover completely the proposed maximum of y+ = 5. On the other hand, the use of the selected wall function and the results of the validation metrics imply that these y+ values can be acceptable for Re = 3,200,000.
  • The discrepancies for Uz in the middle of the canyon (Figure 9) can be attributed to the local grid resolution or the use of dissipative numerical schemes. In our case, second order schemes were applied for all terms, while the cells are relatively larger for this area. Furthermore, compared to the medium the fine grid showed a clear improvement, moving the slope of the energy spectrum for Uz, closer to the −5/3 slope described by Kolmogorov (Figure S6). This implies that a higher grid resolution may indeed improve the results in this region.
LES is a valuable tool and upon the selection and validation of the most appropriate configurations (e.g., turbulence schemes, grid resolution) could supplement and extended experimental work. Similarly to other modelling efforts, LES simulations could be used to enhance understanding of physical phenomena, and contribute on the development of new or improvement of existing numerical models and software. Such software could be capable to provide predictions or extensive hindcasts in almost real-time, thus their improvement could expand their applicability for emergencies.

Supplementary Materials

The following are available online at https://www.mdpi.com/2073-4433/10/1/17/s1. Figures S1–S6, a sample animation (Figure S7), and the OpenFOAM Source files (without the calculated mesh or initial time step).

Author Contributions

Conceptualization, K.E.K.; Methodology, A.E.C., C.D.A. and K.E.K.; Software, Validation, A.E.C. and C.D.A.; Formal Analysis, Investigation, Data curation, Writing—Original Draft Preparation, A.E.C.; Writing—Review and Editing, all authors; Supervision, Project Administration, Funding Acquisition, K.E.K. and M.J.A.

Funding

This publication was made possible by a NPRP award (NPRP 7-674-2-252) from the Qatar National Research Fund (a member of The Qatar Foundation). The statements made herein are solely the responsibility of the authors.

Acknowledgments

The HPC resources and services used in this work were provided by the IT Research Computing group in Texas A&M University at Qatar. IT Research Computing is funded by the Qatar Foundation for Education, Science and Community Development (http://www.qf.org.qa).

Conflicts of Interest

The authors declare no conflict of interest.

References

  1. World Health Organization. 7 Million Premature Deaths Annually Linked to Air Pollution. Available online: http://www.who.int/mediacentre/news/releases/2014/air-pollution/en/ (accessed on 1 December 2018).
  2. Berkowicz, R. OSPM—A Parameterised Street Pollution Model. Environ. Monit. Assess. 2000, 65, 323–331. [Google Scholar] [CrossRef]
  3. Kovar-Panskus, A.; Louka, P.; Sini, J.F.; Savory, E.; Czech, M.; Abdelqari, A.; Mestayer, P.G.; Toy, N. Influence of Geometry on the Mean Flow within Urban Street Canyons—A Comparison of Wind Tunnel Experiments and Numerical Simulations. Water Air Soil Pollut. Focus 2002, 2, 365–380. [Google Scholar] [CrossRef]
  4. Dallman, A.; Magnusson, S.; Britter, R.; Norford, L.; Entekhabi, D.; Fernando, H.J.S. Conditions for thermal circulation in urban street canyons. Build. Environ. 2014, 80, 184–191. [Google Scholar] [CrossRef]
  5. Madalozzo, D.M.S.; Braun, A.L.; Awruch, A.M.; Morsch, I.B. Numerical simulation of pollutant dispersion in street canyons: Geometric and thermal effects. Appl. Math. Model. 2014, 38, 5883–5909. [Google Scholar] [CrossRef]
  6. Chatzimichailidis, A.E.; Argyropoulos, C.D.; Assael, M.J.; Kakosimos, K.E. A formulation for the street canyon recirculation zone based on parametric analysis of large eddy simulations. In Proceedings of the HARMO 2017—18th International Conference on Harmonisation within Atmospheric Dispersion Modelling for Regulatory Purposes, Bologna, Italy, 9–12 October 2017; pp. 455–459. [Google Scholar]
  7. Chatzimichailidis, A.; Assael, M.; Ketzel, M.; Kakosimos, K.E. Modelling the recirculation zone in street canyons with different aspect ratios, using cfd simulation. In Proceedings of the HARMO 2016–17th International Conference on Harmonisation within Atmospheric Dispersion Modelling for Regulatory Purposes, Budapest, Hungary, 9–12 May 2016; pp. 319–323. [Google Scholar]
  8. Argyropoulos, C.D.; Ashraf, A.M.; Markatos, N.C.; Kakosimos, K.E. Mathematical modelling and computer simulation of toxic gas building infiltration. Process Saf. Environ. Protec. 2017, 111, 687–700. [Google Scholar] [CrossRef]
  9. Argyropoulos, C.D.; Elkhalifa, S.; Fthenou, E.; Efthimiou, G.C.; Andronopoulos, S.; Venetsanos, A.; Kovalets, I.V.; Kakosimos, K.E. Source reconstruction of airborne toxics based on acute health effects information. Sci. Rep. 2018, 8, 5596. [Google Scholar] [CrossRef] [PubMed]
  10. Dong, J.; Tan, Z.; Xiao, Y.; Tu, J. Seasonal Changing Effect on Airflow and Pollutant Dispersion Characteristics in Urban Street Canyons. Atmosphere 2017, 8, 43. [Google Scholar] [CrossRef]
  11. Ming, T.; Fang, W.; Peng, C.; Cai, C.; de Richter, R.; Ahmadi, M.; Wen, Y. Impacts of Traffic Tidal Flow on Pollutant Dispersion in a Non-Uniform Urban Street Canyon. Atmosphere 2018, 9, 82. [Google Scholar] [CrossRef]
  12. Hong, B.; Lin, B.; Qin, H. Numerical Investigation on the Effect of Avenue Trees on PM2.5 Dispersion in Urban Street Canyons. Atmosphere 2017, 8, 129. [Google Scholar] [CrossRef]
  13. Argyropoulos, C.D.; Markatos, N.C. Recent advances on the numerical modelling of turbulent flows. Appl. Math. Model. 2015, 39, 693–732. [Google Scholar] [CrossRef]
  14. Castro, I.P.; Xie, Z.-T.; Fuka, V.; Robins, A.G.; Carpentieri, M.; Hayden, P.; Hertwig, D.; Coceal, O. Measurements and Computations of Flow in an Urban Street System. Bound.-Layer Meteorol. 2016. [Google Scholar] [CrossRef]
  15. Kovalets, I.V.; Efthimiou, G.C.; Andronopoulos, S.; Venetsanos, A.G.; Argyropoulos, C.D.; Kakosimos, K.E. Inverse identification of unknown finite-duration air pollutant release from a point source in urban environment. Atmos. Environ. 2018, 181, 82–96. [Google Scholar] [CrossRef]
  16. Sagaut, P. Large Eddy Simulation for Incompressible Flows: An Introduction; Springer: Berlin, Germany, 2006. [Google Scholar]
  17. Kellnerová, R.; Fuka, V.; Uruba, V.; Jurčáková, K.; Nosek, Š.; Chaloupecká, H.; Jaňour, Z. On Street-Canyon Flow Dynamics: Advanced Validation of LES by Time-Resolved PIV. Atmosphere 2018, 9, 161. [Google Scholar] [CrossRef]
  18. Efthimiou, G.C.; Kovalets, I.V.; Argyropoulos, C.D.; Venetsanos, A.; Andronopoulos, S.; Kakosimos, K.E. Evaluation of an inverse modelling methodology for the prediction of a stationary point pollutant source in complex urban environments. Build. Environ. 2018, 143, 107–119. [Google Scholar] [CrossRef]
  19. Tominaga, Y.; Stathopoulos, T. CFD simulation of near-field pollutant dispersion in the urban environment: A review of current modeling techniques. Atmos. Environ. 2013, 79, 716–730. [Google Scholar] [CrossRef]
  20. Gousseau, P.; Blocken, B.; Stathopoulos, T.; van Heijst, G.J.F. CFD simulation of near-field pollutant dispersion on a high-resolution grid: A case study by LES and RANS for a building group in downtown Montreal. Atmos. Environ. 2011, 45, 428–438. [Google Scholar] [CrossRef] [Green Version]
  21. Li, X.-X.; Liu, C.-H.; Leung, D.C. Large-Eddy Simulation of Flow and Pollutant Dispersion in High-Aspect-Ratio Urban Street Canyons with Wall Model. Bound.-Layer Meteorol. 2008, 129, 249–268. [Google Scholar] [CrossRef]
  22. Zhong, J.; Cai, X.-M.; Bloss, W.J. Modelling the dispersion and transport of reactive pollutants in a deep urban street canyon: Using large-eddy simulation. Environ. Pollut. 2015, 200, 42–52. [Google Scholar] [CrossRef] [PubMed]
  23. Koutsourakis, N.; Bartzis, J.G.; Efthimiou, G.C.; Venetsanos, A.G.; Tolias, I.C.; Markatos, N.C.; Hertwig, D.; Leitl, B. LES study of unsteady flow phenomena in an urban geometry—The need for special evaluation methods. In Proceedings of the HARMO 2016—17th International Conference on Harmonisation within Atmospheric Dispersion Modelling for Regulatory Purposes, Varna, Bulgaria, 8–11 September 2014. [Google Scholar]
  24. Hertwig, D.; Patnaik, G.; Leitl, B. LES validation of urban flow, part II: Eddy statistics and flow structures. Environ. Fluid Mech. 2017, 17, 551–578. [Google Scholar] [CrossRef]
  25. Hertwig, D.; Patnaik, G.; Leitl, B. LES validation of urban flow, part I: Flow statistics and frequency distributions. Environ. Fluid Mech. 2017, 17, 521–550. [Google Scholar] [CrossRef]
  26. Chung, T.N.H.; Liu, C.-H. On the Mechanism of Air Pollutant Removal in Two-Dimensional Idealized Street Canyons: A Large-Eddy Simulation Approach. Bound.-Layer Meteorol. 2013, 148, 241–253. [Google Scholar] [CrossRef] [Green Version]
  27. Smagorinsky, J. General circulation experiments with the primitive equations: I. The basic experiment. Mon. Weather Rev. 1963, 91, 99–164. [Google Scholar] [CrossRef]
  28. Moeng, C.-H.; Sullivan, P.P. A Comparison of Shear- and Buoyancy-Driven Planetary Boundary Layer Flows. J. Atmos. Sci. 1994, 51, 999–1022. [Google Scholar] [CrossRef] [Green Version]
  29. Werner, H.; Wengle, H. Large-eddy simulation of turbulent flow over and around a cube in a plate channel. In Proceedings of the 8th symposium on turbulent shear flows, Munich, Germany, 9–11 September 1991; pp. 155–168. [Google Scholar]
  30. Li, X.-X.; Leung, D.Y.C.; Liu, C.-H.; Lam, K.M. Physical Modeling of Flow Field inside Urban Street Canyons. J. Appl. Meteorol. Climatol. 2008, 47, 2058–2067. [Google Scholar] [CrossRef]
  31. Pavageau, M.; Schatzmann, M. Wind tunnel measurements of concentration fluctuations in an urban street canyon. Atmos. Environ. 1999, 33, 3961–3971. [Google Scholar] [CrossRef]
  32. Meroney, R.N.; Pavageau, M.; Rafailidis, S.; Schatzmann, M. Study of line source characteristics for 2-D physical modelling of pollutant dispersion in street canyons. J. Wind Eng. Ind. Aerodyn. 1996, 62, 37–56. [Google Scholar] [CrossRef]
  33. Pavageau, M. Concentration Fluctuations in Urban Street Canyons–Groundwork for Future Studies; Meteorological Institute of the University of Hamburg Technical Report; Meteorological Institute, University of Hamburg: Hamburg, Germany, 1996. [Google Scholar]
  34. Pielke, R.A.; Cotton, W.R.; Walko, R.L.; Tremback, C.J.; Lyons, W.A.; Grasso, L.D.; Nicholls, M.E.; Moran, M.D.; Wesley, D.A.; Lee, T.J.; et al. A comprehensive meteorological modeling system—RAMS. Meteorol. Atmos. Phys. 1992, 49, 69–91. [Google Scholar] [CrossRef]
  35. Cai, X.-M. Effects of Wall Heating on Flow Characteristics in a Street Canyon. Bound.-Layer Meteorol. 2012, 142, 443–467. [Google Scholar] [CrossRef]
  36. Cai, X.M. Dispersion of a passive plume in an idealised urban convective boundary layer: A large-eddy simulation. Atmos. Environ. 2000, 34, 61–72. [Google Scholar] [CrossRef]
  37. Cui, Z.; Cai, X.; Baker, C. Large-eddy simulation of turbulent flow in a street canyon. Q. J. R. Meteorol. Soc. 2004, 130, 1373–1394. [Google Scholar] [CrossRef] [Green Version]
  38. Uehara, K.; Murakami, S.; Oikawa, S.; Wakamatsu, S. Wind tunnel experiments on how thermal stratification affects flow in and above urban street canyons. Atmos. Environ. 2000, 34, 1553–1562. [Google Scholar] [CrossRef]
  39. Barlow, J.; Harman, I.; Belcher, S. Scalar fluxes from urban street canyons. Part I: Laboratory simulation. Bound.-Layer Meteorol. 2004, 113, 369–385. [Google Scholar] [CrossRef]
  40. Cai, X. Effects of differential wall heating in street canyons on dispersion and ventilation characteristics of a passive scalar. Atmos. Environ. 2012, 51, 268–277. [Google Scholar] [CrossRef]
  41. Willis, G.E.; Deardorff, J.W. A laboratory model of diffusion into the convective planetary boundary layer. Q. J. R. Meteorol. Soc. 1976, 102, 427–445. [Google Scholar] [CrossRef]
  42. Willis, G.E.; Deardorff, J.W. A laboratory study of dispersion from an elevated source within a modeled convective planetary boundary layer. Atmos. Environ. 1978, 12, 1305–1311. [Google Scholar] [CrossRef]
  43. Bright, V.B.; Bloss, W.J.; Cai, X. Urban street canyons: Coupling dynamics, chemistry and within-canyon chemical processing of emissions. Atmos. Environ. 2013, 68, 127–142. [Google Scholar] [CrossRef]
  44. Yoshizawa, A. Statistical theory for compressible turbulent shear flows, with the application to subgrid modeling. Phys. Fluids 1986, 29, 2152–2164. [Google Scholar] [CrossRef]
  45. Schlichting, H.; Gersten, K. Bound.-Layer Theory; Springer: Berlin/Heidelberg, Germany, 2000. [Google Scholar]
  46. Zhong, J.; Cai, X.-M.; Bloss, W.J. Large eddy simulation of reactive pollutants in a deep urban street canyon: Coupling dynamics with O3-NOx-VOC chemistry. Environ. Pollut. 2017, 224, 171–184. [Google Scholar] [CrossRef]
  47. Kikumoto, H.; Ooka, R. Large-eddy simulation of pollutant dispersion in a cavity at fine grid resolutions. Build. Environ. 2018, 127, 127–137. [Google Scholar] [CrossRef]
  48. Weller, H. OpenFOAM: The Open Source CFD Toolbox User Guide; The OpenFOAM Foundation Ltd.: London, UK, 2010. [Google Scholar]
  49. Blacker, T. Automated Conformal Hexahedral Meshing Constraints, Challenges and Opportunities. Eng. Comput. 2001, 17, 201–210. [Google Scholar] [CrossRef]
  50. Juretić, F.; Gosman, A.D. Error Analysis of the Finite-Volume Method with Respect to Mesh Type. Numer. Heat Transf. Part B 2010, 57, 414–439. [Google Scholar] [CrossRef]
  51. Hefny, M.M.; Ooka, R. CFD analysis of pollutant dispersion around buildings: Effect of cell geometry. Build. Environ. 2009, 44, 1699–1706. [Google Scholar] [CrossRef]
  52. Lesieur, M.; Métais, O.; Comte, P. Large-Eddy Simulations of Turbulence; Cambridge University Press: Cambridge, UK, 2005. [Google Scholar] [CrossRef]
  53. Leonard, A. Energy Cascade in Large-Eddy Simulations of Turbulent Fluid Flows. In Advances in Geophysics; Frenkiel, F.N., Munn, R.E., Eds.; Elsevier: Amsterdam, The Netherlands, 1975; Volume 18, pp. 237–248. [Google Scholar]
  54. Issa, R.I. Solution of the implicitly discretised fluid flow equations by operator-splitting. J. Comput. Phys. 1986, 62, 40–65. [Google Scholar] [CrossRef]
  55. Franke, J.; Baklanov, A. Best Practice Guideline for the CFD Simulation of Flows in the Urban Environment: COST Action 732 Quality Assurance and Improvement of Microscale Meteorological Models; Meteorological Inst.: Hamburg, Germany, 2007. [Google Scholar]
  56. Lien, F.S.; Leschziner, M.A. Upstream monotonic interpolation for scalar transport with application to complex turbulent flows. Int. J. Numer. Methods Fluids 1994, 19, 527–548. [Google Scholar] [CrossRef]
  57. Tominaga, Y.; Stathopoulos, T. Numerical simulation of dispersion around an isolated cubic building: Model evaluation of RANS and LES. Build. Environ. 2010, 45, 2231–2239. [Google Scholar] [CrossRef]
  58. Assael, M.J.; Kakosimos, K.E. Fires, Explosions, and Toxic Gas Dispersions: Effects Calculation and Risk Analysis; CRC Press: Boca Raton, FL, USA, 2010. [Google Scholar]
  59. van Driest, E.R. On Turbulent Flow Near a Wall. J. Aeronaut. Sci. 1956, 23, 1007–1011. [Google Scholar] [CrossRef] [Green Version]
  60. Ducros, F.; Nicoud, F.; Poinsot, T. Wall-adapting Local Eddy-Viscosity Models for Simulations in Complex Geometries; Oxford University Computing Laboratory: Oxford, UK, 1998; pp. 293–299. [Google Scholar]
  61. Nicoud, F.; Ducros, F. Subgrid-Scale Stress Modelling Based on the Square of the Velocity Gradient Tensor. Flow Turbul. Combust. 1999, 62, 183–200. [Google Scholar] [CrossRef]
  62. Nicoud, F. Unsteady flows modeling and computation. Lect. Ser.-Von Karman Inst. Fluid Dyn. 2007, 9, 3. [Google Scholar]
  63. Yoshizawa, A.; Horiuti, K. A statistically-derived subgrid-scale kinetic energy model for the large-eddy simulation of turbulent flows. J. Phys. Soc. Jpn. 1985, 54, 2834–2839. [Google Scholar] [CrossRef]
  64. Yoshizawa, A. Subgrid-scale modeling with a variable length scale. Phys. Fluids A 1989, 1, 1293–1295. [Google Scholar] [CrossRef]
  65. Kim, W.-W.; Menon, S. A new dynamic one-equation subgrid-scale model for large eddy simulations. In Proceedings of the 33rd Aerospace Sciences Meeting and Exhibit, Reno, NV, USA, 9–12 January 1995; p. 356. [Google Scholar]
  66. Lilly, D.K. A proposed modification of the Germano subgrid-scale closure method. Phys. Fluids A 1992, 4, 633–635. [Google Scholar] [CrossRef]
  67. Kim, W.-W.; Menon, S. Application of the localized dynamic subgrid-scale model to turbulent wall-bounded flows. In 35th Aerospace Sciences Meeting and Exhibit; American Institute of Aeronautics and Astronautics: Reston, VA, USA, 1997. [Google Scholar] [CrossRef]
  68. Georgiadis, N.J.; Rizzetta, D.P.; Fureby, C. Large-Eddy Simulation: Current Capabilities, Recommended Practices, and Future Research. AIAA J. 2010, 48, 1772–1784. [Google Scholar] [CrossRef] [Green Version]
  69. Li, X.-X.; Britter, R.; Norford, L.K. Effect of stable stratification on dispersion within urban street canyons: A large-eddy simulation. Atmos. Environ. 2016, 144, 47–59. [Google Scholar] [CrossRef]
  70. A Thorough Description of How Wall Functions Are Implemented in OpenFOAM. Available online: http://www.tfd.chalmers.se/~hani/kurser/OS_CFD_2016/FangqingLiu/openfoamFinal.pdf (accessed on 22 November 2018).
  71. Launder, B.E.; Spalding, D.B. The numerical computation of turbulent flows. Comput. Methods Appl. Mech. Eng. 1974, 3, 269–289. [Google Scholar] [CrossRef]
  72. Boppana, V.B.L.; Xie, Z.T.; Castro, I.P. Large-Eddy Simulation of Heat Transfer from a Single Cube Mounted on a Very Rough Wall. Bound.-Layer Meteorol. 2013, 147, 347–368. [Google Scholar] [CrossRef]
  73. Li, X. Large-Eddy Simulation of Wind Flow and Air Pollutant Transport Inside Urban Street Canyons of Different Aspect Ratios. Ph.D. Thesis, The University of Hong Kong, Hong Kong, China, 2008. [Google Scholar]
  74. Hoydysh, W.G.; Dabberdt, W.F. Kinematics and dispersion characteristics of flows in asymmetric street canyons. Atmos. Environ. 1988, 22, 2677–2689. [Google Scholar] [CrossRef]
  75. Schatzmann, M. COST 732 Model Evaluation Case Studies: Approach and Results; University of Hamburg: Hamburg, Germany, 2010. [Google Scholar]
  76. Hanna, S.R. Air Quality Model Evaluation and Uncertainty. JAPCA 1988, 38, 406–412. [Google Scholar] [CrossRef] [PubMed] [Green Version]
  77. Chang, J.C.; Hanna, S.R. Technical Descriptions and User’s Guide for the BOOT Statistical Model Evaluation Software Package, Version 2.0; George Mason University and Harvard School of Public Health: Fairfax, VA, USA, 2005. [Google Scholar]
  78. Yassin, M.F. Numerical modeling on air quality in an urban environment with changes of the aspect ratio and wind direction. Environ. Sci. Pollut. Res. 2013, 20, 3975–3988. [Google Scholar] [CrossRef]
  79. Gousseau, P.; Blocken, B.; van Heijst, G.J.F. Quality assessment of Large-Eddy Simulation of wind flow around a high-rise building: Validation and solution verification. Comput. Fluids 2013, 79, 120–133. [Google Scholar] [CrossRef]
  80. Li, X.-X.; Britter, R.; Norford, L.; Koh, T.-Y.; Entekhabi, D. Flow and Pollutant Transport in Urban Street Canyons of Different Aspect Ratios with Ground Heating: Large-Eddy Simulation. Bound.-Layer Meteorol. 2012, 142, 289–304. [Google Scholar] [CrossRef]
  81. Cai, X.M.; Barlow, J.F.; Belcher, S.E. Dispersion and transfer of passive scalars in and above street canyons—Large-eddy simulations. Atmos. Environ. 2008, 42, 5885–5895. [Google Scholar] [CrossRef]
  82. Roache, P.J. Quantification of Uncertainty in Computational Fluid Dynamics. Annu. Rev. Fluid Mech. 1997, 29, 123–160. [Google Scholar] [CrossRef]
  83. Celik, I.B.; Cehreli, Z.N.; Yavuz, I. Index of Resolution Quality for Large Eddy Simulations. J. Fluids Eng. 2005, 127, 949–958. [Google Scholar] [CrossRef]
  84. Gromke, C.; Blocken, B. Influence of avenue-trees on air quality at the urban neighborhood scale. Part I: Quality assurance studies and turbulent Schmidt number analysis for RANS CFD simulations. Environ. Pollut. 2015, 196, 214–223. [Google Scholar] [CrossRef] [PubMed] [Green Version]
  85. van Hooff, T.; Blocken, B.; Tominaga, Y. On the accuracy of CFD simulations of cross-ventilation flows for a generic isolated building: Comparison of RANS, LES and experiments. Build. Environ. 2017, 114, 148–165. [Google Scholar] [CrossRef]
  86. Pope, S.B. Turbulent Flows; Cambridge University Press: Cambridge, UK, 2000. [Google Scholar]
  87. Kornhaas, M.; Sternel, D.C.; Schäfer, M. Influence of Time Step Size and Convergence Criteria on Large Eddy Simulations with Implicit Time Discretization. In Quality and Reliability of Large-Eddy Simulations; Meyers, J., Geurts, B.J., Sagaut, P., Eds.; Springer: Dordrecht, The Netherlands, 2008; pp. 119–130. [Google Scholar]
  88. Ai, Z.T.; Mak, C.M. Large eddy simulation of wind-induced interunit dispersion around multistory buildings. Indoor Air 2016, 26, 259–273. [Google Scholar] [CrossRef] [PubMed]
  89. Snyder, W.H. Similarity criteria for the application of fluid models to the study of air pollution meteorology. Bound.-Layer Meteorol. 1972, 3, 113–134. [Google Scholar] [CrossRef]
  90. Zhang, Y.Q.; Arya, S.P.; Snyder, W.H. A comparison of numerical and physical modeling of stable atmospheric flow and dispersion around a cubical building. Atmos. Environ. 1996, 30, 1327–1345. [Google Scholar] [CrossRef]
  91. Gromke, C.; Ruck, B. Pollutant Concentrations in Street Canyons of Different Aspect Ratio with Avenues of Trees for Various Wind Directions. Bound.-Layer Meteorol. 2012, 144, 41–64. [Google Scholar] [CrossRef]
  92. Di Bernardino, A.; Monti, P.; Leuzzi, G.; Querzoli, G. Water-Channel Study of Flow and Turbulence Past a Two-Dimensional Array of Obstacles. Bound.-Layer Meteorol. 2015, 155, 73–85. [Google Scholar] [CrossRef] [Green Version]
  93. Cui, P.-Y.; Li, Z.; Tao, W.-Q. Investigation of Re-independence of turbulent flow and pollutant dispersion in urban street canyon using numerical wind tunnel (NWT) models. Int. J. Heat Mass Transf. 2014, 79, 176–188. [Google Scholar] [CrossRef]
  94. Baker, J.; Walker, H.L.; Cai, X. A study of the dispersion and transport of reactive pollutants in and above street canyons—A large eddy simulation. Atmos. Environ. 2004, 38, 6883–6892. [Google Scholar] [CrossRef]
  95. Wang, Y.; Huang, Z.; Liu, Y.; Yu, Q.; Ma, W. Back-Calculation of Traffic-Related PM10 Emission Factors Based on Roadside Concentration Measurements. Atmosphere 2017, 8, 99. [Google Scholar] [CrossRef]
  96. Schatzmann, M.; Leitl, B. Issues with validation of urban flow and dispersion CFD models. J. Wind Eng. Ind. Aerodyn. 2011, 99, 169–186. [Google Scholar] [CrossRef]
  97. Vasaturo, R.; Kalkman, I.; Blocken, B.; van Wesemael, P.J.V. Large eddy simulation of the neutral atmospheric boundary layer: Performance evaluation of three inflow methods for terrains with different roughness. J. Wind Eng. Ind. Aerodyn. 2018, 173, 241–261. [Google Scholar] [CrossRef]
  98. Xie, Z.; Castro, I.P. LES and RANS for Turbulent Flow over Arrays of Wall-Mounted Obstacles. Flow Turbul. Combust. 2006, 76, 291. [Google Scholar] [CrossRef]
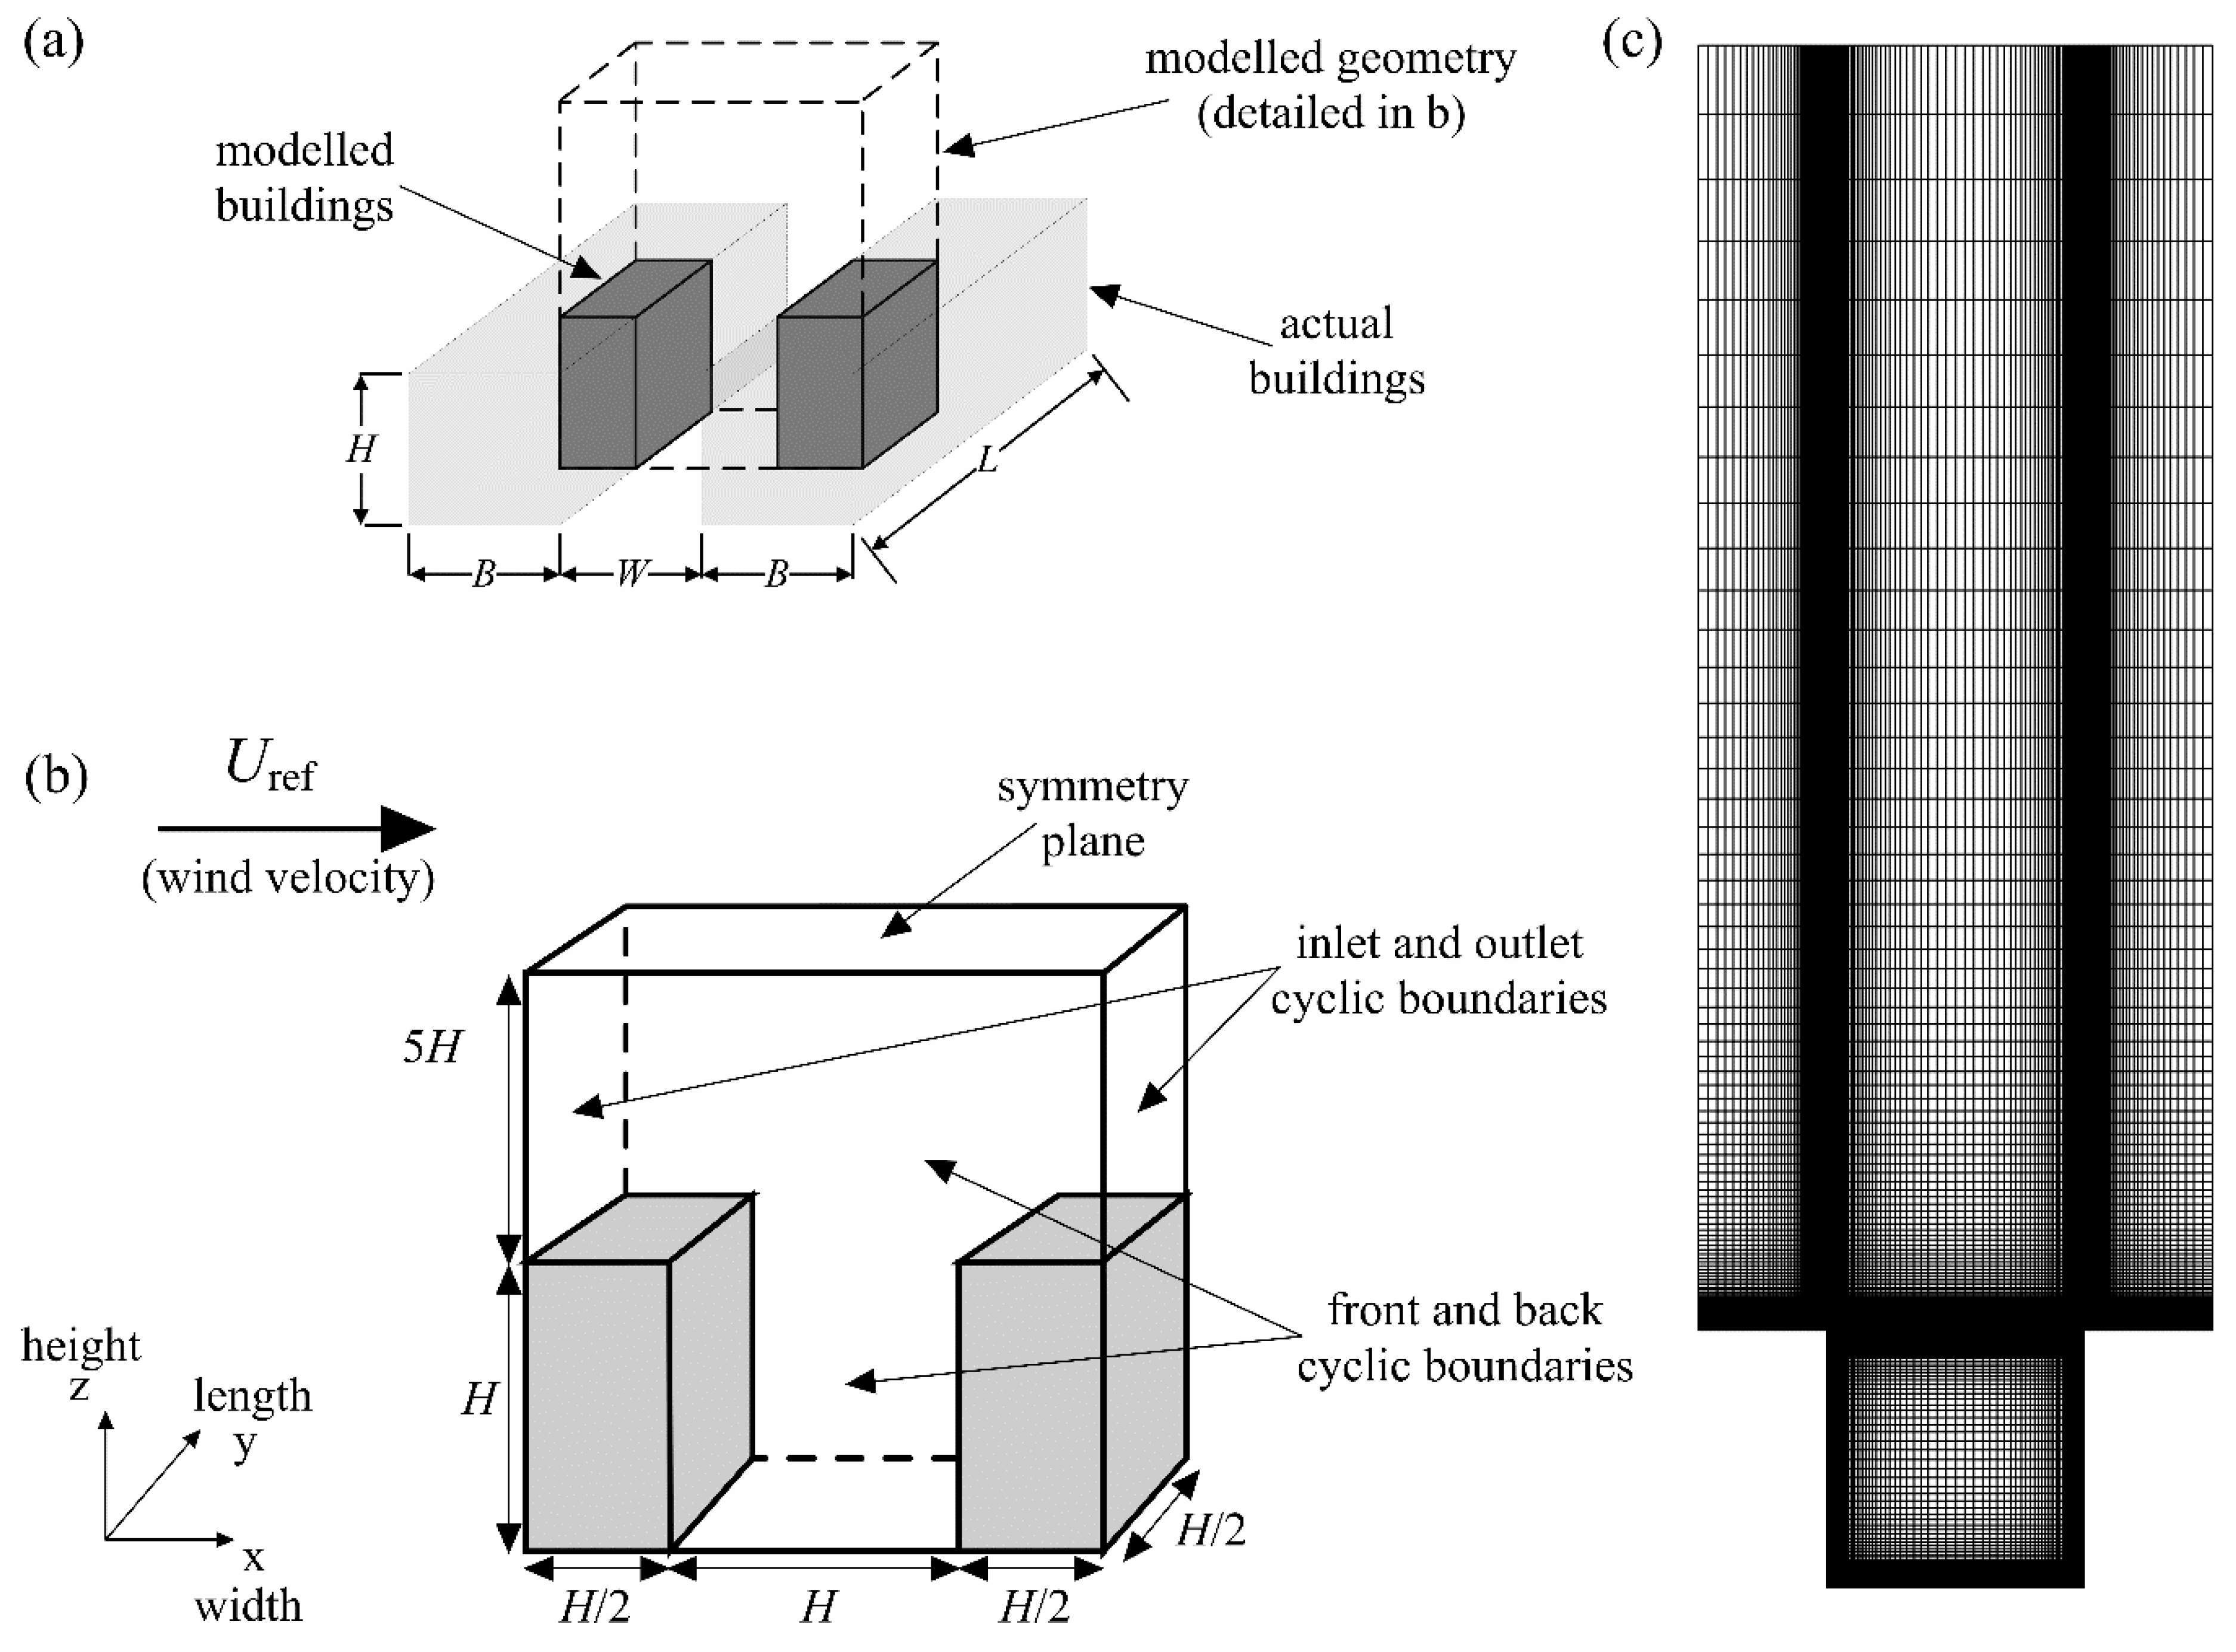
Figure 1. The quasi-2d street canyon geometry: (a) overview of the physical geometry and actual buildings (light shaded block), (b) detail of the modelled geometry and boundary conditions (discussed later); and (c) xz cross-section of a computational grid example.
Atmosphere 10 00017 g001
Figure 2. Vertical dimensionless concentration profiles for the upper atmosphere height and grid resolution: (a) the downwind and (b) the upwind wall for the unity street canyon.
Atmosphere 10 00017 g002
Figure 3. The calculated GCIfine for the medium to fine grid refinement with the corresponding dimensionless Ux and Uz at x/W = 0.25, x/W = 0.50, and x/W = 0.75.
Atmosphere 10 00017 g003
Figure 4. Calculated GCIfine for the medium to fine grid refinement and corresponding averaged and dimensionless concentration C/Cmax at (a) the downwind and (b) the upwind walls.
Atmosphere 10 00017 g004
Figure 5. The LES_IQv index for three selected grids: (a) coarse, (b) medium, and (c) fine.
Atmosphere 10 00017 g005
Figure 6. Comparison of the turbulence energy spectra in the frequency domain of velocity: (a) Ux and (b) Uz at x/W = 0.1 and z/H = 0.9 on the upwind side of the street canyon. The solid red time series represent the Δt = 6 × 10⁻⁴ s, blue the Δt = 8 × 10⁻⁴ s and green the Δt = 9 × 10⁻⁴ s.
Atmosphere 10 00017 g006
Figure 7. Normalized average velocity and concentration fields for the ideal street canyon (AR = 1): (a) and (d) at 0.15 m⋅s−1, (b) and (e) at 1.5 m⋅s−1, and (c) and (f) at 5 m⋅s−1.
Atmosphere 10 00017 g007
Figure 8. Average dimensionless concentration C/Cmax after 900 s for three source heights: (a) 0.1 m, (b) 0.5 m, and (c) 1 m.
Atmosphere 10 00017 g008
Figure 9. Normalized averages for the velocity components Ux and Uz for a unity street canyon at: (a) and (d) x/W = 0.25; (b) and (e) x/W = 0.50; and (c) and (f) x/W = 0.75.
Atmosphere 10 00017 g009
Figure 10. Normalized fluctuations for the velocity components Ux and Uz for a unity street canyon at: (a) and (d) x/W = 0.25; (b) and (e) x/W = 0.50; and (c) and (f) x/W = 0.75.
Atmosphere 10 00017 g010
Figure 11. Turbulence energy spectra of the (a) Ux and (b) Uz velocity components, for three heights in the middle of the domain x/W = 0.5, at z/H = 0.1, 0.5, and 1.0.
Atmosphere 10 00017 g011
Table 1. Combinations of the employed SGS models and wall functions.
CombinationAbbreviation
standard Smagorinsky model and van Driest dumping functionS-VD
standard Smagorinsky model and Spalding wall functionS-SP
standard Smagorinsky model and nutkWallFunctionS-N
WALE modelWALE
k-equation model and van Driest dumping functionKE-VD
k-equation model and Spalding wall functionKE-SP
k-equation model and nutkWallFunctionKE-N
localized dynamic k-equation modelDKE
Table 2. Calculated and ideal values of the employed validation metrics and experimental datasets (200 points for the velocity components and 24 for the concentration).
MetricQuantityResultIdeal
FAC2 U/Uref and W/Uref0.771
U/Uref0.851
W/Uref0.681
NMSE U/Uref and W/Uref0.250
U/Uref0.190
W/Uref0.300
FAC2upwind wallC/Cmax0.821
C*0.861
downwind wallC/Cmax1.001
C*0.901
NMSEupwind wallC/Cmax0.050
C*0.100
downwind wallC/Cmax0.040
C*0.260
FBupwind wallC/Cmax0.060
C*0.190
downwind wallC/Cmax0.150
C*0.100