miRmapper: A Tool for Interpretation of miRNA–mRNA Interaction Networks

 , and
, and 
Abstract
1. Introduction
Comparison with Available Tools
2. Materials and Methods
3. Results
4. Discussion
5. Conclusions
Supplementary Materials
Author Contributions
Funding
Conflicts of Interest
References
- Chen, K.; Rajewsky, N. The evolution of gene regulation by transcription factors and microRNAs. Nat. Rev. Genet. 2007, 8, 93–103. [Google Scholar] [CrossRef] [PubMed]
- Voskarides, K. Plasticity vs mutation. The role of microRNAs in human adaptation. Mech. Ageing Dev. 2017, 163, 36–39. [Google Scholar] [CrossRef] [PubMed]
- Osada, H.; Takahashi, T. MicroRNAs in biological processes and carcinogenesis. Carcinogenesis 2007, 28, 2–12. [Google Scholar] [CrossRef] [PubMed]
- Carthew, R.W.; Sontheimer, E.J. Origins and mechanisms of miRNAs and siRNAs. Cell 2009, 136, 642–655. [Google Scholar] [CrossRef] [PubMed]
- Bagga, S.; Bracht, J.; Hunter, S.; Massirer, K.; Holtz, J.; Eachus, R.; Pasquinelli, A.E. Regulation by let-7 and lin-4 miRNAs results in target mRNA degradation. Cell 2005, 122, 553–563. [Google Scholar] [CrossRef] [PubMed]
- Eulalio, A.; Rehwinkel, J.; Stricker, M.; Huntzinger, E.; Yang, S.-F.; Doerks, T.; Dorner, S.; Bork, P.; Boutros, M.; Izaurralde, E. Target-specific requirements for enhancers of decapping in miRNA-mediated gene silencing. Genes Dev. 2007, 21, 2558–2570. [Google Scholar] [CrossRef] [PubMed]
- Giraldez, A.J.; Mishima, Y.; Rihel, J.; Grocock, R.J.; Van Dongen, S.; Inoue, K.; Enright, A.J.; Schier, A.F. Zebrafish MiR-430 promotes deadenylation and clearance of maternal mRNAs. Science 2006, 312, 75–79. [Google Scholar] [CrossRef] [PubMed]
- Wu, L.; Belasco, J.G. Micro-RNA regulation of the mammalian lin-28 gene during neuronal differentiation of embryonal carcinoma cells. Mol. Cell. Biol. 2005, 25, 9198–9208. [Google Scholar] [CrossRef] [PubMed]
- Brodersen, P.; Sakvarelidze-Achard, L.; Bruun-Rasmussen, M.; Dunoyer, P.; Yamamoto, Y.Y.; Sieburth, L.; Voinnet, O. Widespread translational inhibition by plant miRNAs and siRNAs. Science 2008, 320, 1185–1190. [Google Scholar] [CrossRef] [PubMed]
- Eulalio, A.; Huntzinger, E.; Izaurralde, E. Getting to the root of miRNA-mediated gene silencing. Cell 2008, 132, 9–14. [Google Scholar] [CrossRef] [PubMed]
- Filipowicz, W.; Bhattacharyya, S.N.; Sonenberg, N. Mechanisms of post-transcriptional regulation by microRNAs: Are the answers in sight? Nat. Rev. Genet. 2008, 9, 102. [Google Scholar] [CrossRef] [PubMed]
- Wu, L.; Belasco, J.G. Let me count the ways: Mechanisms of gene regulation by miRNAs and siRNAs. Mol. Cell 2008, 29, 1–7. [Google Scholar] [CrossRef] [PubMed]
- Guo, H.; Ingolia, N.T.; Weissman, J.S.; Bartel, D.P. Mammalian microRNAs predominantly act to decrease target mRNA levels. Nature 2010, 466, 835. [Google Scholar] [CrossRef] [PubMed]
- Huntzinger, E.; Izaurralde, E. Gene silencing by microRNAs: Contributions of translational repression and mRNA decay. Nat. Rev. Genet. 2011, 12, 99. [Google Scholar] [CrossRef] [PubMed]
- Aleman, L.M.; Doench, J.; Sharp, P.A. Comparison of siRNA-induced off-target RNA and protein effects. RNA 2007, 13, 385–395. [Google Scholar] [CrossRef] [PubMed]
- Newman, M.E.J. Networks: An introduction; Oxford University Press: Oxford, UK; New York, NY, USA, 2010; p. 772. [Google Scholar]
- Borgatti, S.P.; Mehra, A.; Brass, D.J.; Labianca, G. Network analysis in the social sciences. Science 2009, 323, 892–895. [Google Scholar] [CrossRef] [PubMed]
- Brass, D.J. Being in the right place: A structural analysis of individual influence in an organization. Adm. Sci. Q. 1984, 29, 518–539. [Google Scholar] [CrossRef]
- González-Pereira, B.; Guerrero-Bote, V.P.; Moya-Anegón, F. A new approach to the metric of journals’ scientific prestige: The SJR indicator. J. Inf. 2010, 4, 379–391. [Google Scholar] [CrossRef]
- Yan, E.; Ding, Y. Applying centrality measures to impact analysis: A coauthorship network analysis. J. Am. Soc. Inf. Sci. Technol. 2009, 60, 2107–2118. [Google Scholar] [CrossRef]
- Hsu, C.W.; Juan, H.F.; Huang, H.C. Characterization of microRNA-regulated protein-protein interaction network. Proteomics 2008, 8, 1975–1979. [Google Scholar] [CrossRef] [PubMed]
- Ragusa, M.; Statello, L.; Maugeri, M.; Majorana, A.; Barbagallo, D.; Salito, L.; Sammito, M.; Santonocito, M.; Angelica, R.; Cavallaro, A.; et al. Specific alterations of the microRNA transcriptome and global network structure in colorectal cancer after treatment with MAPK/ERK inhibitors. J. Mol. Med. 2012, 90, 1421–1438. [Google Scholar] [CrossRef] [PubMed]
- Bisognin, A.; Sales, G.; Coppe, A.; Bortoluzzi, S.; Romualdi, C. Magia2: From miRNA and genes expression data integrative analysis to microRNA–transcription factor mixed regulatory circuits (2012 update). Nucleic Acids Res. 2012, 40, W13–W21. [Google Scholar] [CrossRef] [PubMed]
- Chen, L. A Social Matching System: Using Implicit and Explicit Information for Personalized Recommendation in Online Dating Service. Ph.D. Thesis, Queensland University of Technology, Brisbane, Australia, 2013. [Google Scholar]
- Lorrain, F.; White, H.C. Structural equivalence of individuals in social networks. J. Math. Sociol. 1971, 1, 49–80. [Google Scholar] [CrossRef]
- Beckman, J.D.; Chen, C.; Nguyen, J.; Thayanithy, V.; Subramanian, S.; Steer, C.J.; Vercellotti, G.M. Regulation of heme oxygenase-1 protein expression by miR-377 in combination with miR-217. J. Biol. Chem. 2011, 286, 3194–3202. [Google Scholar] [CrossRef] [PubMed]
- Wu, S.; Huang, S.; Ding, J.; Zhao, Y.; Liang, L.; Liu, T.; Zhan, R.; He, X. Multiple microRNAs modulate p21Cip1/Waf1 expression by directly targeting its 3′ untranslated region. Oncogene 2010, 29, 2302. [Google Scholar] [CrossRef] [PubMed]
- Nam, S.; Li, M.; Choi, K.; Balch, C.; Kim, S.; Nephew, K.P. MicroRNA and mRNA integrated analysis (MMIA): A web tool for examining biological functions of microRNA expression. Nucleic Acids Res. 2009, 37, W356–W362. [Google Scholar] [CrossRef] [PubMed]
- Friedman, Y.; Naamati, G.; Linial, M. MiRror: A combinatorial analysis web tool for ensembles of microRNAs and their targets. Bioinformatics 2010, 26, 1920–1921. [Google Scholar] [CrossRef] [PubMed]
- Alexiou, P.; Maragkakis, M.; Papadopoulos, G.L.; Simmosis, V.A.; Zhang, L.; Hatzigeorgiou, A.G. The DIANA-mirExTra web server: From gene expression data to microRNA function. PLoS ONE 2010, 5, e9171. [Google Scholar] [CrossRef] [PubMed]
- Nam, S.; Kim, B.; Shin, S.; Lee, S. MiRGator: An integrated system for functional annotation of microRNAs. Nucleic Acids Res. 2008, 36, D159–D164. [Google Scholar] [CrossRef] [PubMed]
- Sales, G.; Coppe, A.; Bisognin, A.; Biasiolo, M.; Bortoluzzi, S.; Romualdi, C. MAGIA, a web-based tool for miRNA and genes integrated analysis. Nucleic Acids Res. 2010, 38, W352–W359. [Google Scholar] [CrossRef] [PubMed]
- Doncheva, N.T.; Assenov, Y.; Domingues, F.S.; Albrecht, M. Topological analysis and interactive visualization of biological networks and protein structures. Nat. Protoc. 2012, 7, 670–685. [Google Scholar] [CrossRef] [PubMed]
- Cava, C.; Colaprico, A.; Bertoli, G.; Graudenzi, A.; Silva, T.C.; Olsen, C.; Noushmehr, H.; Bontempi, G.; Mauri, G.; Castiglioni, I. SpidermiR: An R/bioconductor package for integrative analysis with miRNA data. Int. J. Mol. Sci. 2017, 18, 274. [Google Scholar] [CrossRef] [PubMed]
- Maute, R.L.; Dalla-Favera, R.; Basso, K. RNAs with multiple personalities. Wiley Interdiscip. Rev. RNA 2014, 5, 1–13. [Google Scholar] [CrossRef] [PubMed]
- Erhard, F.; Haas, J.; Lieber, D.; Malterer, G.; Jaskiewicz, L.; Zavolan, M.; Dolken, L.; Zimmer, R. Widespread context dependency of microRNA-mediated regulation. Genome Res. 2014, 24, 906–919. [Google Scholar] [CrossRef] [PubMed]
- Winterbach, W.; Van Mieghem, P.; Reinders, M.; Wang, H.; de Ridder, D. Topology of molecular interaction networks. BMC Syst. Biol. 2013, 7, 90. [Google Scholar] [CrossRef] [PubMed]
- Bracken, C.P.; Scott, H.S.; Goodall, G.J. A network-biology perspective of microRNA function and dysfunction in cancer. Nat. Rev. Genet. 2016, 17, 719–732. [Google Scholar] [CrossRef] [PubMed]
- Wang, E. Cancer Systems Biology; CRC Press: Boca Raton, FL, USA, 2010. [Google Scholar]
- Davis-Turak, J.; Courtney, S.M.; Hazard, E.S.; Glen, W.B., Jr.; da Silveira, W.A.; Wesselman, T.; Harbin, L.P.; Wolf, B.J.; Chung, D.; Hardiman, G. Genomics pipelines and data integration: Challenges and opportunities in the research setting. Expert Rev. Mol. Diagn. 2017, 17, 225–237. [Google Scholar] [CrossRef] [PubMed]
- Robinson, M.D.; McCarthy, D.J.; Smyth, G.K. edgeR: A bioconductor package for differential expression analysis of digital gene expression data. Bioinformatics 2010, 26, 139–140. [Google Scholar] [CrossRef] [PubMed]
- Sun, Z.; Evans, J.; Bhagwate, A.; Middha, S.; Bockol, M.; Yan, H.; Kocher, J.P. CAP-miRSeq: A comprehensive analysis pipeline for microRNA sequencing data. BMC Genomics 2014, 15, 423. [Google Scholar] [CrossRef] [PubMed]
- Shi, J.; Dong, M.; Li, L.; Liu, L.; Luz-Madrigal, A.; Tsonis, P.A.; Del Rio-Tsonis, K.; Liang, C. MirPRo-a novel standalone program for differential expression and variation analysis of miRNAs. Sci. Rep. 2015, 5, 14617. [Google Scholar] [CrossRef] [PubMed]
- Andres-Leon, E.; Nunez-Torres, R.; Rojas, A.M. MiARma-Seq: A comprehensive tool for miRNA, mRNA and circRNA analysis. Sci. Rep. 2016, 6, 25749. [Google Scholar] [CrossRef] [PubMed]
- Betel, D.; Wilson, M.; Gabow, A.; Marks, D.S.; Sander, C. The microRNA. Org resource: Targets and expression. Nucleic Acids Res. 2008, 36, D149–D153. [Google Scholar] [CrossRef] [PubMed]
- Agarwal, V.; Bell, G.W.; Nam, J.W.; Bartel, D.P. Predicting effective microRNA target sites in mammalian mRNAs. Elife 2015, 4, e05005. [Google Scholar] [CrossRef] [PubMed]
- Ru, Y.; Kechris, K.J.; Tabakoff, B.; Hoffman, P.; Radcliffe, R.A.; Bowler, R.; Mahaffey, S.; Rossi, S.; Calin, G.A.; Bemis, L.; et al. The multimiR R package and database: Integration of microRNA-target interactions along with their disease and drug associations. Nucleic Acids Res. 2014, 42, e133. [Google Scholar] [CrossRef] [PubMed]
- Leskovec, J.; Rajaraman, A.; Ullman, J.D. Mining of Massive Datasets; Cambridge University Press: Cambridge, UK, 2014. [Google Scholar]
- Fuxman Bass, J.I.; Diallo, A.; Nelson, J.; Soto, J.M.; Myers, C.L.; Walhout, A.J. Using networks to measure similarity between genes: Association index selection. Nat. Methods 2013, 10, 1169–1176. [Google Scholar] [CrossRef] [PubMed]
- Podani, J. Introduction to the Exploration of Multivariate Biological Data; Backhuys Publishers: Kerkwerv, NL, USA, 2000. [Google Scholar]
- Ritchie, M.E.; Phipson, B.; Wu, D.; Hu, Y.; Law, C.W.; Shi, W.; Smyth, G.K. Limma powers differential expression analyses for RNA-sequencing and microarray studies. Nucleic Acids Res. 2015, 43, e47. [Google Scholar] [CrossRef] [PubMed]
- Peter, M.E. Targeting of mRNAs by multiple miRNAs: The next step. Oncogene 2010, 29, 2161–2164. [Google Scholar] [CrossRef] [PubMed]
- Kozomara, A.; Griffiths-Jones, S. Mirbase: Annotating high confidence microRNAs using deep sequencing data. Nucleic Acids Res. 2014, 42, D68–D73. [Google Scholar] [CrossRef] [PubMed]
- Jiang, R.; Zhang, C.; Liu, G.; Gu, R.; Wu, H. MicroRNA-107 promotes proliferation, migration, and invasion of osteosarcoma cells by targeting tropomyosin 1. Oncol. Res. 2017, 25, 1409–1419. [Google Scholar] [CrossRef] [PubMed]
- Su, S.G.; Yang, M.; Zhang, M.F.; Peng, Q.Z.; Li, M.Y.; Liu, L.P.; Bao, S.Y. MiR-107-mediated decrease of HMGCS2 indicates poor outcomes and promotes cell migration in hepatocellular carcinoma. Int. J. Biochem. Cell Biol. 2017, 91, 53–59. [Google Scholar] [CrossRef] [PubMed]
- Xiong, J.; Wang, D.; Wei, A.; Lu, H.; Tan, C.; Li, A.; Tang, J.; Wang, Y.; He, S.; Liu, X.; et al. Deregulated expression of miR-107 inhibits metastasis of PDAC through inhibition PI3K/Akt signaling via caveolin-1 and PTEN. Exp. Cell Res. 2017, 361, 316–323. [Google Scholar] [CrossRef] [PubMed]
- Xiang, W.; Wu, X.; Huang, C.; Wang, M.; Zhao, X.; Luo, G.; Li, Y.; Jiang, G.; Xiao, X.; Zeng, F. PTTG1 regulated by miR-146a-3p promotes bladder cancer migration, invasion, metastasis and growth. Oncotarget 2017, 8, 664–678. [Google Scholar] [CrossRef] [PubMed]
- Ferracin, M.; Veronese, A.; Negrini, M. Micromarkers: MiRNAs in cancer diagnosis and prognosis. Expert Rev. Mol. Diagn. 2010, 10, 297–308. [Google Scholar] [CrossRef] [PubMed]
- Chen, C.; Cao, F.; Bai, L.; Liu, Y.; Xie, J.; Wang, W.; Si, Q.; Yang, J.; Chang, A.; Liu, D.; et al. IKKβ enforces a LIN28B/TCF7L2 positive feedback loop that promotes cancer cell stemness and metastasis. Cancer Res. 2015, 75, 1725–1735. [Google Scholar] [CrossRef] [PubMed]
- Vijaya Kumar, A.; Salem Gassar, E.; Spillmann, D.; Stock, C.; Sen, Y.P.; Zhang, T.; Van Kuppevelt, T.H.; Hulsewig, C.; Koszlowski, E.O.; Pavao, M.S.; et al. HS3ST2 modulates breast cancer cell invasiveness via MAP kinase- and tcf4 (Tcf7l2)-dependent regulation of protease and cadherin expression. Int. J. Cancer 2014, 135, 2579–2592. [Google Scholar] [CrossRef] [PubMed]
- Kojima, T.; Shimazui, T.; Horie, R.; Hinotsu, S.; Oikawa, T.; Kawai, K.; Suzuki, H.; Meno, K.; Akaza, H.; Uchida, K. FOXO1 and TCF7L2 genes involved in metastasis and poor prognosis in clear cell renal cell carcinoma. Genes Chromosomes Cancer 2010, 49, 379–389. [Google Scholar] [PubMed]
- Tang, Y.; Simoneau, A.R.; Liao, W.X.; Yi, G.; Hope, C.; Liu, F.; Li, S.; Xie, J.; Holcombe, R.F.; Jurnak, F.A.; et al. WIF1, a Wnt pathway inhibitor, regulates SKP2 and c-myc expression leading to G1 arrest and growth inhibition of human invasive urinary bladder cancer cells. Mol. Cancer Ther. 2009, 8, 458–468. [Google Scholar] [CrossRef] [PubMed]
- Sengupta, D.; Bandyopadhyay, S. Participation of microRNAs in human interactome: Extraction of microRNA-microRNA regulations. Mol. Biosyst. 2011, 7, 1966–1973. [Google Scholar] [CrossRef] [PubMed]
- Giricz, O.; Reynolds, P.A.; Ramnauth, A.; Liu, C.; Wang, T.; Stead, L.; Childs, G.; Rohan, T.; Shapiro, N.; Fineberg, S.; et al. Hsa-miR-375 is differentially expressed during breast lobular neoplasia and promotes loss of mammary acinar polarity. J. Pathol. 2012, 226, 108–119. [Google Scholar] [CrossRef] [PubMed]
- Zehentmayr, F.; Hauser-Kronberger, C.; Zellinger, B.; Hlubek, F.; Schuster, C.; Bodenhofer, U.; Fastner, G.; Deutschmann, H.; Steininger, P.; Reitsamer, R.; et al. Hsa-miR-375 is a predictor of local control in early stage breast cancer. Clin. Epigenetics 2016, 8, 28. [Google Scholar] [CrossRef] [PubMed]
- Li, Y.; Li, W.; Zhang, J.G.; Li, H.Y.; Li, Y.M. Downregulation of tumor suppressor menin by miR-421 promotes proliferation and migration of neuroblastoma. Tumor Biol. 2014, 35, 10011–10017. [Google Scholar] [CrossRef] [PubMed]
- Zhou, S.; Wang, B.; Hu, J.; Zhou, Y.; Jiang, M.; Wu, M.; Qin, L.; Yang, X. MiR-421 is a diagnostic and prognostic marker in patients with osteosarcoma. Tumor Biol. 2016, 37, 9001–9007. [Google Scholar] [CrossRef] [PubMed]
- Yang, P.; Zhang, M.; Liu, X.; Pu, H. MicroRNA-421 promotes the proliferation and metastasis of gastric cancer cells by targeting claudin-11. Exp. Ther. Med. 2017, 14, 2625–2632. [Google Scholar] [CrossRef] [PubMed]
- Pan, Y.; Jiao, G.; Wang, C.; Yang, J.; Yang, W. MicroRNA-421 inhibits breast cancer metastasis by targeting metastasis associated 1. Biomed. Pharmacother. 2016, 83, 1398–1406. [Google Scholar] [CrossRef] [PubMed]
- Zhang, W.; Shi, S.; Jiang, J.; Li, X.; Lu, H.; Ren, F. LncRNA MEG3 inhibits cell epithelial-mesenchymal transition by sponging miR-421 targeting E-cadherin in breast cancer. Biomed. Pharmacother. 2017, 91, 312–319. [Google Scholar] [CrossRef] [PubMed]
- Kim, G.; An, H.J.; Lee, M.J.; Song, J.Y.; Jeong, J.Y.; Lee, J.H.; Jeong, H.C. Hsa-miR-1246 and hsa-miR-1290 are associated with stemness and invasiveness of non-small cell lung cancer. Lung Cancer 2016, 91, 15–22. [Google Scholar] [CrossRef] [PubMed]
- Li, M.; He, X.Y.; Zhang, Z.M.; Li, S.; Ren, L.H.; Cao, R.S.; Feng, Y.D.; Ji, Y.L.; Zhao, Y.; Shi, R.H. MicroRNA-1290 promotes esophageal squamous cell carcinoma cell proliferation and metastasis. World J. Gastroenterol. 2015, 21, 3245–3255. [Google Scholar] [CrossRef] [PubMed]
- Imaoka, H.; Toiyama, Y.; Fujikawa, H.; Hiro, J.; Saigusa, S.; Tanaka, K.; Inoue, Y.; Mohri, Y.; Mori, T.; Kato, T.; et al. Circulating microRNA-1290 as a novel diagnostic and prognostic biomarker in human colorectal cancer. Ann. Oncol. 2016, 27, 1879–1886. [Google Scholar] [CrossRef] [PubMed]
- Chen, P.; Wang, B.L.; Pan, B.S.; Guo, W. Mir-1297 regulates the growth, migration and invasion of colorectal cancer cells by targeting cyclo-oxygenase-2. Asian Pac. J. Cancer Prev. 2014, 15, 9185–9190. [Google Scholar] [CrossRef] [PubMed]
- Liang, X.; Li, H.; Fu, D.; Chong, T.; Wang, Z.; Li, Z. MicroRNA-1297 inhibits prostate cancer cell proliferation and invasion by targeting the AEG-1/Wnt signaling pathway. Biochem. Biophys. Res. Commun. 2016, 480, 208–214. [Google Scholar] [CrossRef] [PubMed]
- Liu, Y.; Liang, H.; Jiang, X. MiR-1297 promotes apoptosis and inhibits the proliferation and invasion of hepatocellular carcinoma cells by targeting HMGA2. Int. J. Mol. Med. 2015, 36, 1345–1352. [Google Scholar] [CrossRef] [PubMed]
- Zhang, Z.; Wu, S.; Muhammad, S.; Ren, Q.; Sun, C. MiR-103/107 promote ER stress-mediated apoptosis via targeting the Wnt3a/βcatenin/ATF6 pathway in preadipocytes. J. Lipid Res. 2018, 59, 843–853. [Google Scholar] [CrossRef] [PubMed]
- Zhan, T.; Rindtorff, N.; Boutros, M. Wnt signaling in cancer. Oncogene 2017, 36, 1461–1473. [Google Scholar] [CrossRef] [PubMed]
- Ahmad, I.; Sansom, O.J.; Leung, H.Y. Exploring molecular genetics of bladder cancer: Lessons learned from mouse models. Dis. Model Mech. 2012, 5, 323–332. [Google Scholar] [CrossRef] [PubMed]


| Tools | Input Your Own Data | Output Contextualized with Your Experimental Design | Calculate the Centrality of miRNAs in the Network | Calculate Centrality of Genes in the Network | Calculate the Structural Equivalence of miRNA Interactions | Graphical Depiction of miRNAs Organized by Centrality | Graphical Depiction of miRNA Clusters by Structural Equivalence |
|---|---|---|---|---|---|---|---|
| miRmapper | X | X | X | X | X | X | X |
| MMIA | - | - | - | - | - | - | - |
| miRror-Suite | X | X | - | - | - | - | - |
| DIANA-mirExTra | X | X | - | - | - | - | - |
| miRGator | - | - | - | - | - | - | - |
| MAGIA | X | X | - | - | - | X | - |
| MAGIA2 | X | X | - | - | - | X | - |
| NetworkAnalyzer | X | X | X | X | - | - | - |
| SpidermiR | - | - | X | X | - | X | - |
| hsa-miR-107 | N4BP1 |
| hsa-let-7e-5p | FNDC3A |
| hsa-let-7e-5p | HAND1 |
| hsa-let-7e-5p | IGF1R |
| hsa-let-7e-5p | OSBPL3 |
| hsa-let-7e-5p | RRM2 |
| hsa-let-7e-5p | STX3 |
| hsa-miR-107 | ASH1L |
| hsa-miR-107 | CAPZA2 |
| hsa-miR-107 | YWHAH |
| hsa-miR-421 | AFF4 |
| … | … |
| IFI16 |
| COL5A2 |
| GJA1 |
| ALCAM |
| TXNIP |
| PLS3 |
| CXCL8 |
| SPARC |
| FBN1 |
| CDH2 |
| TMEM158 |
| … |
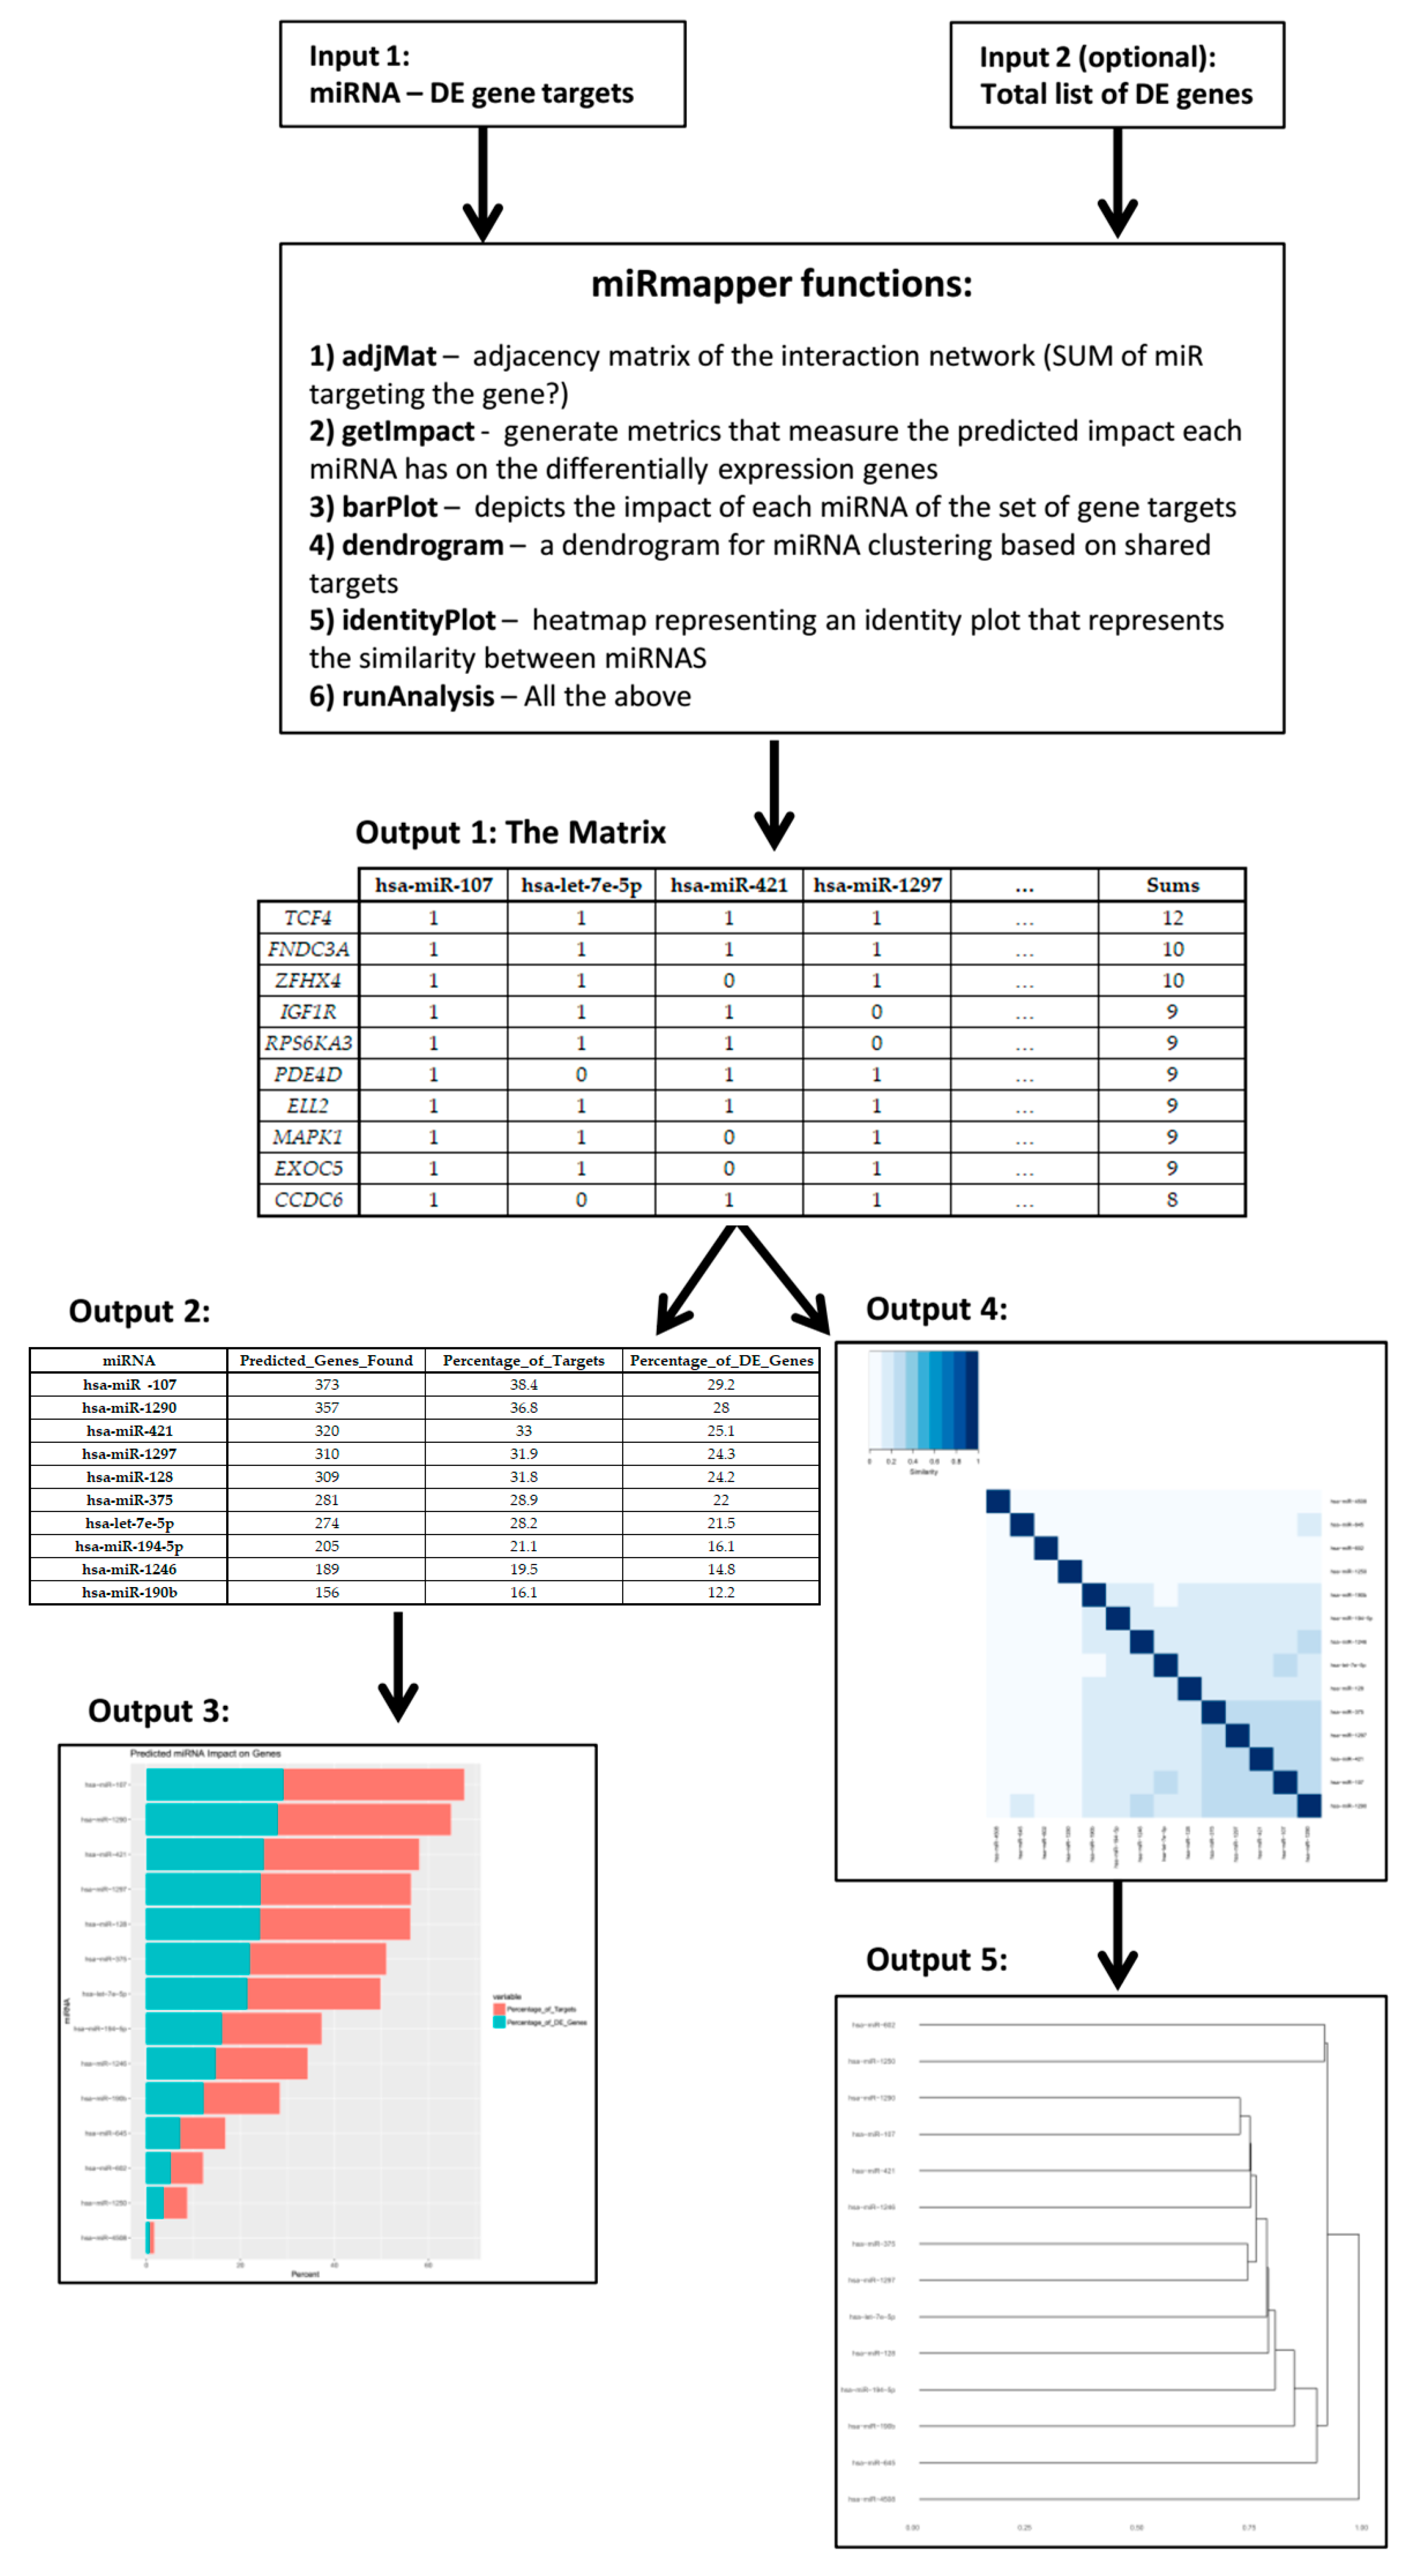
| hsa-miR-107 | hsa-let-7e-5p | hsa-miR-421 | hsa-miR-1297 | … | Sums | |
|---|---|---|---|---|---|---|
| TCF4 | 1 | 1 | 1 | 1 | … | 12 |
| FNDC3A | 1 | 1 | 1 | 1 | … | 10 |
| ZFHX4 | 1 | 1 | 0 | 1 | … | 10 |
| IGF1R | 1 | 1 | 1 | 0 | … | 9 |
| RPS6KA3 | 1 | 1 | 1 | 0 | … | 9 |
| PDE4D | 1 | 0 | 1 | 1 | … | 9 |
| ELL2 | 1 | 1 | 1 | 1 | … | 9 |
| MAPK1 | 1 | 1 | 0 | 1 | … | 9 |
| EXOC5 | 1 | 1 | 0 | 1 | … | 9 |
| CCDC6 | 1 | 0 | 1 | 1 | … | 8 |
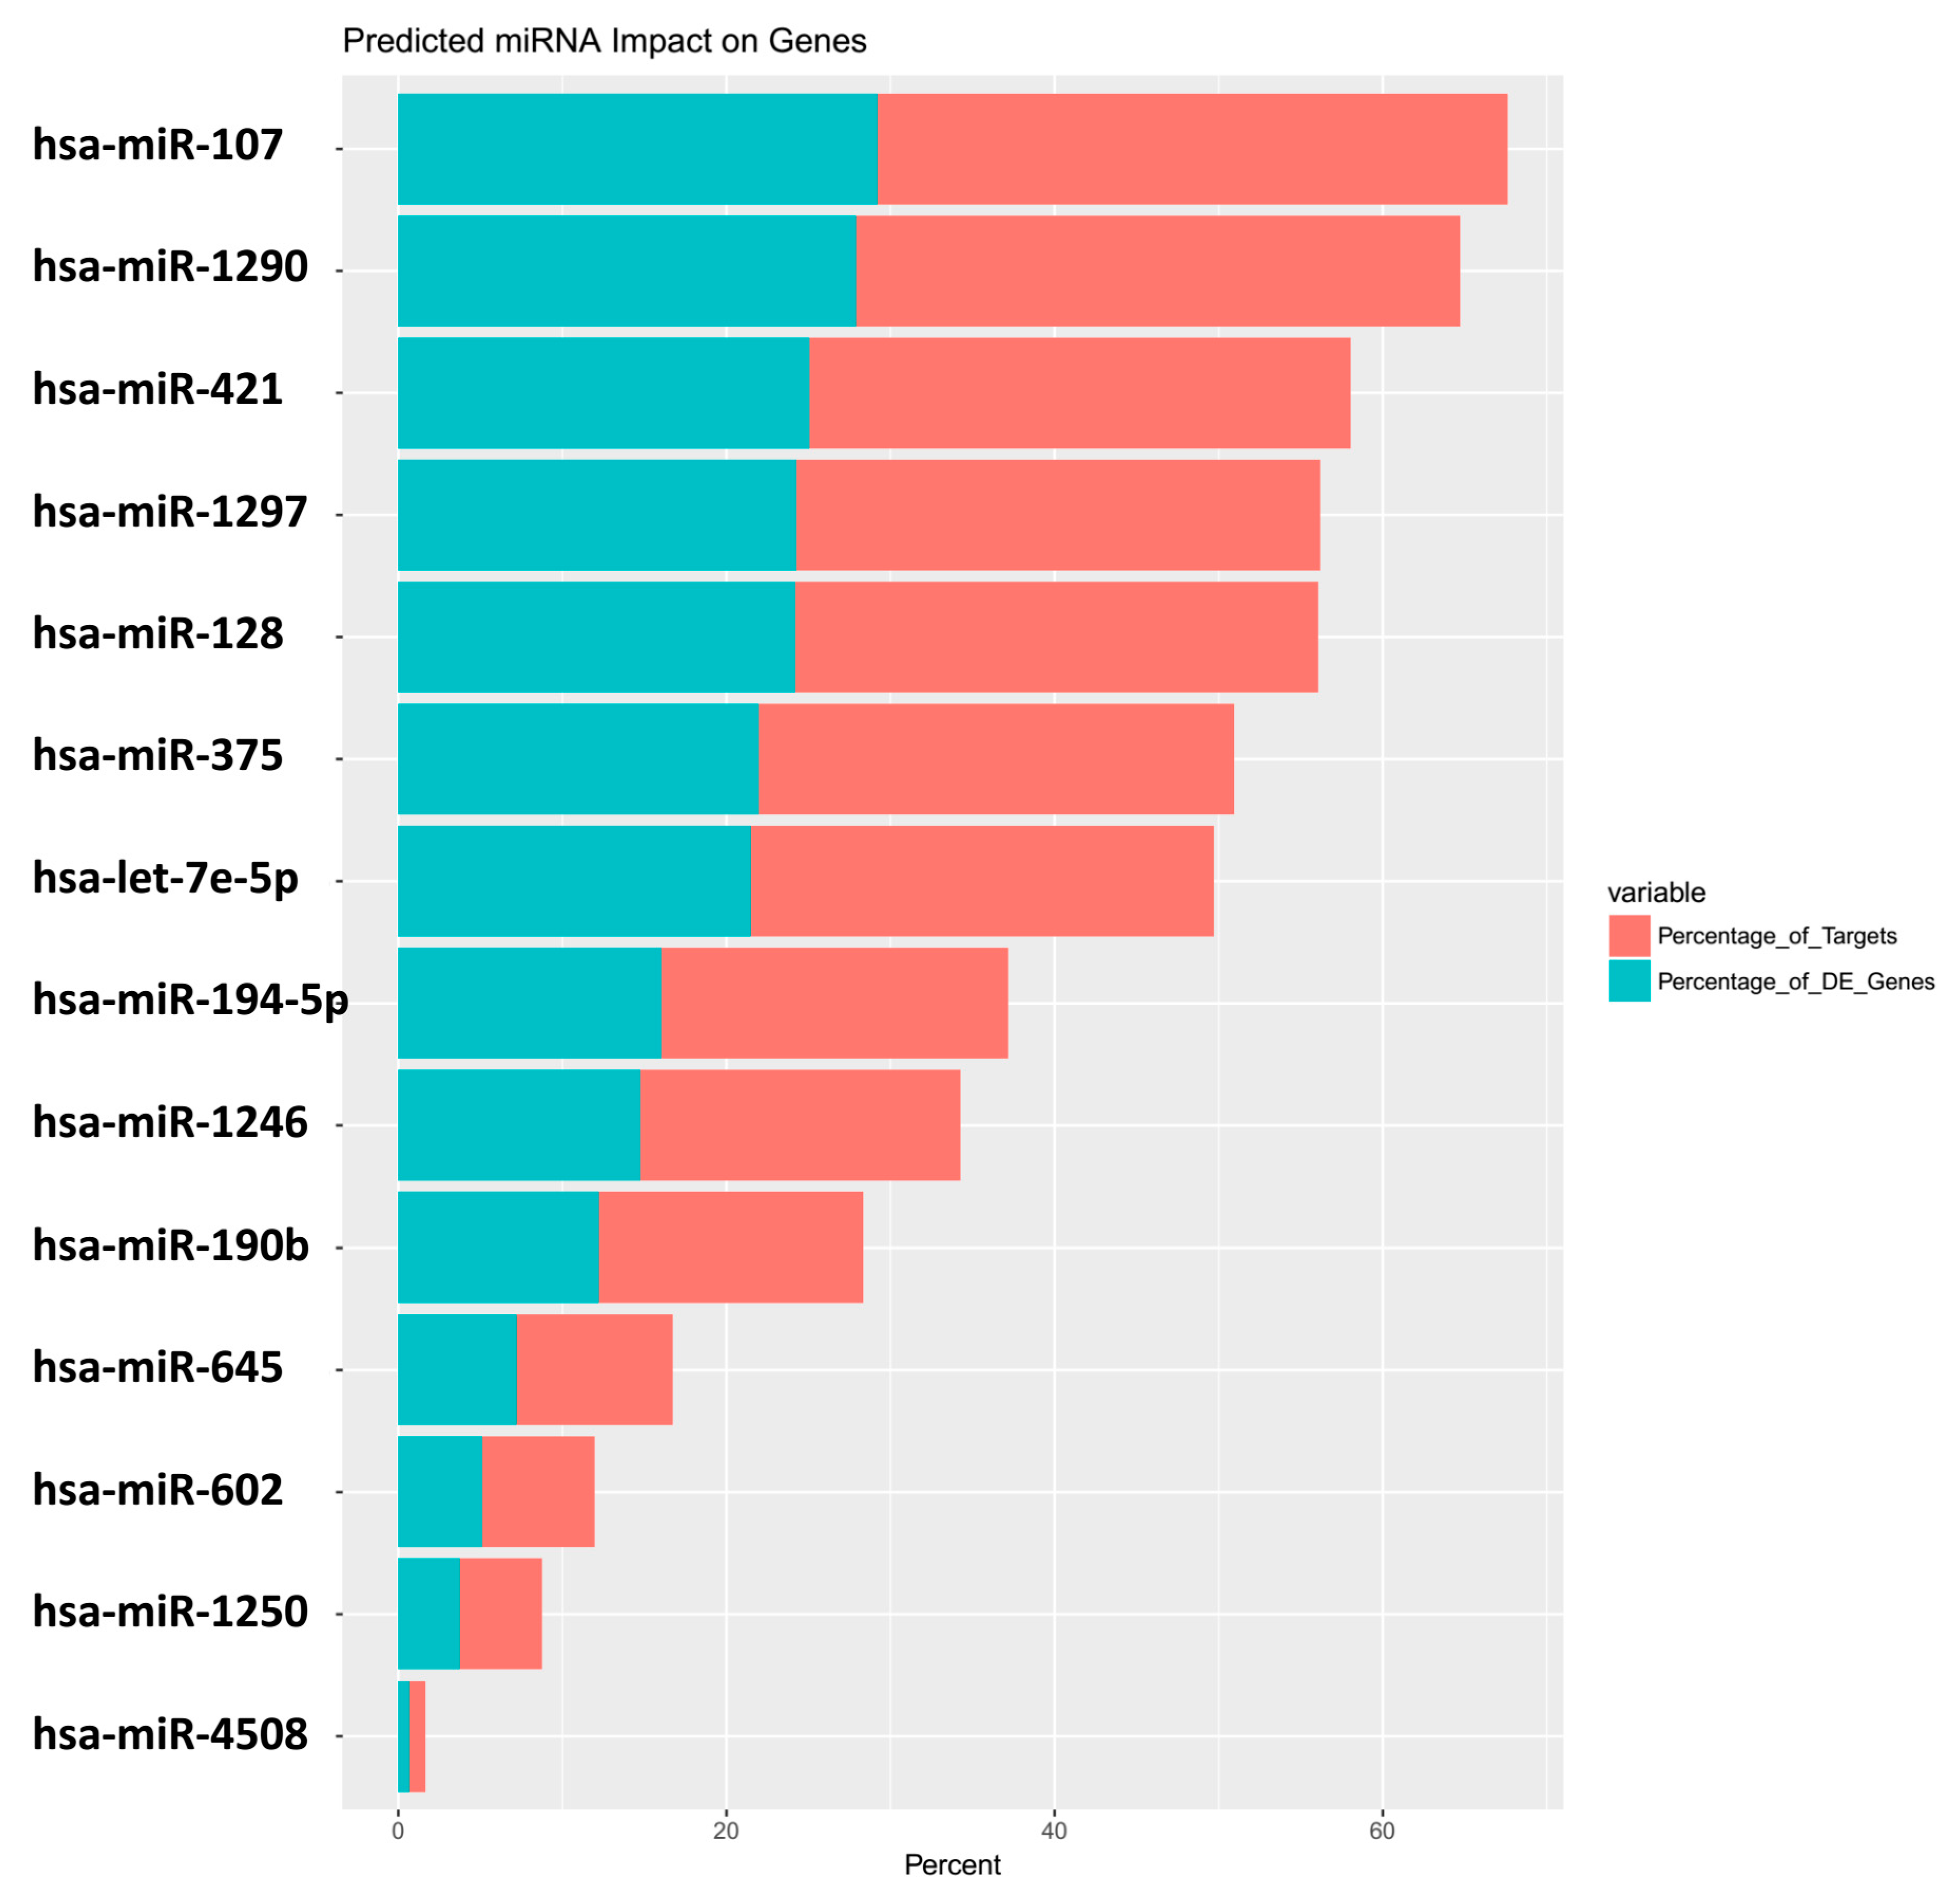
| miRNA | Predicted_Genes_Found | Percentage_of_Targets | Percentage_of_DE_Genes |
|---|---|---|---|
| hsa-miR-107 | 373 | 38.4 | 29.2 |
| hsa-miR-1290 | 357 | 36.8 | 28 |
| hsa-miR-421 | 320 | 33 | 25.1 |
| hsa-miR-1297 | 310 | 31.9 | 24.3 |
| hsa-miR-128 | 309 | 31.8 | 24.2 |
| hsa-miR-375 | 281 | 28.9 | 22 |
| hsa-let-7e-5p | 274 | 28.2 | 21.5 |
| hsa-miR-194-5p | 205 | 21.1 | 16.1 |
| hsa-miR-1246 | 189 | 19.5 | 14.8 |
| hsa-miR-190b | 156 | 16.1 | 12.2 |
© 2018 by the authors. Licensee MDPI, Basel, Switzerland. This article is an open access article distributed under the terms and conditions of the Creative Commons Attribution (CC BY) license (http://creativecommons.org/licenses/by/4.0/).
Share and Cite
Da Silveira, W.A.; Renaud, L.; Simpson, J.; Glen, W.B., Jr.; Hazard, E.S.; Chung, D.; Hardiman, G. miRmapper: A Tool for Interpretation of miRNA–mRNA Interaction Networks. Genes 2018, 9, 458. https://doi.org/10.3390/genes9090458
Da Silveira WA, Renaud L, Simpson J, Glen WB Jr., Hazard ES, Chung D, Hardiman G. miRmapper: A Tool for Interpretation of miRNA–mRNA Interaction Networks. Genes. 2018; 9(9):458. https://doi.org/10.3390/genes9090458
Chicago/Turabian StyleDa Silveira, Willian A., Ludivine Renaud, Jonathan Simpson, William B. Glen, Jr., Edward. S. Hazard, Dongjun Chung, and Gary Hardiman. 2018. "miRmapper: A Tool for Interpretation of miRNA–mRNA Interaction Networks" Genes 9, no. 9: 458. https://doi.org/10.3390/genes9090458
APA StyleDa Silveira, W. A., Renaud, L., Simpson, J., Glen, W. B., Jr., Hazard, E. S., Chung, D., & Hardiman, G. (2018). miRmapper: A Tool for Interpretation of miRNA–mRNA Interaction Networks. Genes, 9(9), 458. https://doi.org/10.3390/genes9090458