Article

Comparative Chloroplast Genome Analysis of Anchusa and the Adulterants of HERBA ANCHUSAE

1
State Key Laboratory Basis of Xinjiang Indigenous Medicinal Plants Resource Utilization, Xinjiang Technical Institute of Physics and Chemistry, Chinese Academy of Sciences, Urumqi 830011, China
2
University of Chinese Academy of Sciences, Beijing 101408, China
3
Xinjiang Key Laboratory of Traditional Chinese Medicine Concoction Research, Traditional Chinese Medicine Hospital Affiliated to Xinjiang Medical University, Urumqi 830000, China
4
Key Laboratory of Chinese Medicinal Resource from Lingnan, Ministry of Education, School of Pharmaceutical Sciences, Guangzhou University of Chinese Medicine, Guangzhou 510006, China
5
South China Botanical Garden, Chinese Academy of Sciences, Guangzhou 510650, China
6
Xinjiang Key Laboratory of Chinese Materia Medica and Ethnic, Xinjiang Institute of Materia Medica, Urumqi 830000, China
7
College of Traditional Chinese Medicine, Xinjiang Medical University, Urumqi 830091, China
*
Authors to whom correspondence should be addressed.
Genes 2026, 17(9), 993; https://doi.org/10.3390/genes17090993
Submission received: 23 May 2026 / Revised: 19 August 2026 / Accepted: 20 August 2026 / Published: 24 August 2026
(This article belongs to the Section Plant Genetics and Genomics)

Abstract

Background: The genus Anchusa L. includes plants used in Uyghur medicine for their anti-inflammatory and analgesic effects. However, in China, the botanical origin of HERBA ANCHUSAE (Niushecao, a Uyghur medicinal herb) is severely confused. Traditional identification methods and standard DNA barcodes do not work well for these close relatives. Chloroplast genomes are known to contain variable regions that can help distinguish species, yet no such study has been done for Anchusa. Therefore, We compared the complete chloroplast genomes of six Anchusa species and the main adulterants of Niushecao. Methods: We analyzed genome structure, repeat sequences, codon usage bias, and nucleotide diversity (Pi), as well as conducted comparative and phylogenetic analyses. Results: All genomes shared a typical ring-shaped quadripartite structure, ranged from 150,178 to 150,844 bp in size, and contained the same set of genes. Despite this overall conservation, we identified several highly variable spots, mostly located in non-coding intergenic spacer regions. Using two complementary approaches—sliding window analysis and mVISTA-based sequence visualization—we identified three overlapping regions (rbcL-psaI, petA-psbJ, and trnC-GCA-petN) as candidate DNA barcodes for species identification. Our phylogenetic tree showed that Anchusa strigosa Banks & Sol. is most closely related to the true medicinal species Anchusa azurea Mill. (Bootstrap support (BS) = 100%), while other look-alikes formed separate branches. Conclusions: These findings provide the first chloroplast genomic resources for this genus and offer potential molecular markers for authenticating Anchusa medicinal materials, laying a foundation for future development of molecular authentication methods.

1. Introduction

A. azurea Mill. is widely distributed across the temperate regions of the Northern Hemisphere, but is absent from the Americas and East Asia. Its distribution extends from eastern Central Europe through the Mediterranean region to the Western Himalayas. It commonly inhabits wastelands, fallow fields, and roadsides, occurring from near sea level to low-altitude mountainous areas [1]. A. azurea has a long history of medicinal use. In Turkey, dried leaves are powdered and applied topically to dry wounds. Alternatively, the root is decocted and mixed with egg yolk and beeswax to prepare an ointment for wound healing [2,3]. In Iran, the leaves are used in decoctions to treat colds, sore throat, and chest pain [4]. Furthermore, A. azurea is used as a stimulant, tonic, and demulcent for treating bile disorders, fever, cough, and asthma, and also as a diuretic for bladder and kidney stones [5].
The Uyghur medicinal herb HERBA ANCHUSAE (Niushecao) is derived from the dried aerial parts of A. azurea [Anchusa italica Retz.] (Boraginaceae), known as “Gaozivan” in Uyghur. It is officially listed in the Drug Standard of the Ministry of Public Health of the People’s Republic of China (Uyghur Medicine Volume) [6]. Niushecao has a long history of medicinal use in the Xinjiang region of China. It is widely employed for treating dry-cold or black-bile disorders involving the nervous, psychiatric, respiratory, and cardiovascular systems. Specific conditions include dry brain deficiency, depression, cough, and asthma [7]. In Uyghur medicine, Niushecao is a commonly used clinical drug for cardiovascular, cerebrovascular, and respiratory diseases. It also serves as the principal ingredient in classical Uyghur compound preparations such as the Abnormal Black Bile Maturation Agent and Aifeitimeng Decoction [8,9]. Modern studies have demonstrated that Niushecao possesses a rich chemical composition, including volatile oils, flavonoids, tannins, phenolic acids, triterpenoids, and alkaloids. Among these, isorhamnetin and rosmarinic acid are considered key bioactive compounds [10,11]. Recent pharmacological investigations have confirmed a broad spectrum of activities. These include anti-inflammatory, analgesic, antitumor, antioxidant, antiviral, neuroprotective, endocrine-modulating, and cardiovascular protective effects [7,9,12,13].
A. azurea is used as an important ethnic medicine in Xinjiang. However, it is not native to China and is cultivated only on a limited scale in places like Kashgar. Consequently, Niushecao crude drug material is almost entirely imported, mainly from Pakistan [14,15]. Our previous market surveys and literature reviews have revealed serious misidentification of the original plant sources of domestic Niushecao. These problems can be summarized into three main aspects. First, a considerable portion of imported Niushecao material originates from A. strigosa Banks & Sol., not from A. azurea. No authentic A. azurea specimens were identified in our sampling. Second, the botanical origin of Niushecao varies among different regions in China. For example, the Chinese Materia Medica lists Borago officinalis L., a species from the same family [16]. Third, several other medicinal Anchusa species are easily confused with A. azurea, and some Boraginaceae species share highly similar macroscopic traits with Niushecao. Consequently, multiple adulterants are present on the market. Common adulterants include A. strigosa, A. officinalis L., A. arvensis (L.) M.Bieb., A. capensis Thunb., A. undulata L. subsp. hybrida (Ten.) Cout., Echium vulgare L., and Cynoglossum amabile Stapf & Drummond [15,17,18]. The circulation of these adulterants severely compromises the quality and clinical consistency of Niushecao. It also undermines the accuracy and reproducibility of chemical and pharmacological studies of this herb.
Accurate botanical identification of crude drugs is a prerequisite for chemical, pharmacological and clinical studies. Although some research has addressed the identification of Niushecao, most studies have relied on traditional methods. These methods include macroscopic authentication, microscopic examination, thin-layer chromatography, and quantitative chemical assays. These methods have clear limitations when applied to fragmented processed materials or to closely related species [15,18,19]. DNA-based molecular identification has become an important tool for authenticating Chinese herbal medicines, offering high accuracy, reproducibility, and independence of morphological features. To date, molecular identification of Niushecao has mainly relied on ITS2 sequences [15,18,20]. These sequences have been used to distinguish A. strigosa, B. officinalis, and other Anchusa species. However, ITS2 sequences provide limited phylogenetically informative sites. In addition, no systematic comparative chloroplast genome study has been conducted on Anchusa. Genomic data for this genus remain scarce. Therefore, further molecular identification of Niushecao and its adulterants is needed.
Plant organellar genomes, particularly chloroplast genomes, exhibit highly diverse architectures across the tree of life. Most land plant chloroplast genomes possess a highly conserved quadripartite circular structure. They typically range from 115 to 165 kb in length and consist of a large single-copy (LSC) region, a small single-copy (SSC) region, and a pair of inverted repeats (IRs) [21]. Despite this conserved framework, plastomes vary greatly among lineages in genome size, IR boundaries, gene content, repeat sequences, and substitution rates [21]. The synonymous substitution rate of plastomes is approximately half that of nuclear genomes. However, it can fluctuate dramatically among lineages. These variations are shaped by multiple mechanisms, including selection pressure, mutation burden, and localized hypermutation [21]. In addition, mitochondrial and plastid genomes have independently evolved many similar genomic features. However, mitochondrial genomes generally exhibit greater architectural complexity [22]. Chloroplast genomes offer notable advantages over nuclear and mitochondrial genomes for identifying plant-derived medicinal materials, due to their relatively small size, conserved structure, and moderate evolutionary rates. These features make them a key source of molecular markers. These markers are widely used in plant identification, evolutionary biology, and genetic diversity assessment [23]. Conventional DNA barcodes based on chloroplast genome sequences, such as rbcL, matK, and psbA-trnH, have been important tools for herbal medicine identification. They are universal, easy to apply, and have performed reliably in authenticating many medicinal materials, including PINELLIAE RHIZOMA [24] and SOPHORAE TONKINENSIS RADIX ET RHIZOMA [25]. However, for closely related, morphologically similar, or evolutionarily complex taxa, conventional barcodes often fail due to limited informative sites. To overcome this limitation, a comparative framework based on complete chloroplast genomes has been established and is now a key strategy for precise discrimination of closely related species. This approach has led to significant progress in several taxa. For example, in ASARI RADIX ET RHIZOMA, this approach revealed an atypical tripartite genome structure, resolved the phylogenetic relationships among Asarum heterotropoides Fr. Schmidt var. mandshuricum (Maxim.) Kitag., Asarum sieboldii Miq. f. seoulense (Nakai) C.Y. Cheng et C.S. Yang, and A. sieboldii Miq. In addition, it identified taxon-specific hypervariable regions [26]. In Polygonatum Mill., conventional barcodes have proven inadequate. This genus has experienced complex reticulate evolution. However, comparative chloroplast genome analysis successfully identified hypervariable regions. These regions can distinguish morphologically similar species, such as Polygonatum sibiricum Redouté and P. cyrtonema Hua [27]. However, no study has yet systematically applied the comparative chloroplast genome approach to identify the botanical origin of the medicinal genus Anchusa.
The genus Anchusa L. (Boraginaceae) contains approximately 35 species worldwide [28] (based on APG IV; https://www.mobot.org/MOBOT/research/APweb/, accessed on 14 March 2026). Eight of these species are documented as medicinal [29,30,31]. To date, no systematic comparative study of the Anchusa chloroplast genome has been conducted. In our study, we selected six Anchusa species that are morphologically similar and closely related to A. azurea, as well as several adulterants (including E. vulgare), for comparative chloroplast genome analysis. The aim of this study is to characterize structural variations among the six chloroplast genomes and to fill the gap in genomic data. We will identify hypervariable regions and recommend them as candidate DNA barcode loci. These regions may serve as potential markers for molecular authentication of Niushecao. Our findings will provide fundamental data and a theoretical reference that may facilitate the development of molecular identification tools.

2. Materials and Methods

2.1. Plant DNA Extraction and Sequencing

The sources of samples used for de novo sequencing and assembly are listed in Table 1. Specimens were identified as A. strigosa and E. vulgare by Yi Tong (Associate Professor, Guangzhou University of Chinese Medicine). Voucher specimens are deposited in the herbarium of Guangzhou University of Chinese Medicine (GUCM) under the accession numbers Liang C20251029 and Liang C20251021, respectively.
Total plant DNA was extracted by Verygenome Technology Co., Ltd. (Guangzhou, China). Sequencing libraries were prepared with an average insert size of 350 bp. Paired-end sequencing (150 bp) was performed on the DNBSEQ-T7 platform (MGI). The primer sequences used for library construction were as follows: forward primer, 5′-CTCTCAGTACGTCAGCAGTTNNNNNNNNNNCAACTCCTTGGCTCACAGAACGACATGGCTACGA-3′; reverse primer, 3′-CCGGTTCGCCAGAATCCTTCTGTTNNNNNNNNNNGACTATTCCAGCGGTACG-5′ (N represents a random nucleotide). Approximately 3 Gb of raw data were obtained per sample. The raw sequencing reads generated in this study have been deposited in the NCBI Sequence Read Archive (SRA) under the BioProject accession number PRJNA1502504. Raw data for A. capensis were downloaded from the SRA database. Raw data for A. undulata subsp. hybrida, A. azurea, and A. officinalis were downloaded from the ENA database (Table 2). Authentic A. azurea samples were not available for this study. The identity of the publicly available A. azurea sequences could not be independently verified. Quality control was performed using fastp v0.23.4 [32].

2.2. Chloroplast Genome Assembly, Annotation, and Physical Mapping

Complete chloroplast genomes of six Boraginaceae species were assembled de novo using GetOrganelle v1.7.7.0 [33], with k-mer values of 65, 105, and 127. Annotation was performed with the Plastid Genome Annotator (PGA) [34]. The reference genomes used were N. vesicaria (L.) Rchb. for Anchusa species and Echium plantagineum L. for E. vulgare (Table 2). The A. arvensis chloroplast genome (GenBank accession OZ374795.1) was re-annotated following the same procedure. Manual correction was performed using Geneious Prime 2025.0.2 [35]. Circular chloroplast genome maps were drawn using OGDRAW (https://chlorobox.mpimp-golm.mpg.de/OGDraw.html, accessed on 11 January 2026) [36].

2.3. Repeat Sequence Identification

REPuter [37] (https://bibiserv.cebitec.uni-bielefeld.de/reputer, accessed on 18 January 2026) was used to identify interspersed repeats (forward repeats, reverse repeats, complement repeats, and palindromic repeats). The minimum repeat unit length was set to ≥ 30 bp, with a Hamming distance of 3.
MISA-web [38] (http://pgrc.ipk-gatersleben.de/misa, accessed on 12 January 2026) was used to detect simple sequence repeats (SSRs). The detection criteria were: mononucleotide SSR unit ≥ 10, dinucleotide SSR unit ≥ 5, trinucleotide SSR unit ≥ 4, and tetra-, penta-, and hexanucleotide SSR unit ≥ 3.
ChiPlot (https://www.chiplot.online, accessed on 17 January 2026) was used for data visualization.

2.4. Codon Usage Bias

Protein-coding sequences (CDSs) shared by the six Anchusa species were extracted using PhyloSuite v2 [39] and then screened. Duplicate genes and genes shorter than 300 bp were removed. Only sequences containing standard bases (A, T, G, C) and with both a start codon (ATG) and a stop codon (TAG, TGA, or TAA) were retained. The relative synonymous codon usage (RSCU) was calculated using the RSCUcaller package (v1.0) [40] in R (v4.4.1). Statistical significance of differences among species was assessed using the Kruskal–Wallis test, followed by Dunn’s test. The compared unit was defined as per-codon RSCU values per species (64 codon-level observations per species). The final results were visualized using ggplot2 package [41]. RSCU heatmaps were generated using TBtools-II v2.390 [42]. An RSCU value greater than 1 indicates a higher usage frequency, whereas a value below 1 indicates a lower usage frequency [43]. Other data were visualized using ChiPlot (https://www.chiplot.online, accessed on 17 February 2026).

2.5. Comparative Sequence Analysis

Global alignment and sequence identity comparison of the six Anchusa chloroplast genomes were performed using mVISTA [44] in LAGAN mode, with A. strigosa as the reference, to visualize genomic differences. Inverted repeat (IR) boundary contraction and expansion were analyzed and visualized using IRscope [45] (https://irscope.shinyapps.io/irapp/, accessed on 28 December 2025) to generate simplified diagrams of the chloroplast genomes. Collinearity analysis was performed using the Mauve v1.1.3 plugin [46] in Geneious Prime to detect rearrangement and inversion events.

2.6. Sliding Window Analysis

Sliding window analysis of the six Anchusa chloroplast genome sequences was performed with DnaSP v6.0 [47] to identify hypervariable regions and calculate nucleotide diversity (Pi). Parameters were set with a step size of 200 bp and a window length of 600 bp. Fragments with Pi > 0.025 and a length of at least 150 bp were screened as hypervariable regions. Their genomic positions were determined based on the gene annotation results.

2.7. Phylogenetic Tree Construction

Three outgroup species, H. arborescens L., E. strigosa (Willd.) Diane & Hilger, and T. montana Lour., were downloaded from NCBI (Table 2). Maximum likelihood (ML) trees were constructed for Anchusa, nine closely related species and three outgroups using complete chloroplast genomes. An additional ML tree was constructed using shared CDSs extracted with PhyloSuite v2 [39]. Multiple sequence alignment was performed with MAFFT v7.490 [48], followed by trimming with trimAL v1.4 [49]. ML trees were constructed using IQ-TREE v1.6.12 [50] with 1000 bootstrap replicates to assess branch support. Tree visualization and annotation were constructed using the ChiPlot online platform [51].

3. Results

3.1. Assembly and Annotation Results

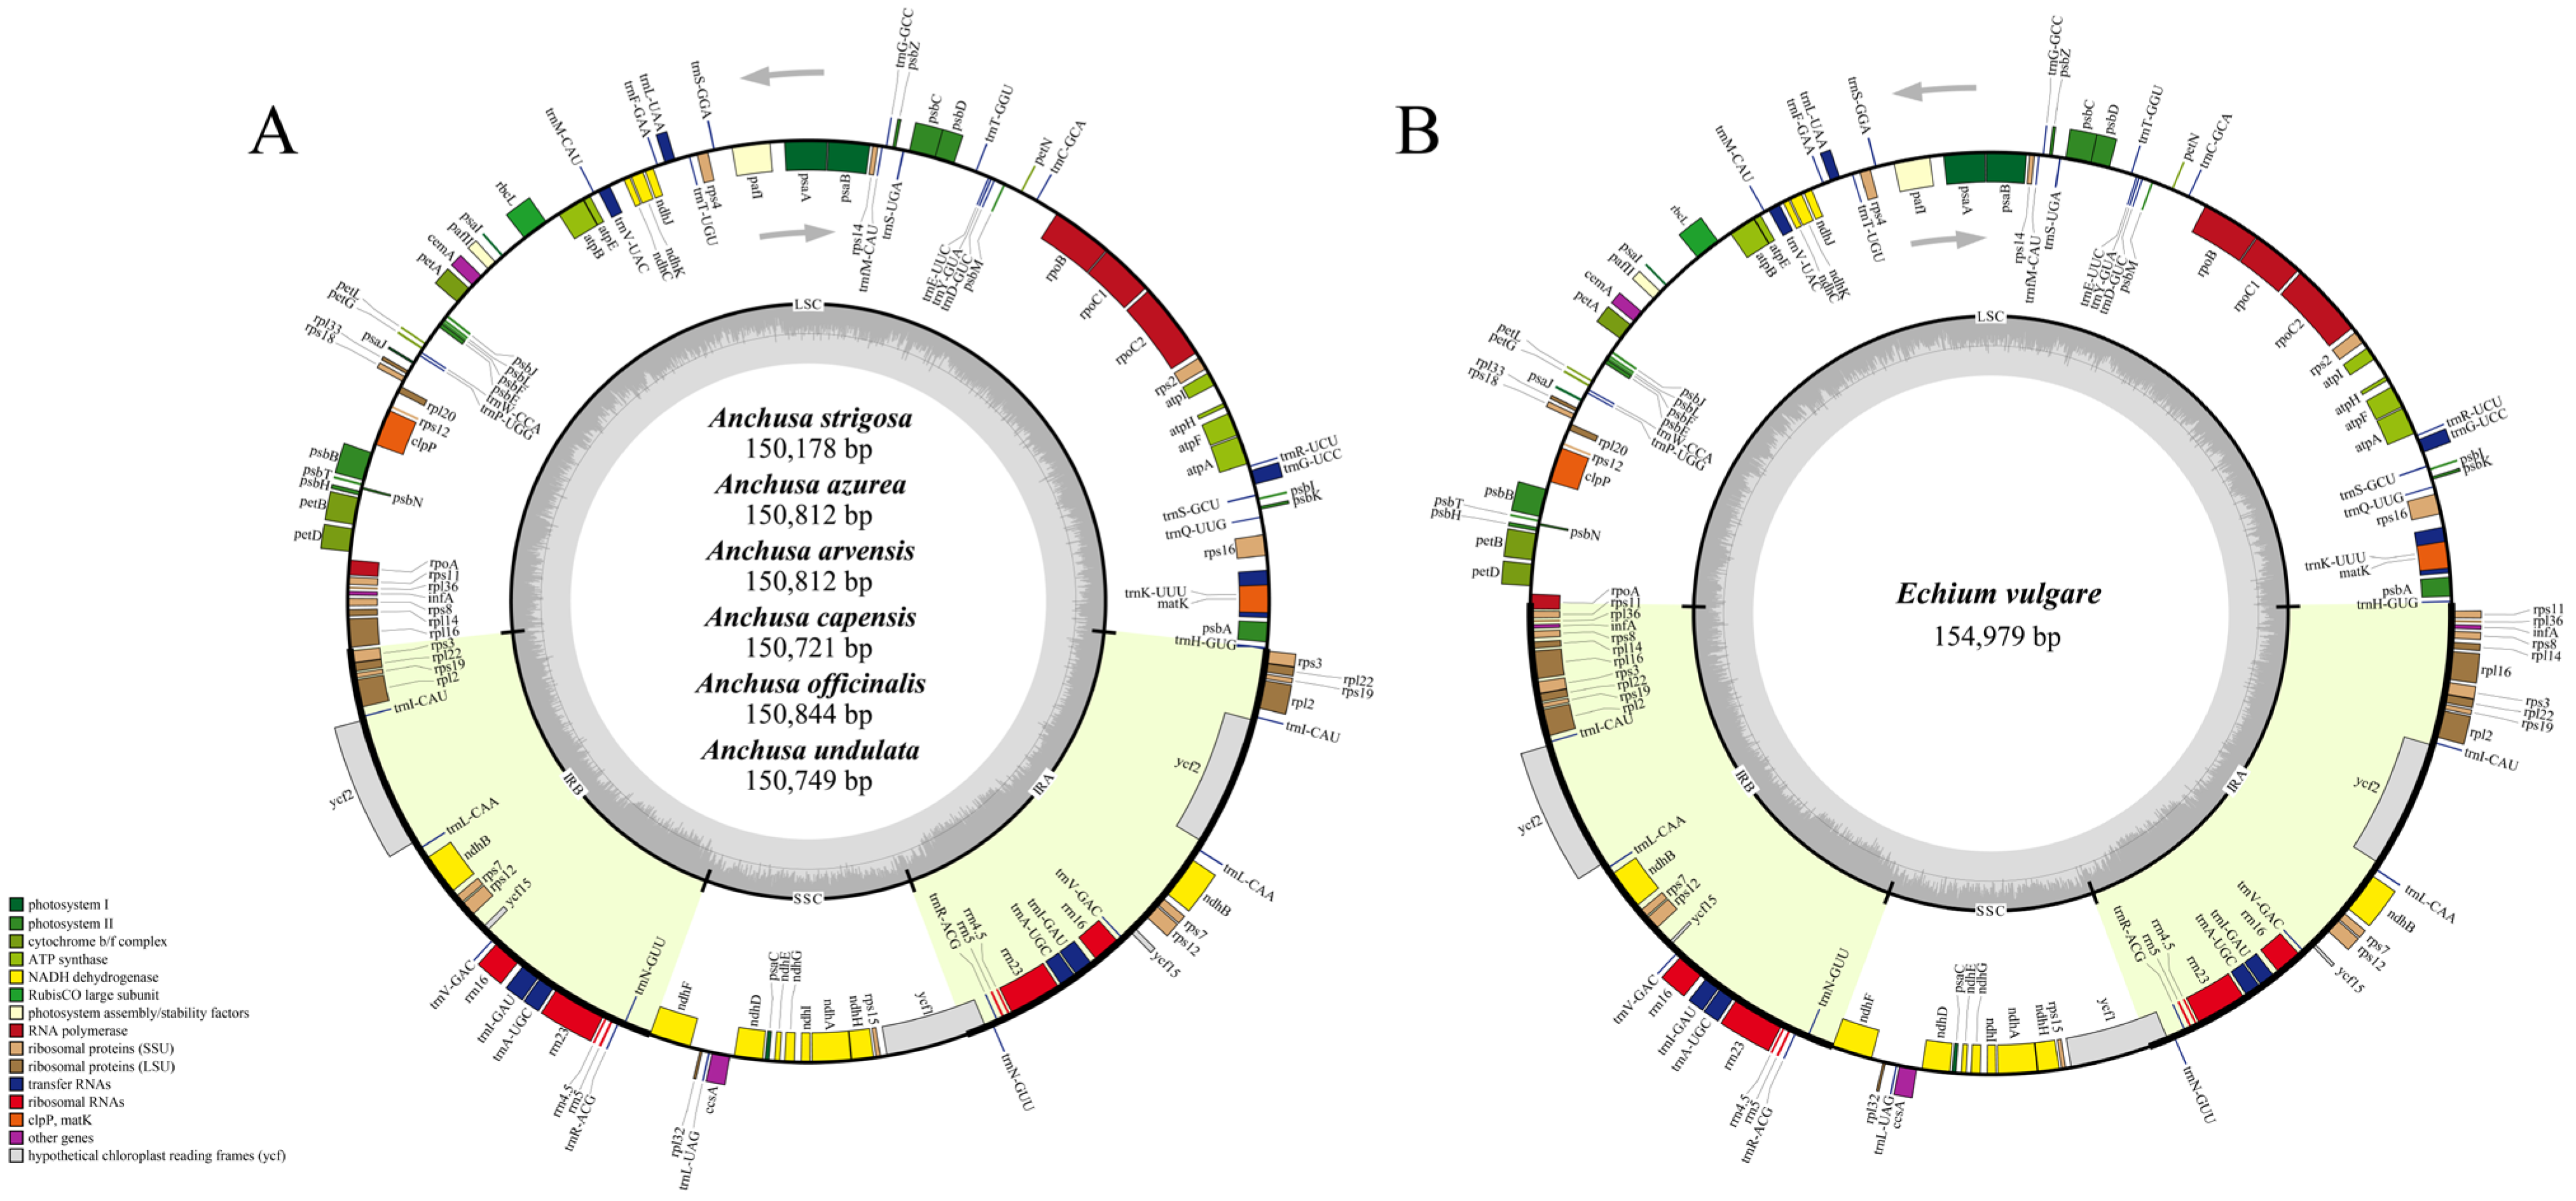
Complete chloroplast genomes of six Anchusa species and the common adulterant E. vulgare were assembled and annotated. All genomes displayed the typical quadripartite circular structure (Figure 1). The total lengths of the six Anchusa chloroplast genomes ranged from 150,178 bp (A. strigosa) to 150,844 bp (A. officinalis) (Table 3). The LSC regions ranged from 79,780 to 79,976 bp. The SSC regions ranged from 16,782 to 16,871 bp. The IR regions ranged from 26,710 to 27,043 bp. Overall GC content was 37.9%, with IR regions consistently showing a GC content of 42.8%, higher than that of the LSC regions (35.9–36.0%) and SSC regions (31.7–31.8%).
The complete chloroplast genome of E. vulgare was 154,979 bp in length (Table 3). Its LSC, SSC and IR regions were 76,348 bp, 17,311 bp, and 30,660 bp, respectively. The overall GC content was 37.4%, and the IR GC content was 41.6%. Both values were higher than those of the LSC (35.6%) and SSC (31.1%) regions.
The chloroplast genomes of the six Anchusa species and three adulterants (E. vulgare, B. officinalis, C. amabile) were annotated, each with 112 genes (78 protein-coding genes, 30 tRNA genes, and 4 rRNA genes) (Table 4). Recent findings have led to updated annotations. The ycf3 and ycf4 genes encode photosystem I assembly factors [52]. They were annotated as pafI and pafII, respectively. The psbN gene encodes photosystem biogenesis factor 1. It was annotated as pbf1 [53].
The complete chloroplast genome of E. vulgare (154,979 bp) was larger than those of the Anchusa species and the other two adulterants. Its IR region (30,660 bp) was markedly longer than that of Anchusa species (26,710–27,043 bp) and far exceeded that of the congeneric E. plantagineum (25,754 bp) (Table 3). This IR expansion placed rpl16, rpl14, rps8, infA, rpl36, and rps11 within the IR region. These genes therefore occurred as duplicated copies. The chloroplast genome of B. officinalis (149,835 bp) was slightly smaller than those of Anchusa species. Its GC content was slightly lower across all regions. However, its overall structure, gene types, and copy numbers were largely consistent with those of Anchusa. The C. amabile chloroplast genome (151,532 bp) was larger than those of Anchusa species. It had a notably extended LSC region (82,902 bp) and a markedly shortened IR region (25,632 bp). In contrast to Anchusa, the C. amabile chloroplast genome contained only single copies of rps3, rpl22, and rps19.

3.2. Repeat Sequence Analysis

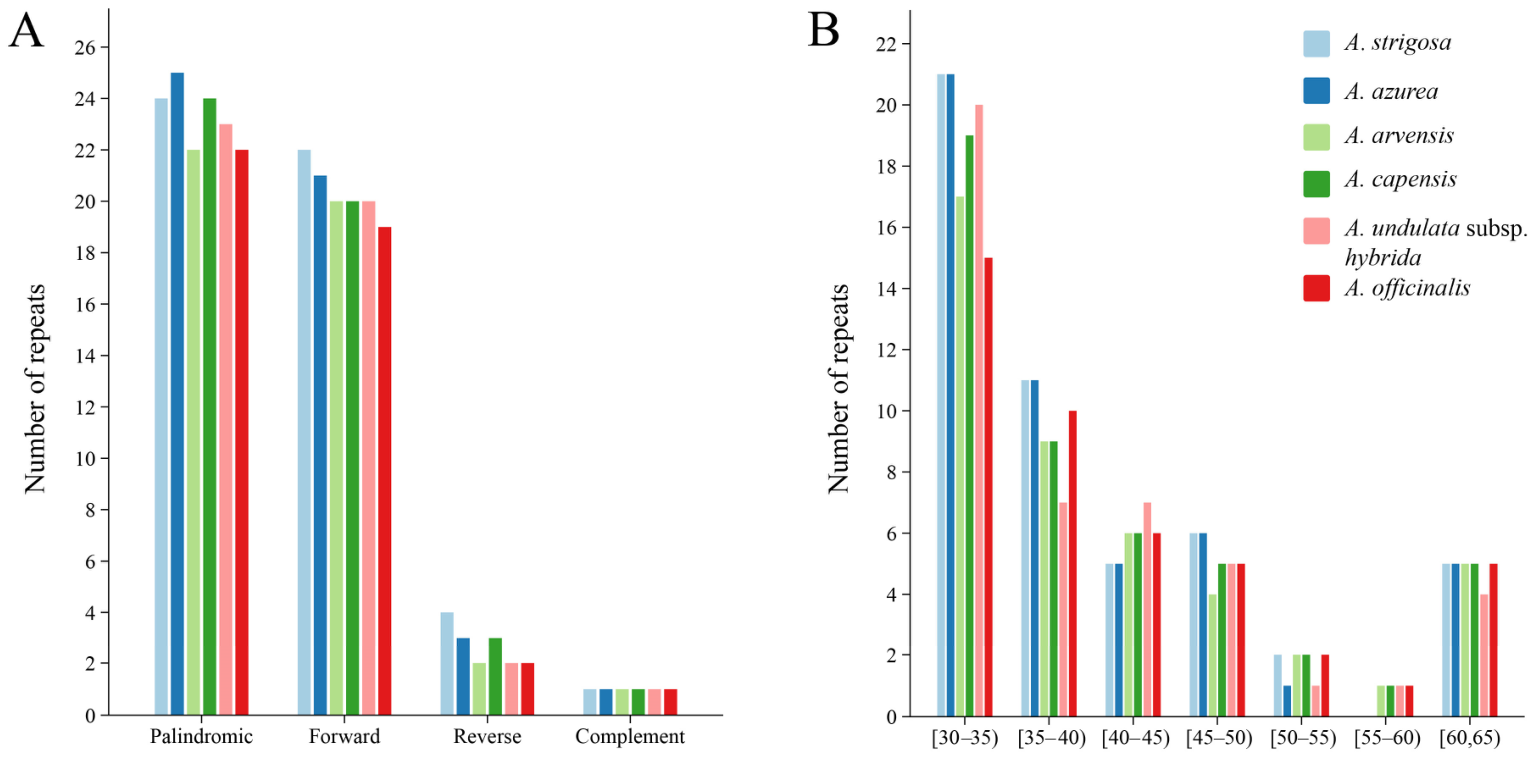
Interspersed repeat analysis identified 44 (A. officinalis) to 51 (A. strigosa) repeats in the chloroplast genomes of the six Anchusa species (Figure 2A). Four types of repeats were detected: forward, reverse, complement, and palindromic. Palindromic repeats were dominant, ranging from 22 (A. arvensis and A. officinalis) to 25 (A. azurea). Forward repeats were the second most abundant, ranging from 19 (A. officinalis) to 22 (A. strigosa) (Figure 2A). Reverse and complement repeats occurred at low frequencies. Reverse repeats ranged from 2 (A. arvensis, A. undulata subsp. hybrida, A. officinalis) to 4 (A. strigosa). Complement repeats were present as a single copy in each species (Figure 2A). Notably, interspersed repeats of 30–35 bp were the most abundant. No repeat exceeding 64 bp was detected. Repeats of 55–60 bp were absent in A. strigosa and A. azurea (Figure 2B).
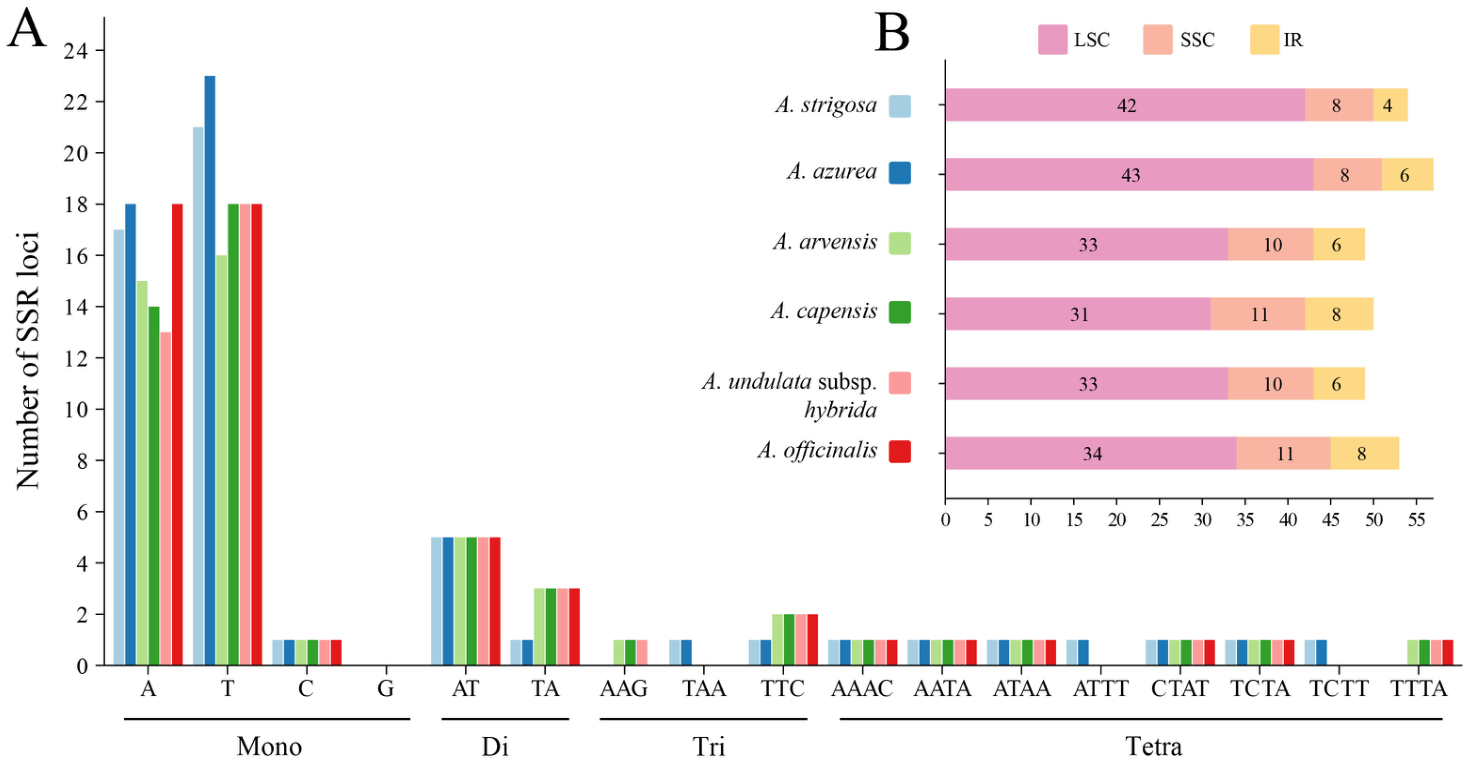
MISA analysis detected 312 SSR loci across the six Anchusa chloroplast genomes (Figure 3A,B). These included four types: mononucleotide, dinucleotide, trinucleotide, and tetranucleotide repeats. Mononucleotide SSRs were the most abundant across all species (215 loci). Dinucleotide and tetranucleotide repeats had 44 and 38 loci, respectively. Trinucleotide repeats were the least frequent (15). Monomorphic A/T repeats dominated, accounting for 65.31–73.68% of all SSR loci. A. azurea contained the highest number of SSRs (57), while A. arvensis and A. undulata subsp. hybrida contained the fewest (49 each).

3.3. Codon Usage Bias Analysis

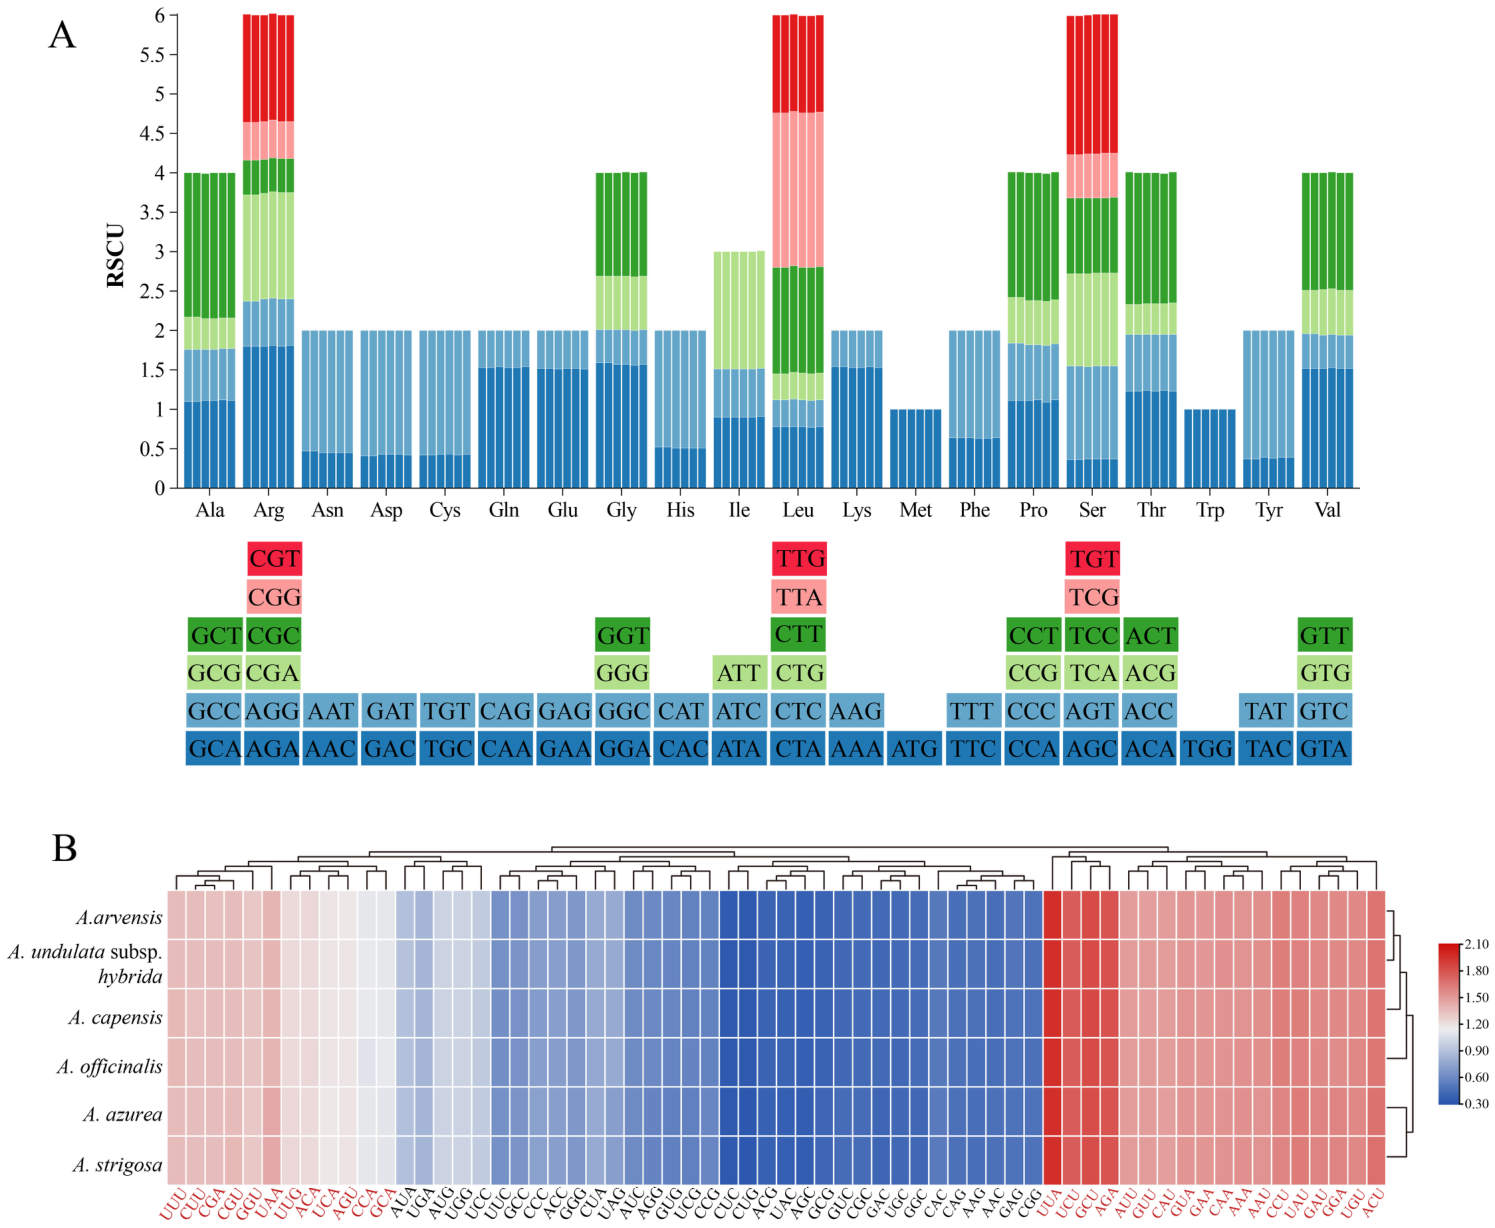
RSCU analysis based on 50 shared CDSs revealed highly consistent codon usage patterns across the six species (Figure 4A). Each of the six sequences contained all 64 synonymous codons. Thirty codons exhibited positive usage bias (RSCU > 1). All of these ended in A or U, except for the leucine codon UUG (ending in G). This reflects a general preference for A/U-ending codons in the chloroplast genomes of this genus (Figure 4B). In contrast, 32 codons exhibited negative usage bias (RSCU < 1), of which 90.63% (29/32) ended in C or G. The methionine (AUG) and tryptophan (UGG) codons showed no apparent bias (RSCU = 1.00). The leucine codon UUA consistently displayed the highest RSCU value (~1.96) across all species, whereas the serine codon CUG showed the lowest (0.33–0.34). Kruskal–Wallis and Dunn’s test showed no significant differences in RSCU values among the six Anchusa species (p = 1.00; Supplementary Figure S1).

3.4. Comparative Analysis

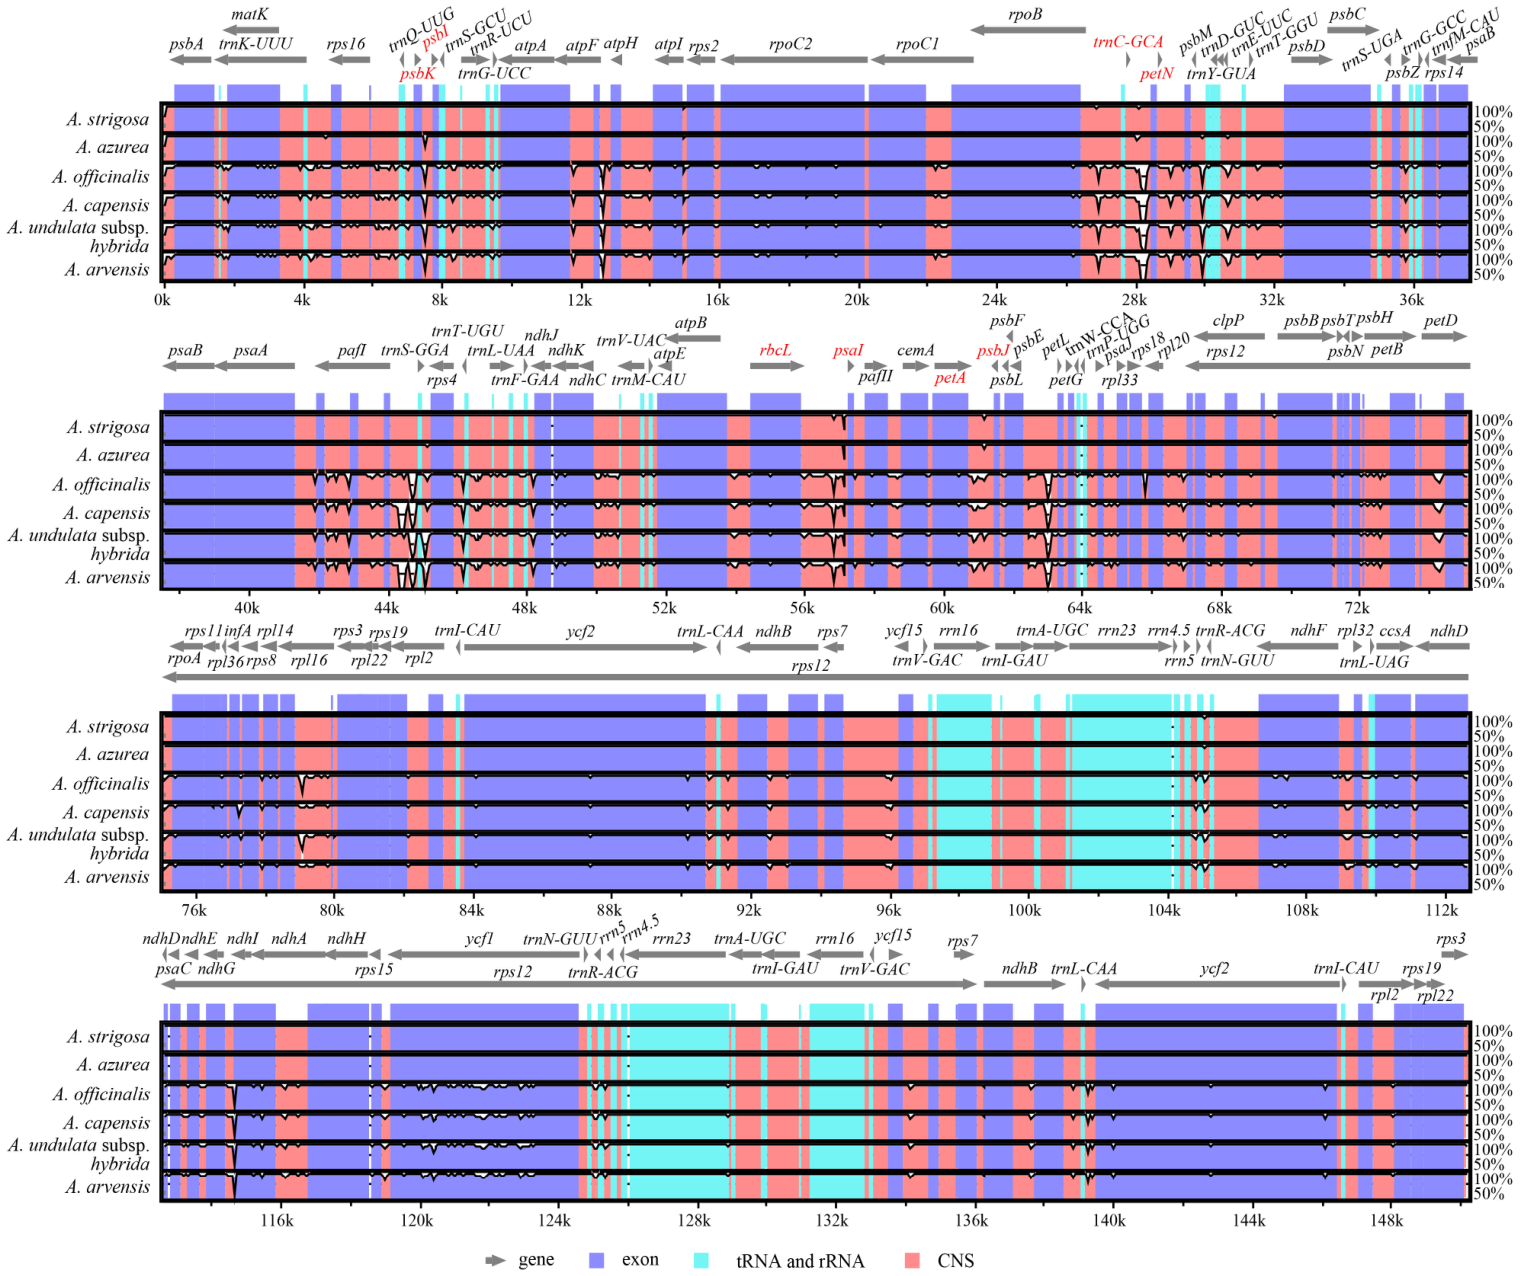
Global alignment with mVISTA, using A. strigosa as the reference, revealed extremely high sequence conservation between A. strigosa and A. azurea within the same subgenus (subg. Buglossum). However, across all six species, the chloroplast genomes showed varying degrees of sequence divergence. Particularly pronounced differences were observed between phylogenetically distant subgenera. Four hypervariable regions were identified: trnC-GCA-petN, psbK-psbI, rbcL-psaI, and petA-psbJ (Figure 5). These regions showed clear divergence between subgenera and may serve as potential DNA barcodes or valuable molecular markers for phylogenetic studies.
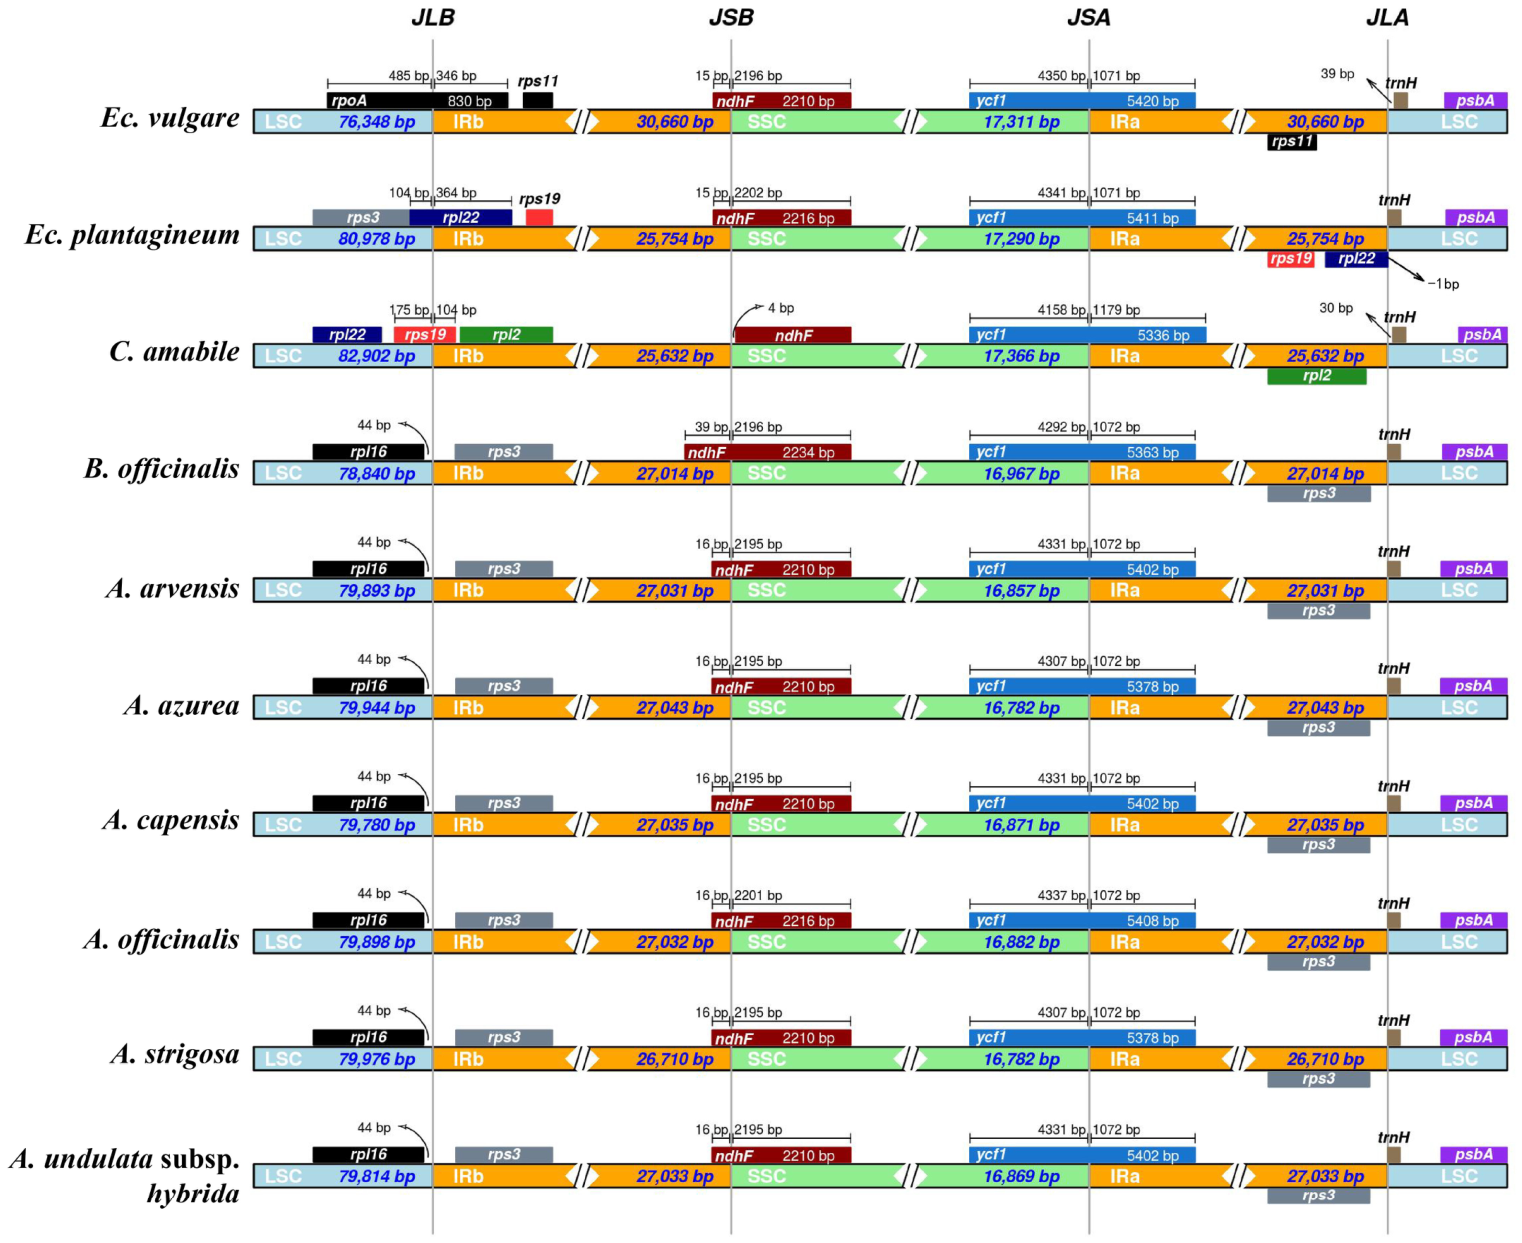
IRscope boundary analysis of IR, LSC, and SSC regions revealed highly conserved boundary structures among the six Anchusa chloroplast genomes (Figure 6). The boundary gene composition was identical across all species and included rpl16, rps3, ndhF, ycf1, trnH, and psbA. The rpl16 gene consistently terminated 44 bp upstream of the LSC–IRb junction (JLB). The ndhF gene spanned the SSC–IRb junction (JSB) and extended 16 bp into the IRb region. The LSC, SSC, and IR region lengths were similar among species. No significant boundary expansion or contraction was observed.
The IR boundary gene composition of B. officinalis was identical to that of Anchusa, although its ndhF extended 23 bp farther into the IRb region (Figure 6). The IRa gene composition and JLB-proximal gene arrangement of E. vulgare and C. amabile differed markedly from those of Anchusa (Figure 6). In C. amabile, rps19 extended from the LSC into the IRb region and resided at the JLB. Notably, ndhF did not extend into the IRb region in C. amabile. Within Echium, E. vulgare and its congener E. plantagineum differed in IRa gene composition and JLB-proximal gene arrangement. In E. vulgare, rpoA extended from the LSC into the IRb region. In E. plantagineum, rpl22 extended from the LSC into the IRb region. The LSC–IRa boundary gene was rps11 rather than rps19.
Collinearity analysis further confirmed the structural conservation of Anchusa chloroplast genomes, and all six genomes were collinear, with no detectable gene rearrangement events.

3.5. Nucleotide Diversity Analysis

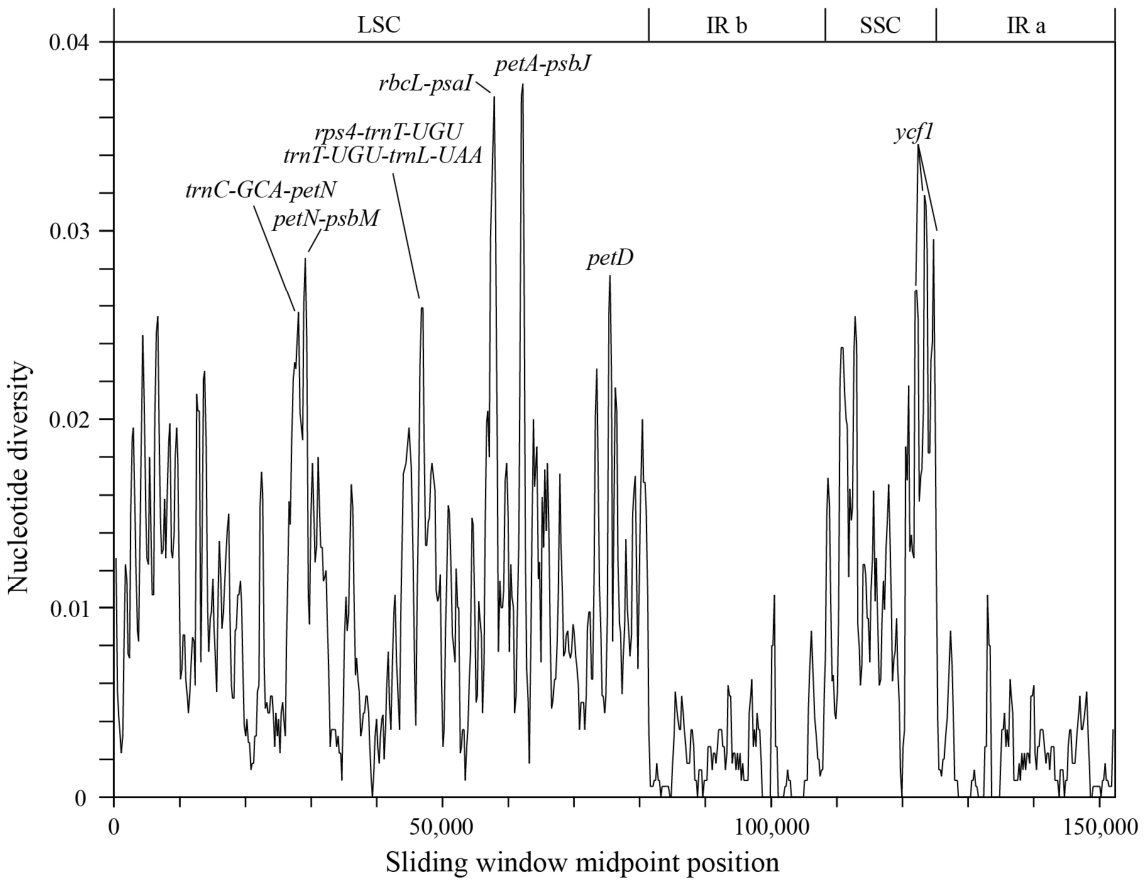
Sliding window analysis of the six Anchusa chloroplast genomes revealed nucleotide diversity (Pi) values ranging from 0 to 0.03778, with a mean Pi of 0.008129 (Figure 7). Eight fragments with Pi > 0.025 and length > 150 bp were identified as candidate sequences for species identification within Anchusa (Table 5). These included seven fragments in the LSC region (petN-psbM, rbcL-psaI, petA-psbJ, trnC-GCA-petN, rps4-trnT-UGU, trnT-UGU-trnL-UAA, petD) and one fragment in the SSC region (ycf1). Among them, petA-psbJ exhibited the highest Pi value (0.03778). Among these hypervariable regions, only one coding region (ycf1) showed elevated variability (Table 5). The remaining hypervariable fragments were located in intergenic spacer (IGS) regions. These hypervariable fragments may serve as candidate barcodes for species identification within Anchusa.

3.6. Phylogenetic Analysis

ML trees were constructed based on two datasets: complete chloroplast genomes and 78 shared CDSs from six Anchusa species, four adulterants E. vulgare, E. plantagineum, B. officinalis, and C. amabile, and three outgroup taxa.
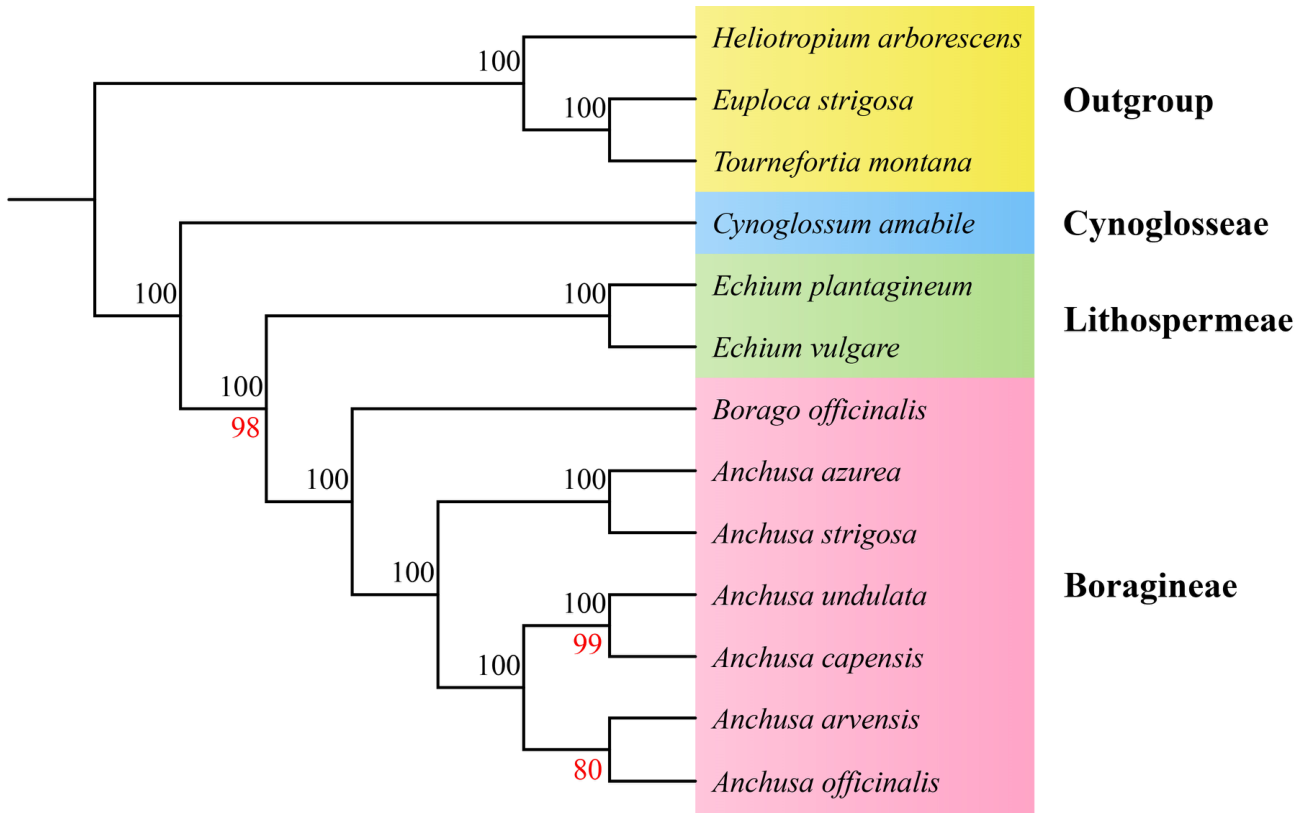
The two ML trees were topologically congruent (Figure 8). Differences in support values were observed only at some nodes. Nodes with lower support in the whole chloroplast genome tree obtained higher support in the CDS-based tree. Anchusa subg. Anchusa and Anchusa subg. Buglossum formed a clade (BS = 100%). This clade formed a sister group with Borago L. and constituted the tribe Boragineae (BS = 100%).
Within Anchusa subg. Anchusa, A. capensis was closely related to A. undulata subsp. hybrida (100% support in the whole chloroplast genome tree). A. officinalis was closely related to A. arvensis (80% support in the CDS-based tree).

4. Discussion

This study is the first comparative chloroplast genome analysis of six Anchusa species. The results not only elucidate the basic chloroplast genome features of the genus but also provide important molecular data for studies on origin identification and infrageneric phylogenetic relationships.

4.1. Conservation and Specificity of Anchusa Chloroplast Genomes

The six Anchusa chloroplast genomes were highly conserved. They showed similar genome size (150,178–150,844 bp), gene number (112), GC content (37.9%), and quadripartite structure. These features are consistent with those reported for most angiosperms [54]. Comparative genomic analysis revealed that Anchusa chloroplast genomes are highly similar overall. Single-copy regions (SSC) were more conserved than inverted repeat regions. Coding regions were more conserved than non-coding regions. Gene content, type, and arrangement were highly consistent across all species (Figure 5). IR/SC boundary gene compositions and positions were identical among all six species (Figure 6). The six sequences were collinear, and no recombination events were detectable. These findings indicate that the structure of the Anchusa chloroplast genome has remained stable during evolution. A similar pattern of conservation has been observed in other closely related groups, such as tribe Lithospermeae [55]. However, outside this lineage, as sequencing efforts have progressed, pervasive rearrangements have been revealed in plastid genomes across angiosperms, directly challenging the traditional assumption of a highly conserved structure [56]. This suggests that the absence of detectable rearrangements may represent a distinctive structural feature of the tribe Lithospermeae.
Nevertheless, structural conservation does not exclude sequence-level variation. Nucleotide diversity analysis identified eight hypervariable regions (Pi > 0.025), with petA-psbJ showing the highest variability (Pi = 0.03778). mVISTA-based visual comparison further identified four hypervariable regions: trnC-GCA-petN, psbK-psbI, rbcL-psaI and petA-psbJ. These regions are all located in intergenic spacers. They have accumulated greater variation and are therefore ideal candidates for DNA barcoding.
IR/SC boundary analysis revealed notable IR expansion in E. vulgare (Figure 6). Genes from SSC were incorporated into the IR regions. This changes its total gene number (including duplicated copies). The previously reported IR region of E. nervosum was only 19,204 bp, whereas the IR regions of E. vulgare and E. plantagineum were 30,660 and 25,754 bp, respectively. The three Echium species also exhibited different IR boundary gene compositions, suggesting considerable structural variation in the chloroplast genomes of the genus Echium [55].

4.2. Repeat Sequences and Codon Usage Bias

Repeat sequences in chloroplast genomes are an important source of evolutionary variation. They are rich in genetic information and serve as components of gene regulatory networks, regulating gene expression together with signaling molecules and cis-elements [57]. Analyzing repeat sequence distribution and abundance helps to understand genome stability, recombination hotspots, and potential evolutionary dynamics [58,59]. SSR loci are valuable for molecular marker development, species identification, population genetics, and phylogenetic studies due to their high polymorphism and codominant inheritance [60,61]. Therefore, this analysis of repeat sequences in six Anchusa chloroplast genomes provides key information for assessing genetic background, DNA barcode development, and the evolutionary history of this genus.
SSR analysis detected a total of 312 loci. Mononucleotide repeats consisting of A/T (65.31–73.68%), mainly distributed in the LSC region. This pattern is consistent with typical features of angiosperm chloroplast genome SSRs [62]. The variation in SSR numbers among species (49–57) provides a basis for future studies on intraspecific genetic diversity and species delimitation.
As shown in Figure 2, the total number of interspersed repeats in the six Anchusa species ranged from 44 to 51. Palindromic repeats were dominant, followed by forward repeats. In many angiosperms, palindromic repeats and forward repeats play key roles in maintaining chloroplast genome stability and regulating gene expression under abiotic stresses. They also promote adaptive evolution through homologous recombination. The genus Anchusa also shows a clear predominance of palindromic repeats and forward repeats. This pattern is consistent with the conserved mode observed across angiosperms. This balance reflects a trade-off between genome stability and adaptive variation facilitated by repetitive sequences [63]. Notably, the Anchusa chloroplast genomes have maintained high structural conservation during evolution. The collinearity analysis detected no rearrangement events within the genus. This is possibly because palindromic repeats primarily maintain structural stability rather than triggering large-scale rearrangements in Anchusa species.
Codon usage bias refers to the non-random selection of certain synonymous codons during translation. Although synonymous mutations do not alter the encoded amino acid sequence, growing evidence indicates that they play important roles in regulating gene expression and influencing protein structure. They are therefore not “silent” [64,65]. As previously reported, this bias results from natural selection, mutational pressure, and genetic drift over long-term evolution. This leads to variation among species and even among different genes within the same genome [66]. Generally, closely related species or those inhabiting similar environments tend to exhibit more similar codon usage patterns because of comparable selective pressures [67]. Therefore, comparative analysis of codon usage bias is important for understanding evolutionary patterns within Anchusa.
Analysis of the six Anchusa chloroplast genome sequences revealed that all 64 synonymous codons are present. Among these, 30 high-frequency codons (RSCU > 1) are identified. Except for UUG (ending in G), the remaining 29 high-frequency codons end in A or U. This indicates that codon usage in Anchusa chloroplast genomes is biased toward A/U-ending codons. This trend is consistent with findings in other angiosperms [55,68]. No significant differences in RSCU values were observed among the six Anchusa species (Supplementary Figure S1). This suggests that codon usage patterns are highly conserved within this genus.

4.3. Limitations of Conventional Barcodes and Identification of Specific Hypervariable Fragments

In plants, matK is considered one of the rapidly evolving coding regions. This is because all three codon positions evolve at nearly equal rates under relaxed purifying selection [69]. rbcL encodes the large subunit of RuBisCO [52]. It shows relatively low interspecific variability. Consequently, it is recommended for identification at the genus level and above. The psbA-trnH intergenic spacer has a high interspecific divergence rate and nearly 100% amplification success rate. Therefore, it has been widely used for species-level identification across diverse genera [70]. However, nucleotide diversity analysis revealed that three conventional barcodes (matK, rbcL, and psbA-trnH) are not the most variable markers within Anchusa. They show low nucleotide diversity (Pi = 0.01267–0.01956).
Sliding window analysis of the complete chloroplast genomes identified eight hypervariable fragments with high nucleotide diversity (Pi > 0.025) (Table 5). These include petN-psbM, rbcL-psaI, petA-psbJ, and ycf1, among others. Additionally, mVISTA-based comparison identified four hypervariable regions: trnC-GCA-petN, psbK-psbI, rbcL-psaI, and petA-psbJ. The hypervariable regions detected by the two methods partially overlapped, including trnC-GCA-petN, rbcL-psaI and petA-psbJ. Nevertheless, each method also identified exclusive regions (Table 5). This indicates differing thresholds for defining hypervariability.
mVISTA is based on global multiple alignment of complete sequences. One sequence is selected as the reference. Each query sequence is aligned to this reference. This approach preserves and visualizes large-scale insertions/deletions (indels). It displays percentage identity along the alignment [44]. In contrast, sliding window analysis excludes alignment gaps and computes average nucleotide diversity (Pi) through pairwise comparisons within non-overlapping windows [71]. That is, mVISTA quantifies sequence identity relative to a reference baseline. Nucleotide diversity (Pi) measures the mean pairwise divergence across all compared taxa. Considering the complementarity of the two methods, fragments shared by both approaches are proposed as more reliable candidates for DNA barcoding.

4.4. Phylogenetic Analysis

Phylogenetic trees were constructed using complete chloroplast genomes and the CDS datasets. They showed that all species of Anchusa subg. Anchusa formed a single clade (BS = 100%). All species of Anchusa subg. Buglossum formed another clade (BS = 100%). These two clades formed a sister group to the genus Borago. Within subg. Anchusa, A. capensis and A. undulata subsp. hybrida clustered as sister taxa (BS from whole chloroplast genome = 100%, BS from CDS = 99%). Similarly, A. officinalis and A. arvensis formed a sister pair (BS from CDS = 80%). These results provide a molecular framework for clarifying the relationships among morphologically similar species and are consistent with traditional classification based on morphological traits and with molecular phylogenetic studies using nuclear ITS and chloroplast trnL sequences [72,73].
However, our study did not include Lycopsis and Cynoglottis, or the two subgenera Buglossellum and Buglossoides, which have been segregated from Anchusa sensu lato. Therefore, the current phylogenetic tree cannot directly test or fully resolve the historically recognized paraphyly of Anchusa sensu lato.

5. Conclusions

The complete chloroplast genomes of six Anchusa species were compared. The chloroplast genomes of Anchusa are highly conserved in structure, exhibiting a typical quadripartite circular structure. Gene content, gene order, and IR/SC boundaries are consistent. No rearrangement events were detected. Sliding window analysis identified eight hypervariable fragments (Pi > 0.025). mVISTA analysis further identified four regions. Among these, rbcL-psaI, petA-psbJ, and trnC-GCA-petN were shared by both methods. These regions can serve as preferred candidate barcodes for species identification within Anchusa. Phylogenetic analyses confirmed that subg. Anchusa and subg. Buglossum each form a monophyletic clade. This result supports the taxonomic views based on morphological and molecular data.
In summary, this study elucidates the genetic structural characteristics and evolutionary relationships of Anchusa species at the chloroplast genome level. The hypervariable regions identified herein provide a solid foundation for developing efficient and accurate molecular identification methods. This will contribute to resolving the origin identification of Niushecao and provide new genomic evidence for taxonomic and systematic evolutionary studies of the genus.
However, several limitations should be acknowledged. First, each species was represented by a single sample without intraspecific replication. Therefore, the diagnostic power of the candidate markers at the species level could not be assessed. It is also difficult to distinguish intraspecific variation from interspecific divergence. Second, A. azurea was not sampled directly. Thus, the practical discrimination between the authentic medicinal material and its main adulterant, A. strigosa, could not be verified. Third, the phylogenetic analysis did not include Lycopsis, Cynoglottis, or the subg. Buglossellum and Buglossoides. Consequently, the paraphyly of Anchusa s. l. remains unresolved.
Future studies should expand sampling and include intraspecific replicates to validate marker stability. Additional evidence, such as chromosome data, should be incorporated. Nuclear genes should be integrated with chloroplast genome data for combined phylogenetic analyses. These efforts will further clarify the infrageneric classification and provide a robust taxonomic foundation for the medicinal and edible use of this genus.

Supplementary Materials

The following supporting information can be downloaded at: https://www.mdpi.com/article/10.3390/genes17090993/s1, Supplementary Figure S1. Boxplot of Kruskal–Wallis/Dunn test results for RSCU among six Anchusa.

Author Contributions

Conceptualization, L.C. and Y.-Z.Z.; methodology, Y.-Z.Z. and Y.-S.W.; software, L.C.; formal analysis, Y.-Z.Z.; investigation, Y.T.; resources, Y.T.; data curation, W.L. and L.C.; writing—original draft preparation, Y.T.; writing—review and editing, Y.T. and Y.-S.W.; visualization, X.-Q.X.; supervision, D.-N.M. and W.L.; project administration, D.-N.M. and L.C.; funding acquisition, W.L. All authors have read and agreed to the published version of the manuscript.

Funding

The High-level Talent Project in the medical and health field under the “Tianshan Talents” Training Program (TSYC202401B132); Xinjiang Local Chinese Medicine and Ethnic Medicine New Drug Research and Development Cultivation Project (2017-02-08); Central Government Major Increase and Decrease Project (2060302).

Institutional Review Board Statement

Not applicable.

Informed Consent Statement

Not applicable.

Data Availability Statement

The chloroplast genome sequences have been deposited in GenBank under accession numbers PZ016459 (A. strigosa), PZ233845 (E. vulgare). The raw sequencing data supporting these assemblies have been deposited in the NCBI Sequence Read Archive (SRA) under BioProject PRJNA1502504. The publicly available datasets analyzed in this study were obtained from GenBank, ENA, and SRA repositories. A complete list of all accession numbers and their corresponding species is provided in Table 2.

Acknowledgments

We sincerely thank the anonymous reviewers for their valuable comments and constructive suggestions, which substantially improved this manuscript. We are also deeply grateful to the relevant institutions in the Xinjiang Uygur Autonomous Region for providing all plant specimens used in this study and for their financial and infrastructural support. Thank all those who have helped us.

Conflicts of Interest

The authors declare no conflict of interest.

Abbreviations

The following abbreviations are used in this manuscript:
BSBootstrap support
CDSCoding DNA Sequence
GUCMGuangzhou University of Chinese Medicine
IGSIntergenic spacer
IRInverted repeat
JLBLSC–IRb junction
JSBSSC–IRb junction
LSCLarge single-copy
MLMaximum likelihood
RSCURelative synonymous codon usage
SSCSmall single-copy
SSRsSimple Sequence Repeats

References

  1. The Royal Botanic Gardens, Kew. Plants of the World Online. Available online: https://powo.science.kew.org/ (accessed on 14 March 2026).
  2. Yeşilada, E.; Honda, G.; Sezik, E.; Tabata, M.; Fujita, T.; Tanaka, T.; Takeda, Y.; Takaishi, Y. Traditional medicine in Turkey. V. Folk medicine in the inner Taurus Mountains. J. Ethnopharmacol. 1995, 46, 133–152. [Google Scholar] [CrossRef] [Scilit] [PubMed]
  3. Honda, G.; Yeşilada, E.; Tabata, M.; Sezik, E.; Fujita, T.; Takeda, Y.; Takaishi, Y.; Tanaka, T. Traditional Medicine in Turkey. VI. Folk Medicine in West Anatolia: Afyon, Kütahya, Denizli, Muğla, Aydin Provinces. J. Ethnopharmacol. 1996, 53, 75–87. [Google Scholar] [CrossRef] [Scilit] [PubMed]
  4. Safa, O.; Soltanipoor, M.A.; Rastegar, S.; Kazemi, M.; Nourbakhsh Dehkordi, K.; Ghannadi, A. An ethnobotanical survey on hormozgan province. Iran. Avicenna J. Phytomed. 2013, 3, 64–81. [Google Scholar] [PubMed]
  5. Al-Snafi, A.E. The pharmacology of anchusa italica and anchusa strigosa. A review. Int. J. Pharm. Pharm. Sci. 2014, 6, 7–10. [Google Scholar]
  6. Chinese Pharmacopoeia Commission. Drug Standard of Ministry of Public Health of the People’s Republic of China—Uyghur Medicine Volume; Xinjiang Science and Technology Health Publishing House: Urumqi, China, 1999; p. 14. [Google Scholar]
  7. Xu, X.Q.; Chen, L.; Zhang, J.; Sun, Y.; Qing, D.G.; Ni, H. Effects of Extracts of Anchusa italica Retz. on Anti-inflammatory,Cough-relieving and Bacteriostasis in Vitro. Her. Med. 2019, 38, 726–730. [Google Scholar] [CrossRef]
  8. Chen, Z.C.; Pang, Z.; Xu, W.W. Research on Chemical Components of NiuSheCao and Its Pharmacological Activity. West. J. Tradit. Chin. Med. 2018, 31, 140–145. [Google Scholar] [CrossRef]
  9. Liang, C.; Xiaoqin, X.; Wenhui, G.; Hajiakber, A.; Dina, M. Effects of anchusa italica Retz. on cough variant asthma and the level of TLR4/NF-κB signaling pathway. Chin. J. Clin. Pharmacol. 2024, 40, 698–702. [Google Scholar] [CrossRef]
  10. Li, M.H.; Chang, W.; Lu, W.J.; Ma, G.Z. Chemical constituents of Anchusa italica Retz. and protective effects on hypoxia/reoxygenation induced oxidative stress injury in rat primary cardiomyocyte. Northwest Pharm. J. 2020, 35, 335–340. [Google Scholar] [CrossRef]
  11. Guo, W.H.; Xu, X.Q.; Sun, Y.; Ma, G.X.; Shi, L.L.; Chen, L. Chemical constituents of Anchusa italica Retz. and their anti-inflammatory activity. Nat. Prod. Res. Dev. 2025, 37, 465–471. [Google Scholar] [CrossRef]
  12. Chou, L.Y.; Cui, Q.D.; Li, J.; Tao, H.; Huang, X.J.; Zhang, Z. Neuroprotective effect of Anchusa italica from different habitats on HT-22 cell injury induced by corticosterone. J. South-Cent. Univ. Natl. 2026, 45, 168–173. [Google Scholar] [CrossRef]
  13. Xu, X.Q.; Chen, L.; Zhang, J.; Sun, Y.; Qing, D.G. Study on the Extraction Process of Anti-inflammatory Active Part of Italian Niushecao. West. J. Tradit. Chin. Med. 2019, 32, 17–20. [Google Scholar] [CrossRef]
  14. Chen, H.M.; Li, W.J.; Qiu, J.; Ma, Z.C.; Li, B.; Yang, Z.Z.; Wen, Z.B.; Meng, Y.; Cao, Q.M.; Qiu, D.; et al. A checklist of wild vascular plants in Xinjiang. Biodivers. Sci. 2023, 31, 52–58. [Google Scholar] [CrossRef] [Scilit]
  15. Guo, W.; Teng, L.; Ma, G.Z. Identification of Anchusa italica and Its Adulterants. Chin. J. Exp. Tradit. Med. Formulae 2018, 24, 32–39. [Google Scholar] [CrossRef]
  16. Editorial Committee of Chinese Materia Medica, State Administration of Traditional Chinese Medicine. Chinese Materia Medica—Uyghur Medicine Volume; Shanghai Science and Technology Press: Shanghai, China, 2005; pp. 97–99. [Google Scholar]
  17. Yu, F.H.; Tan, Y.; Qu, L.; Li, P. Pharmacognostic Identification of Uyghur Medicine Echium vulgare. J. Chin. Med. Mater. 2014, 37, 1783–1785. [Google Scholar] [CrossRef]
  18. Liu, W.L. Pharmacognostic Identification of Anchusa italica and Its Adulterants. Master’s Thesis, Shihezi University, Shihezi, China, 2023. [Google Scholar]
  19. Chen, K.K.; Lu, H.K.; Lan, W.; Wang, Q. Microscopic and TLC identification of Anchusa italica. Lishizhen Med. Mater. Medica Res. 2016, 27, 369–371. [Google Scholar] [CrossRef]
  20. Li, X.J.; Jia, X.G.; Zhu, G.Q. DNA Barcodes of Uyghur Medicinal Plants; Xinjiang People’s Publishing House: Urumqi, China, 2015; pp. 81–82. ISBN 9787228184965. [Google Scholar]
  21. Wang, J.; Kan, S.; Liao, X.; Zhou, J.; Tembrock, L.R.; Daniell, H.; Jin, S.; Wu, Z. Plant Organellar Genomes: Much Done, Much More to Do. Trends Plant Sci. 2024, 29, 754–769. [Google Scholar] [CrossRef] [Scilit] [PubMed]
  22. Smith, D.R.; Keeling, P.J. Mitochondrial and Plastid Genome Architecture: Reoccurring Themes, but Significant Differences at the Extremes. Proc. Natl. Acad. Sci. USA 2015, 112, 10177–10184. [Google Scholar] [CrossRef] [Scilit] [PubMed]
  23. Jiang, W.J.; Guo, M.Y.; Pang, X.H. Application of Chloroplast Genome in Identification and Phylogenetic Analysis of Medicinal Plants. World Chin. Med. 2020, 15, 702–708, 716. [Google Scholar] [CrossRef]
  24. Sun, Y.F.; Xu, Y.J.; Guo, W.Y.; Wu, Y.N.; Wang, H.; Wang, M.H.; Wei, Z.X.; Zhang, L.P. Identification of Pinellia ternate and Its Adulterants Based on DNA Barcoding. J. Gansu Univ. Chin. Med. 2026, 43, 41–48. [Google Scholar] [CrossRef]
  25. Zheng, M.; Zhao, Y.; Gao, M.; Huang, M.; Song, X. Chloroplast structure, codon usage bias, and machine learning-based molecular identification using DNA barcoding of Sophorae Tonkinensis Radix et Rhizoma (Shan Dou Gen) and its analogues. Fitoterapia 2026, 188, 107005. [Google Scholar] [CrossRef] [Scilit] [PubMed]
  26. Li, L.; Sun, W.; Zhang, M.; Chen, M.; Wang, S.; Shi, Y.; Su, C.; Wang, B.; Ma, S.; Meng, X.; et al. Identification of Asari Radix et Rhizoma derived from three close Asarum species using the complete chloroplast genome. Phytomedicine 2025, 147, 157160. [Google Scholar] [CrossRef] [Scilit] [PubMed]
  27. Chen, J.H.; Cheng, W.P.; Gao, J.; Li, Y.M.; Zhang, G.; Chen, Y.; Yan, Y.G.; Zhang, M.Y. Molecular identification of medicinal Polygonatum species based on plastid divergence hotspot regions. Acta Pharm. Sin. 2025, 60, 1543–1554. [Google Scholar] [CrossRef]
  28. The Angiosperm Phylogeny Group. An update of the Angiosperm Phylogeny Group classification for the orders and families of flowering plants: APG IV. Bot. J. Linn. Soc. 2016, 181, 1–20. [Google Scholar] [CrossRef] [Scilit]
  29. Al-Adwan, S.M.; Al-Qaisi, T.S.; Jabbar, A.A.; Ismail, P.A.; Raouf, M.M.H.M.; Althagbi, H.I.; Tayeb, R.A.; Abed Wahab, B.A.; Hassan, R.R.; Abdulla, M.A.; et al. Anchusa officinalis Accelerates Wound Healing via the Improvement of Transforming Growth Factor Beta 1 Expressions, Antioxidant Levels, and Inhibition of TNF-α, IL-6. Cutan. Ocul. Toxicol. 2025, 44, 147–160. [Google Scholar] [CrossRef] [Scilit] [PubMed]
  30. Abdul-Aziz Ahmed, K.; Jabbar, A.A.J.; Raouf, M.M.H.M.; Al-Qaaneh, A.M.; Rizgar Hassan, R.; Ismael Salih, M.; Mothana, R.A.; Al-Hamoud, G.A.; Abdulla, M.A.; Hasson, S.; et al. Phytochemical Profiling, Acute Toxicity, and Hepatoprotective Effects of Anchusa limbata in Thioacetamide-Induced Liver Cirrhosis in Rats. Food Sci. Nutr. 2024, 12, 10628–10645. [Google Scholar] [CrossRef] [Scilit] [PubMed]
  31. Abdullatif, A. Anchusa Plants of Israel and Palestine. A Concise Review. World J. Pharm. Res. 2025, 14, 606–634. [Google Scholar] [CrossRef]
  32. Chen, S. fastp 1.0: An Ultra-Fast All-Round Tool for FASTQ Data Quality Control and Preprocessing. iMeta 2025, 4, e70078. [Google Scholar] [CrossRef] [Scilit] [PubMed]
  33. Jin, J.; Yu, W.; Yang, J.; Song, Y.; Depamphilis, C.W.; Yi, T.; Li, D. GetOrganelle: A fast and versatile toolkit for accurate de novo assembly of organelle genomes. Genome Biol. 2020, 21, 241. [Google Scholar] [CrossRef] [Scilit] [PubMed]
  34. Qu, X.; Moore, M.J.; Li, D.; Yi, T. PGA: A software package for rapid, accurate, and flexible batch annotation of plastomes. Plant Methods 2019, 15, 50. [Google Scholar] [CrossRef] [Scilit] [PubMed]
  35. Kearse, M.; Moir, R.; Wilson, A.; Stones-Havas, S.; Cheung, M.; Sturrock, S.; Buxton, S.; Cooper, A.; Markowitz, S.; Duran, C.; et al. Geneious Basic: An integrated and extendable desktop software platform for the organization and analysis of sequence data. Bioinformatics 2012, 28, 1647–1649. [Google Scholar] [CrossRef] [Scilit] [PubMed]
  36. Greiner, S.; Lehwark, P.; Bock, R. OrganellarGenomeDRAW (OGDRAW) Version 1.3.1: Expanded Toolkit for the Graphical Visualization of Organellar Genomes. Nucleic Acids Res. 2019, 47, W59–W64. [Google Scholar] [CrossRef] [Scilit] [PubMed]
  37. Kurtz, S. REPuter: The Manifold Applications of Repeat Analysis on a Genomic Scale. Nucleic Acids Res. 2001, 29, 4633–4642. [Google Scholar] [CrossRef] [Scilit] [PubMed]
  38. Beier, S.; Thiel, T.; Münch, T.; Scholz, U.; Mascher, M. MISA-web: A web server for microsatellite prediction. Bioinformatics 2017, 33, 2583–2585. [Google Scholar] [CrossRef] [Scilit] [PubMed]
  39. Zhao, D.; Ye, T.; Gao, F.; Jakovlić, I.; La, Q.; Tong, Y.; Liu, X.; Song, R.; Liu, F.; Lian, Z.M.; et al. PhyloSuite v2: The development of an all-in-one, efficient and visualization-oriented suite for molecular dating analysis and other advanced features. iMeta 2025, 4, e70095. [Google Scholar] [CrossRef] [Scilit] [PubMed]
  40. Maździarz, M.; Zając, S.; Paukszto, Ł.; Sawicki, J. RSCUcaller: An R package for analyzing differences in relative synonymous codon usage (RSCU). BMC Bioinform. 2025, 26, 141. [Google Scholar] [CrossRef] [Scilit] [PubMed]
  41. Wickham, H. ggplot2: Elegant Graphics for Data Analysis; Springer: New York, NY, USA, 2016. [Google Scholar] [CrossRef] [Scilit]
  42. Chen, C.; Wu, Y.; Li, J.; Wang, X.; Zeng, Z.; Xu, J.; Liu, Y.; Feng, J.; Chen, H.; He, Y.; et al. TBtools-II: A “one for all, all for one” bioinformatics platform for biological big-data mining. Mol. Plant. 2023, 16, 1733–1742. [Google Scholar] [CrossRef] [Scilit] [PubMed]
  43. Sharp, P.M.; Li, W.H. The Codon Adaptation Index—A Measure of Directional Synonymous Codon Usage Bias, and Its Potential Applications. Nucleic Acids Res. 1987, 15, 1281–1295. [Google Scholar] [CrossRef] [Scilit] [PubMed]
  44. Frazer, K.A.; Pachter, L.; Poliakov, A.; Rubin, E.M.; Dubchak, I. VISTA: Computational Tools for Comparative Genomics. Nucleic Acids Res. 2004, 32, W273–W279. [Google Scholar] [CrossRef] [Scilit] [PubMed]
  45. Menéndez, C.D.; Poczai, P.; Williams, B.; Myllys, L.; Amiryousefi, A. IRplus: An Augmented Tool to Detect Inverted Repeats in Plastid Genomes. Genome Biol. Evol. 2023, 15, evad177. [Google Scholar] [CrossRef] [Scilit] [PubMed]
  46. Darling, A.C.E.; Mau, B.; Blattner, F.R.; Perna, N.T. Mauve: Multiple Alignment of Conserved Genomic Sequence With Rearrangements. Genome Res. 2004, 14, 1394–1403. [Google Scholar] [CrossRef] [Scilit] [PubMed]
  47. Rozas, J.; Ferrer-Mata, A.; Sánchez-Delbarrio, J.C.; Guirao-Rico, S.; Librado, P.; Ramos-Onsins, S.E.; Sánchez-Gracia, A. DnaSP 6: DNA Sequence Polymorphism Analysis of Large Data Sets. Mol. Biol. Evol. 2017, 34, 3299–3302. [Google Scholar] [CrossRef] [Scilit] [PubMed]
  48. Katoh, K.; Standley, D.M. A simple method to control over-alignment in the MAFFT multiple sequence alignment program. Bioinformatics 2016, 32, 1933–1942. [Google Scholar] [CrossRef] [Scilit] [PubMed]
  49. Capella-Gutiérrez, S.; Silla-Martínez, J.M.; Gabaldón, T. trimAl: A tool for automated alignment trimming in large-scale phylogenetic analyses. Bioinformatics 2009, 25, 1972–1973. [Google Scholar] [CrossRef] [Scilit] [PubMed]
  50. Nguyen, L.; Schmidt, H.A.; von Haeseler, A.; Minh, B.Q. IQ-TREE: A Fast and Effective Stochastic Algorithm for Estimating Maximum-Likelihood Phylogenies. Mol. Biol. Evol. 2014, 32, 268–274. [Google Scholar] [CrossRef] [Scilit] [PubMed]
  51. Xie, J.; Chen, Y.; Cai, G.; Cai, R.; Hu, Z.; Wang, H. Tree Visualization By One Table (tvBOT): A Web Application for Visualizing, Modifying and Annotating Phylogenetic Trees. Nucleic Acids Res. 2023, 51, W587–W592. [Google Scholar] [CrossRef] [Scilit] [PubMed]
  52. Wicke, S.; Schneeweiss, G.M.; Depamphilis, C.W.; Müller, K.F.; Quandt, D. The evolution of the plastid chromosome in land plants: Gene content, gene order, gene function. Plant Mol. Biol. 2011, 76, 273–297. [Google Scholar] [CrossRef] [Scilit] [PubMed]
  53. Torabi, S.; Umate, P.; Manavski, N.; Plöchinger, M.; Kleinknecht, L.; Bogireddi, H.; Herrmann, R.G.; Wanner, G.; Schröder, W.P.; Meurer, J. PsbN Is Required for Assembly of the Photosystem II Reaction Center inNicotiana tabacum. Plant. Cell. 2014, 26, 1183–1199. [Google Scholar] [CrossRef] [Scilit] [PubMed]
  54. Mohanta, T.K.; Mishra, A.K.; Khan, A.; Hashem, A.; Abd_Allah, E.F.; Al-Harrasi, A. Gene Loss and Evolution of the Plastome. Genes 2020, 11, 1133. [Google Scholar] [CrossRef] [Scilit] [PubMed]
  55. Noroozi, M.; Ghahremaninejad, F.; Riahi, M.; Cohen, J.I. Phylogenomics and Plastome Evolution of Lithospermeae (Boraginaceae). BMC Plant Biol. 2024, 24, 957. [Google Scholar] [CrossRef] [Scilit] [PubMed]
  56. Cauz-Santos, L.A. Beyond Conservation: The Landscape of Chloroplast Genome Rearrangements in Angiosperms. New Phytol. 2025, 247, 2571–2580. [Google Scholar] [CrossRef] [Scilit] [PubMed]
  57. Ren, X.; Liu, Y.; Tan, Y.; Huang, Y.; Liu, Z.; Jiang, X. Sequencing and functional annotation of the whole genome of Shiraia bambusicola. G3 Genes|Genomes|Genetics 2019, 10, 23–35. [Google Scholar] [CrossRef] [Scilit] [PubMed]
  58. Zhang, H.; Qiu, X.; Zhang, Z.; Zhang, J.; Qing, Y.; Guo, Y.; Song, X.; Liang, C.; Sun, Y.; Zhao, Y.; et al. Wheat Chloroplast Pangenome Reveals Frequent Intramolecular Recombination in the Inverted Repeat Regions. BMC Plant Biol. 2025, 25, 1654. [Google Scholar] [CrossRef] [Scilit] [PubMed]
  59. Ai-Dong, H.; Jian-Dong, L.; Ru-Huai, M.; Hao, Y.; Liang-Shi, L. Distribution of Repetitive DNA Sequences Derived from Rice Genome in Genus Oryza and Family Poaceae. J. Integr. Plant Biol. 1997, 39, 577–581. [Google Scholar]
  60. Yin, Z.G.; Chen, P.Y.; Zhou, X.J.; Cao, S.; Ju, L.; Liang, H.Z. Study of Development and Utilization of SSR Molecular Markers in Artemisia argyi. Seed 2025, 44, 56–63. [Google Scholar] [CrossRef]
  61. Luo, R.; Wu, W.L.; Zhang, Y.; Li, Y.H. Application of SSR Molecular Markers in Crop Genetics and Breeding. Genom. Appl. Biol. 2010, 29, 137–143. [Google Scholar]
  62. Powell, W.; Machray, G.C.; Provan, J. Polymorphism Revealed by Simple Sequence Repeats. Trends Plant Sci. 1996, 1, 215–222. [Google Scholar] [CrossRef]
  63. Li, J.; Huang, Z.; Xu, W.; Guo, C. Comparative Chloroplast Genome and Phylogenetic Analyses of Anna and Lysionotus (Gesneriaceae) Along the Sino-Vietnamese Border. Biology 2026, 15, 352. [Google Scholar] [CrossRef] [Scilit] [PubMed]
  64. Lyu, X.; Liu, Y. Nonoptimal Codon Usage Is Critical for Protein Structure and Function of the Master General Amino Acid Control Regulator CPC-1. mBio 2020, 11, 5. [Google Scholar] [CrossRef] [Scilit] [PubMed]
  65. Liu, Y.; Yang, Q.; Zhao, F. Synonymous but Not Silent: The Codon Usage Code for Gene Expression and Protein Folding. Annu. Rev. Biochem. 2021, 90, 375–401. [Google Scholar] [CrossRef] [Scilit] [PubMed]
  66. Bulmer, M. The selection-mutation-drift theory of synonymous codon usage. Genetics 1991, 129, 897–907. [Google Scholar] [CrossRef] [Scilit] [PubMed]
  67. Du, Y.; Li, X.X.; Jia, X.B.; Hu, X.T.; Liu, Y.; Ma, Y.J. Codon preference analysis of chloroplast genome of Chinese wolfberry. Chin. Tradit. Herb. Drugs 2024, 55, 1316–1325. [Google Scholar] [CrossRef]
  68. Hejazi, F.A.; Mohammadi, P.; Soorni, A. Comparative chloroplast genomics of Teucrium species reveals genome evolution, phylogenetic relationships, and candidate molecular markers. Sci. Rep. 2025, 15, 44318. [Google Scholar] [CrossRef] [Scilit] [PubMed]
  69. Wu, T.Z.; Zhao, X.H.; Hu, X.Y.; Zhang, M.T.; Liu, X. Application Progress on DNA Barcoding Technology of Traditional Chinese Medicine. Guid. J. Tradit. Chin. Med. Pharmacol. 2019, 25, 125–130. [Google Scholar]
  70. Kress, W.J.; Wurdack, K.J.; Zimmer, E.A.; Weigt, L.A.; Janzen, D.H. Use of DNA Barcodes to Identify Flowering Plants. Proc. Natl. Acad. Sci. USA 2005, 102, 8369–8374. [Google Scholar] [CrossRef] [Scilit] [PubMed]
  71. Rozas, J.; Rozas, R. DnaSP, DNA sequence polymorphism: An interactive program for estimating Population Genetics parameters from DNA sequence data. Bioinformatics 1995, 11, 621–625. [Google Scholar] [CrossRef] [Scilit] [PubMed]
  72. Selvi, F.; Bigazzi, M. Revision of Genus Anchusa (Boraginaceae-Boragineae) in Greece. Bot. J. Linn. Soc. 2003, 142, 431–454. [Google Scholar] [CrossRef] [Scilit]
  73. Hilger, H.H. Molecular Systematics of Boraginaceae Tribe Boragineae Based on ITS1 and trnL Sequences, with Special Reference to Anchusa s.l. Ann. Bot. 2004, 94, 201–212. [Google Scholar] [CrossRef] [Scilit] [PubMed]
Figure 1. Physical maps of the complete chloroplast genomes of Anchusa species and E. vulgare L. (A) six Anchusa species; (B) E. vulgare.
Genes 17 00993 g001
Figure 2. The types and existence of interspersed repeats in the chloroplast genomes of 6 species of Anchusa. (A) Different types of interspersed repeats in each chloroplast genome. (B) Numbers of different lengths of interspersed repeats.
Genes 17 00993 g002
Figure 3. Chloroplast genome SSR analysis of Anchusa species. (A) Distribution of SSR loci across different nucleotide repeat types; (B) Distribution of SSR loci in different regions of the chloroplast genome.
Genes 17 00993 g003
Figure 4. RSCU analysis and codon usage bias heatmap of six Anchusa species. (A) Bars for each amino acid are arranged from left to right as A. strigosa, A. azurea, A. arvensis, A. capensis, A. officinalis, A. undulata subsp. hybrida. The x-axis shows the 20 standard amino acids, and the y-axis shows the corresponding RSCU values. (B) Codon preference heatmap of six Anchusa chloroplast genomes; preferred codons are highlighted in red. Hierarchical clustering of Anchusa codon preference patterns is shown on the right.
Genes 17 00993 g004
Figure 5. Visual alignment of chloroplast genome sequences of six Anchusa species (Candidate DNA barcode genes or intergenic spacer regions are highlighted in red).
Genes 17 00993 g005
Figure 6. IR boundary analysis of Anchusa chloroplast genomes and related adulterants.
Genes 17 00993 g006
Figure 7. Sliding window analysis detecting hypervariable regions in Anchusa chloroplast genomes.
Genes 17 00993 g007
Figure 8. Maximum likelihood phylogenetic trees based on complete chloroplast genomes and CDS datasets (red numbers indicate bootstrap support (BS) values at nodes where the CDS-based tree differs from the complete chloroplast genome-based tree).
Genes 17 00993 g008
Table 1. Sample information.
SpeciesSample NumberCollection Location and Time
A. strigosa Banks & Sol.CL25102901Jinghai Road, Hotan City, Hotan Prefecture, Xinjiang, 20251029
E. vulgare L.CL25102101Animal Husbandry Team, Sartam Township, Hababe County, Altay Prefecture, Xinjiang, 20251021
Table 2. List of studied species of Anchusa and relatives.
Family SpeciesAccession Number
BoraginaceaeBoragineaeA. strigosaPZ016459
A. azurea Mill.ERR14050913
Anchusa officinalis L.ERR14050915
Anchusa arvensis (L.) M.Bieb.OZ374795.1
Anchusa capensis Thunb.SRS21047483
Anchusa undulata L. subsp. hybrida (Ten.) Cout.ERR14050912
B. officinalis L.NC_046796.1
Nonea vesicaria (L.) Rchb.NC_060826.1
LithospermeaeE. vulgarePZ233845
Echium plantagineum L.NC_067370.1
CynoglosseaeC. amabile Stapf & DrummondNC_061706.1
Heliotropiaceae Heliotropium arborescens L.NC_066966.1
Euploca strigosa (Willd.) Diane & HilgerNC_084103.1
Tournefortia montana Lour.NC_066795.1
Table 3. Basic characteristics of the chloroplast genomes of Anchusa species and their adulterants.
ItemA. strigosaA. azureaA. officinalisA. capensisA. arvensisA. undulata subsp. hybridaB. officinalisE. vulgareE. plantagineumC. amabile
Genome size (bp)150,178150,812150,844150,721150,812150,749149,835154,979149,776151,532
Length of LSC (bp)79,97679,94479,89879,78079,89379,81478,84076,34880,97882,902
GC content of LSC (%)35.935.936.036.036.036.035.835.635.535.2
Length of SSC (bp)16,78216,78216,88216,87116,85716,86916,96717,31117,29017,366
GC content of SSC (%)31.831.731.731.731.731.731.431.13130.9
Length of IRs (bp)26,71027,04327,03227,03527,03127,03327,01430,66025,75425,632
GC content of IRs (%)42.842.842.842.842.842.842.741.64343.1
Total GC content (%)37.937.9037.937.9037.9037.9037.8037.4037.5037.40
Total number of genes112112112112112112112112113112
Number of protein-coding genes78787878787878787978
Number of tRNA genes30303030303030303030
Number of rRNA genes4444444444
Table 4. Gene composition of Anchusa chloroplast genomes.
Gene FunctionGene CategoryGene Name
Self-replicationLarge subunit of ribosome proteinrpl2 a,* × 2, rpl14, rpl16 *, rpl20, rpl22  × 2, rpl32, rpl33, rpl36
Small subunit of ribosome proteinrps2, rps3  × 2, rps4, rps7 a × 2, rps8, rps11, rps12 a,b,** × 2, rps14, rps15, rps16 *, rps18, rps19 a × 2
Subunit RNA polymeraserpoA, rpoB, rpoC1 *, rpoC2
Ribosomal RNAsrrn4.5 a × 2, rrn5 a × 2, rrn16 a × 2, rrn23 a × 2
Transfer RNAstrnA-UGC a,* × 2, trnC-GCA, trnD-GUC, trnE-UUC, trnF-GAA, trnfM-CAU, trnG-UCC *, trnG-GCC, trnH-GUG, trnI-CAU a × 2, trnI-GAU a,* × 2, trnK-UUU *, trnL-CAA a × 2, trnL-UAA *, trnL-UAG, trnM-CAU, trnN-GUU a × 2, trnP-UGG, trnQ-UUG, trnR-ACG a × 2, trnR-UCU, trnS-GCU, trnS-GGA, trnS-UGA, trnT-GGU, trnT-UGU, trnV-GAC a × 2, trnV-UAC *, trnW-CCA, trnY-GUA
PhotosynthesisSubunit of photosystem IpsaA, psaB, psaC, psaI, psaJ, pafI **, pafII
Subunit of photosystem IIpsbA, psbB, psbC, psbD, psbE, psbF, psbH, psbI, psbJ, psbK, psbL, psbM, psbN, psbT, psbZ
Subunit of NADH-dehydrogenasendhA *, ndhB a,* × 2, ndhC, ndhD, ndhE, ndhF a
ndhG, ndhH, ndhI, ndhJ, ndhK
Subunit of cytochrome b/f complexpetA, petB *, petD *, petG, petL, petN
Subunit of ATP synthaseatpA, atpB, atpE, atpF *, atpH, atpI
RubisCO large subunitrbcL
Other genesTranslation initiation factorinfA
MaturasematK
ProteaseclpP **
Envelope membrane proteincemA
C-type cytochrome synthaseccsA
Unknown function geneOpen reading framesycf1, ycf2 a × 2, ycf15 a × 2
a Genes in inverted repeat regions; b trans-splicing gene; * genes containing one intron; ** genes containing two introns;  × 2 genes with duplicates.
Table 5. Information on hypervariable regions in Anchusa chloroplast genomes.
No.FragmentFragment Length/bpNucleotide Diversity (Pi)Region
1trnC-GCA-petN629–8220.02567LSC
2petN-psbM854~8930.02856LSC
3rps4-trnT-UGU312~3530.02589LSC
4trnT-UGU-trnL-UAA703~7050.02589LSC
5rbcL-psaI1362~17270.03711LSC
6petA-psbJ809~8250.03778LSC
7petD1218~12310.02767LSC
8ycf15379~54030.03189SSC
Disclaimer/Publisher’s Note: The statements, opinions and data contained in all publications are solely those of the individual author(s) and contributor(s) and not of MDPI and/or the editor(s). MDPI and/or the editor(s) disclaim responsibility for any injury to people or property resulting from any ideas, methods, instructions or products referred to in the content.