Article

Purifying Selection and Interspecific Differentiation at the Myf5 Locus Inform Hybrid Identification and Genetic Management of Thai Clariid Resources

by
Phonemany Thammachak
1,2,†,
Ton Huu Duc Nguyen
1,3,4,†,
Rinrapat Nitipatpornpanya
1,3,
Anh Huynh Luu
1,3,4,
Edem Uduak Linus
1,5,
Thitipong Panthum
1,3,
Kednapat Sriphairoj
6,
Sittichai Hatachote
6,
Satid Chatchaiphan
7,
Chaiwut Grudpan
8,
Jarungjit Grudpan
8,
Suphada Kiriratnikom
9,
Jiraboon Prasanpan
10,
Orathai Sawatdichaikul
11,
Worapong Singchat
1,3,12,* and
Kornsorn Srikulnath
1,3,12,*
1
Animal Genomics and Bioresource Research Unit (AGB Research Unit), Faculty of Science, Kasetsart University, Bangkok 10900, Thailand
2
Department of Genetics, Faculty of Science, Kasetsart University, Chatuchak, Bangkok 10900, Thailand
3
Interdisciplinary Graduate Program in Bioscience, Faculty of Science, Kasetsart University, 50 Ngamwongwan, Chatuchak, Bangkok 10900, Thailand
4
Faculty of Biology Education, School of Education, Can Tho University, 3/2 Street, Ninh Kieu Ward, Can Tho 900000, Vietnam
5
Plant Genetics and Biotechnology Unit, Department of Genetics and Biotechnology, University of Calabar, Calabar PMB 1115, Nigeria
6
Faculty of Natural Resources and Agro-Industry, Kasetsart University, Chalermphrakiat Sakon Nakhon Province Campus, Sakon Nakhon 47000, Thailand
7
Department of Aquaculture, Faculty of Fisheries, Kasetsart University, Bangkok 10900, Thailand
8
Department of Fisheries, Faculty of Agriculture, Ubon Ratchathani University, Ubon Ratchathani 34190, Thailand
9
Department of Fisheries Science and Aquatic Resources, Faculty of Science and Digital Innovation, Thaksin University, Phatthalung 93210, Thailand
10
Kalasin Fish Hatchery (Betagro Public Company Limited), Kalasin 46000, Thailand
11
Department of Nutrition and Health, Institute of Food Research and Product Development, Kasetsart University, Bangkok 10900, Thailand
12
Biodiversity Center, Kasetsart University (BDCKU), Bangkok 10900, Thailand
*
Authors to whom correspondence should be addressed.
These authors contributed equally to this work.
Genes 2026, 17(8), 920; https://doi.org/10.3390/genes17080920
Submission received: 25 June 2026 / Revised: 27 July 2026 / Accepted: 1 August 2026 / Published: 4 August 2026
(This article belongs to the Section Animal Genetics and Genomics)

Abstract

Background/Objectives: Clariid catfishes are a cornerstone of Southeast Asian aquaculture, where intensive breeding and interspecific hybridization have significantly decreased genetic diversity. To address the limited understanding of growth-governing molecular determinants, we characterized the genomic architecture and evolutionary dynamics of the myogenic factor 5 (Myf5) gene, a master regulator of myogenesis, in 511 individuals from 17 catfish populations in Thailand. Methods: A total of 511 individuals representing 17 catfish populations were analyzed. A 334-bp fragment of exon 1 of the Myf5 gene was sequenced using Illumina short-read technology. Genetic diversity indices were calculated to evaluate sequence variation, population structure, and selective constraints acting on the locus. Results: Sequence analysis of a 334-bp segment of exon 1 using Illumina short-read technology identified 17 haplotypes and 92 variable sites, which revealed moderate allelic richness despite low overall nucleotide diversity (π ≈ 0.008). Evolutionary analyses indicated that the Myf5 locus is governed by stringent purifying selection (ω = 0.063), wherein site-specific constraints preserve the stability of the α-helix folding architecture, which is essential for myogenic regulation. Population genetic analyses revealed substantial differentiation among taxa (56% among-population variation), while Bayesian clustering successfully resolved a hierarchical structure (K = 2) that distinguished Clarias gariepinus, Clarias macrocephalus, and Clarias batrachus. These findings demonstrate that species-specific Myf5 haplotypes serve as diagnostic markers for identifying parental species and assisting in the identification of F1 hybrid stocks. Conclusions: Overall, this study provides the molecular markers for species identification, broodstock authentication, hybrid detection, and sustainable genetic management of Thai Clariid resources, which are critical for balancing production efficiency with the conservation of native biodiversity in Southeast Asia.

1. Introduction

Clariid catfishes, most notably African catfish (Clarias gariepinus), an introduced species in Thailand, together with the native bighead catfish (Clarias macrocephalus) and walking catfish (Clarias batrachus), constitute the primary aquaculture taxa across Southeast Asia and play a vital role in food security and economic infrastructure of Thailand. These species are essential sources of high-quality protein and polyunsaturated fatty acids, with a national production of approximately 100,000 tons and a market value exceeding US$150 million in 2020 [1]. The long-term sustainability of this industry, which is increasingly focused on preserving genetic resources, depends on its ability to monitor and manage the genetic health of both wild and hatchery-reared stocks [2]. Significant interspecific variation in growth performance has been consistently documented, with C. gariepinus demonstrating superior growth rates to C. macrocephalus and C. batrachus [3,4,5,6]. To exploit these advantageous traits, a hybridization program between female C. macrocephalus and male C. gariepinus was initiated in 1987 to integrate rapid growth and enhanced disease resistance. By 2004, these hybrids reportedly accounted for >90% of the total catfish production in Thailand [4,5,7]. Although the recent availability of high-quality chromosome-level genome assemblies has provided a robust genomic framework for this genus [8,9,10], the specific molecular drivers of these growth disparities remain only partially understood. Although these selective breeding strategies have substantially improved productivity, they have concurrently contributed to a decline in genetic diversity. The repeated use of limited broodstock lines of limited size has increased inbreeding/outbreeding risk, leading to reduced survival and reproductive capacity [4]. Moreover, the extensive application of interspecific hybridization poses a threat to native species, particularly C. macrocephalus and C. batrachus, through genetic introgression, which may lead to population displacement [6,11]. Although genes associated with muscle growth are beginning to be identified owing to advances in comparative transcriptome analyses [12], a critical gap remains in our understanding of specific master regulatory genes, such as myogenic factor 5 (Myf5), which serve as key regulators of myogenic development and may contribute to species- and population-specific variation in growth traits.
The myogenic regulatory factor (MRF) family, including Myf5, MyoD, myogenin, and MRF4, is central to the regulation of skeletal muscle growth. These proteins function as basic helix–loop–helix (bHLH) transcription factors that dimerize with E-proteins and bind to E-box sequences for activating muscle-specific gene expression [13]. Among MRFs, Myf5 is typically expressed at the earliest stage of myogenesis during somitogenesis, where it plays a pivotal role in the determination and proliferation of myogenic precursor cells [14]. DNA sequence analyses indicate that Myf5 is highly conserved among teleosts and encodes a protein with a characteristic bHLH domain responsible for DNA binding and transcriptional regulation [15,16,17,18,19,20,21]. In fishes, skeletal muscle growth occurs through both hyperplasia and hypertrophy, which are tightly coordinated by MRFs, including Myf5 [13,22]. Beyond its developmental role, Myf5 expression is affected by nutritional factors and environmental stressors, such as dietary carbohydrate levels, amino acid supplementation, and ammonia stress, highlighting its significance in physiological adaptation and muscle growth regulation [23,24,25,26]. Considering these essential functions, Myf5 is expected to be under stringent evolutionary constraints, which are typically quantified through the dN/dS ratio (ω). However, a significant knowledge gap persists regarding the molecular evolution and allelic diversity of Myf5 among Clarias species and populations, where the interplay between intensive selection in aquaculture and genetic drift in wild habitats may shape unique genomic signatures. Myf5 was selected as the focal candidate locus for this study because it combines strong functional relevance with potentially informative interspecific and population-level sequence variation. As an early regulator of myogenic commitment, Myf5 is expected to retain conserved coding regions under functional constraint, while polymorphic sites outside the most constrained residues may still preserve lineage-specific genetic signals. Such candidate functional loci are not substitutes for genome-wide neutral markers, but they can provide complementary information for species discrimination, assessment of allelic differentiation, and evaluation of introgression in closely related taxa. Resolving the complex population architecture of Thai catfish requires an integrated approach that extends beyond single-gene studies. The widespread distribution of hybrids and potential for overlapping genetic variations at microgeographic scales often obscure clear species boundaries. In addition to the focal analysis of Myf5, we evaluated population subdivision using a three-locus nuclear dataset comprising Myf5, myostatin b (Mstnb), and growth hormone 1 (GH1) gene loci. These loci were included as complementary candidate-gene markers rather than as substitutes for genome-wide neutral SNPs. Importantly, multilocus analyses were restricted to individuals for which genotypes at all three loci could be matched using consistent specimen identifiers. This multi-locus framework is essential for the sustainable management of both wild and cultured genetic resources, which currently face threats from hybridization and reduced genetic diversity.
Despite the recognized importance of Myf5 in myogenesis, a significant knowledge gap exists regarding its high-resolution allelic diversity and the molecular signatures of adaptation across wild and cultured Thai Clarias populations. This is particularly pronounced in the context of interspecific hybridization, where a lack of comparative genomic data on Myf5 limits the ability to delineate species-specific lineages and resolve complex population structures. Therefore, in this study, we addressed the question of how molecular variation within the Myf5 locus reflects evolutionary selective pressure and contributes to the hierarchical genetic architecture of clariid catfishes. The exon 1 fragment was selected following comparative screening of available genomic sequences, which indicated that this region contains a relatively high density of informative polymorphic sites while remaining within a functionally relevant coding region. This combination made the fragment suitable for testing whether locus-specific variation could provide complementary resolution of species identity and population differentiation. We hypothesized that although the Myf5 gene is subjected to stringent purifying selection to preserve its essential myogenic regulatory function, it harbors sufficient population-specific polymorphisms to differentiate between native species and their hybrids. Our primary purpose in this study was to characterize the genomic architecture of the Myf5 exon 1 region in 511 individuals, allowing us to evaluate the distribution of genetic diversity within and among species. In this experimental framework, the independent variables were 17 distinct sampling locations, and 11 cultured and six wild populations of four population types (C. gariepinus, C. macrocephalus, C. batrachus, and their hybrids). The dependent variables included several key genetic indices such as allelic and haplotype variations, population differentiation parameters, and evolutionary signatures. By integrating Bayesian clustering with phylogenetic reconstruction, we aimed to determine whether Myf5 variation could support species discrimination, assessment of population structure, and monitoring of parental contributions in hybrid stocks. The findings are expected to provide a genetic baseline for broodstock identification, hybrid monitoring, and conservation-oriented management of native catfish populations in Thailand. Accordingly, the dataset generated in this study was used to address three related objectives: to assess whether variation at the Myf5 locus can distinguish closely related Clarias species and hybrid individuals, to compare genetic diversity and population differentiation among wild and hatchery-derived populations, and to evaluate how integration of Myf5 data with Mstnb and GH1 data improves the resolution of population structure. Together, these analyses link locus-specific variation with the broader challenges of introgression monitoring, broodstock management, and conservation of native catfish genetic resources.

2. Materials and Methods

2.1. Specimen Acquisition and Genomic DNA Isolation

In total, 511 catfish specimens, comprising both cultured and wild individuals, were collected from 17 distinct sampling sites across Thailand (Figure 1; Table S1), including 11 cultured populations and 6 wild populations. The study dataset included three populations of African catfish, twelve populations of bighead catfish, one population of walking catfish, and one hybrid population, sourced from various provinces nationwide (Figure 1; Table S1). The sampling effort among taxa was uneven because of differences in specimen availability. Specifically, C. macrocephalus and C. gariepinus were represented by 12 and three populations, respectively, whereas C. batrachus and the hybrid group were each represented by a single population. Therefore, estimates for the latter groups should be interpreted as population-specific observations rather than species-wide estimates. For each specimen, a small fin-tissue fragment (approximately 0.3 × 0.3 cm) was excised from the caudal fin and preserved in 95% ethanol in 1.5 mL microcentrifuge tubes, which were subsequently stored at 4 °C until further analysis. All sampling procedures were performed with explicit authorization from farm owners or relevant local authorities, and all individuals were promptly released back into their culture systems or natural habitats following tissue collection. These experimental protocols, conducted in strict accordance with institutional regulations and the Animal Research Reporting of In Vivo Experiments (ARRIVE) guidelines (https://arriveguidelines.org), were approved by the Animal Experiment Committee of Kasetsart University (Approval Nos. ACKU65-SCI-003, ACKU66-SCI-006, and ACCU66-SCI-014). Genomic DNA was isolated using a standard salting-out protocol described by Supikamolseni et al. [27]. To ensure the integrity of downstream analyses, the quality and concentration of extracted DNA were evaluated by 1% agarose gel electrophoresis and spectrophotometric quantification using a NanoDrop 2000 (Thermo Fisher Scientific, Wilmington, DE, USA).

2.2. Selection of Target Loci and Candidate Gene Characterization

The Myf5 gene was identified by aligning in-house whole-genome sequencing (WGS) data with homologous sequences from various teleosts, which were retrieved from public data repositories (Table S3). The initial comparative analysis delineated a genomic architecture comprising three exons and two introns. Exon 1 exhibited the highest nucleotide variability. As this specific region contained a dense concentration of informative polymorphic sites that provided the resolution required for robust haplotypic diversity and phylogenetic analyses, it was designated as the primary target locus for this study. Sequence evaluations were performed to ensure that the selected exons, representing the most divergent segments of the gene, were optimal for distinguishing the studied catfish populations.

2.3. PCR Amplification and Illumina-TM Short-Read Sequencing

A partial region of the Myf5 gene exon 1 was amplified by polymerase chain reaction (PCR). The amplification employed the primer pair Myf5_Catfish_CGA_F1 (5′-TCATCTCTCCTCTCCTCCAC-3′) and Myf5_Catfish_CGA_R1 (5′-TGTAGTTGATGGCGTTCCTC-3′), which we designed based on the chromosome 12 sequence of African catfish (C. gariepinus; accession number NC071111.1). An 8-bp sample-specific barcode sequence was incorporated at the 5′ end of the forward primer (Macrogen Inc., Seoul, Republic of Korea). PCR assays were conducted in a total reaction volume of 15 μL, comprising 50 ng of genomic DNA, 1× standard Apsalagen reaction buffer, 1.5 mM MgCl2, 0.2 mM of each dNTP, 0.5 μM of each primer, and 0.5 U Taq DNA polymerase (Apsalagen Co., Ltd., Bangkok, Thailand).
PCR amplification was carried out under the following thermal cycling conditions: an initial denaturation at 95 °C for 10 min; followed by 40 cycles comprising denaturation at 95 °C for 30 s, annealing at 60 °C for 30 s, and extension at 72 °C for 30 s; and a final extension step at 72 °C for 5 min. The amplified products were then examined by electrophoresis on a 1.5% agarose gel. To minimize the risk of false haplotype detection, each sample was independently amplified in triplicate. In total, 92 samples per pool set were amplified using distinct barcode-labelled primers, followed by grouping into nine separate pools and sequencing using a paired-end short-read approach on the Illumina NovaSeq™ 6000 platform (Novogene Co., Ltd., Singapore).

2.4. Raw Data Filtering and Bioinformatics Quality Assessment

The quality of the 334-bp paired-end reads was evaluated using FastQC version 0.11.9 [28], which allowed for the implementation of a stringent quality score threshold (q > 20). Following this initial assessment, individual amplicon sequences of Myf5 haplotypes were processed using the AmpliSAS pipeline [29] (https://onlinelibrary.wiley.com/doi/full/10.1111/1755-0998.12453, accessed on 18 March 2026), which facilitated clustering, filtering, and assignment of haplotypes to each specimen based on read counts. To eliminate potential sequencing artifacts and exclude samples with insufficient coverage, a minimum amplicon depth of 100 reads was required. In accordance with the diploid nature of catfish species [30], the maximum number of haplotypes per individual was restricted to two, which ensured the accurate scoring of haplotypes. True alleles at a given position within the nucleotide sequence were identified by applying a degree-of-change criterion based on the sequencing depth, whereas all other parameters were maintained at default settings following the recommendations of Lighten et al. [31]. Genotypes were classified as homozygous when the dominant haplotype frequency exceeded 80%, whereas individuals with two comparable haplotypes were designated as heterozygous. Each identified haplotype was further compared with Myf5 sequences archived in the National Center for Biotechnology Information (NCBI) database using the BLASTn algorithm (https://blast.ncbi.nlm.nih.gov/Blast.cgi, accessed on 18 March 2026), with a minimum sequence identity of 90% required for species-level identification. Finally, all sequences were aligned and mapped to the reference Myf5 gene of African catfish (accession number: XM_053509129), and subsequently translated into amino acid sequences using Geneious Prime version 2025.0.2 (https://www.geneious.com) to screen for the presence of premature stop codons.

2.5. Genetic Diversity Assessment and Statistical Analysis of Myf5 Allelic Variation

To establish a detailed profile of the nucleotide diversity of the Myf5 gene, based on aligned 334-bp sequences of exon 1, we performed DNA polymorphism analyses using DnaSP version 6.12 [32]. For each population, we estimated several key diversity indices, including the number of segregating sites (S), number of alleles (h), allelic diversity (Hd), nucleotide diversities (π), and the average number of nucleotide differences (k). We also calculated additional genetic diversity parameters, including the allelic frequency, observed number of alleles (Na), number of effective alleles (Ne), and both observed (Ho) and expected (He) heterozygosity using GenAlEx version 6.5 [33]. This software was also used to assess the fixation index (F) and deviations from Hardy–Weinberg equilibrium (HWE), which are essential for identifying potential selective pressures or non-random mating patterns within Clarias populations. To explore the genetic architecture and differentiation among these populations, we examined F-statistics (FIS and FST) and allelic richness (AR) using FSTAT version 2.9.3 [34] as described by Budi et al. [35]. We also performed an Analysis of Molecular Variance (AMOVA) using Arlequin version 3.5.2.2 [36] to determine the distribution of genetic variation across different hierarchical levels.

2.6. Phylogenetic Reconstruction and Evolutionary Divergence of Myf5 Lineages

Nucleotide sequences of the Myf5 gene from flathead grey mullet (Mugil cephalus, XM047575926) and representative catfish species Trichomycterus rosablanca (XM063007419), Silurus meridionalis (XM046873826), Pangasianodon hypophthalmus (XM026909928), Neoarius graeffei (XM060903546), Hemibagrus wyckioides (XM058417451), Ictalurus punctatus (XM017493744), Ictalurus furcatus (XM053650830), Tachysurus fulvidraco (XM027155249), Tachysurus vachellii (XM060889611), C. gariepinus (XM053509129), and C. batrachus (KX258952) were obtained from the NCBI database using BLASTn (https://blast.ncbi.nlm.nih.gov/Blast.cgi, accessed on 18 March 2026), by applying thresholds of >70% sequence identity and >85% query coverage. The retrieved sequences were aligned separately using MAFFT v7.490 (https://mafft.cbrc.jp/alignment/software, accessed on 18 March 2026), using the alignment strategies typically employed for protein-coding genes. The optimal nucleotide substitution model was determined using ModelFinder (https://iqtree.github.io/ModelFinder, accessed on 18 March 2026) based on the Bayesian Information Criterion (BIC), which identified the GTR + G model as the best fit [37]. This model was subsequently applied to all downstream phylogenetic analyses.
To determine the phylogenetic relationships of the gene sequences, we used the Maximum Likelihood (ML) and Bayesian Inference (BI) methods. ML analyses were conducted using IQ-TREE v1.6.12 (https://iqtree.github.io, accessed on 18 March 2026), which used 10,000 ultrafast bootstrap replicates to ensure robust branch support estimates. BI analyses were performed using MrBayes v3.2.6 [38] (https://nbisweden.github.io/MrBayes, accessed on 20 March 2026), implemented within the Geneious Prime 2025.0.2 platform (https://www.geneious.com). This process involved running five Markov chain Monte Carlo (MCMC) chains for 2,000,000 generations, with sampling at every 5000 generations. To ensure parameter convergence, the initial 200,000 generations (10%) were discarded as burn-in. The resulting phylogeny was rooted using M. cephalus, a non-Siluriformes teleost species, which was designated a priori as the outgroup. For the final visualization and editing of phylogenetic trees, we utilized the Interactive Tree of Life (iTOL) v5 [39] (https://itol.embl.de/), which provides a comprehensive suite for graphical tree management. Pairwise genetic distances between sequences were calculated in MEGA 11 (https://www.megasoftware.net/) using the Kimura two-parameter (K2P) model.

2.7. Evaluation of Selective Pressures and Locus-Specific Evolutionary Constraints

To evaluate the selective pressures acting on the Myf5 gene in Thai catfishes, we calculated the dN/dS ratio (ω), which represents the balance between non-synonymous (dN) and synonymous (dS) substitution rates per site. These values were estimated using the Nei–Gojobori method [40] along with a Jukes–Cantor correction, which was implemented in MEGA version 10.2.2 [41]. In this framework, an ω value near 1 indicates neutral evolution, whereas values significantly greater than 1 suggest positive selection and those below 1 indicate purifying selection. We also utilized the Branch-Site Unrestricted Statistical Test for Episodic Diversification (BUSTED), which was implemented on the Datamonkey server (https://www.datamonkey.org), to evaluate whether specific lineages, treated as foreground branches, exhibited elevated ω estimates. Statistical significance (p < 0.05) was established through a Likelihood Ratio Test (LRT) that compared an unconstrained model, where at least one site on at least one branch may experience diversifying selection (ω > 1), against a null model where such selection is strictly prohibited (ω ≤ 1) [42]. To further define the specific mode of selection, we performed several neutrality tests, including Tajima’s D, Fu and Li’s F*, and Fu and Li’s D*, using DnaSP version 6.12 [32]. The raw p-values that were derived from all neutrality tests across the diverse study populations were adjusted using the Benjamini–Hochberg False Discovery Rate (FDR) method, which accounts for the potential inflation of Type I errors due to multiple comparisons. This correction procedure was implemented in R version 4.5.2 [43] using the stats package (https://stat.ethz.ch/R-manual/R-devel/library/stats/html/00Index.html, accessed on 18 March 2026), where statistical significance was strictly determined using a q-value threshold of q < 0.05. Moreover, we investigated potential selective sweeps by plotting the He and FIS values for the Myf5 gene, which were derived from the genotyping data. Following the criteria described by Reddy et al. [44], the presence of high FIS and low He suggests purifying or sweeping selection, whereas a combination of low FIS and high He indicates neutral or balancing selection. Codon-level selection analyses were also conducted using the Datamonkey platform (https://www.datamonkey.org) with three complementary statistical models: (i) MEME (Mixed-Effects Model of Evolution), which detects episodic diversifying selection at individual codon sites [45]; (ii) FEL (Fixed-Effects Likelihood), which identifies sites under pervasive selection across the entire phylogeny [46]; and (iii) FUBAR (Fast Unconstrained Bayesian Approximation), which utilizes a Bayesian framework to infer codons evolving under persistent positive or purifying selection [47]. The statistical significance for these analyses was established using a threshold of p ≤ 0.01 for likelihood-based methods and a posterior probability (PP) of ≥ 0.9 for the Bayesian approach.

2.8. Multiple Sequence Alignment and Comparative Analysis of Myf5 Residues

Reference sequences of Myf5 genes from different species (M. cephalus (XM047575926), T. rosablanca (XM063007419), S. meridionalis (XM046873826), P. hypophthalmus (XM026909928), N. graeffei (XM060903546), H. wyckioides (XM058417451), I. punctatus (XM017493744), I. furcatus (XM053650830), T. fulvidraco (XM027155249), T. vachellii (XM060889611), C. gariepinus (XM053509129), and C. batrachus (KX258952)) were retrieved from NCBI Protein database (https://blast.ncbi.nlm.nih.gov/Blast.cgi, accessed on 18 March 2026). The BLASTp analysis was conducted using thresholds of >60% sequence identity and >85% query coverage [48,49]. The amino acid residues of the Myf5 haplotypes identified in this study and the reference sequences of other catfish species were aligned using ClustalW in Geneious Prime version 2025.0.2 (https://www.geneious.com).
After trimming the sequence alignment to 100 residues, we constructed a Bayesian phylogenetic tree using MrBayes v3.2.6, which employs MCMC analysis for 2,000,000 generations. This analysis, which utilized four chains and sampled every 1000 generations with a 25% burn-in, assessed branch support through posterior probabilities derived from two independent runs. To characterize the protein architecture, we predicted secondary structures using the PSIPRED Workbench (https://bioinf.cs.ucl.ac.uk/psipred, accessed on 18 March 2026). As a master myogenic regulatory factor, Myf5 directs early determination of muscle precursor cells. Therefore, amino acid substitutions within conserved regions, which may impair DNA-binding or interactions with other regulatory partners, can disrupt muscle cell proliferation and differentiation. Such modifications are expected to influence the efficiency of myogenic commitment, which ultimately modulates the basal growth regulatory pathway by either enhancing activity or altering cellular processing [50].

2.9. AlphaFold 3-Based Tertiary Structure Prediction and Functional Domain Alignment

The amino acid sequences that were derived from the partial exon 1 region of the Myf5 gene were used to predict three-dimensional (3D) protein structures through the AlphaFold 3 prediction server (https://alphafoldserver.com/, accessed on 18 June 2026), which represents a cutting-edge platform for highly accurate molecular modeling [51]. The resulting structural models were visualized using BIOVIA Discovery Studio (Dassault Systèmes, San Diego, CA, USA) and subsequently evaluated for stereochemical quality using PROCHECK [52], where a Ramachandran plot analysis was conducted to examine the backbone integrity and conformational stability of the predicted residues. High-confidence models were then aligned and compared with a reference protein sequence obtained from the UniProt database (https://www.uniprot.org/) to identify conserved structural domains that may indicate functional similarities.

2.10. Assessment of Gene Pool Structure Through Integrated Polymorphisms of Myf5 with Mstnb and GH1

We characterized the genetic structure of the sampled populations using STRUCTURE v2.3.4 [53], following the multi-locus methodology optimized by Budi et al. [54]. To enhance genomic power of resolution, we integrated Myf5 sequence data with data from the myostatin b (Mstnb) and growth hormone 1 (GH1) genes. The Mstnb and GH1 sequences used in this study were not derived from independent public datasets, but rather from our previously published datasets generated from the same individuals analyzed here. These sequences have been deposited in public repositories under accession numbers PX961328–PX961335 (Mstnb) and PQ877069–PQ877074 (GH1) and were retrieved for integrated multilocus analyses [55,56]. The optimal number of genetic clusters (K) was determined using the ΔK method, based on changes in the log probability of the data, ln Pr(X|K), as implemented in the ΔK method, which was implemented via StructureSelector [57].
To complement Bayesian inference, we executed a Discriminant Analysis of Principal Components (DAPC) using the ADEGENET 2.0 package [58] in R v4.3.2 [43], which facilitated identification of genetic subdivisions without assuming Hardy–Weinberg equilibrium. Pairwise genetic distances (p-distance) for the 334-bp Myf5 exon 1 sequences were calculated using MEGA 12 [59]. The resulting distance matrix served as the input for Principal Coordinate Analysis (PCoA) performed in R using the vegan package (https://cran.r-project.org/web/packages/vegan/index.html, accessed on 18 June 2026), where outputs were rendered using ggplot2 (https://cran.r-project.org/web/packages/ggplot2/index.html, accessed on 18 June 2026). In this visualization, individuals were color-coded according to species to illustrate the correlation between sequence divergence and population clustering [43].

3. Results

3.1. Analysis of Myf5 Locus Architecture and Interspecific Genetic Variation

Initial screening of in-house whole-genome sequencing data against public databases identified the Myf5 gene as one of the most polymorphic loci based on SNP density (Table S3). Sequence characterization revealed a gene structural architecture comprising three exons and two introns. A comparative genomic sequence analysis using entries from public data repositories that included representative catfishes and distinct teleosts demonstrated an uneven distribution of nucleotide variation, with exons 1 and 2 emerging as a disproportionately polymorphic region. This 334-bp segment contained 92 variable sites (Table S4), providing a high density of informative markers essential for effective haplotypic differentiation. Moreover, the observed transition/transversion ratio (12/11) and presence of unique species-specific SNPs within this region confirmed its suitability for high-resolution genomic analysis.

3.2. Patterns of Molecular Variation and Genetic Differentiation Within and Among Clarias Lineages

We characterized a 334-bp partial fragment of the Myf5 gene, which corresponds to the terminal region of exon 1, from 511 individuals representing 17 distinct populations (Table S2). Compared with the C. gariepinus reference sequence (XM_053509129), this analysis revealed 17 haplotypes (Table S3). Among these, Clarias_Myf5TH1 emerged as the most prevalent variant, occurring in 13 of 17 sampled populations. By contrast, several populations harbored private haplotypes with highly restricted distributions. For instance, we identified haplotypes unique to specific wild and cultured populations, including SNK3-CM-W (Clarias_Myf5TH4 and Clarias_Myf5TH6), UBR-CB-C (Clarias_Myf5TH9 and Clarias_Myf5TH10), and SNK2-CM-W (Clarias_Myf5TH14 and Clarias_Myf5TH15). Moreover, Clarias_Myf5TH11, Clarias_Myf5TH16, and Clarias_Myf5TH17 were restricted to a single population each, specifically SBR-CM-C, KSN2-CG-C, and YLA-CM-C, respectively. At the species level, we identified several diagnostic haplotypes confined to specific taxa (Table S3). Two haplotypes (Clarias_Myf5TH13 and Clarias_Myf5TH17) were found exclusively in C. gariepinus, whereas five haplotypes (Clarias_Myf5TH4, Clarias_Myf5TH6, Clarias_Myf5TH11, Clarias_Myf5TH14, and Clarias_Myf5TH15) were specific to C. macrocephalus. One haplotype (Clarias_Myf5TH10) was only detected in the single sampled C. batrachus population. Because C. batrachus and the hybrid group were each represented by only one population, these observations should not be interpreted as evidence of species-wide specificity and require validation using additional populations throughout the species’ ranges.
Genetic variation at the Myf5 exon 1 locus, which displayed substantial heterogeneity across the 17 sampled populations, was characterized at the sequence level to evaluate population-specific diversity patterns (Table S3). The number of segregating sites (S) ranged from 1 to 13, with the highest values observed in populations SNK1-CM-W1, SNK2-CM-W, and SNK3-CM-W. Similarly, the number of haplotypic (h) varied between 2 and 8, with the highest levels observed in SNK2-CM-W and SNK3-CM-W; notably, four populations (SPB1-CM-W, SPB2-CM-W, SKW-CM-C, and PLG-CM-C) were found to be monomorphic. Although the polymorphic populations exhibited uniformly high allelic diversity (Hd = 1.000), the average number of nucleotide differences (k) showed marked spatial variation, ranging from 1.000 in UBR-CM-C, CR-CM-C, and YLA-CM-C to 7.000 in NPT-CM-W (Table S4). At the haplotypic level, the Na and π across populations were 3.353 ± 0.549 and 0.008 ± 0.007, respectively, indicating a relatively low nucleotide diversity despite a moderate level of AR (Table 1). The mean AR was estimated to be 3.35 ± 2.20, while the Ne averaged 1.80 ± 0.87. The Ho and He heterozygosities were 0.387 ± 0.081 and 0.325 ± 0.065, respectively, representing a statistically significant difference (p < 0.05) across the dataset. Within the African catfish lineage, the KSN2-CG-C population exhibited the highest He, whereas the NYK-CG-C population exhibited the lowest variation. Among the bighead catfish populations, SNK1-CM-W had the highest He (Table 1).
Haplotype frequencies in most populations were consistent with Hardy–Weinberg equilibrium (p > 0.05), although significant deviations (p < 0.01) were detected in populations KSN2-CG-C, SNK1-CM-W, and SNK3-CM-W. FIS showed spatial variation, where positive values were observed for KSN2-CG-C and SNK1-CM-W, and negative values were detected in the remaining populations (Table S5). FST values ranged from −0.333 to 0.948, with a mean FIS of −0.17 ± 0.19 (Table 1). AMOVA revealed that the majority of genetic variation (56%) was partitioned among populations, followed by variation among individuals (24%) and within individuals (20%) (Table S6). Notably, the overall difference between mean Ho and He was statistically significant, whereas pairwise comparisons at the population level remained inconclusive owing to allele fixation (Ho = 0) in several groups and the inherent limitations of analyses based on a single genetic locus (Tables S7–S9).

3.3. Molecular Phylogeny and Diversification Patterns of the Myf5 Locus in Clarias

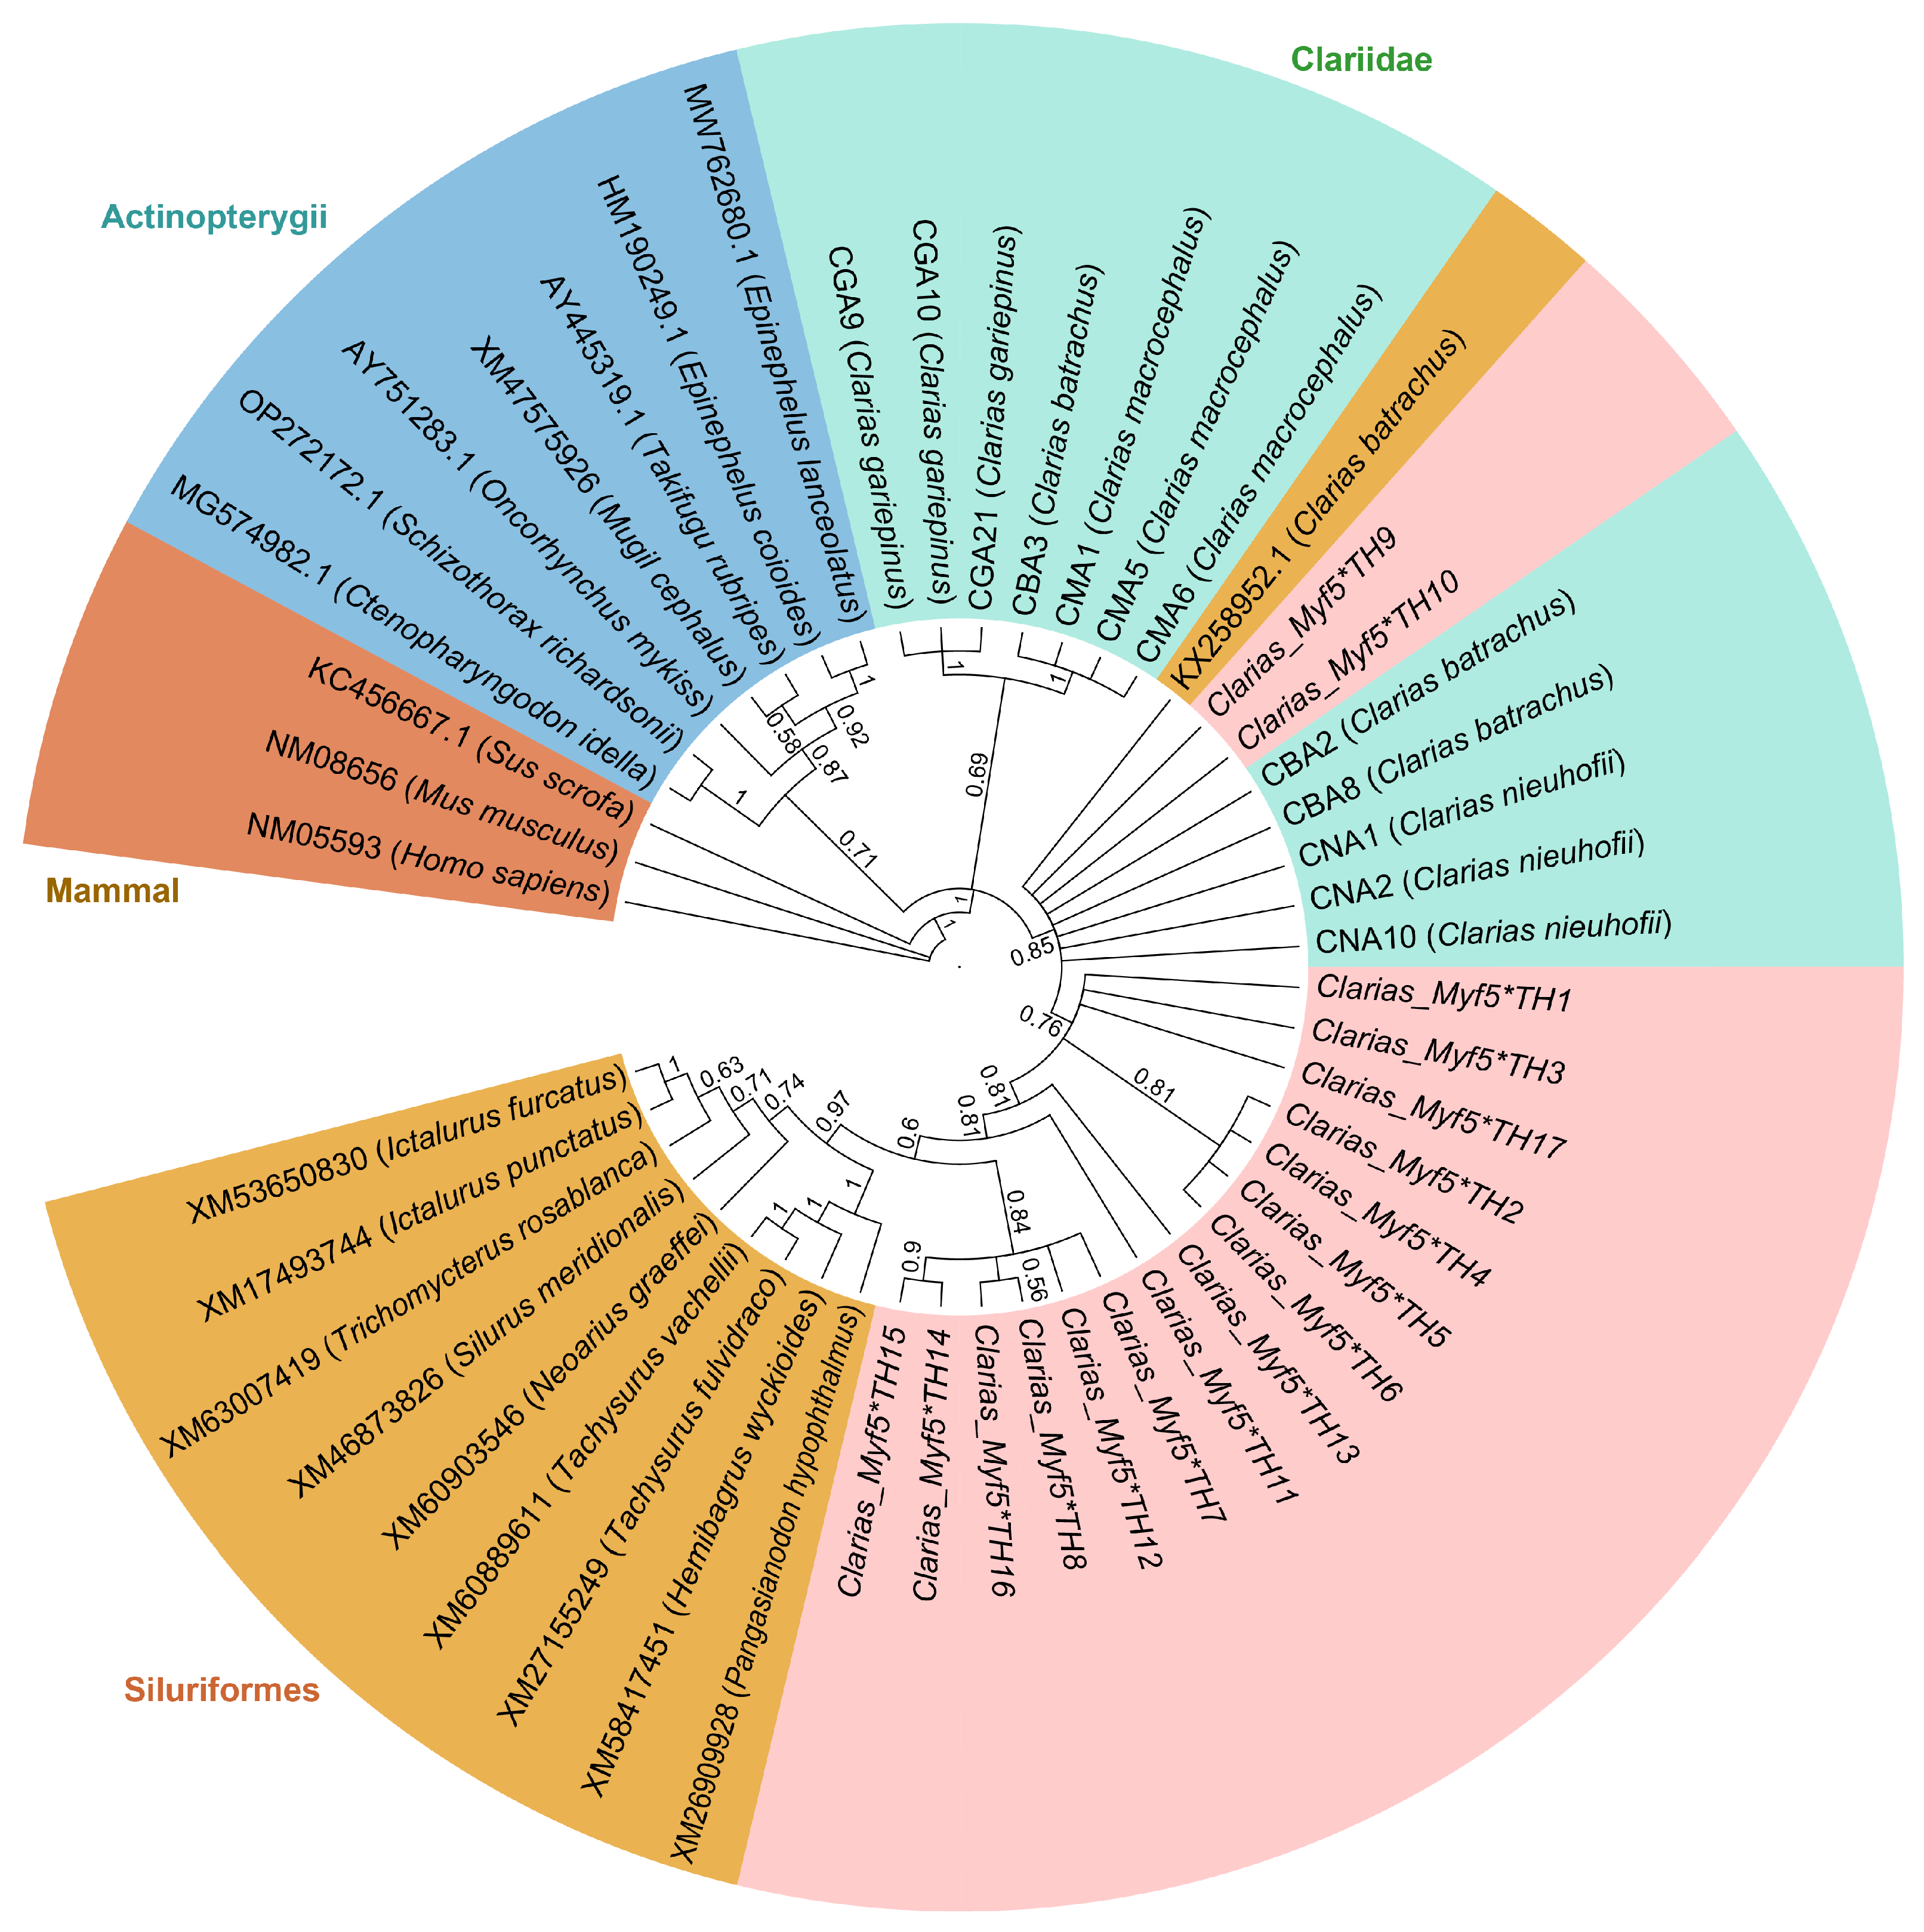
Bayesian phylogenetic inference derived from Myf5 gene sequences (Figure 2) demonstrated that all examined specimens of the genus Clarias formed a robust monophyletic group (posterior probability = 1.0) that was distinctly separated from other taxa within order Siluriformes. Most internal nodes received moderate to strong posterior probability support, ranging from 0.56 to 1.00. Several haplotype groups formed highly supported subclades (PP = 0.90–1.00), including the clusters comprising Clarias_Myf5*TH2–Clarias_Myf5*TH6 and Clarias_Myf5*TH14–Clarias_Myf5*TH15, whereas other relationships were supported by moderate posterior probability values (0.56–0.85). The phylogenetic topology showed that the newly identified haplotypes were distributed across multiple lineages rather than forming a single monophyletic cluster. In addition, several haplotypes grouped closely with published Clarias Myf5 sequences, while others formed distinct clades without previously reported homologs, suggesting the presence of lineage-specific genetic variants. No clear species-specific clustering was observed among C. gariepinus, C. macrocephalus, and C. batrachus, indicating a high degree of sequence conservation retention of ancestral polymorphism within the genus. Additionally, the relatively short DNA sequence analyzed may have contained insufficient phylogenetic information to clearly resolve species-specific clustering. Overall, the phylogenetic analysis demonstrated considerable genetic diversity among the identified Myf5 haplotypes while supporting their evolutionary relationships within Clarias.

3.4. Molecular Signatures of Selective Sweeps and Adaptive Divergence at the Myf5 Locus

Selective pressures acting on the catfish Myf5 gene were assessed using the non-synonymous-to-synonymous substitution ratio (dN/dS, ω), which consistently remained below 1 across all examined populations. This pattern, which indicates that the gene is subject to purifying selection, suggests a high degree of functional conservation in Myf5 sequences among African, bighead, and walking catfish populations (Table 2).
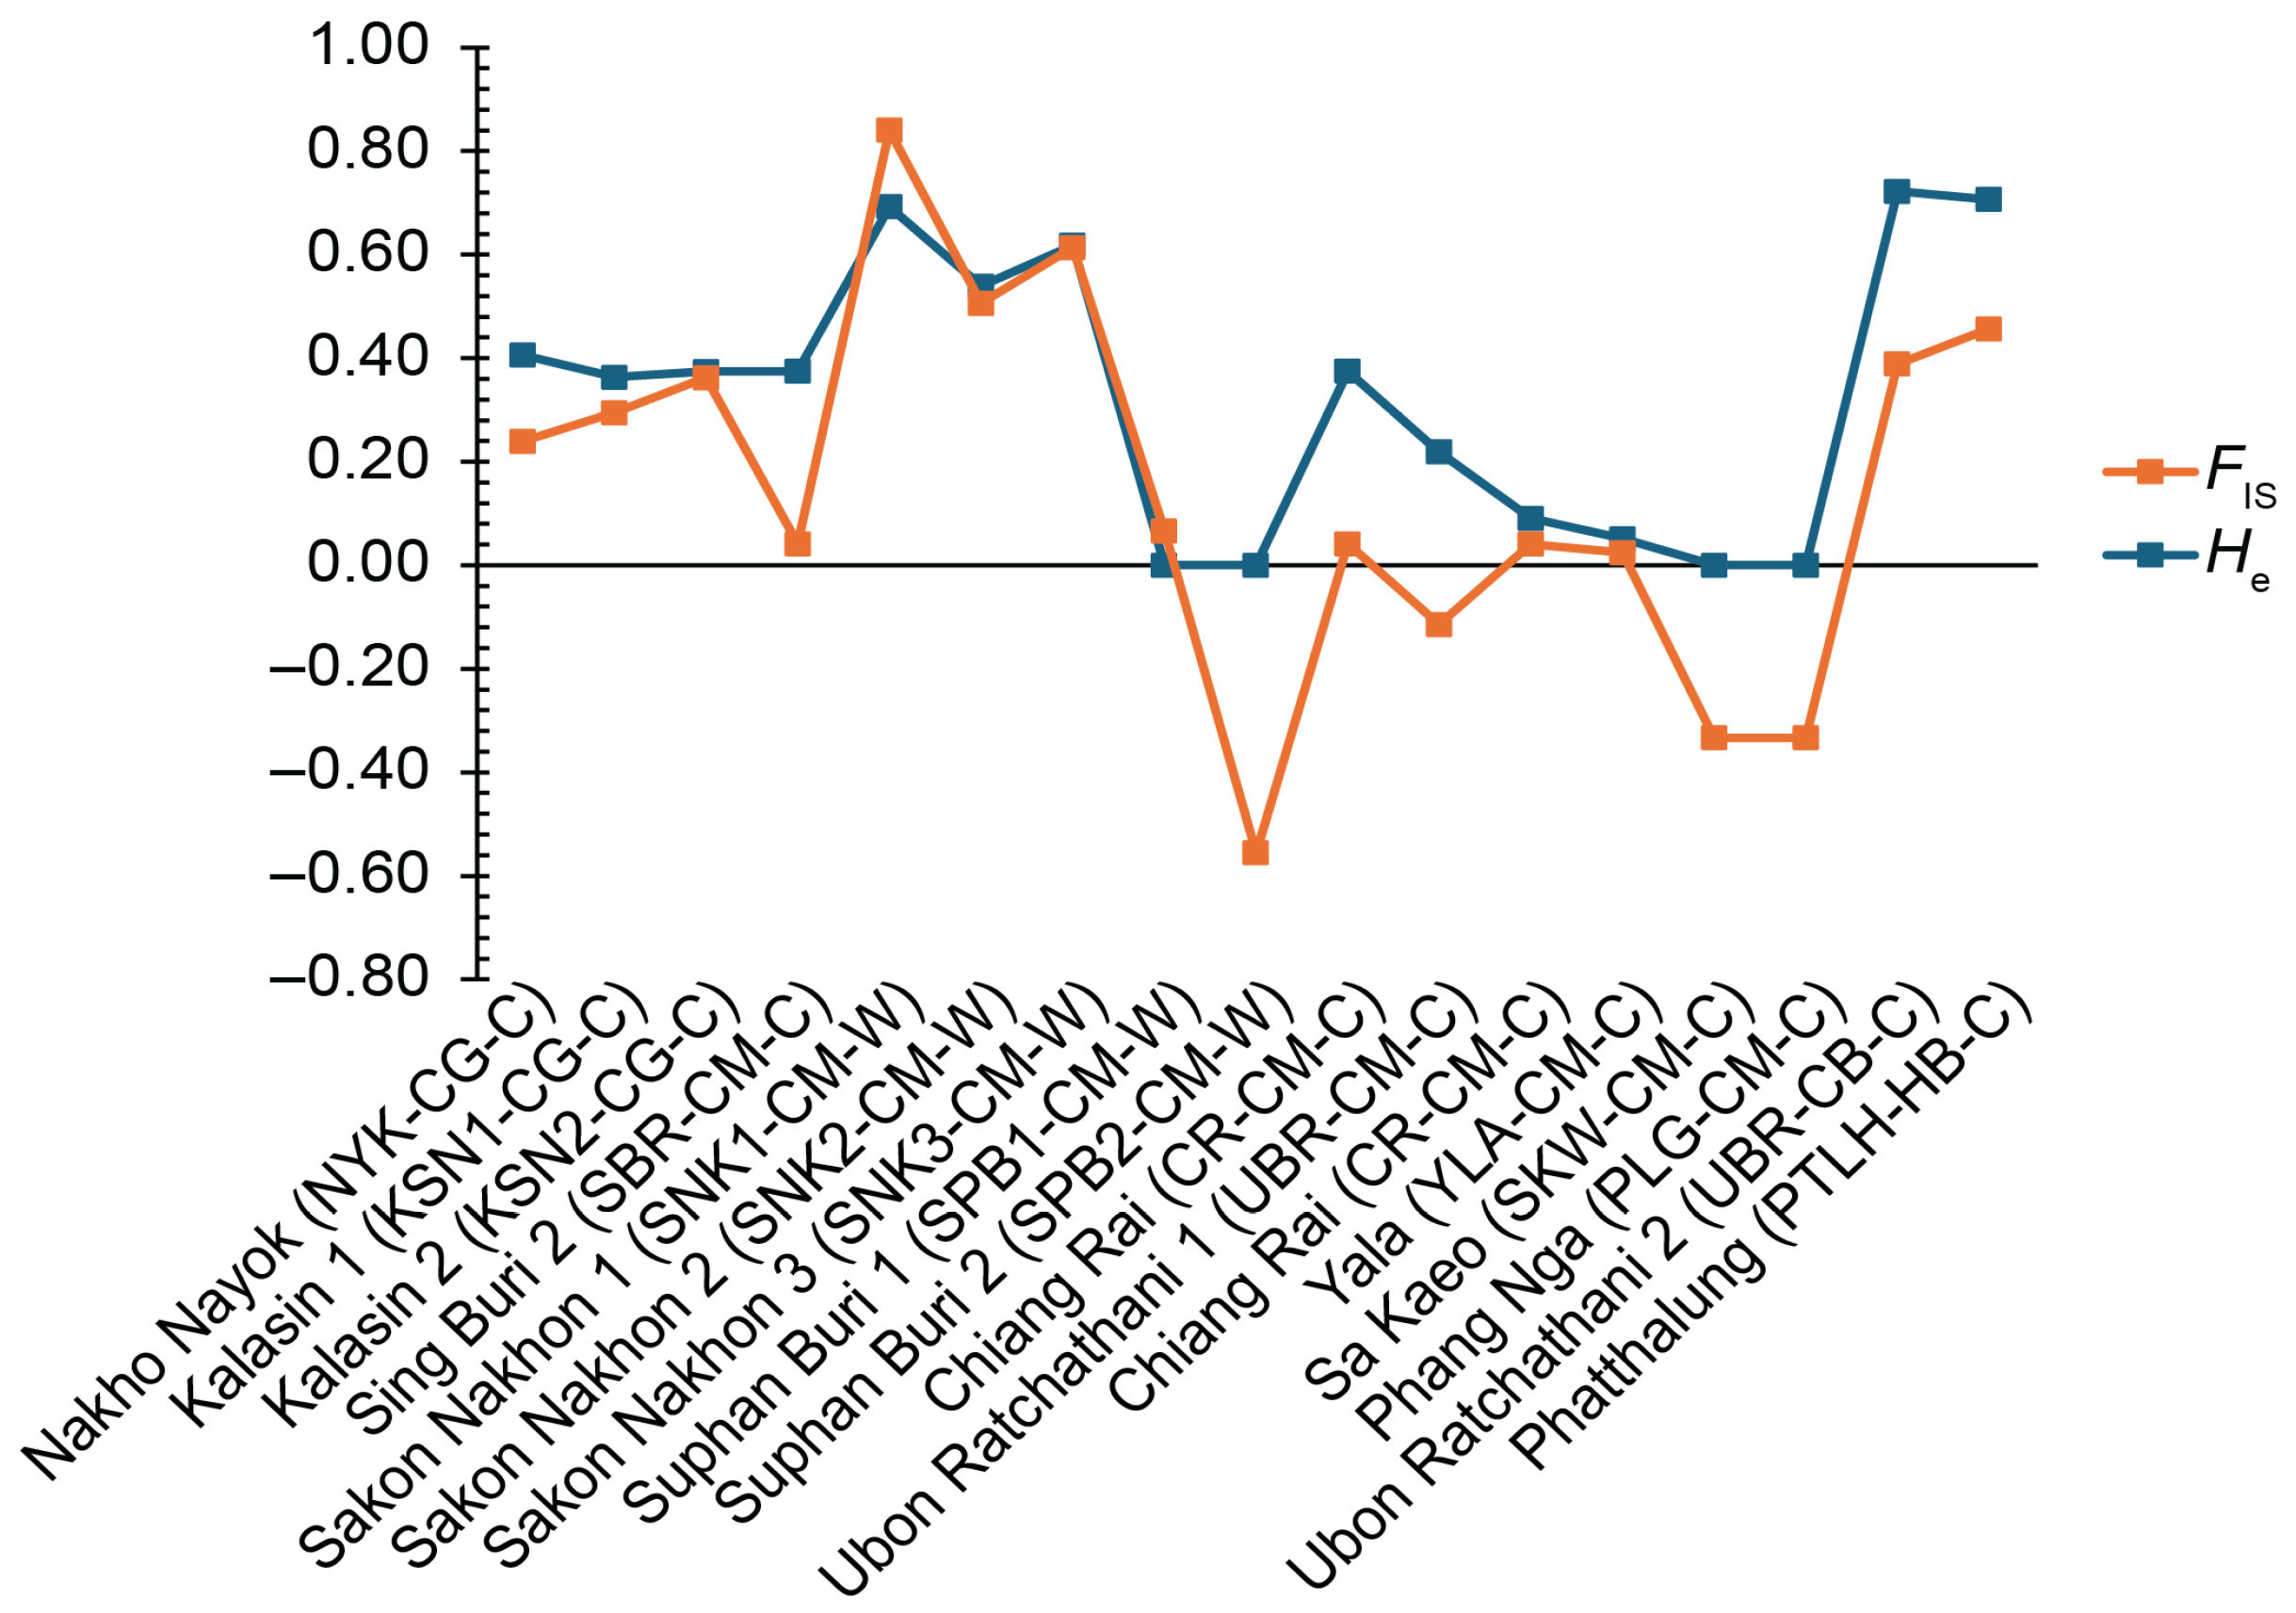
The mean ω value was estimated at 0.063 (range: 0.036–0.158), further supporting an overall trend toward purifying selection, with the highest ω value (0.158) observed in C. batrachus populations (UBR-CB-C). In nine populations, ω could not be estimated because of extremely low dS levels, which hindered reliable calculation of the ratio. Likelihood ratio testing further confirmed that the observed ω values were not statistically significant (LRT = 0.000, p = 0.500), which indicates that the locus remains largely governed by purifying selection or neutral selection (Table 2). The analysis of selective sweep signals, based on the relationship between He and FIS, revealed signatures of directional selection in specific populations, such as SKN1 and SPB1 (Figure 3). These populations were characterized by low He and elevated FIS values, which are indicative of recent allelic fixation under selective pressure. By contrast, populations SPB1-CM-W, UBR-CM-C, and UBR-CB-C exhibited FIS values that exceeded He, indicating the presence of potential selective sweeps or ongoing purifying selection (Figure 3).
Neutrality tests revealed spatial heterogeneity in the genetic patterns of selection across the study area. Tajima’s D values ranged from −0.893 to −0.194 and were consistently negative, even though they did not reach statistical significance. Similarly, Fu and Li’s D* and F* statistics were non-significant in all examined populations. Following the application of the FDR correction for multiple comparisons, which was used to ensure statistical stringency across the diverse populations, no group exhibited statistically significant deviations (q > 0.05). This outcome indicates that there is no robust evidence of recent, severe population bottlenecks or strong selective sweeps that would be sufficient to override the broader purifying selection that governs this locus (Table 3).
Codon-specific selection analyses conducted using the Datamonkey platform (https://www.datamonkey.org) provided no evidence of positive selection acting on Myf5. The MEME model, which was optimized to detect episodic diversifying selection at individual sites, did not identify any codons undergoing transient adaptive changes (Table S10). By contrast, the FEL approach identified a specific codon position (site 52) under statistically significant purifying selection (Table S11). These findings were further corroborated by the FUBAR analysis, which revealed widespread signatures of purifying selection across most codon sites, whereas no positions showed support for diversifying selection (Table S12). These results collectively indicate that the Myf5 gene shows a high degree of sequence conservation, reflecting the dominant influence of purifying selection throughout its evolutionary trajectory.

3.5. Structural Conservation and Functional Architecture of Myf5 Protein Orthologs

Comparative analysis of the 103-residue Myf5 protein sequence revealed identities ranging from 91% to 98% between the 17 haplotypes and representative species within order Siluriformes. Within the Thai catfish populations, we identified 5 missense mutations and 11 synonymous substitutions (Table S13). The highest sequence similarity (98%) was observed between the Clarias_Myf5TH1 haplotype and C. gariepinus (XM_053509129), whereas the lowest similarity (91%) was observed between Clarias_Myf5TH6 and S. meridionalis (XM_046873826), reflecting the substantial evolutionary divergence between these lineages (Figure S1). The high degree of sequence conservation suggests that Myf5 protein residues are under strong selective constraints across both the genus Clarias and related catfish taxa, indicating the preservation of essential regulatory functions. Bayesian phylogenetic reconstruction based on amino acid sequences further revealed a polyphyletic distribution of Myf5 variants across the seven catfish species. Although multiple ancestral lineages likely contributed to the observed pattern, back-mutations to ancestral haplotypes may also have occurred and cannot be ruled out (Figure S2). Additionally, secondary structure predictions for C. gariepinus, C. macrocephalus, and C. batrachus indicated that α-helices and random coils are the primary structural elements that form the fundamental folding architecture of Myf5 (Figure S3).

3.6. Structural Characterization and Comparative Modeling of Myf5 Protein Variants

The amino acid sequences that correspond to the Myf5 gene exhibited high similarity to the C. gariepinus reference sequence (Accession No. XM053509129), with sequence identities that ranged from 91% to 98%. Comparative analysis of the 103-residue segment, which is situated within the functionally critical basic helix-loop-helix (bHLH) domain, confirmed that these Myf5 protein segments maintain high conservation across diverse catfish lineages. The tertiary (3D) structures of the predicted peptide variants were characterized and clustered into three representative models (Figure S4), which were validated through Ramachandran plot analysis. Among these, Model 2 exhibited the highest stereochemical quality, where 76.0% of residues resided in the most favored regions, followed by Model 1 (73%) and Model 3 (72%). These results indicate that the region is evolutionarily conserved, with limited genetic variation that does not significantly alter the global protein shape, which suggests that any observed structural variance is primarily influenced by the specific amino acid composition of each haplotype. All models were structurally aligned with a reference bHLH domain (Accession: A0A8J4U0D1; Figure S5), which confirmed the functional identity of the analyzed protein region.

3.7. Integrative Genomic Assessment of Growth-Related Loci (Myf5, Mstnb, and GH1) for Population Subdivision

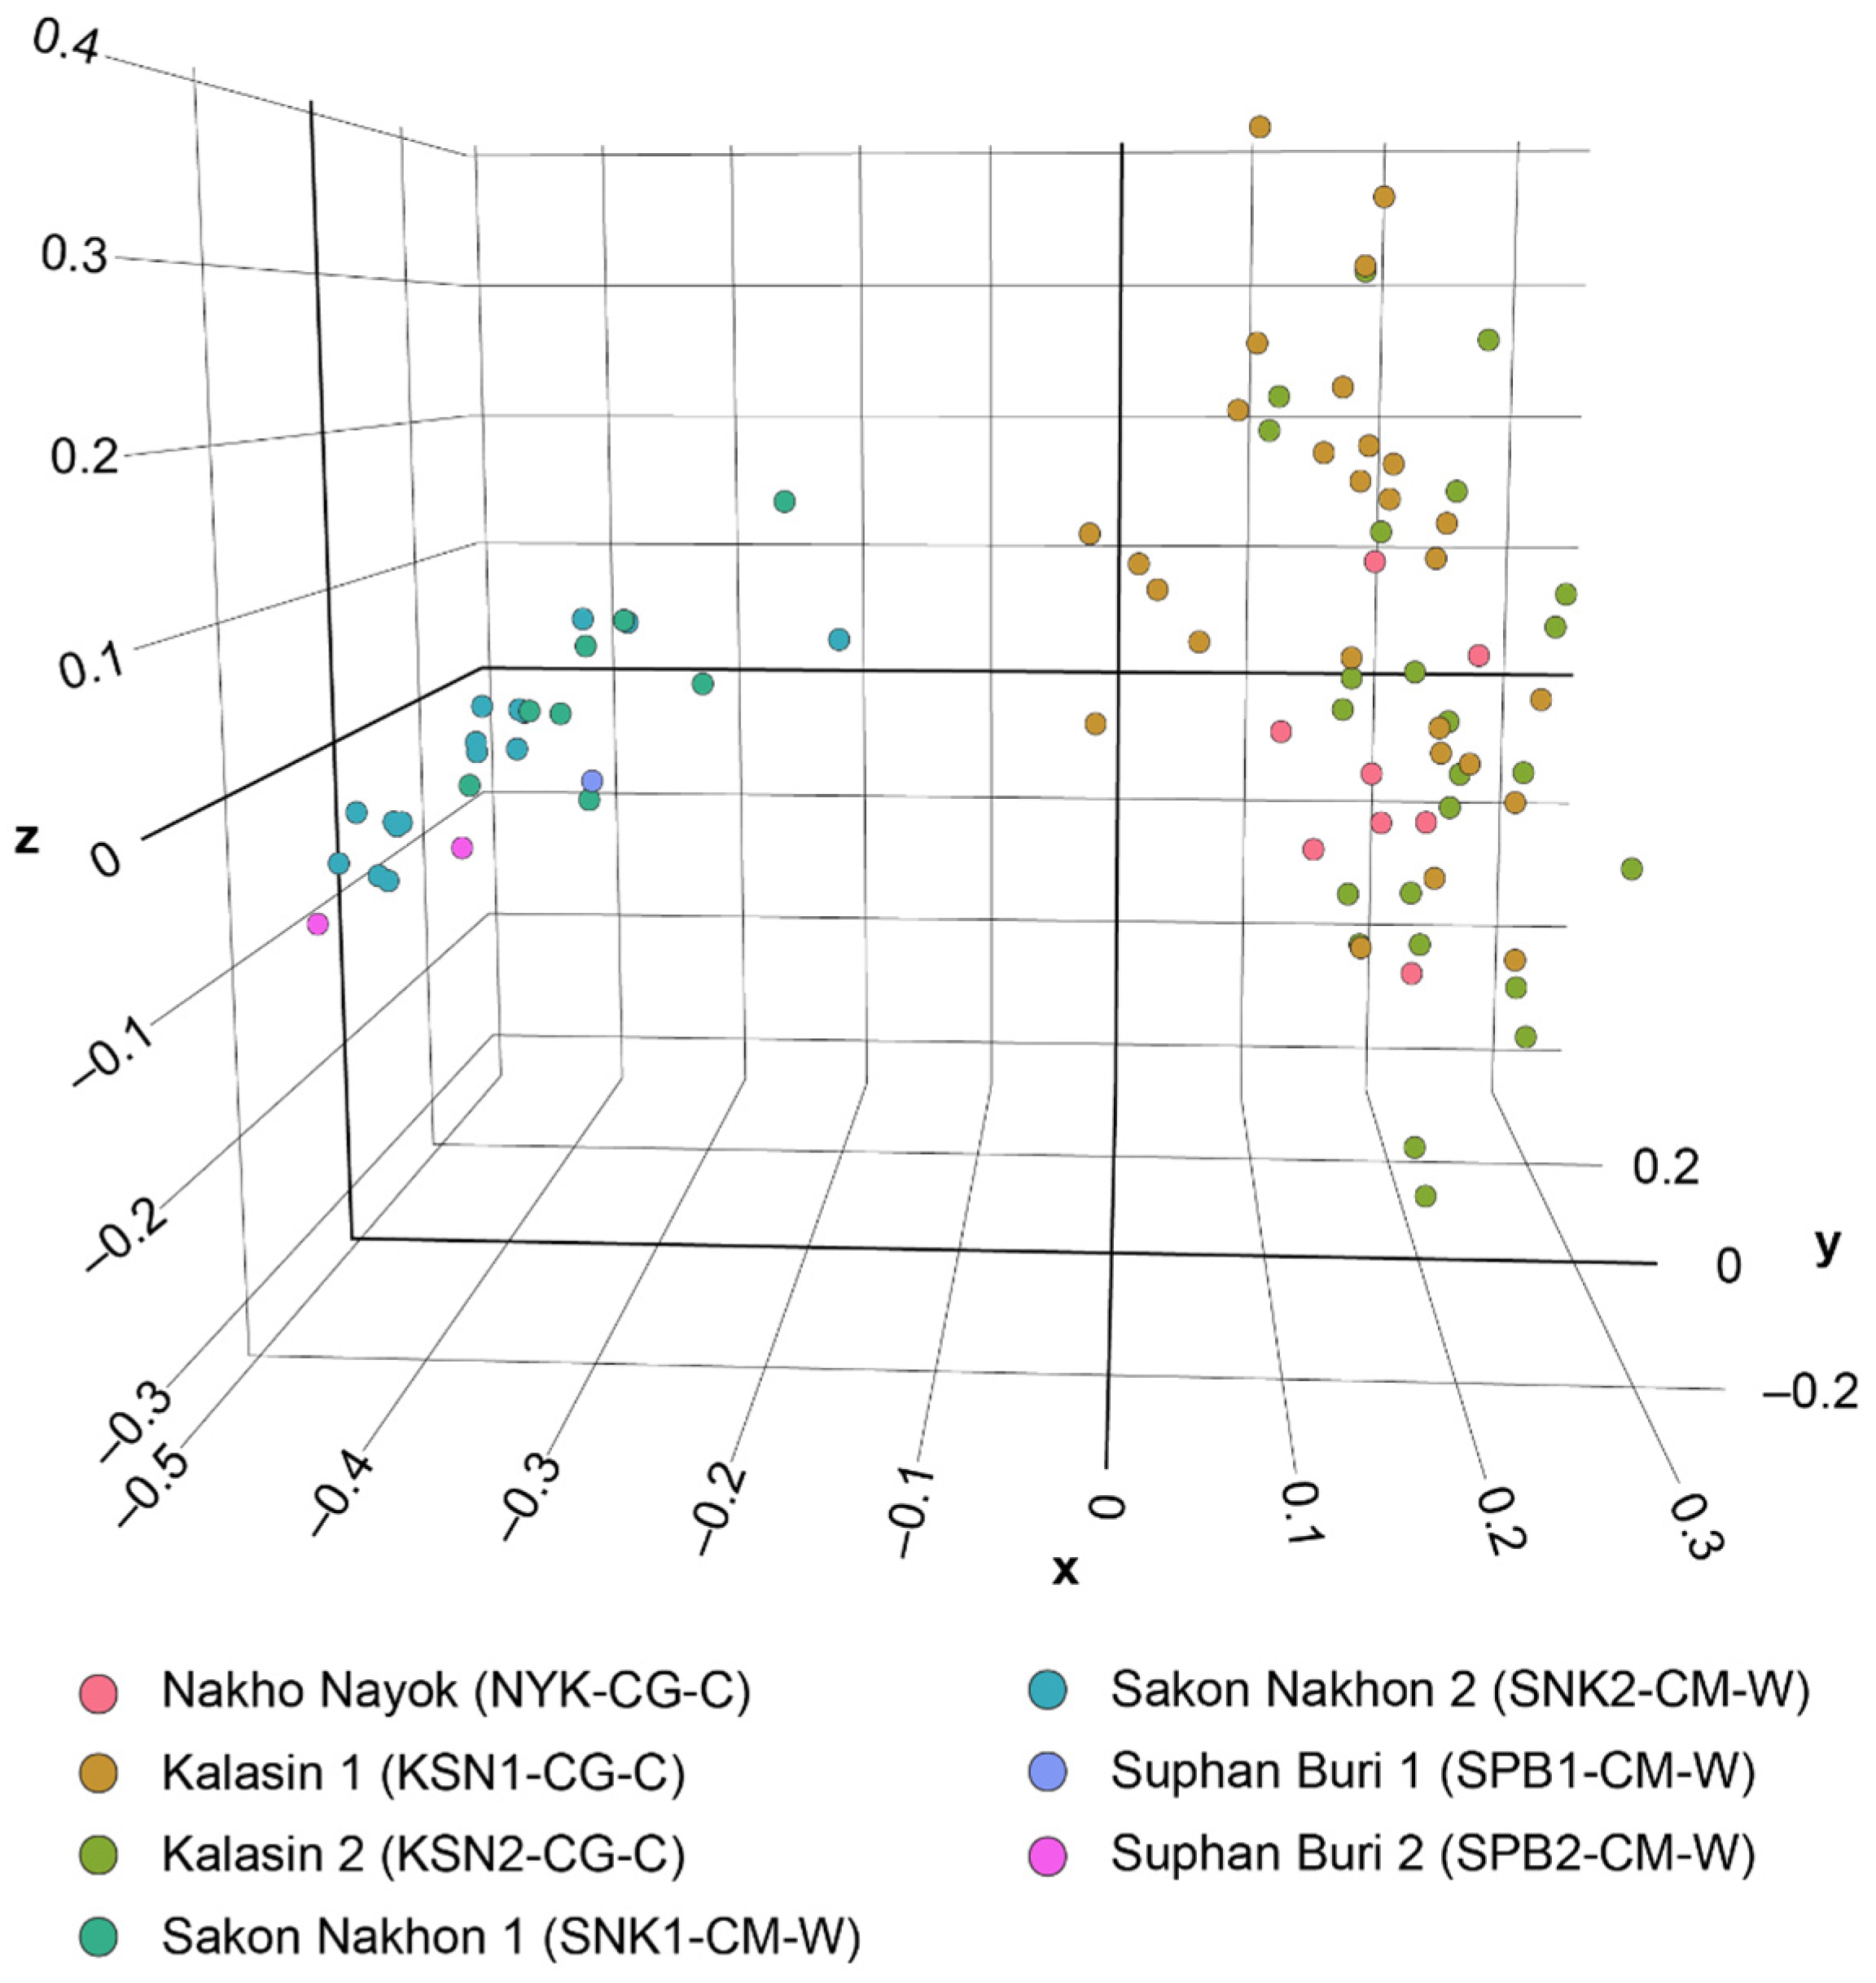
The PCoA and DAPC multivariate analyses of integrated multilocus genomic variation (Myf5, Mstnb, and GH1) indicated an absence of distinct individual clustering within the broader dataset, suggesting a high degree of overlapping genetic variation at the microgeographic scale. However, samples from the Sakon Nakhon and Suphan Buri populations formed a partially distinct cluster along the first principal coordinate axis, whereas the remaining populations were largely distributed on the opposite side of the ordination space, suggesting moderate geographic differentiation despite the overall weak population structure (Figure 4 and Figure S6).
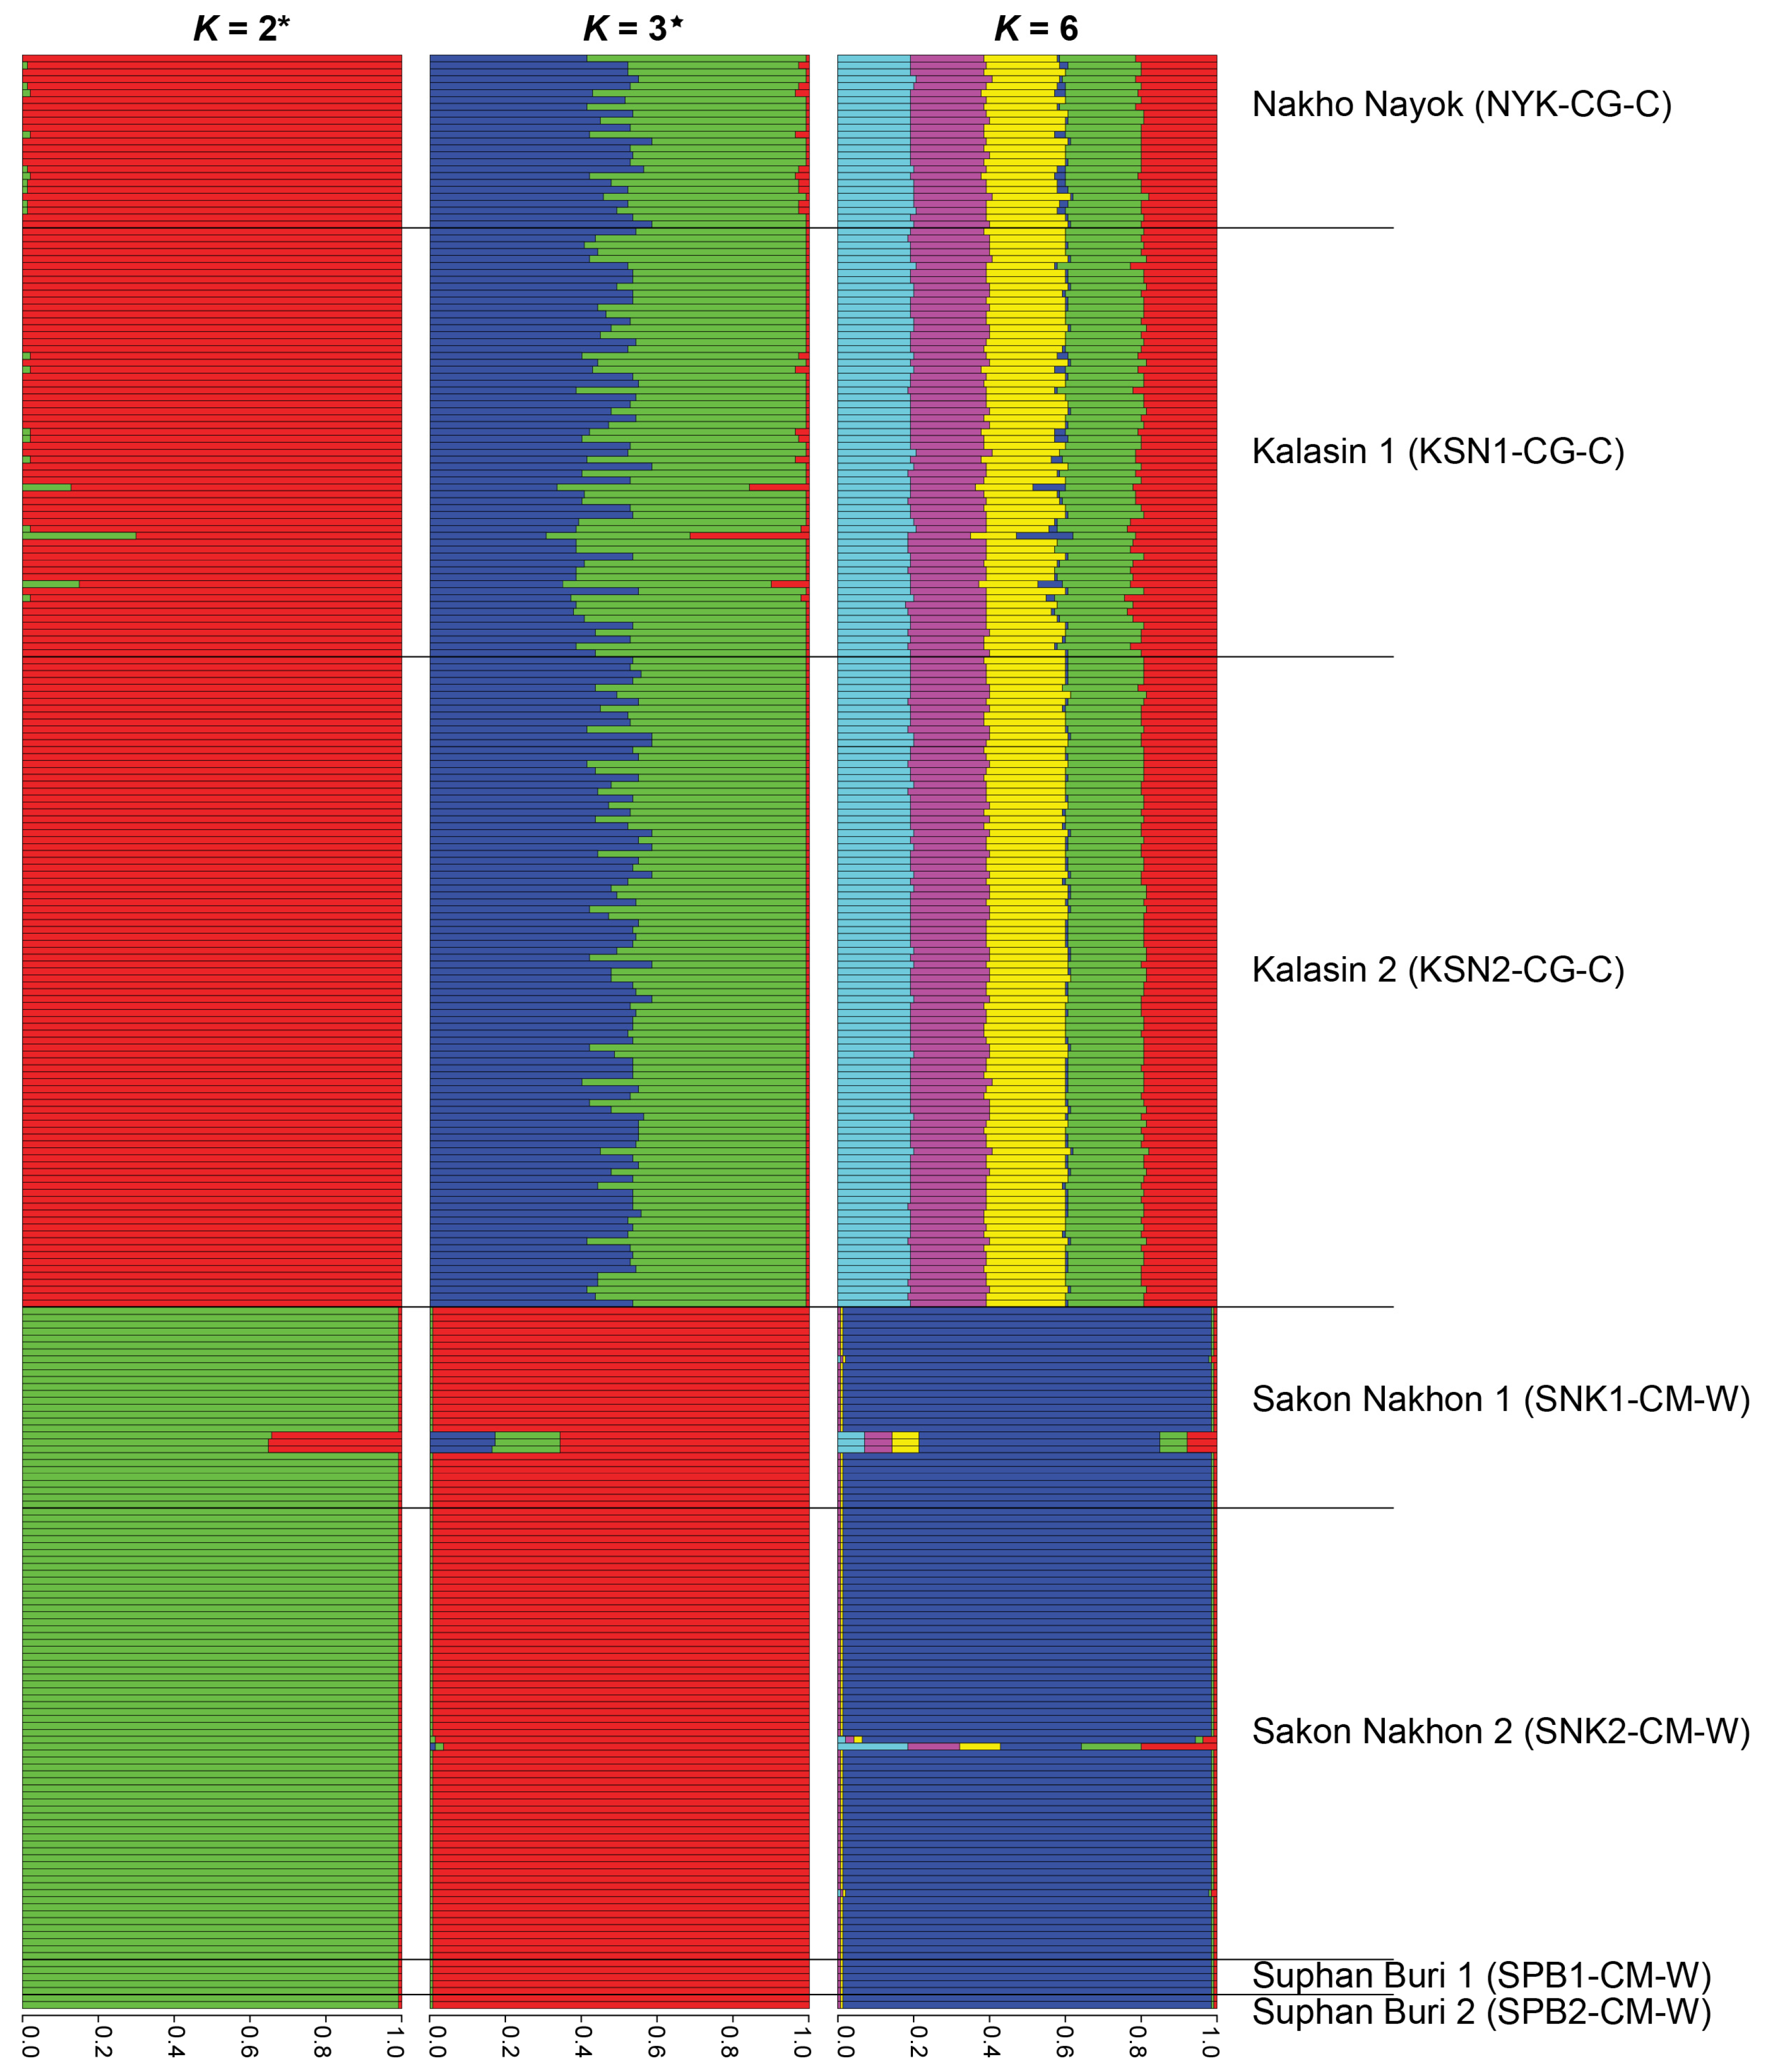
By contrast, Bayesian clustering analysis, which utilized a multi-locus dataset incorporating Myf5 with Mstnb and GH1 sequences, identified K = 3 as the optimal number of clusters while consistently supporting a primary division into two major lineages (Figure 5). The Mstnb and GH1 data, derived from previous genomic assessments (Accession No: NC071104; Accession No: NC071127), partitioned the samples into two distinct clades corresponding to African catfish (C. gariepinus) and bighead catfish (C. macrocephalus). Although the fundamental species-level division remained stable, hierarchical substructuring became apparent as K increased, enabling a highly nuanced resolution of the population architecture within each species (Figure S7). Specifically, Evanno’s ΔK method identified K = 2 as the most pronounced level of secondary structure, which reflects a strong differentiation occurring between the two primary species-clades. This hierarchical pattern, which was consistently observed across the representative sampling locations, implies that although the primary species lineages are well-preserved, localized genetic signatures begin to emerge at the sub-population level.

4. Discussion

Characterization of DNA sequence variation at the Myf5 locus across 511 Clarias individuals from 17 populations revealed 92 variable sites and 17 haplotypes. A robust signature of purifying selection (ω = 0.063) underscored the functional conservation of the gene, whereas multi-locus integration with Mstnb and GH1 supported hierarchical population subdivision, with K = 2 representing species-level differentiation and K = 3 representing a major secondary level of structure. Thus, the present dataset addresses the objectives of this study at complementary biological levels. Variation at the Myf5 locus revealed species- and population-associated haplotypes, the comparison of wild and hatchery-derived samples identified uneven patterns of genetic diversity and differentiation, and the integrated multilocus analysis provided additional resolution of broad species-level and population-level structure. These findings are therefore most directly relevant to species and hybrid identification, monitoring of genetic differentiation, and future assessment of introgression between cultured and natural populations.

4.1. Structural Conservation and Allelic Divergence of Myf5 in Clarias Lineages

Comparative genomic analyses indicated that the Myf5 gene in Clarias species retains a conserved architecture consisting of three exons and two introns. Within this framework, the 334-bp segment of exon 1 showed a high density of 92 variable sites, supporting its utility for evaluating population-level sequence variation. Although we identified 17 novel haplotypic variants, nucleotide diversity remained notably low (π ≈ 0.008), with only five missense mutations potentially affecting the amino acid composition. This result suggests that Myf5 evolved under a conservative selective regime with limited adaptive diversification compared with those of other growth-related genes, such as myostatin, which exhibits higher polymorphism and lineage-specific positive selection in teleosts [60], or growth hormone genes that show greater structural variability [61]. The relative conservation of Myf5 likely reflects its role as a developmental gatekeeper, where functional disruption may impose substantial pleiotropic constraints on embryonic myogenesis [62,63]. Haplotypic frequency distributions varied among populations, with Clarias_Myf5*TH1 occurring at high frequencies across multiple locations and species. This suggests the retention of an ancestral haplotype or its maintenance through weak positive selection under aquaculture conditions, which is known to increase the frequency of haplotypes associated with desirable traits, such as growth performance [64,65]. However, population-level frequencies alone are insufficient to distinguish between ancestral retention and adaptive significance without direct evidence of fitness. Haplotype distributions differed among the sampled taxa. Within the present Thai dataset, two haplotypes were observed for C. gariepinus, five were observed for C. macrocephalus, and one (Clarias_Myf5TH10) was observed for C. batrachus. These exclusive occurrences indicate candidate taxon-associated variation, but should not be interpreted as definitive species-specificity. In particular, because C. batrachus and the hybrid group were each represented by only one population, haplotypes detected exclusively in these samples may reflect population-level or local variation rather than species-wide differentiation. Haplotypes confined to a single sampling locality should therefore be regarded as population-specific within the present dataset. Broader and more balanced sampling across Thailand and other parts of the species’ ranges will be required to determine whether these variants are consistently associated with particular taxa or are geographically restricted. Accordingly, these haplotypes should currently be considered candidate components of a multi-locus panel for broodstock identification and hybrid monitoring rather than validated species diagnostic markers [66,67]. These diagnostic variants provide useful molecular markers that may assist hatchery managers in preserving the genetic integrity of native broodstock and supporting the sustainable management of clariid resources.
The observed genetic structure also reflects the unique history of catfish aquaculture in Thailand. The clear separation among C. gariepinus, C. macrocephalus, and C. batrachus, together with the hierarchical subdivision revealed by the multilocus analyses, suggests that species identity remains largely preserved despite decades of intensive hatchery production and hybridization. At the phylogeographic scale, these patterns indicate that evolutionary divergence among species remains the dominant source of genetic differentiation, whereas localized substructure within C. macrocephalus probably reflects restricted broodstock exchange and regional demographic history. From an aquaculture perspective, the species-specific Myf5 haplotypes identified here provide practical molecular markers for broodstock authentication, hybrid verification, and monitoring unintended introgression in hatchery stocks. These findings also have direct implications for fisheries management and conservation in Thailand by supporting the maintenance of genetically distinct broodstock, for monitoring the movement of hatchery fish into natural populations, and preserving the genetic integrity of native C. macrocephalus and C. batrachus, which may be increasingly threatened by extensive hybrid production involving C. gariepinus.

4.2. Pervasive Purifying Selection and Structural Constraints Preserve the Functional Integrity of the Myf5 Myogenic Regulator

The results of the selection analyses were consistent with purifying selection acting on the analyzed Myf5 exon 1 region, which is evidenced by a consistently low dN/dS ratio (ω), averaging 0.063 across all examined populations. This pattern is consistent with evolutionary conservation of Myf5, a key regulator of myogenesis that initiates the specification and commitment of myogenic precursor cells during early somitogenesis. In the myogenic regulatory cascade, Myf5 functions as an early transcriptional activator that acts upstream of MyoD and downstream of Pax3/Pax7 [68,69]. As any non-synonymous substitution in such a critical developmental gatekeeper can be deleterious, the observed genetic patterns suggest that most mutations are removed from the population by selection to preserve the regulatory efficacy of the protein. Detailed codon-based analyses performed using the Datamonkey platform further resolved this selective landscape, in which the FEL and FUBAR models detected pervasive purifying selection across most nucleotide sites. Specifically, FEL analysis identified site 52 as being under statistically significant purifying selection, suggesting strong functional constraints within the basic helix-loop-helix (bHLH) domain and adjacent regions (Table S12). Secondary structure predictions and 3D modeling using AlphaFold 3 suggested that site 52 is located within a conserved α-helix that forms the protein’s core folding architecture. The high stereochemical quality of these models, which was validated through Ramachandran analysis, indicates that helix stability is essential for the dimerization and DNA-binding functions of the bHLH motif [70]. Moreover, structural alignment with a reference domain (A0A8J4U0D1) confirmed that the limited variation across lineages does not disrupt the global protein shape. This preservation of the tertiary architecture underscores the effect of robust purifying selection that maintains the regulatory integrity of Myf5 during catfish myogenesis. This high level of conservation in exon 1 is consistent with the patterns observed in other teleosts, where functionally important domains remain highly conserved, whereas neutral divergence accumulates in non-critical regions [66,71]. This predominantly neutral-to-purifying evolutionary pattern highlights the functional distinction between upstream developmental regulators that establish a myogenic lineage and downstream effector genes that are more responsive to domestication-driven selection [72]. For example, myostatin paralogs (Mstn1 and Mstn2) in teleost fishes often exhibit diversifying selection associated with interspecific variation in muscle growth, whereas Myf5 remains influenced by purifying selection [73,74]. Despite the lack of locus-wide positive selection (Table S11), some populations exhibited reduced heterozygosity and elevated FIS values, patterns potentially consistent with demographic effects or localized selection such as in SNK1-CM-W and Kalasin-derived samples. These patterns, characterized by reduced He and elevated FIS, are consistent with intensive breeding practices in major Thai hatchery systems where directional selection for growth has been applied across multiple generations [75,76].
From a functional perspective, the five missense mutations detected, including the Ser52Pro substitution, warrant further investigation (Table S14). Because proline residues can influence α-helical conformations, the Ser52Pro substitution may warrant future functional investigation. This change could subtly alter the folding dynamics of the protein, potentially affecting the transcriptional regulation of downstream targets such as myogenin [77]. Moreover, our analysis of hybrid individuals revealed only parental haplotypes, which reflects the controlled production of first-generation hybrids in aquaculture systems where heterosis is exploited without establishing new lineages. These findings further emphasize the importance of maintaining genetically diverse broodstock, particularly because the use of limited numbers of broodstock in selective breeding programs can reduce genetic diversity. Although Myf5 is unlikely to represent a major quantitative trait locus for the growth differences between C. gariepinus and C. macrocephalus, its allelic variation contributes to the genomic resources available for monitoring genetic health and managing broodstock diversity.

4.3. High-Resolution Population Architecture and the Efficacy of Multi-Locus Integration

The integration of Myf5 genotypes with multi-locus data substantially improved the resolution of the population structure in Clarias when compared with that obtained using single-locus analyses. AMOVA showed that 56% of the genetic variation was partitioned among populations, indicating significant isolation or species-level divergence despite microgeographic overlaps. This elevated differentiation exceeds the typical 20–40% reported for the microsatellite and SNP datasets in Clarias [75,78], which likely reflects high variability at the Myf5 locus, the consideration of variation at the haplotypic level, and the combined effects of strong purifying selection that maintains species-specific functional haplotypes and limited introgression at this developmental locus. Myf5 is a robust candidate diagnostic marker for identifying parental origin and first-generation hybrids, consistent with the utility of conserved nuclear loci in other fish taxa [79,80]. Bayesian clustering identified K = 2 as the optimal partition, which corresponded to the primary divergence between C. gariepinus and C. macrocephalus, whereas K = 3 revealed finer substructures associated with geographic origin and hatchery history. This bipartite structure aligns with the deep phylogenetic separation of these species, estimated to date back to the Miocene by molecular clock analyses [81,82]. Additionally, the consistently negative Tajima’s D*, and F* statistics, which remained statistically non-significant (q > 0.05) after FDR correction, suggest that the observed genetic patterns result from demographic processes, such as population expansion or genetic drift, rather than localized adaptive evolution. The absence of significant q-values further indicates that no recent bottlenecks or selective sweeps were strong enough to override the pervasive purifying selection that governs the Myf5 locus, which effectively maintains the genomic stability and functional integrity of this myogenic regulator across Thai clariid populations. Despite the strong interspecific resolution, PCoA and DAPC revealed a substantial overlap among individuals, particularly in hatchery-derived populations. This pattern is consistent with the extensive use of hybridization between C. macrocephalus and C. gariepinus in Thai aquaculture, which dominates national production [76]. The distinct clustering of C. batrachus across Bayesian and ordination analyses represents a key outcome of this multi-locus approach, where clear genetic separation highlights a specific vulnerability to introgression from numerically dominant farmed lineages [83]. These findings support the development of a standardized multi-locus genotyping panel incorporating Myf5 and additional nuclear markers, which would enhance species assignment accuracy and hybrid detection [84,85]. In aquaculture, such tools could enable the verification of broodstock identity and detection of unauthorized hybridization [75]. In the context of conservation, these markers would facilitate landscape-scale monitoring of gene flow from farmed to wild populations, enabling the early detection of introgression and supporting the maintenance of the genetic integrity of native populations. Such information could also help identify conservation priorities and guide broodstock management to preserve genetic diversity. In aquaculture, implementation of cost-effective amplicon sequencing can support routine genomics-based monitoring for species identification, broodstock authentication, hybrid verification, and the maintenance of genetic diversity in selective breeding programs [86,87].

4.4. Genomic Applications and Study Limitations for Clariid Management

The results of this study have significant implications for the sustainability of the Thai catfish industry, which is currently facing challenges related to reduced genetic diversity and stock homogenization. The elevated FIS values observed in specific populations, such as SNK1-CM-W (0.148), highlight the immediate risk of random genetic drift and inbreeding depression that often results from reliance on limited broodstock lines in intensive hatchery systems. To address these issues, the species-diagnostic haplotypes identified at the Myf5 locus, such as the unique Clarias_Myf5TH10 variant in C. batrachus, provide a practical basis for developing low-cost molecular tools. Haplotype-specific PCR assays based on these variants can be implemented using standard laboratory equipment to enable routine verification of species identity and hybrid status [79,87,88]. These approaches address persistent issues of mislabeling and can be integrated with traceability systems under certification frameworks, such as the Aquaculture Stewardship Council [89]. Moreover, the 17 Myf5 haplotypes identified here could be evaluated as components of multi-locus panels for species identification, broodstock verification, and hybrid monitoring. Their relevance to growth performance remains unknown because no phenotypic measurements or genotype–phenotype association analyses were included in the present study. The present study demonstrates haplotypic differentiation among taxa and populations but it did not test associations between Myf5 genotypes and growth rate, body weight, feed efficiency, disease resistance, or other economically important traits. Therefore, the identified haplotypes should currently be regarded as candidate diagnostic or stock-management markers rather than markers for trait-based selection. From a conservation perspective, our findings indicate the ongoing erosion of native Clarias genetic diversity, where the clear genetic distinctiveness of C. macrocephalus and C. batrachus emphasizes their vulnerability to genetic swamping from hybrid escapees. Therefore, conservation strategies should prioritize the effective confinement of hybrid stocks in aquaculture operations to prevent escape and introgression into natural populations, while also combining the protection of natural populations with ex-situ approaches, such as gene banking and cryopreservation, to preserve rare haplotypes at functionally relevant loci [90,91]. Using these diagnostic variants, the genetic purity of native stocks that are increasingly being displaced by numerically dominant cultured lineages can be protected.
Several limitations constrain the interpretation of these results. First, this analysis focused on a partial 334-bp segment of exon 1, which excludes regulatory elements and non-coding regions that may play significant roles in gene expression. Second, the absence of corresponding phenotypic data prevents the direct assessment of genotype–phenotype relationships, limiting our ability to make definitive functional inferences regarding growth performance. Third, the hybrid sampling was restricted to a single population, which may not have captured the full diversity of hybridization practices across different Thai aquaculture systems [92]. It should be noted that the present study focused on sequence variation within a candidate functional gene rather than genome-wide neutral markers. Consequently, the observed population structure reflects variation at the investigated loci and should not be interpreted as representing genome-wide diversity. Future studies integrating genome-wide SNP datasets with functional candidate genes, including members of the MRF gene family, will provide a more comprehensive understanding of population history, adaptive differentiation, and introgression in Thai catfish populations.
An additional limitation concerns the geographic scope and uneven taxonomic representation of the sampling design. All specimens were collected in Thailand, with 12 populations of C. macrocephalus and three populations of C. gariepinus, but only one population each of C. batrachus and hybrid catfish. Consequently, haplotype frequencies, private haplotypes, diversity indices, population structure, and the apparent diagnostic value of individual Myf5 variants should be regarded as a baseline for Thai populations rather than as range-wide estimates. The strong functional constraint inferred for Myf5 may be less geographically dependent than the population-level patterns because Myf5 is a conserved regulator of myogenesis; nevertheless, this interpretation also requires direct validation using non-Thai Myf5 sequences. Regional studies using other marker systems demonstrate that clariid population patterns can differ substantially among countries. C. macrocephalus populations from the Vietnamese Mekong Delta showed relatively high diversity and gene flow, whereas comparisons among Cambodia, Viet Nam, and Peninsular Malaysia revealed pronounced regional structures and distinct evolutionary units [93,94,95]. Studies in Viet Nam also reported little evidence of introgression from C. gariepinus into native C. macrocephalus [96], contrasting with previous observations from Thailand. Similarly, mitochondrial analyses of C. batrachus across Southeast Asia identified geographically structured lineages and region-specific haplotypes. These comparisons indicate that regional aquaculture practices, broodstock movement, drainage connectivity, and demographic history may influence genetic patterns. Because the published studies used microsatellites, ISSR markers, or mitochondrial sequences rather than Myf5, direct numerical comparisons among diversity indices are not appropriate. Balanced sampling from neighboring countries and other parts of the species’ ranges will therefore be necessary to determine whether the Myf5 haplotypes identified here are geographically restricted or consistently diagnostic across Southeast Asia.
Future research should thus prioritize a comprehensive characterization of the Myf5 gene through whole-gene resequencing and genome-wide association studies in phenotyped populations to identify quantitative trait loci for growth [86,87]. Additionally, long-term monitoring of wild populations using standardized genotyping panels is essential to quantify introgression dynamics and support evidence-based management of hybrid impacts on native genetic resources [97,98]. Although mitochondrial markers such as COI, Cyt b, or 16S rRNA are widely used for phylogeographic reconstruction and species identification, they only reflect maternal inheritance and therefore provide limited resolution for detecting hybrid ancestry. Future studies integrating mitochondrial DNA with genome-wide nuclear markers will provide a more comprehensive understanding of both maternal lineage history and biparental introgression across Southeast Asian Clarias populations.

5. Conclusions

This study successfully characterized the genomic architecture and allelic diversity of the Myf5 exon 1 region across 511 individuals, providing high-resolution data for evaluating the distribution of genetic diversity within Thai clariid populations. Our findings support the primary hypothesis that although the Myf5 gene is subjected to stringent purifying selection (ω = 0.063) to preserve its essential myogenic regulatory function, it harbors sufficient population-specific polymorphisms to differentiate between native species and their hybrids. The identification of 92 variable sites and 17 novel haplotypes demonstrated that lineage-level diversification and neutral divergence coexist with intense functional constraints that maintain the structural integrity of the protein’s α-helix folding architecture. The resolution of a hierarchical population structure (K = 3) and partitioning of 56% of the genetic variation among populations confirmed that Myf5 variation effectively reflects deep evolutionary divisions, where C. gariepinus, C. macrocephalus, and C. batrachus remain genetically distinct. From an applied perspective, the discovery of species-diagnostic haplotypes establishes Myf5 as a robust molecular marker for monitoring genetic introgression and detecting first-generation hybrids, which are critical requirements for the sustainable management of Thai aquaculture resources. Although the predominantly neutral-to-purifying pattern of selection suggests that Myf5 is unlikely to be a major direct driver of interspecific growth differences, its utility in marker-assisted selection and the detection of localized inbreeding provides a vital genomic baseline. Overall, this study provides candidate diagnostic tools for species, hybrid, and broodstock management, but does not establish Myf5 variants as markers for growth-related selection. Beyond providing a genomic resource, the present dataset establishes a baseline for monitoring genetic integrity in Thai clariid populations. These findings support evidence-based broodstock management, conservation planning, and sustainable aquaculture by facilitating the identification of species-specific lineages and genetic introgression.

Supplementary Materials

The following supporting information can be downloaded at: https://www.mdpi.com/article/10.3390/genes17080920/s1, Figure S1: Alignment of Myf5 protein sequences of catfish populations in Thailand and the reference sequences; Figure S2: Bayesian phylogenetic tree based on Myf5 amino acid residues in catfish species; Figure S3: Secondary structure prediction of Myf5 protein from catfish species in Thailand; Figure S4: Alignment of amino acid sequences of Myf5 gene haplotypes from exon 1 with 3D structures of their basic helix-loop-helix (bHLH) domain retrieved from UniProt database; Figure S5: Alignment of amino acid sequences of exon 1 of the Myf5 gene haplotypes with the reference sequences from Uniprot (A0A8J4U0D1) and C. gariepinus (XP_053365104); Figure S6: Discriminant analysis of principal components (DAPC) of catfish populations in Thailand. Each population is plotted using different colors; Figure S7: Different population structure patterns of catfish populations in Thailand generated by model-based Bayesian clustering algorithms implemented in STRUCTURE based on (A) plot of Evanno’s ΔK and (B) plot of Pr(X|K) strategy; Table S1: Summary of catfish individuals sampled in this study; Table S2: Catfish specimens used in this study; Table S3: List of teleost and Myf5-related sequences retrieved from public databases for comparative genomic analysis; Table S4: Variable sites in sequences of Myf5 haplotypes from catfish populations in Thailand; Table S5: Genetic diversity indices of catfish populations in Thailand based on Myf5 sequences; Table S6: Genetic differentiation among catfish populations in Thailand based on Myf5 sequences; Table S7: Analysis of molecular variance (AMOVA) results for catfish populations in Thailand; Table S8: Comparison of observed (Ho) and expected heterozygosity (He) of the Myf5 gene in catfish populations; Table S9: Comparison of the expected heterozygosity (He) of the Myf5 gene between catfish populations; Table S10: Comparison of the observed heterozygosity (Ho) of the Myf5 gene between catfish populations; Table S11: Detailed site-by-site results from the Mixed-Effects Model of Evolution (MEME) analysis; Table S12: Detailed site-by-site results from the Fixed-Effects Likelihood (FEL) analysis; Table S13: Codon sites under selection identified using Fast, Unconstrained Bayesian AppRoximation (FUBAR) analysis; Table S14: Types of single-nucleotide polymorphism (SNPs) and their locations in the partial fragment of the exon 1 of Myf5 gene of catfish populations in Thailand compared with the reference sequence (Accession number XM053509129).

Author Contributions

P.T.: Conceptualization, data curation, formal analysis, investigation, methodology, visualization, writing—original draft, writing—review & editing; T.H.D.N.: conceptualization, data curation, formal analysis, investigation, methodology, visualization, writing—original draft, writing—review & editing; R.N.: conceptualization, data curation, formal analysis, investigation, methodology, visualization, writing—original draft, writing—review & editing; A.H.L.: Data curation, formal analysis, writing—review & editing; E.U.L.: data curation, formal analysis, writing—review & editing; T.P.: formal analysis, visualization, writing—review & editing; K.S. (Kednapat Sriphairoj): data curation, formal analysis, writing—review & editing; S.H.: data curation, formal analysis, writing—review & editing; S.C.: data curation, formal analysis, writing—review & editing; C.G.: data curation, formal analysis, writing—review & editing; J.G.: data curation, formal analysis, writing—review & editing; S.K.: data curation, formal analysis, writing—review & editing; W.S.: conceptualization, data curation, formal analysis, visualization, writing—review & editing; J.P.: resource, methodology, writing—review & editing; O.S.: investigation, methodology, writing—review & editing; K.S. (Kornsorn Srikulnath): conceptualization, data curation, formal analysis, funding acquisition, investigation, methodology, project administration, supervision, visualization, writing—original draft, writing—review & editing. All authors have read and agreed to the published version of the manuscript.

Funding

This study was supported by the National Research Council of Thailand (NRCT) through the High-Potential Research Team Grant Program (Contract No. N42A660605) awarded to W.S., T.P., K.S. (Kednapat Sriphairoj), S.H., S.C., J.P., and K.S. (Kornsorn Srikulnath); the Program Management Unit for Human Resources and Institutional Development and Innovation (PMU—B) (Contract No. B13F670053) awarded to W.S., E.U.L., T.P., and K.S. (Kornsorn Srikulnath); the Program Management Unit for Competitiveness (PMU—C) under the Global Partnership Program (Contract No. C23F670224) awarded to W.S., T.P., J.P., and K.S. (Kornsorn Srikulnath); the Program Management Unit on Area Based Development (PMU—A) (Contract No. A11F680039) awarded to W.S., T.P., and K.S. (Kornsorn Srikulnath); a grant from Kasetsart University Research and Development Institute (Contract No. FF(KU) 61.69) awarded to W.S. and K.S. (Kornsorn Srikulnath); the International SciKU Branding (ISB), Faculty of Science, Kasetsart University, awarded to W.S., T.P., and K.S. (Kornsorn Srikulnath); KU Science Graduate Research Fund (GRF), Faculty of Science, Kasetsart University (student ID: 6814400898), awarded to R.N. and W.S.; the Capacity Building of KU Students on Internationalization (KUCSI) program awarded to R.N. and W.S.; a Postdoctoral Fellowship from Kasetsart University awarded to T.P.; and a grant from Betagro Group (Grant No. 6501.0901.1/68) awarded to K.S. (Kornsorn Srikulnath). No funding source was involved in the study design; collection, analysis, or interpretation of the data; writing of the report; or decision to submit the article for publication.

Institutional Review Board Statement

The Animal Experiment Committee at Kaset-sart University reviewed and approved the animal use protocols for this study (Approval Nos: ACKU65-SCI-003; ACKU66-SCI-006 and ACKU66-SCI-014, approval dates: 4 February 2022, 7 April 2023, 30 May 2023).

Informed Consent Statement

Not applicable.

Data Availability Statement

All sequences were deposited in the DNA Data Bank of Japan (DDBJ) (https://www.ddbj.nig.ac.jp/) (accession numbers: LC928348_LC928364, deposited on 21 April 2026).

Acknowledgments

The authors would like to express their gratitude to the Phu Sing Research and Training Center at Kalasin University and Betagro Fish Breeding Farm for their assistance with sample collection. They also sincerely thank the National Science and Technology Development Agency (NSTDA) Supercomputer Center (ThaiSC) for providing server analysis support. In addition, the authors acknowledge the Faculty of Science at Kasetsart University (No. 6501.0901.1/336) and Betagro Public Company Limited for their provision of research facilities.

Conflicts of Interest

Co-author Jiraboon Prasanpan is working in the Kalasin Fish Hatchery farm (Betagro Public Company Limited). Dr. Kornsorn Srikulnath has received research funding from Betagro Group to conduct this study. The funder had no role in the study design; collection, analysis, or interpretation of the data; writing of the report; or decision to submit the article for publication. The remaining authors declare that they have no commercial or financial relationships that could be construed as a potential conflict of interest.

Abbreviations

The following abbreviations are used in this manuscript:
DAPCDiscriminant Analysis of Principal Components
FELFixed-Effects Likelihood
FUBARFast Unconstrained Bayesian Approximation
K2PKimura Two-Parameter model
MLMaximum Likelihood
MEMEMixed-Effects Model of Evolution
Myf5Myogenic factor 5
PCoAPrincipal Coordinate Analysis
PCRPolymerase Chain Reaction

References

  1. Phetsang, H.; Panpipat, W.; Panya, A.; Phonsatta, N.; Chaijan, M. Occurrence and development of off-odor compounds in farmed hybrid catfish (Clarias macrocephalus × Clarias gariepinus) muscle during refrigerated storage: Chemical and volatilomic analysis. Foods 2021, 10, 1841. [Google Scholar] [CrossRef] [PubMed]
  2. Srikulnath, K.; Budi, T.; Panthum, T.; Sinthuvanich, C.; Haileselasie, T.H.; Kuldilok, K.; Photchanaprasert, N.; Sayruamyat, S.; Muangmai, N.; Duengkae, P.; et al. Sustainable Aquaculture in Thailand: Balancing Economic Growth and Ecological Integrity with North African Catfish Integration. Aquac. Res. 2025, in press. [Google Scholar] [CrossRef]
  3. Srikulnath, K.; Panthum, T.; Singchat, W.; Chaiyes, A.; Prasanpan, J.; Uno, U.; Edem, U.; Obidiegwu, J.E. Addressing Catfish (Clarias spp.) supply gap in Nigeria: A perspective on strategies for sustainable aquaculture growth. Sustainability 2025, 17, 9645. [Google Scholar] [CrossRef]
  4. Patta, C.; Panthum, T.; Thatukan, C.; Wongloet, W.; Chalermwong, P.; Wattanadilokchatkun, P.; Thong, T.; Srikampa, P.; Singchat, W.; Ahmad, S.F. Questioning inbreeding: Could outbreeding affect productivity in the North African catfish in Thailand? PLoS ONE 2024, 19, e0302584. [Google Scholar] [CrossRef] [PubMed]
  5. Patta, C.; Singchat, W.; Thatukan, C.; Jaito, W.; Kumnan, N.; Chalermwong, P.; Panthum, T.; Budi, T.; Wongloet, W.; Wattanadilokchatkun, P. Optimizing Bangkaew dog breed identification using DNA technology. Genes Genom. 2024, 46, 659–669. [Google Scholar] [CrossRef] [PubMed]
  6. Uno, A.; Browne, R.; Shinada, T.; Takahashi, M.; Soga, K.; Du, Y.; Abiko, F.; Taki, Y. Effects of a digital visual art learning intervention in healthy older adults: A pilot randomized controlled trial. Front. Aging 2025, 6, 1635789. [Google Scholar] [CrossRef] [PubMed]
  7. Lisachov, A.; Nguyen, D.H.M.; Panthum, T.; Ahmad, S.F.; Singchat, W.; Ponjarat, J.; Jaisamut, K.; Srisapoome, P.; Duengkae, P.; Hatachote, S. Emerging importance of bighead catfish (Clarias macrocephalus) and north African catfish (C. gariepinus) as a bioresource and their genomic perspective. Aquaculture 2023, 573, 739585. [Google Scholar] [CrossRef]
  8. Nguinkal, J.A.; Zoclanclounon, Y.A.; Brunner, R.M.; Chen, Y.; Goldammer, T. Haplotype-resolved and near-T2T genome assembly of the African catfish (Clarias gariepinus). Sci. Data 2024, 11, 1095. [Google Scholar] [CrossRef] [PubMed]
  9. Chen, Y.; Lin, X.; Zhou, D.; Zhang, Y.; Wang, Q.; Chen, H.; Jiang, D.; Deng, S.; Li, G.; Wang, P. An improved chromosome-level genome assembly and annotation of Hong Kong catfish (Clarias fuscus). Sci. Data 2025, 12, 193. [Google Scholar] [CrossRef] [PubMed]
  10. Lv, Y.; Li, Y.; Fang, M.; Liu, Y.; Wang, Y.; Yang, Y.; Zou, Y.; Shi, Q.; Mu, X. Chromosome-level genome assembly reveals adaptive evolution of the invasive Amazon sailfin catfish (Pterygoplichthys pardalis). Commun. Biol. 2025, 8, 616. [Google Scholar] [CrossRef] [PubMed]
  11. Parvez, I.; Rumi, R.A.; Ray, P.R.; Hassan, M.M.; Sultana, S.; Pervin, R.; Suwanno, S.; Pradit, S. Invasion of African Clarias gariepinus drives genetic erosion of the indigenous C. batrachus in Bangladesh. Biology 2022, 11, 252. [Google Scholar] [CrossRef] [PubMed]
  12. Wang, H.; Su, B.; Zhang, Y.; Shang, M.; Wang, J.; Johnson, A.; Dilawar, H.; Bruce, T.J.; Dunham, R.A.; Wang, X. Transcriptome analysis revealed potential mechanisms of channel catfish growth advantage over blue catfish in a tank culture environment. Front. Genet. 2024, 15, 1341555. [Google Scholar] [CrossRef] [PubMed]
  13. Guo, Y.; Bai, J.; Chang, O.; Lao, H.; Ye, X.; Luo, J. Molecular structure of the largemouth bass (Micropterus salmoides) Myf5 gene and its effect on skeletal muscle growth. Mol. Biol. Rep. 2009, 36, 1497–1504. [Google Scholar] [CrossRef] [PubMed]
  14. Rudnicki, M.A.; Schnegelsberg, P.N.; Stead, R.H.; Braun, T.; Arnold, H.-H.; Jaenisch, R. MyoD or Myf-5 is required for the formation of skeletal muscle. Cell 1993, 75, 1351–1359. [Google Scholar] [CrossRef] [PubMed]
  15. Buonanno, A.; Apone, L.; Morasso, M.I.; Beers, R.; Brenner, H.R.; Eftimie, R. The MyoD family of myogenic factors is regulated by electrical activity: Isolation and characterization of a mouse Myf-5 cDNA. Nucleic Acids Res. 1992, 20, 539–544. [Google Scholar] [CrossRef] [PubMed]
  16. Barth, J.L.; Worrell, R.A.; Crawford, J.M.; Morris, J.; Ivarie, R. Isolation, sequence, and characterization of the bovine myogenic factor-encoding gene myf-5. Gene 1993, 127, 185–191. [Google Scholar] [CrossRef] [PubMed]
  17. Saitoh, O.; Fujisawa-Sehara, A.; Nabeshima, Y.-I.; Periasamy, M. Expression of myogenic factors in denervated chicken breast muscle: Isolation of the chicken Myf5 gene. Nucleic Acids Res. 1993, 21, 2503–2509. [Google Scholar] [CrossRef] [PubMed]
  18. Johansen, K.A.; Overturf, K. Sequence, conservation, and quantitative expression of rainbow trout Myf5. Comp. Biochem. Physiol. B Biochem. Mol. Biol. 2005, 140, 533–541. [Google Scholar] [CrossRef] [PubMed]
  19. Tan, X.; Zhang, Y.; Zhang, P.-J.; Xu, P.; Xu, Y. Molecular structure and expression patterns of flounder (Paralichthys olivaceus) Myf-5, a myogenic regulatory factor. Comp. Biochem. Physiol. B Biochem. Mol. Biol. 2006, 145, 204–213. [Google Scholar] [CrossRef] [PubMed]
  20. Ye, H.-Q.; Chen, S.-L.; Xu, J.-Y. Molecular cloning and characterization of the Myf5 gene in sea perch (Lateolabrax japonicus). Comp. Biochem. Physiol. B Biochem. Mol. Biol. 2007, 147, 452–459. [Google Scholar] [CrossRef] [PubMed]
  21. Kanehisa, M.; Furumichi, M.; Sato, Y.; Ishiguro-Watanabe, M.; Tanabe, M. KEGG: Integrating viruses and cellular organisms. Nucleic Acids Res. 2021, 49, D545–D551. [Google Scholar] [CrossRef] [PubMed]
  22. Froehlich, J.M.; Galt, N.J.; Charging, M.J.; Meyer, B.M.; Biga, P.R. In vitro indeterminate teleost myogenesis appears to be dependent on Pax3. Vitr. Cell. Dev. Biol.-Anim. 2013, 49, 371–385. [Google Scholar] [CrossRef] [PubMed]
  23. Talukdar, A. Effect of dietary carbohydrate on the gene expression of Myod and Myf5 in Clarias batrachus (Linnaeus, 1758). In Proceedings of the 4th International Conference on Fisheries and Aquaculture, San Antonio, TX, USA, 28–30 November 2016; Volume 7, p. 68. [Google Scholar] [CrossRef]
  24. Feng, D.; Yu, Y.; Liu, K.; Su, Y.; Fan, T.; Guo, X.; Li, M. Effects of dietary leucine on growth, antioxidant capacity, immune response, and inflammation in juvenile yellow catfish Pelteobagrus fulvidraco. Front. Physiol. 2023, 14, 1247410. [Google Scholar] [CrossRef] [PubMed]
  25. Li, A.; Ma, M.; Li, H.; He, S.; Wang, S. Genetic Diversity and Population Differentiation of a Chinese Endangered Plant Ammopiptanthus nanus (M. Pop.) Cheng f. Genes 2023, 14, 1020. [Google Scholar] [CrossRef] [PubMed]
  26. Sun, C.; Li, M.; Wang, S.; Tang, Y.; Zhang, M.; Jiang, H.; Li, N.; Qin, C. The growth inhibition of yellow catfish (Pelteobagrus fulvidraco) under long-term low-concentration ammonia stress is regulated by the GH/IGF-1/IGFBP network. Aquac. Rep. 2025, 45, 103263. [Google Scholar] [CrossRef]
  27. Supikamolseni, A.; Ngaoburanawit, N.; Sumontha, M.; Chanhome, L.; Suntrarachun, S.; Peyachoknagul, S.; Srikulnath, K. Molecular barcoding of venomous snakes and species-specific multiplex PCR assay to identify snake groups for which antivenom is available in Thailand. Genet. Mol. Res. 2015, 14, 13981–13997. [Google Scholar] [CrossRef] [PubMed]
  28. Andrews, S. FastQC A Quality Control Tool for High Throughput Sequence Data; Babraham Bioinformatics, Babraham Institute: Cambridge, UK, 2010; Available online: https://www.bioinformatics.babraham.ac.uk/projects/fastqc/ (accessed on 24 June 2026).
  29. Sebastian, A.; Herdegen, M.; Migalska, M.; Radwan, J. amplisas: A web server for multilocus genotyping using next-generation amplicon sequencing data. Mol. Ecol. Resour. 2016, 16, 498–510. [Google Scholar] [CrossRef] [PubMed]
  30. Catchen, J.; Hohenlohe, P.A.; Bassham, S.; Amores, A.; Cresko, W.A. Stacks: An analysis tool set for population genomics. Mol. Ecol. 2013, 22, 3124–3140. [Google Scholar] [CrossRef] [PubMed]
  31. Lighten, J.; Van Oosterhout, C.; Paterson, I.G.; McMullan, M.; Bentzen, P. Ultra-deep Illumina sequencing accurately identifies MHC class II b alleles and provides evidence for copy number variation in the guppy (Poecilia reticulata). Mol. Ecol. Resour. 2014, 14, 753–767. [Google Scholar] [CrossRef] [PubMed]
  32. Rozas, J.; Ferrer-Mata, A.; Sánchez-DelBarrio, J.C.; Guirao-Rico, S.; Librado, P.; Ramos-Onsins, S.E.; Sánchez-Gracia, A. DnaSP 6: DNA sequence polymorphism analysis of large data sets. Mol. Biol. Evol. 2017, 34, 3299–3302. [Google Scholar] [CrossRef] [PubMed]
  33. Peakall, R.; Smouse, P.E. GENALEX 6: Genetic analysis in Excel. Population genetic software for teaching and research. Mol. Ecol. Notes 2006, 6, 288–295. [Google Scholar] [CrossRef] [PubMed]
  34. Goudet, J. FSTAT (version 1.2): A computer program to calculate F-statistics. J. Hered. 1995, 86, 485–486. [Google Scholar] [CrossRef]
  35. Budi, T.; Singchat, W.; Tanglertpaibul, N.; Wongloet, W.; Chaiyes, A.; Ariyaraphong, N.; Thienpreecha, W.; Wannakan, W.; Mungmee, A.; Thong, T. Thai local chicken breeds, Chee Fah and Fah Luang, originated from Chinese black-boned chicken with introgression of red junglefowl and domestic chicken breeds. Sustainability 2023, 15, 6878. [Google Scholar] [CrossRef]
  36. Excoffier, L.; Lischer, H.E. Arlequin suite ver 3.5: A new series of programs to perform population genetics analyses under Linux and Windows. Mol. Ecol. Resour. 2010, 10, 564–567. [Google Scholar] [CrossRef] [PubMed]
  37. Kalyaanamoorthy, S.; Minh, B.Q.; Wong, T.K.; Von Haeseler, A.; Jermiin, L.S. ModelFinder: Fast model selection for accurate phylogenetic estimates. Nat. Methods 2017, 14, 587–589. [Google Scholar] [CrossRef] [PubMed]
  38. Huelsenbeck, J.P.; Ronquist, F. MRBAYES: Bayesian inference of phylogenetic trees. Bioinformatics 2001, 17, 754–755. [Google Scholar] [CrossRef] [PubMed]
  39. Letunic, I.; Bork, P. Interactive Tree Of Life (iTOL) v5: An online tool for phylogenetic tree display and annotation. Nucleic Acids Res. 2021, 49, W293–W296. [Google Scholar] [CrossRef] [PubMed]
  40. Nei, M.; Gojobori, T. Simple methods for estimating the numbers of synonymous and nonsynonymous nucleotide substitutions. Mol. Biol. Evol. 1986, 3, 418–426. [Google Scholar] [CrossRef] [PubMed]
  41. Kumar, S.; Stecher, G.; Li, M.; Knyaz, C.; Tamura, K. MEGA X: Molecular evolutionary genetics analysis across computing platforms. Mol. Biol. Evol. 2018, 35, 1547–1549. [Google Scholar] [CrossRef] [PubMed]
  42. Murrell, B.; Weaver, S.; Smith, M.D.; Wertheim, J.O.; Murrell, S.; Aylward, A.; Eren, K.; Pollner, T.; Martin, D.P.; Smith, D.M. Gene-wide identification of episodic selection. Mol. Biol. Evol. 2015, 32, 1365–1371. [Google Scholar] [CrossRef] [PubMed]
  43. R Core Team. R: A Language and Environment for Statistical Computing; R Foundation for Statistical Computing: Vienna, Austria, 2026; Available online: https://www.R-project.org/ (accessed on 18 March 2026).
  44. Reddy, U.K.; Abburi, L.; Abburi, V.L.; Saminathan, T.; Cantrell, R.; Vajja, V.G.; Reddy, R.; Tomason, Y.R.; Levi, A.; Wehner, T.C. A genome-wide scan of selective sweeps and association mapping of fruit traits using microsatellite markers in watermelon. J. Hered. 2015, 106, 166–176. [Google Scholar] [CrossRef] [PubMed]
  45. Murrell, B.; Wertheim, J.O.; Moola, S.; Weighill, T.; Scheffler, K.; Kosakovsky Pond, S.L. Detecting individual sites subject to episodic diversifying selection. PLoS Genet. 2012, 8, e1002764. [Google Scholar] [CrossRef] [PubMed]
  46. Kosakovsky Pond, S.L.; Frost, S.D.W. Not so different after all: A comparison of methods for detecting amino acid sites under selection. Mol. Biol. Evol. 2005, 22, 1208–1222. [Google Scholar] [CrossRef] [PubMed]
  47. Murrell, B.; Moola, S.; Mabona, A.; Weighill, T.; Sheward, D.; Kosakovsky Pond, S.L.; Scheffler, K. FUBAR: A fast, unconstrained bayesian approximation for inferring selection. Mol. Biol. Evol. 2013, 30, 1196–1205. [Google Scholar] [CrossRef] [PubMed]
  48. Pearson, W.R. BLAST and FASTA similarity searching for multiple sequence alignment. In Multiple Sequence Alignment Methods; Springer: Berlin/Heidelberg, Germany, 2013; pp. 75–101. [Google Scholar]
  49. Meiklejohn, K.A.; Damaso, N.; Robertson, J.M. Assessment of BOLD and GenBank–Their accuracy and reliability for the identification of biological materials. PLoS ONE 2019, 14, e0217084. [Google Scholar] [CrossRef] [PubMed]
  50. McPherron, A.C.; Lee, S.-J. Double muscling in cattle due to mutations in the Myostatin gene. Proc. Natl. Acad. Sci. USA 1997, 94, 12457–12461. [Google Scholar] [CrossRef] [PubMed]
  51. Abramson, J.; Adler, J.; Dunger, J.; Evans, R.; Green, T.; Pritzel, A.; Ronneberger, O.; Willmore, L.; Ballard, A.J.; Bambrick, J. Accurate structure prediction of biomolecular interactions with AlphaFold 3. Nature 2024, 630, 493–500. [Google Scholar] [CrossRef] [PubMed]
  52. Laskowski, R.A.; MacArthur, M.W.; Moss, D.S.; Thornton, J.M. PROCHECK: A program to check the stereochemical quality of protein structures. Appl. Crystallogr. 1993, 26, 283–291. [Google Scholar] [CrossRef]
  53. Pritchard, J.K.; Stephens, M.; Donnelly, P. Inference of population structure using multilocus genotype data. Genetics 2000, 155, 945–959. [Google Scholar] [CrossRef] [PubMed]
  54. Budi, T.; Luu, A.H.; Singchat, W.; Wongloet, W.; Rey, J.; Kumnan, N.; Chalermwong, P.; Nguyen, C.P.T.; Panthum, T.; Tanglertpaibul, N. Purposive breeding strategies drive genetic differentiation in Thai fighting cock breeds. Genes Genom. 2024, 46, 1225–1237. [Google Scholar] [CrossRef] [PubMed]
  55. Nguyen, T.H.D.; Thammachak, P.; Budi, T.; Chalermwong, P.; Patta, C.; Jaito, W.; Singchat, W.; Panthum, T.; Sriphairoj, K.; Hatachote, S.; et al. Clarias sp. Isolate TH1 Myostatin B (mstnb) Gene, Exon 1 and Partial cds (GenBank Accession No. PX961328-PX961335). National Center Biotechnology Information. 2026. Available online: https://www.ncbi.nlm.nih.gov/nuccore/PX961328 (accessed on 18 March 2026).
  56. Thammachak, P.; Chalermwong, P.; Patta, C.; Jaito, W.; Singchat, W.; Panthum, T.; Budi, T.; Sriphairoj, K.; Hatachote, S.; Srisapoome, P. GH1 gene polymorphisms reveal population-level allele variation in North African (Clarias gariepinus) and Bighead Catfish (Clarias macrocephalus). Genes 2025, 16, 1266. [Google Scholar] [CrossRef] [PubMed]
  57. Li, N.; Bao, L.; Zhou, T.; Yuan, Z.; Liu, S.; Dunham, R.; Li, Y.; Wang, K.; Xu, X.; Jin, Y. Genome sequence of walking catfish (Clarias batrachus) provides insights into terrestrial adaptation. BMC Genom. 2018, 19, 952. [Google Scholar] [CrossRef] [PubMed]
  58. Jombart, T. adegenet: A R package for the multivariate analysis of genetic markers. Bioinformatics 2008, 24, 1403–1405. [Google Scholar] [CrossRef] [PubMed]
  59. Kumar, S.; Stecher, G.; Suleski, M.; Sanderford, M.; Sharma, S.; Tamura, K. MEGA12: Molecular evolutionary genetic analysis version 12 for adaptive and green computing. Mol. Biol. Evol. 2024, 41, msae263. [Google Scholar] [CrossRef] [PubMed]
  60. Gonzalez Acosta, A.; De La Cruz Agüero, G.; De La Cruz Agüero, J. Length-weight relationships of fish species caught in a mangrove swamp in the Gulf of California (Mexico). J. Appl. Ichthyol. 2004, 20, 154–155. [Google Scholar] [CrossRef]
  61. Moore, D.D.; Walker, M.D.; Diamond, D.J.; Conkling, M.A.; Goodman, H.M. Structure, expression, and evolution of growth hormone genes. In Proceedings of the 1981 Laurentian Hormone Conference, Mont Tremblant, QC, Canada, 23–29 August 1982; pp. 197–225. [Google Scholar]
  62. Pownall, M.E.; Gustafsson, M.K.; Emerson, C.P., Jr. Myogenic regulatory factors and the specification of muscle progenitors in vertebrate embryos. Annu. Rev. Cell Dev. Biol. 2002, 18, 747–783. [Google Scholar] [CrossRef] [PubMed]
  63. Zammit, P.S. Function of the myogenic regulatory factors Myf5, MyoD, Myogenin and MRF4 in skeletal muscle, satellite cells and regenerative myogenesis. Semin. Cell Dev. Biol. 2017, 72, 19–32. [Google Scholar] [CrossRef] [PubMed]
  64. Yue, G.H. Recent advances of genome mapping and marker-assisted selection in aquaculture. Fish Fish. 2014, 15, 376–396. [Google Scholar] [CrossRef]
  65. Gjedrem, T.; Robinson, N.; Rye, M. The importance of selective breeding in aquaculture to meet future demands for animal protein: A review. Aquaculture 2012, 350, 117–129. [Google Scholar] [CrossRef]
  66. Near, T.J.; Eytan, R.I.; Dornburg, A.; Kuhn, K.L.; Moore, J.A.; Davis, M.P.; Wainwright, P.C.; Friedman, M.; Smith, W.L. Resolution of ray-finned fish phylogeny and timing of diversification. Proc. Natl. Acad. Sci. USA 2012, 109, 13698–13703. [Google Scholar] [CrossRef] [PubMed]
  67. Elmer, S.; Meyer, M.; Jancke, L. Simultaneous interpreters as a model for neuronal adaptation in the domain of language processing. Brain Res. 2010, 1317, 147–156. [Google Scholar] [CrossRef] [PubMed]
  68. Buckingham, M.; Relaix, F. The role of Pax genes in the development of tissues and organs: Pax3 and Pax7 regulate muscle progenitor cell functions. Annu. Rev. Cell Dev. Biol. 2007, 23, 645–673. [Google Scholar] [CrossRef] [PubMed]
  69. Tajbakhsh, S. Skeletal muscle stem cells in developmental versus regenerative myogenesis. J. Intern. Med. 2009, 266, 372–389. [Google Scholar] [CrossRef] [PubMed]
  70. Berkes, C.A.; Tapscott, S.J. MyoD and the transcriptional control of myogenesis. Semin. Cell Dev. Biol. 2005, 16, 585–595. [Google Scholar] [CrossRef] [PubMed]
  71. Rescan, P.-Y.; Montfort, J.; Rallière, C.; Le Cam, A.; Esquerré, D.; Hugot, K. Dynamic gene expression in fish muscle during recovery growth induced by a fasting-refeeding schedule. BMC Genom. 2007, 8, 438. [Google Scholar] [CrossRef] [PubMed]
  72. Piferrer, F.; Anastasiadi, D.; Valdivieso, A.; Sánchez-Baizán, N.; Moraleda-Prados, J.; Ribas, L. The model of the conserved epigenetic regulation of sex. Front. Genet. 2019, 10, 857. [Google Scholar] [CrossRef] [PubMed]
  73. Kerr, T.; Roalson, E.H.; Rodgers, B.D. Phylogenetic analysis of the myostatin gene sub-family and the differential expression of a novel member in zebrafish. Evol. Dev. 2005, 7, 390–400. [Google Scholar] [CrossRef] [PubMed]
  74. Tong, C.; Zhang, C.; Shi, J.; Qi, H.; Zhang, R.; Tang, Y.; Li, G.; Feng, C.; Zhao, K. Characterization of two paralogous myostatin genes and evidence for positive selection in Tibet fish: Gymnocypris przewalskii. Gene 2015, 565, 201–210. [Google Scholar] [CrossRef] [PubMed]
  75. Senanan, W.; Kapuscinski, A.R.; Na-Nakorn, U.; Miller, L.M. Genetic impacts of hybrid catfish farming (Clarias macrocephalus × C. gariepinus) on native catfish populations in central Thailand. Aquaculture 2004, 235, 167–184. [Google Scholar] [CrossRef]
  76. Na-Nakorn, U.; Brummett, R.E. Use and exchange of aquatic genetic resources for food and aquaculture: Clarias catfish. Rev. Aquac. 2009, 1, 214–223. [Google Scholar] [CrossRef]
  77. Rudnicki, M.; Le Grand, F.; McKinnell, I.; Kuang, S. The molecular regulation of muscle stem cell function. Cold Spring Harb. Symp. Quant. Biol. 2008, 73, 323–331. [Google Scholar] [CrossRef] [PubMed]
  78. Na-Nakorn, U.; Kamonrat, W.; Ngamsiri, T. Genetic diversity of walking catfish, Clarias macrocephalus, in Thailand and evidence of genetic introgression from introduced farmed C. gariepinus. Aquaculture 2004, 240, 145–163. [Google Scholar] [CrossRef]
  79. Ward, R.D.; Zemlak, T.S.; Innes, B.H.; Last, P.R.; Hebert, P.D. DNA barcoding Australia’s fish species. Philos. Trans. R. Soc. B Biol. Sci. 2005, 360, 1847–1857. [Google Scholar] [CrossRef] [PubMed]
  80. Zhang, J.-B.; Hanner, R. DNA barcoding is a useful tool for the identification of marine fishes from Japan. Biochem. Syst. Ecol. 2011, 39, 31–42. [Google Scholar] [CrossRef]
  81. Agnèse, J.-F.; Teugels, G.; Galbusera, P.; Guyomard, R.; Volckaert, F. Morphometric and genetic characterization of sympatric populations of Clarias gariepinus and C. anguillaris from Senegal. J. Fish. Biol. 1997, 50, 1143–1157. [Google Scholar] [CrossRef]
  82. Peng, Z.; Wang, J.; He, S. The complete mitochondrial genome of the helmet catfish Cranoglanis bouderius (Siluriformes: Cranoglanididae) and the phylogeny of otophysan fishes. Gene 2006, 376, 290–297. [Google Scholar] [CrossRef] [PubMed]
  83. Naylor, R.; Hindar, K.; Fleming, I.A.; Goldburg, R.; Williams, S.; Volpe, J.; Whoriskey, F.; Eagle, J.; Kelso, D.; Mangel, M. Fugitive salmon: Assessing the risks of escaped fish from net-pen aquaculture. Bioscience 2005, 55, 427–437. [Google Scholar] [CrossRef]
  84. Manel, S.; Gaggiotti, O.E.; Waples, R.S. Assignment methods: Matching biological questions with appropriate techniques. Trends Ecol. Evol. 2005, 20, 136–142. [Google Scholar] [CrossRef] [PubMed]
  85. VÄHÄ, J.P.; Primmer, C.R. Efficiency of model-based Bayesian methods for detecting hybrid individuals under different hybridization scenarios and with different numbers of loci. Mol. Ecol. 2006, 15, 63–72. [Google Scholar] [CrossRef] [PubMed]
  86. Houston, R.D.; Bean, T.P.; Macqueen, D.J.; Gundappa, M.K.; Jin, Y.H.; Jenkins, T.L.; Selly, S.L.C.; Martin, S.A.; Stevens, J.R.; Santos, E.M. Harnessing genomics to fast-track genetic improvement in aquaculture. Nat. Rev. Genet. 2020, 21, 389–409. [Google Scholar] [CrossRef] [PubMed]
  87. Palaiokostas, C.; Anjum, A.; Jeuthe, H.; Kurta, K.; Lopes Pinto, F.; de Koning, D.J. A genomic-based vision on the genetic diversity and key performance traits in selectively bred Arctic charr (Salvelinus alpinus). Evol. Appl. 2022, 15, 565–577. [Google Scholar] [CrossRef] [PubMed]
  88. Naaum, A.M.; Hanner, R. Community engagement in seafood identification using DNA barcoding reveals market substitution in Canadian seafood. DNA Barcodes 2015, 3, 74–79. [Google Scholar] [CrossRef]
  89. Xiong, F.; Olden, J.D.; Lu, Y.; Liu, H.; Qu, X.; Xia, W.; Guo, C.; Wu, X.; Infante, D.M.; Wang, L. Riparian land use and in-channel stressors drive fish community structure in the Yangtze River. Landsc. Ecol. 2021, 36, 3079–3095. [Google Scholar] [CrossRef]
  90. Peng, Q.; Pevzner, P.A.; Tesler, G. The fragile breakage versus random breakage models of chromosome evolution. PLoS Comput. Biol. 2006, 2, e14. [Google Scholar] [CrossRef] [PubMed]
  91. Naish, K.A.; Hard, J.J. Bridging the gap between the genotype and the phenotype: Linking genetic variation, selection and adaptation in fishes. Fish Fish. 2008, 9, 396–422. [Google Scholar] [CrossRef]
  92. Bajard, L.; Relaix, F.; Lagha, M.; Rocancourt, D.; Daubas, P.; Buckingham, M.E. A novel genetic hierarchy functions during hypaxial myogenesis: Pax3 directly activates Myf5 in muscle progenitor cells in the limb. Genes Dev. 2006, 20, 2450–2464. [Google Scholar] [CrossRef] [PubMed]
  93. Nazia, A.K.; Tam, B.M.; Jamaluddin, J.A.F.; Nor, S.A.M. High genetic structure between natural populations of bighead catfish Clarias macrocephalus (Günther, 1864) from the Mekong Delta and Peninsular Malaysia. Fish. Res. 2021, 241, 105993. [Google Scholar] [CrossRef]
  94. Lee, P.; Sulaiman, Z. Genetic identification and structure of Clarias batrachus (Linnaeus, 1758) from Southeast Asia using a mitochondrial DNA marker. Zootaxa 2015, 3962, 182–190. [Google Scholar] [CrossRef] [PubMed]
  95. Duong, T.-Y.; Scribner, K.T. Regional variation in genetic diversity between wild and cultured populations of bighead catfish (Clarias macrocephalus) in the Mekong Delta. Fish. Res. 2018, 207, 118–125. [Google Scholar] [CrossRef]
  96. Duong, T.-Y.; Scribner, K.T.; Kanefsky, J.; Na-Nakorn, U. Lack of introgressive hybridization by North African catfish (Clarias gariepinus) in native Vietnamese bighead catfish (Clarias macrocephalus) populations as revealed by novel nuclear and mitochondrial markers. Aquaculture 2017, 473, 468–477. [Google Scholar] [CrossRef]
  97. Xia, X.; Zhang, F.; Li, S.; Luo, X.; Peng, L.; Dong, Z.; Pausch, H.; Leonard, A.S.; Crysnanto, D.; Wang, S. Structural variation and introgression from wild populations in East Asian cattle genomes confer adaptation to local environment. Genome Biol. 2023, 24, 211. [Google Scholar] [CrossRef] [PubMed]
  98. Chang, S.L.; Ward, H.G.; Elliott, L.D.; Russello, M.A. Genotyping-in-Thousands by sequencing panel development and application for high-resolution monitoring of introgressive hybridization within sockeye salmon. Sci. Rep. 2022, 12, 3441. [Google Scholar] [CrossRef] [PubMed]
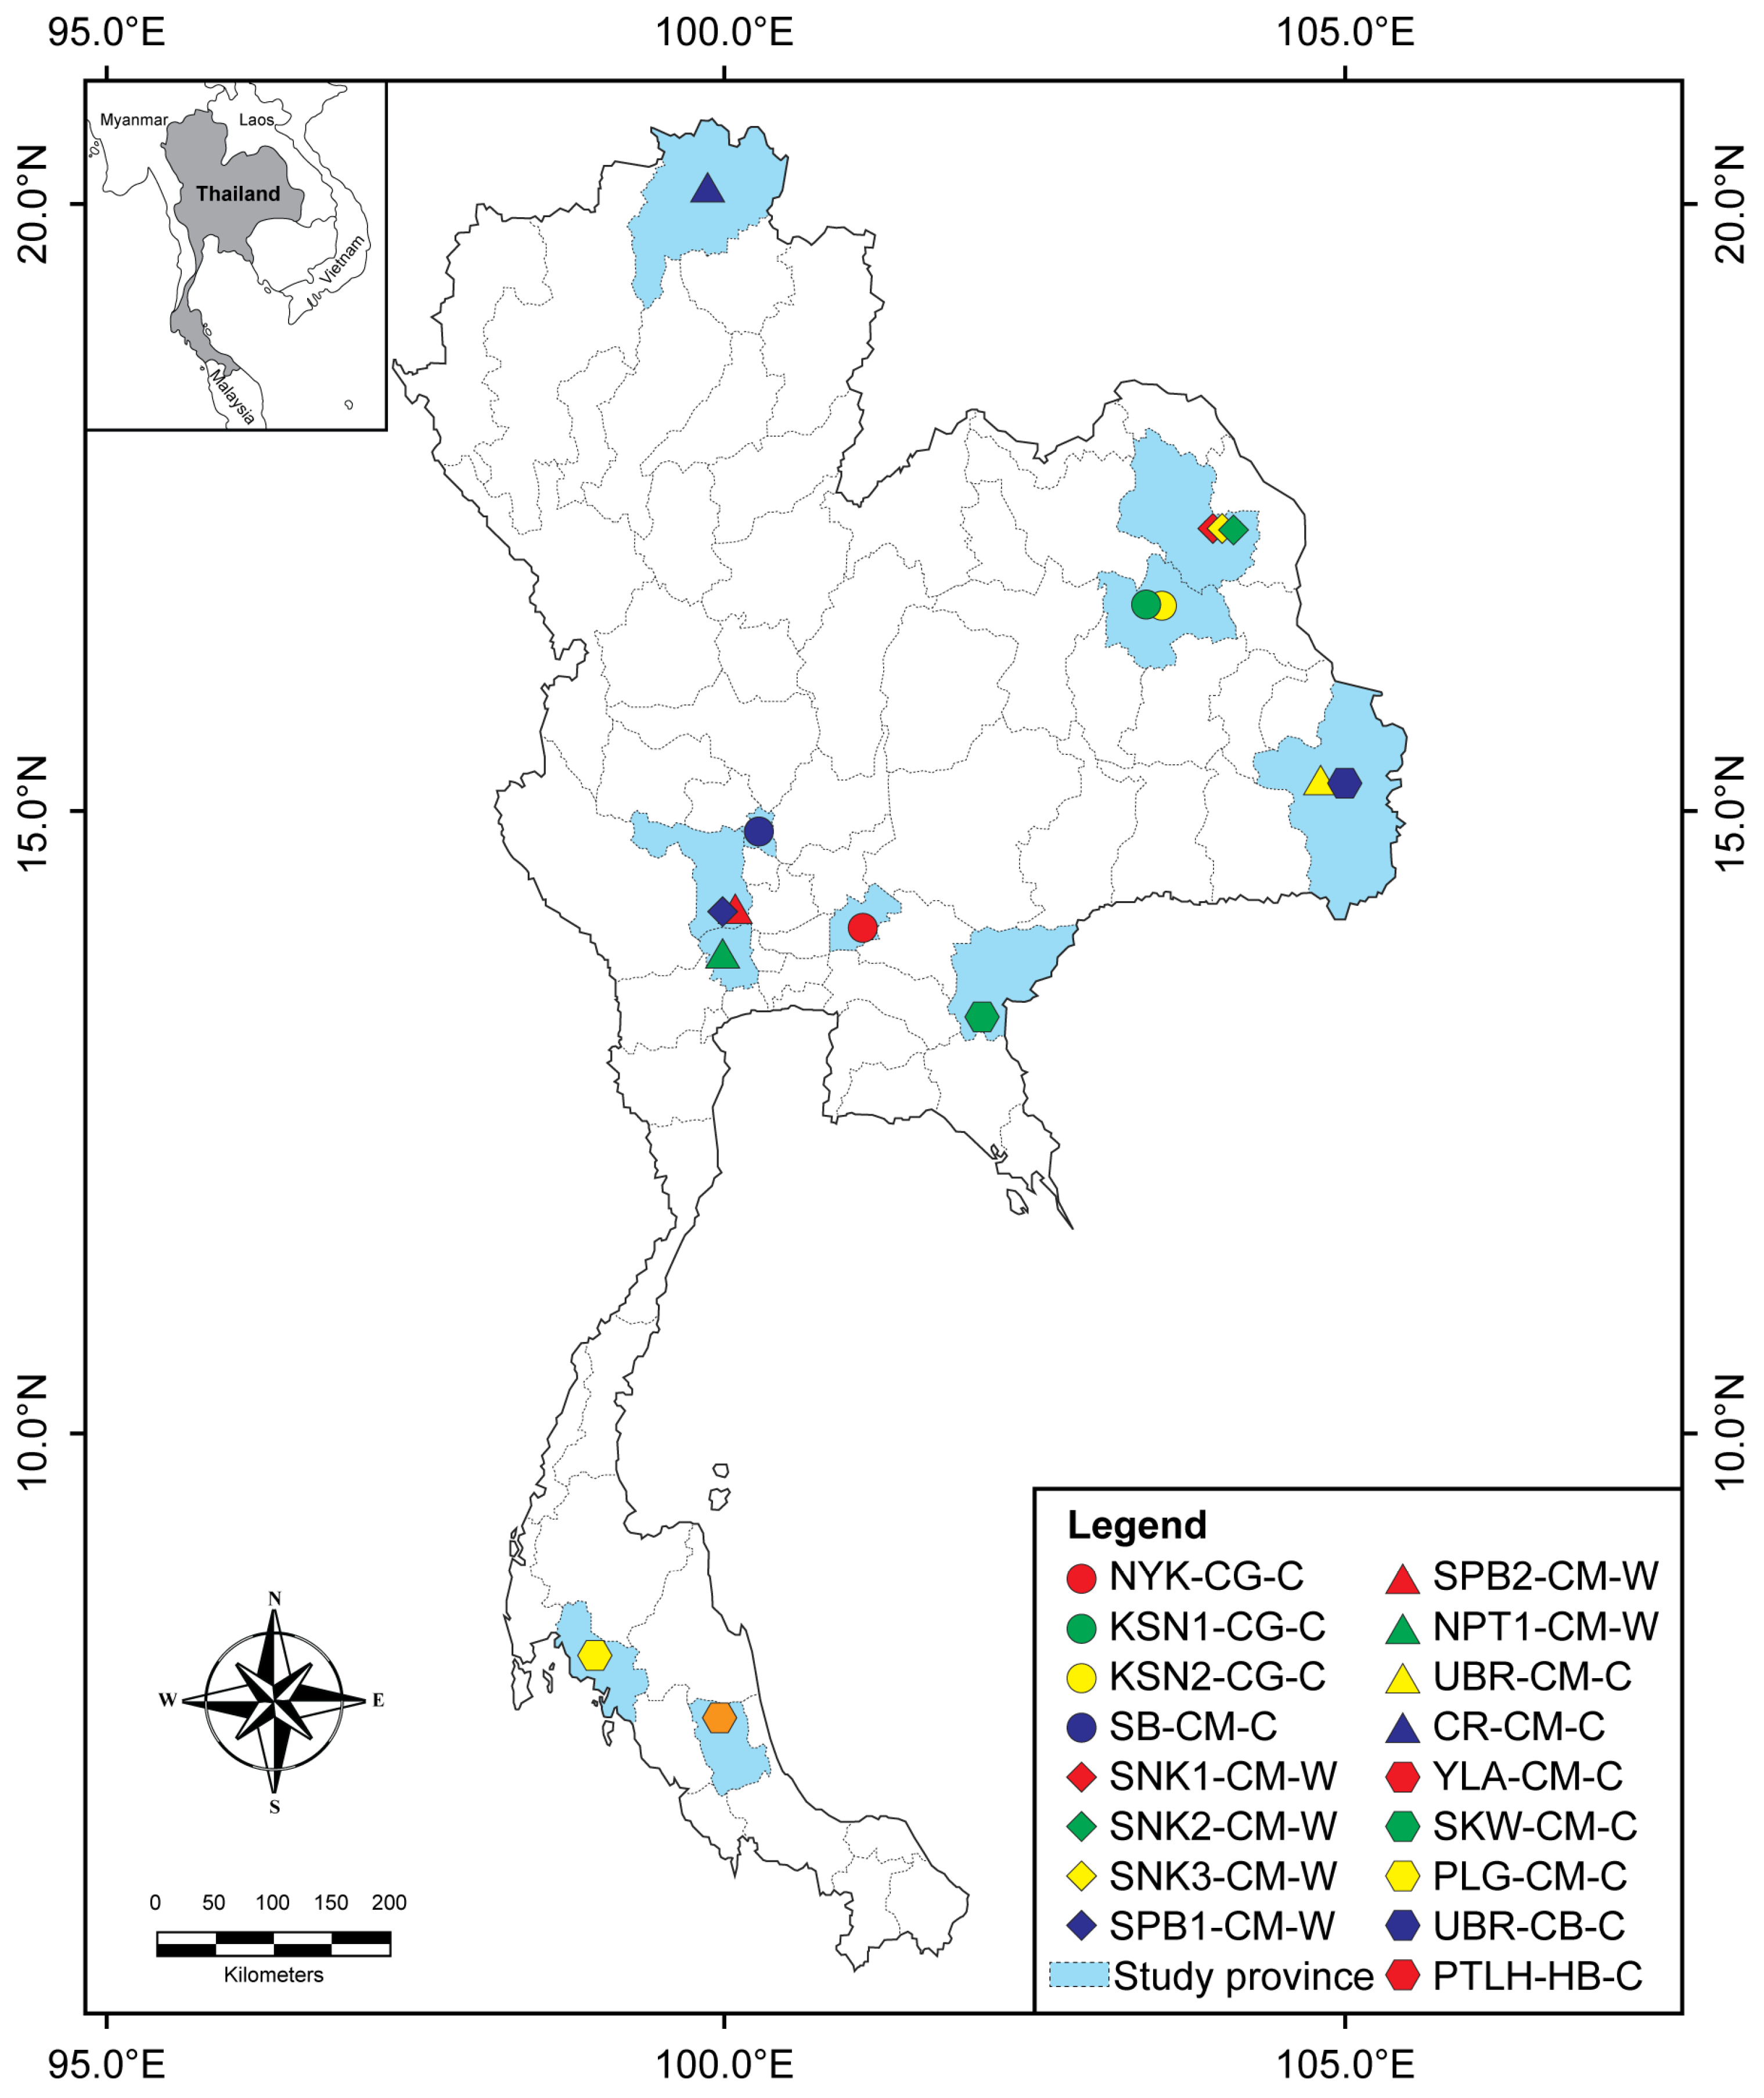
Figure 1. Distribution of sampling sites in Thailand. Province abbreviations are: NYK, Nakhon Nayok; KSN, Kalasin; SB, Sing Buri; SNK, Sakon Nakhon; SPB, Suphan Buri; NPT, Nakhon Pathom; UBR, Ubon Ratchathani; CR, Chiang Rai; YLA, Yala; SKW, Sa Kaeo; PLG, Phang Nga; and PTLH, Phatthalung. Species abbreviations are: CG, Clarias gariepinus; CM, C. macrocephalus; CB, C. batrachus; and HB, hybrid catfish. The final letter denotes the sampling source, where C indicates cultured populations and W indicates wild populations. Numerals distinguish different sampling locations within the same province (e.g., KSN1 and KSN2).
Genes 17 00920 g001
Figure 2. Phylogenetic tree of Myf5 genes. This tree uses 46 fish sequences, with 3 mammalian sequences as the outgroup. Each sector represents the following: orange, mammals; blue, Actinopterygii; green, Clariidae; yellow, Siluriformes species. The target haplotype (1–17) sequences form a distinct and well-supported monophyletic group. These sequences cluster closely with other Clarias species, indicating a high level of genetic conservation within the genus. By contrast, non-clariid Siluriformes form separate lineages, reflecting their evolutionary divergence from Clarias. The numbers at the nodes indicate Bayesian posterior probabilities.
Genes 17 00920 g002
Figure 3. Comparison of expected heterozygosity (He) against inbreeding coefficients (FIS) based on the Myf5 gene for 17 catfish populations.
Genes 17 00920 g003
Figure 4. Principal component analysis (PCoA) of integrated genomic variation based on the Myf5, Mstnb, and GH1 loci among the catfish populations in Thailand. Each population is plotted using different colors.
Genes 17 00920 g004
Figure 5. Bayesian clustering analysis of three African catfish and four bighead catfish populations in Thailand. The x-axis shows the proportion of membership (posterior probability) in each genetic cluster represented by different color bars, while the y-axis shows the individuals within each population. The optimal number of clusters was observed at K = 3 based on Evanno’s ΔK and ln Pr (X|K) criteria. The most probable number of K-values is represented by an asterisk (*) and star (⋆), according to Evanno’s ΔK and ln Pr (X|K) strategies, respectively.
Genes 17 00920 g005
Table 1. Nucleotide sequence diversity in catfish populations based on Myf5 sequences.
SpeciesPopulationCodeN 1Na 2Ne 3AR 4Ho 5He 6F 7FIS 8Π 9HWE 10
C. gariepinusNakho NayokNYK-CG-C 263.0001.683.000.5000.406−0.231−0.170.009 ns0.409 ns
Kalasin 1KSN1-CG-C705.0001.575.000.4290.363−0.180−0.070.009 ns0.877 ns
Kalasin 2KSN2-CG-C955.0001.605.000.3680.3740.015−0.010.005 ns0.001 **
Mean-1854.333 ±
0.943
1.62 ±
0.05
4.33 ±
0.94
0.432 ±
0.054
0.381 ±
0.018
−0.132 ±
0.106
−0.08 ±
0.06
0.008 ±
0.002
-
C. macrocephalusSing Buri 2SBR-CM-C22.0001.602.000.5000.375−0.333−0.330.014 ns0.637 ns
Sakon Nakhon 1SNK1-CM-W306.0003.266.000.5670.6930.1820.150.016 ns0.001 **
Sakon Nakhon 2SNK2-CM-W1367.0002.177.000.5960.539−0.105−0.030.015 ns0.677 ns
Sakon Nakhon 3SNK3-CM-W638.0002.628.000.7300.618−0.181−0.010.014 ns0.001 **
Suphan Buri 1SPB1-CM-W51.0001.001.000.0000.000N/A0.07--
Suphan Buri 2SPB2-CM-W31.0001.001.000.0000.000N/A−0.56--
Nakhon PathumNPT-CM-W22.0001.602.000.5000.375−0.333−0.330.021 ns0.637 ns
Ubon Ratchathani 1UBR-CM-C42.0001.282.000.2500.219−0.143−0.330.003 ns0.174 ns
Chiang RaiCR-CM-C212.0001.102.000.0950.091−0.050−0.050.003 ns0.819 ns
YalaYLA-CM-C192.0001.052.000.0530.051−0.027−0.030.003 ns0.906 ns
Sa KaeoSKW-CM-C181.0001.001.000.0000.000N/A−0.33--
Phang NgaPLG-CM-C31.0001.001.000.0000.000N/A−0.33--
Mean-3062.917 ±
2.431
1.56 ±
0.72
2.92 ±
2.43
0.274 ±
0.271
0.247 ±
0.252
−0.124 ±
0.158
−0.18 ±
0.21
0.007 ±
0.008
-
C. batrachusUbon Ratchathani 1UBR-CB-C34.0003.604.001.0000.722−0.385−0.330.010 ns0.775 ns
Hybrid catfishPhatthalungPTLH-HB-C115.0003.415.001.0000.707−0.415−0.250.016 ns0.138 ns
Overall mean value-5113.353 ±
2.195
1.80 ±
0.87
3.35 ±
2.20
0.387 ±
0.325
0.325 ±
0.260
−0.168 ±
0.158
−0.17 ±
0.19
0.008 ±
0.007
-
1 Number of individuals (N); 2 number of different alleles (Na); 3 number of effective alleles (Ne); 4 expected heterozygosity (He); 5 observed heterozygosity (Ho); 6 allelic richness per locus and population (AR); 7 fixation index (F); 8 inbreeding coefficient related to subpopulations (FIS); 9 nucleotide diversity (π); 10 Hardy–Weinberg Equilibrium (HWE); ** p < 0.001; ns not significant.
Table 2. Rates of synonymous (dS) and non-synonymous (dN) substitutions in nucleotide sequences of the Myf5 gene in catfish populations.
SpeciesPopulationCodeN 1dS (±SE)dN (±SE)ω (dN/dS)LRT 2p-Value
C. gariepinusNakho NayokNYK-CG-C 260.010 ± 0.0050.000 ± 0.000-0.0000.5
Kalasin 1KSN1-CG-C700.016 ± 0.0070.001 ± 0.0010.0630.0000.5
Kalasin 2KSN2-CG-C950.007 ± 0.0050.000 ± 0.000-0.0000.5
Mean-1850.011 ± 0.0040.001 ± 0.0000.0910.0000.5
C. macrocephalusSing Buri 2SBR-CM-C20.055 ± 0.0230.002 ± 0.0030.0360.0000.5
Sakon Nakhon 1SNK1-CM-W300.028 ± 0.0100.002 ± 0.0010.0713.8160.074
Sakon Nakhon 2SNK2-CM-W1360.015 ± 0.0070.001 ± 0.0010.0672.6730.131
Sakon Nakhon 3SNK3-CM-W630.023 ± 0.0090.002 ± 0.0010.0874.3010.058
Suphan Buri 1SPB1-CM-W50.000 ± 0.0000.000 ± 0.000---
Suphan Buri 2SPB2-CM-W30.000 ± 0.0000.000 ± 0.000---
Nakhon PathumNPT-CM-W20.052 ± 0.0210.003 ± 0.0030.058--
Ubon Ratchathani 1UBR-CM-C40.005 ± 0.0050.000 ± 0.000---
Chiang RaiCR-CM-C210.000 ± 0.0000.001 ± 0.001---
YalaYLA-CM-C190.000 ± 0.0000.001 ± 0.001---
Sa KaeoSKW-CM-C180.000 ± 0.0000.000 ± 0.000---
Phang NgaPLG-CM-C30.000 ± 0.0000.000 ± 0.000---
Mean-3060.015 ± 0.0200.001 ± 0.0010.0675.1020.038
C. batrachusUbon Ratchathani 1UBR-CB-C30.019 ± 0.0110.003 ± 0.0020.1580.0000.5
Hybrid catfishPhatthalungPTLH-HB-C110.050 ± 0.0190.002 ± 0.0020.0400.0000.5
Overall mean value-5110.016 ± 0.0190.001 ± 0.0010.0634.7310.046
1 Number of individuals (N); 2 Likelihood Ratio Test (LRT).
Table 3. The results of neutrality test for the Myf5 gene in catfish populations.
SpeciesPopulationCodeTajima’s DFu and Li’s DFu and Li’s F
C. gariephinusNakhon NayokNYK-CG-C−0.809 ns−0.809 ns−0.777 ns
Kalasin 1KSN1-CG-C−0.809 ns−0.809 ns−0.777 ns
Kalasin 2KSN2-CG-C−1.893 ns−1.893 ns−1.611 ns
Mean-−0.191 ns−0.191 ns−0.198 ns
C. macrocephalusSing BuriSB-CM-C−0.687 ns−0.687 ns−0.676 ns
Sakon Nakhon 1SNK1-CM-W−0.564 ns0.789 ns−0.802 ns
Sakon Nakhon 2SNK2-CM-W−0.724 ns0.578 ns−0.679 ns
Sakon Nakhon 3SNK3-CM-W−0.194 ns−0.194 ns−0.117 ns
Suphan Buri 1SPB1-CM-W---
Suphan Buri 2SPB2-CM-W---
Nakhon PathomNPT-CM-W---
Ubon Ratchathani 1UBR-CM-C---
Chiang RaiCR-CM-C---
YalaYLA-CM-C---
Sa KaeoSKW-CM-C---
Phang NgaPLG-CM-C---
Mean-−0.051 ns−0.381 ns−0.335 ns
C. batrachusUbon Ratchathani 2UBR-CB-C−0.956 ns−0.956 ns−0.904 ns
HybridPhatthalungPTLH-HB-C−0.895 ns−0.895 ns−0.943 ns
Overall mean value-−0.263 ns−0.189 ns−0.071 ns
ns, not significant. Statistical significance evaluated at q < 0.05 following Benjamini–Hochberg false discovery rate (FDR) correction. No significant deviations were observed.
Disclaimer/Publisher’s Note: The statements, opinions and data contained in all publications are solely those of the individual author(s) and contributor(s) and not of MDPI and/or the editor(s). MDPI and/or the editor(s) disclaim responsibility for any injury to people or property resulting from any ideas, methods, instructions or products referred to in the content.