Article

Tracing of Porcine lncRNA MALAT1 Shaped by Tissue Localisation and Adipogenesis

1
Department of Animal Molecular Biology, National Research Institute of Animal Production, 32-083 Cracow, Poland
2
Laboratory of Recombinant Proteins Production, Faculty of Veterinary Medicine, University of Agriculture in Kraków, 30-059 Cracow, Poland
3
Department of Infectious Diseases and Public Health, Faculty of Veterinary Medicine, University of Agriculture in Kraków, 30-248 Cracow, Poland
4
Department of Basic Sciences, Faculty of Veterinary Medicine, University of Agriculture in Kraków, 30-248 Cracow, Poland
*
Author to whom correspondence should be addressed.
Genes 2026, 17(8), 888; https://doi.org/10.3390/genes17080888
Submission received: 3 June 2026 / Revised: 14 July 2026 / Accepted: 25 July 2026 / Published: 29 July 2026
(This article belongs to the Special Issue New Updates in the Area of Pig Genomics and Genetics)

Abstract

Background: The long non-coding RNA MALAT1 is known to regulate various cellular processes; however, its role in porcine adipose tissue remains largely unexplored. Methods: In this study, we examined MALAT1 in pigs differing in fat-deposition traits by combining promoter sequencing, in silico analysis of transcription factor binding site analysis, expression profiling, and in vitro adipogenesis assays. Results: We identified three novel polymorphisms in the MALAT1 promoter regions. Several SNPs were predicted to alter binding sites for transcription factors related to metabolism and immunity, such as NFAT5, NFATC1, and BCL6B. One variant, rs329590882, differed significantly in frequency between breeds and may influence MALAT1 regulation. During adipocyte differentiation, expression of the MALAT1 isoform ENSSSCT00000080860 increased as adipogenesis progressed. Notably, this isoform was more highly expressed in lean-type Pietrain pigs than in the fatty Złotnicka Spotted (ZS) breed, suggesting that its function may not be directly related to fat accumulation. Additionally, we identified novel exon–exon junctions in MALAT1, including a junction associated with the ENSSSCT00000077869 isoform. Conclusions: These findings provide new insights into the potential role of MALAT1 in porcine adipose tissue development and immunometabolic regulation and highlight the need for improved annotation of porcine lncRNAs.

1. Introduction

MALAT1 (Metastasis-Associated Lung Adenocarcinoma Transcript 1) belongs to the class of long non-coding RNAs (lncRNAs), which play crucial roles in epigenetic and transcriptional regulation, including chromatin remodelling [1], microRNA sponging [2], and the enhancement [3] or inhibition of translation [4]. Although lncRNAs were once believed to lack protein-coding potential or to encode only small peptides without biological relevance, recent studies have implicated both lncRNAs and lncRNA-encoded peptides in processes such as carcinogenesis [5] and regulation of immune response [6]. Today, information about peptides encoded by lncRNA show that it plays an important role in the pathogenesis of many diseases [7]. MALAT1 was initially identified in the context of lung carcinogenesis, as reflected by its name [8]; however, this lncRNA performs a broad range of functions [9,10,11,12]. Studies using patient-derived lung adenocarcinoma cell lines have proven that MALAT1 overexpression promotes tumour progression and the recruitment of protumourigenic macrophages [13], thereby contributing to the reprogramming of the tumour microenvironment. Moreover, MALAT1 has been suggested to be an important factor in the development of chemotherapy resistance and, consequently, a potential target for overcoming it [14]. More recently, its role in metabolic disorders, particularly obesity, has been investigated [15,16]. Porcine MALAT1 was first described by Yang et al. [17], who identified a large set of lncRNAs across multiple porcine tissues. Its presence was subsequently confirmed by Piórkowska et al. [18], who found MALAT1 expression to be associated with subcutaneous fat (SF) thickness in Złotnicka White (ZW) pigs. Nevertheless, porcine MALAT1 is still classified as a novel gene in the Ensembl database, and the exact number of its transcript variants has not yet been fully established. According to Ensembl release 113 (October 2024 © EMBL-EBI), porcine MALAT1 is located on chromosome 2 on the reverse strand at position 6,751,519–6,757,180 and is predicted to have two isoforms, ENSSSCT00000077869 and ENSSSCT00000080860. Promoter regions upstream of both isoforms have been annotated based on ATAC-seq (assay for transposase-accessible chromatin using sequencing) or ChIP-seq (chromatin immunoprecipitation sequencing) data. In our previous study on differentially expressed lncRNAs associated with subcutaneous fat deposition [19], we identified a putative additional MALAT1 isoform that is not annotated in the Ensembl database. This transcript contains an intronic sequence and exhibits an approximately 84% sequence similarity to human TALAM1 (Transcript Antisense to MALAT1, accession number NR_145459.1), an antisense RNA that overlaps MALAT1 (NR_002819.5) in the human genome, according to the NCBI.
Adipogenesis is the molecular process by which precursor cells, such as preadipocytes, differentiate into mature, lipid-laden, and insulin-responsive adipocytes. This process comprises several developmental stages, developing from mesenchymal precursors into fully differentiated adipocytes. Successful differentiation requires coordinated changes in preadipocyte morphology, which is regulated by interactions with the surrounding environment and numerous genes that induce or modulate the adipogenic programme. However, the understanding of many molecular aspects of adipogenesis remains incomplete and continues to be refined, particularly in the context of adipocyte turnover and obesity [20]. In addition to excessive caloric intake, obesity is influenced by genetic and epigenetic factors that affect adipose tissue development and function [21]. Increasing attention has also been directed toward non-coding RNA (ncRNA), which exerts a regulatory effect in adipose tissue beyond the protein level. The contribution of ncRNA to adipogenesis has been extensively investigated, particularly in studies focusing on small ncRNA, such as microRNA (miRNA) [22]. More recently, the involvement of lncRNAs in the regulation of adipogenesis and energy metabolism has become increasingly apparent [23]. As ncRNAs may serve as potential therapeutic targets for obesity and related metabolic disorders [24], elucidating their specific functions in adipocyte differentiation is of growing interest. In bovine preadipocytes and differentiated adipocytes cultured in vitro, the lncRNA ADNCR (adipocyte differentiation associated long non-coding RNA) was shown to inhibit adipocyte differentiation by acting as a competing endogenous RNA (ceRNA) for miR-204. This interaction increased the expression of sirtuin 1 (SIRT1), a factor associated with the suppression of PPAR-γ activity [25]. In mice, knockout of the lncRNA steroid receptor RNA activator (SRA) was conferred in resistance to high-fat-diet-induced obesity [26]. In our previous study, we identified MALAT1 as a potential regulator of fat deposition based on its backfat-dependent expression in porcine adipose tissue [18]. However, the reported role of MALAT1 in obesity and related disorders remains inconsistent [27]. MALAT1 is highly abundant in exosomes derived from human adipose stem cells and is largely retained during their differentiation into adipocytes [28]. Although MALAT1 expression decreases in visceral white adipose tissue of aged mice, its function in adipose tissue remains unclear [27]. Other studies have found that MALAT1 expression in adipose tissue is positively associated with the adipogenesis-related genes FABP4 and LPL, suggesting that MALAT1 may promote adipose tissue development. MALAT1 has also be reported to modulate PPARγ expression and contribute to adipogenesis through the PPAR signalling pathway while also participating in fatty acid metabolism and insulin signalling [29]. In summary, these findings highlight the increasingly recognised functional diversity of lncRNAs in adipogenesis, extending it beyond the regulation of classical protein-coding genes.
Given the limited knowledge of MALAT1 in pigs, this study aimed to partly address this gap by characterising porcine MALAT1, with particular emphasis on its potential role in adipogenesis and fat deposition. To assess its regulatory relevance, we analysed MALAT1 expression patterns and sequence variants in Złotnicka Spotted (ZS) and Pietrain pigs, which differ phenotypically in their fat-deposition profiles.

2. Materials and Methods

2.1. Animals

The experimental design included 8 male pigs, with ZS representing the high-fat phenotype (n = 4) and Pietrain representing the lead phenotype (n = 4). All animals were maintained under standard husbandry and feeding conditions at the Pig Testing Station of the National Research Institute of Animal Production in Krakow, Poland. The pigs were slaughtered at a live body weight of approximately 100 kg. Backfat thickness was measured at the K1 point, located above the lateral edge of the longissimus dorsi muscle. Detailed phenotypic characteristics, including fat- and muscle-related traits, are presented in Table 1 and confirm the phenotypic contrast between the high-fat and lean pig types. Samples were collected from the following four anatomical locations: liver (L), longissimus dorsi muscle (M), abdominal subcutaneous adipose tissue (AD), and backfat, dorsal adipose tissue (AB). All tissues were snap-frozen in liquid nitrogen and stored at −80 °C until further analysis. Additionally, fragments of dorsal subcutaneous adipose tissue measuring 1 × 1 × 0.5 cm3 were excised, minced, and placed in depot-specific culture media for primary adipocyte isolation. All animals were used for qPCR and histological analyses. Cell culture experiments, including proliferation and differentiation, as well as Oil Red O staining, were conducted using samples from only ZS pigs. These experiments were performed in three technical replicates, defined as three individual wells per animal on culture plates. Because the animals were slaughtered for food production and tissue collection was performed post mortem, specific approval from the Animal Experimentation Committee was not required. Nonetheless, the experiment was conducted under the supervision and approval of the Approving Experiment Committee of the National Research Institute of Animal Production in accordance with the Polish Act of 15 January 2015 on the Protection of Animals Used for Scientific or Educational Purposes, which implements Directive 2010/63/EU of the European Parliament and Council. All procedures complied with applicable institutional and national ethical standards.
Animal characteristics: The ZS and Pietrain pigs differed significantly in several body composition traits. The two groups showed a similar yield percentage (~75 kg). However, marked differences were observed in fat- and meat-related traits, including ham and tenderloin masses, loin eye area, and subcutaneous fat thickness in the ham, loin, shoulder, and lumbar regions. The greatest differences between the groups were in backfat thickness at the K1 point (cm), located above the lateral edge of the longissimus dorsi muscle. The analysed pig breeds also differed in overall meat and fat contents, which is consistent with previous studies comparing these breeds. Mean values for the selected phenotypic traits are presented in Table 1.
For the analysis of polymorphism in the MALAT1 promoter region, genomic DNA was isolated from blood samples of 168 pigs, with 24 animals representing each of the following breeds: ZS, ZS, Pietrain, Polish Large White (PLW), Polish Landrace (PL), Duroc and Puławska. All samples were obtained from the biological material collection maintained at the National Research Institute of Animal Production. The samples were previously collected and archived as part of earlier genetic studies conducted at the same institution.

2.2. Isolation and Culture of Porcine Preadipocytes

Subcutaneous adipose tissue samples were collected from the dorsal fat depot of adult ZS pigs (n = 4). Immediately after excision, 3–4 fragments (~1–2 g) from each depot were aseptically transferred to sterile containers filled with PBS supplemented with 2% Gibco™ Antibiotic–Antimycotic (10,000 units/mL of penicillin, 10,000 μg/mL of streptomycin, and 25 μg/mL of Gibco Amphotericin B, Thermo Fisher Scientific, Waltham, MA, USA). Tissues were manually dissected into smaller fragments under sterile conditions. Preadipocytes were isolated using the Preadipocyte Isolation Kit (Abcam, Cambridge, UK), according to the manufacturer’s protocol, with modifications to optimise for porcine samples. Briefly, fragmented tissue was enzymatically digested using collagenase (1 mL per 0.5 g of tissue) at 37 °C for 30 min with continuous agitation at 150 rpm on a shaker (Corning, Falcon, Sigma-Aldrich, Saint Louis, MO, USA). Digestion was terminated by adding collagenase stop buffer, followed by gentle mixing and filtration through a 100 µm cell strainer (Corning® LSE™ low speed orbital shakers, Corning, Sigma-Aldrich, Saint Louis, MO, USA). The resulting cell suspension was centrifuged at 500× g for 10 min, and the supernatant containing mature adipocytes was carefully removed. The pellet was resuspended in 1 mL of Red Blood Cell Lysis Buffer for 1 min, followed by dilution in PBS and filtration through a 70 µm cell strainer. After a second centrifugation, the resulting pellet was resuspended in DMEM/F12 (Gibco, Thermo Fisher Scientific, Waltham, MA, USA), supplemented with 10% foetal bovine serum (FBS; Gibco, Thermo Fisher Scientific, USA) and 1% Gibco™ Antibiotic–Antimycotic (Thermo Fisher Scientific, Waltham, MA, USA), and seeded into 6-well culture plates. Cells were maintained at 37 °C and 5% CO2 until reaching 80–90% confluence, with non-adherent cells removed after 24 h.

2.3. Materials for Adipogenic Differentiation and Lipid Accumulation Assay

Preadipocytes were induced to undergo adipogenic differentiation using the 3T3-L1 Differentiation Kit (Abcam, Cambridge, UK), following the manufacturer’s protocol. To initiate the process, the culture medium was replaced with fresh medium supplemented with a differentiation cocktail (1 µL/mL; containing insulin, dexamethasone, and IBMX) and cells were incubated for 3 days. After this induction phase, cells were switched to maintenance medium containing insulin (1 µL/mL) and cultured for an additional 7–14 days, with the medium refreshed every 2–3 days to support adipocyte maturation and lipid accumulation. Cells were maintained under standard conditions throughout the culture period.
Adipogenic differentiation was assessed by morphological changes and confirmed using Oil Red O staining on days 2, 7 and 14 to visualise intracellular lipid accumulation. Cells were fixed in 4% paraformaldehyde, stained with Oil Red O working solution, and imaged under a light microscope (Leica, Wetzlar, Germany).

2.4. Histological Fat Tissue Preparation

Adipose tissue samples were snap-frozen by immersion in pre-cooled 2-methylbutane (isopentane) chilled with liquid nitrogen to approximately −80 °C. The frozen blocks were stored at −80 °C until sectioning. Prior to cryosectioning, tissue blocks were equilibrated to the cryostat chamber temperature (−20 °C) for 30 min to minimise artefacts. Serial sections of 10 μm thickness were cut using a cryostat (Leica, Wetzlar, Germany) and mounted onto Superfrost Plus microscope slides (Thermo Fisher Scientific Waltham, MA, USA). Sections were air-dried at room temperature for 15 min prior to downstream analyses.

2.5. Cell Nuclei Staining of Fat Tissue Cells

Frozen adipose tissue sections (7–10 μm thick) were prepared using a cryostat, air-dried, and fixed in 10% neutral buffered formalin for 10 min. Sections were rinsed in 60% isopropanol and stained with Mayer’s haematoxylin and eosin (H&E) (Sigma-Aldrich, Saint Louis, MO, USA)for 10 min. After staining, slides were washed in 60% isopropanol and distilled water. Sections were mounted with an aqueous mounting medium. Cell nuclei were visualised in blue under light microscopy. Images were acquired using an Olympus (×20) BX51 Upright Brightfield/Darkfield Materials Microscope (Olympus, Tokio, Japan) and processed using ImageJ (National Institutes of Health, Bethesda, MD, USA).

2.6. RNA and DNA Isolations

Total RNA was isolated from porcine tissues using protocols adapted to specific tissue types. Subcutaneous abdominal and dorsal adipose was processed with the Tissue RNA Mini Kit (Syngen Biotech, Wrocław, Poland), muscle tissue with TRIsol reagent (Invitrogen, Thermo Fisher Scientific, Waltham, MA, USA), and liver tissue with PureLink™ RNA Mini Kit (Invitrogen, Thermo Fisher Scientific, Waltham, MA, USA), in all cases according to the manufacturers’ instructions. For the in vitro experiment, total RNA was also isolated from preadipocytes at the proliferation stage (day 0) and on days 3, 7, and 14 of adipogenic differentiation using the RNeasy® Micro Kit (Qiagen, Hilden, Germany). RNA integrity (RIN) and quality were assessed using TapeStation 2200 (Agilent Technologies, Santa Clara, CA, USA). Samples were considered acceptable when the RIN was >9 for RNA isolated from cells and RIN > 7 for RNA isolated from tissue.
Genomic DNA was isolated from liver and blood samples collected from pigs representing the following seven breeds: ZS, ZW, Pietrain, PLW, PL, Duroc, and Puławska. DNA extraction was performed using Sherlock XP (A&A Biotechnology, Gdańsk, Poland).

2.7. Reverse Transcription and Gene Expression

Reverse transcription was performed using the High-Capacity RNA-to-cDNA™ Kit (Applied Biosystems™, Thermo Fisher Scientific, Waltham, MA, USA), following the manufacturer’s protocol. Relative quantification (RQ) of MALAT1 and adipocyte differentiation marker LPL (lipoprotein lipase) was carried out using a QuantStudio™ 7 Flex Real-Time PCR System (Applied Biosystems™, Thermo Fisher Scientific, Waltham, MA, USA). For the two porcine MALAT1 isoforms (ENSSSCT00000080860 and ENSSSCT00000077869), primers and probes were designed using Primer Express 3.0 (Applied Biosystems™, Thermo Fisher Scientific, Waltham, MA, USA). The reference genes used for normalisation were RPL27 (Ribosomal Protein L27), RPS29 (Ribosomal Protein L29), and OAZ1 (Ornithine Decarboxylase Antizyme 1) [30]. Gene expression levels were calculated using the ΔΔCt method [31]. The details of all assays, primers and probes are listed in Supplementary Table S1.

2.8. MALAT1 Promoter and Exon–Exon Junction Sequencing

DNA and cDNA samples of the ZS and Pietrain breeds were used in this experiment. RNA was isolated from fat-related tissue (subcutaneous dorsal and abdominal adipose tissue, liver and muscle). The reverse transcription procedure is described above. Supplementary Table S1 presents primer pairs, lengths of amplicons employed, type of biological material used as a template (DNA or cDNA), and MALAT1 isoform tested. PCR products were visualised by agarose gel electrophoresis. Product specificity was additionally assessed by melting curve methods on Quant Studio 7 Flex (Applied Biosystems™, Thermo Fisher Scientific, Waltham, MA, USA)for yielding more than one PCR product, and nested PCR was performed using the same primer pair and 1 µL of the initial PCR product as the template. Fallowing nested PCR, the selected product was excised from the agarose gel and purified using a gel extraction and PCR purification kit (Sigma-Aldrich, Saint Louis, MO, USA). The purified product was sequenced with the Sanger method using the BigDye™ Terminator v3.1 Cycle Sequencing Kit and 3500 Series Genetic Analyzer (Applied Biosystems™, Thermo Fisher Scientific, Waltham, MA, USA). Sequencing chromatograms were analysed using a FinchTV 1.4.0 (Geospiza, Inc. North Tower, WA, USA), and the resulting sequences were aligned using Clustal Omega 1.2 (EMBL-EBI). Promoter analysis covered regions of 1500 pb upstream transcription start site (TSS) for both isoforms. The primer pairs used for promoting amplification are listed in Table S1. All promoter-region amplicons were subjected to Sanger sequencing to identify potential sequence variants within this region.
Differences in putative transcription factor binding sites in MALAT1 promoter regions were identified using XSTREME, implemented in MEME suite 5.5.8 with the default settings. The identified motifs were matched to transcription factors using TOMTOM, implemented in the MEME suite 5.5.8, a motif comparison tool.

2.9. Statistical Analysis

All other statistical analyses were performed using SAS Enterprise Guide 8.3. A two-way ANOVA, with tissue (liver and subcutaneous adipose tissues and muscle) and breed (ZS and Pietrain) as fixed factors, was conducted to analyse gene expression, as well as adipocyte area and diameter with breed (ZS and Pietrain) and anatomical region (dorsal and abdominal) as fixed factors, followed by a post hoc test.

3. Results

3.1. Histological Structure of Subcutaneous Adipose Tissue

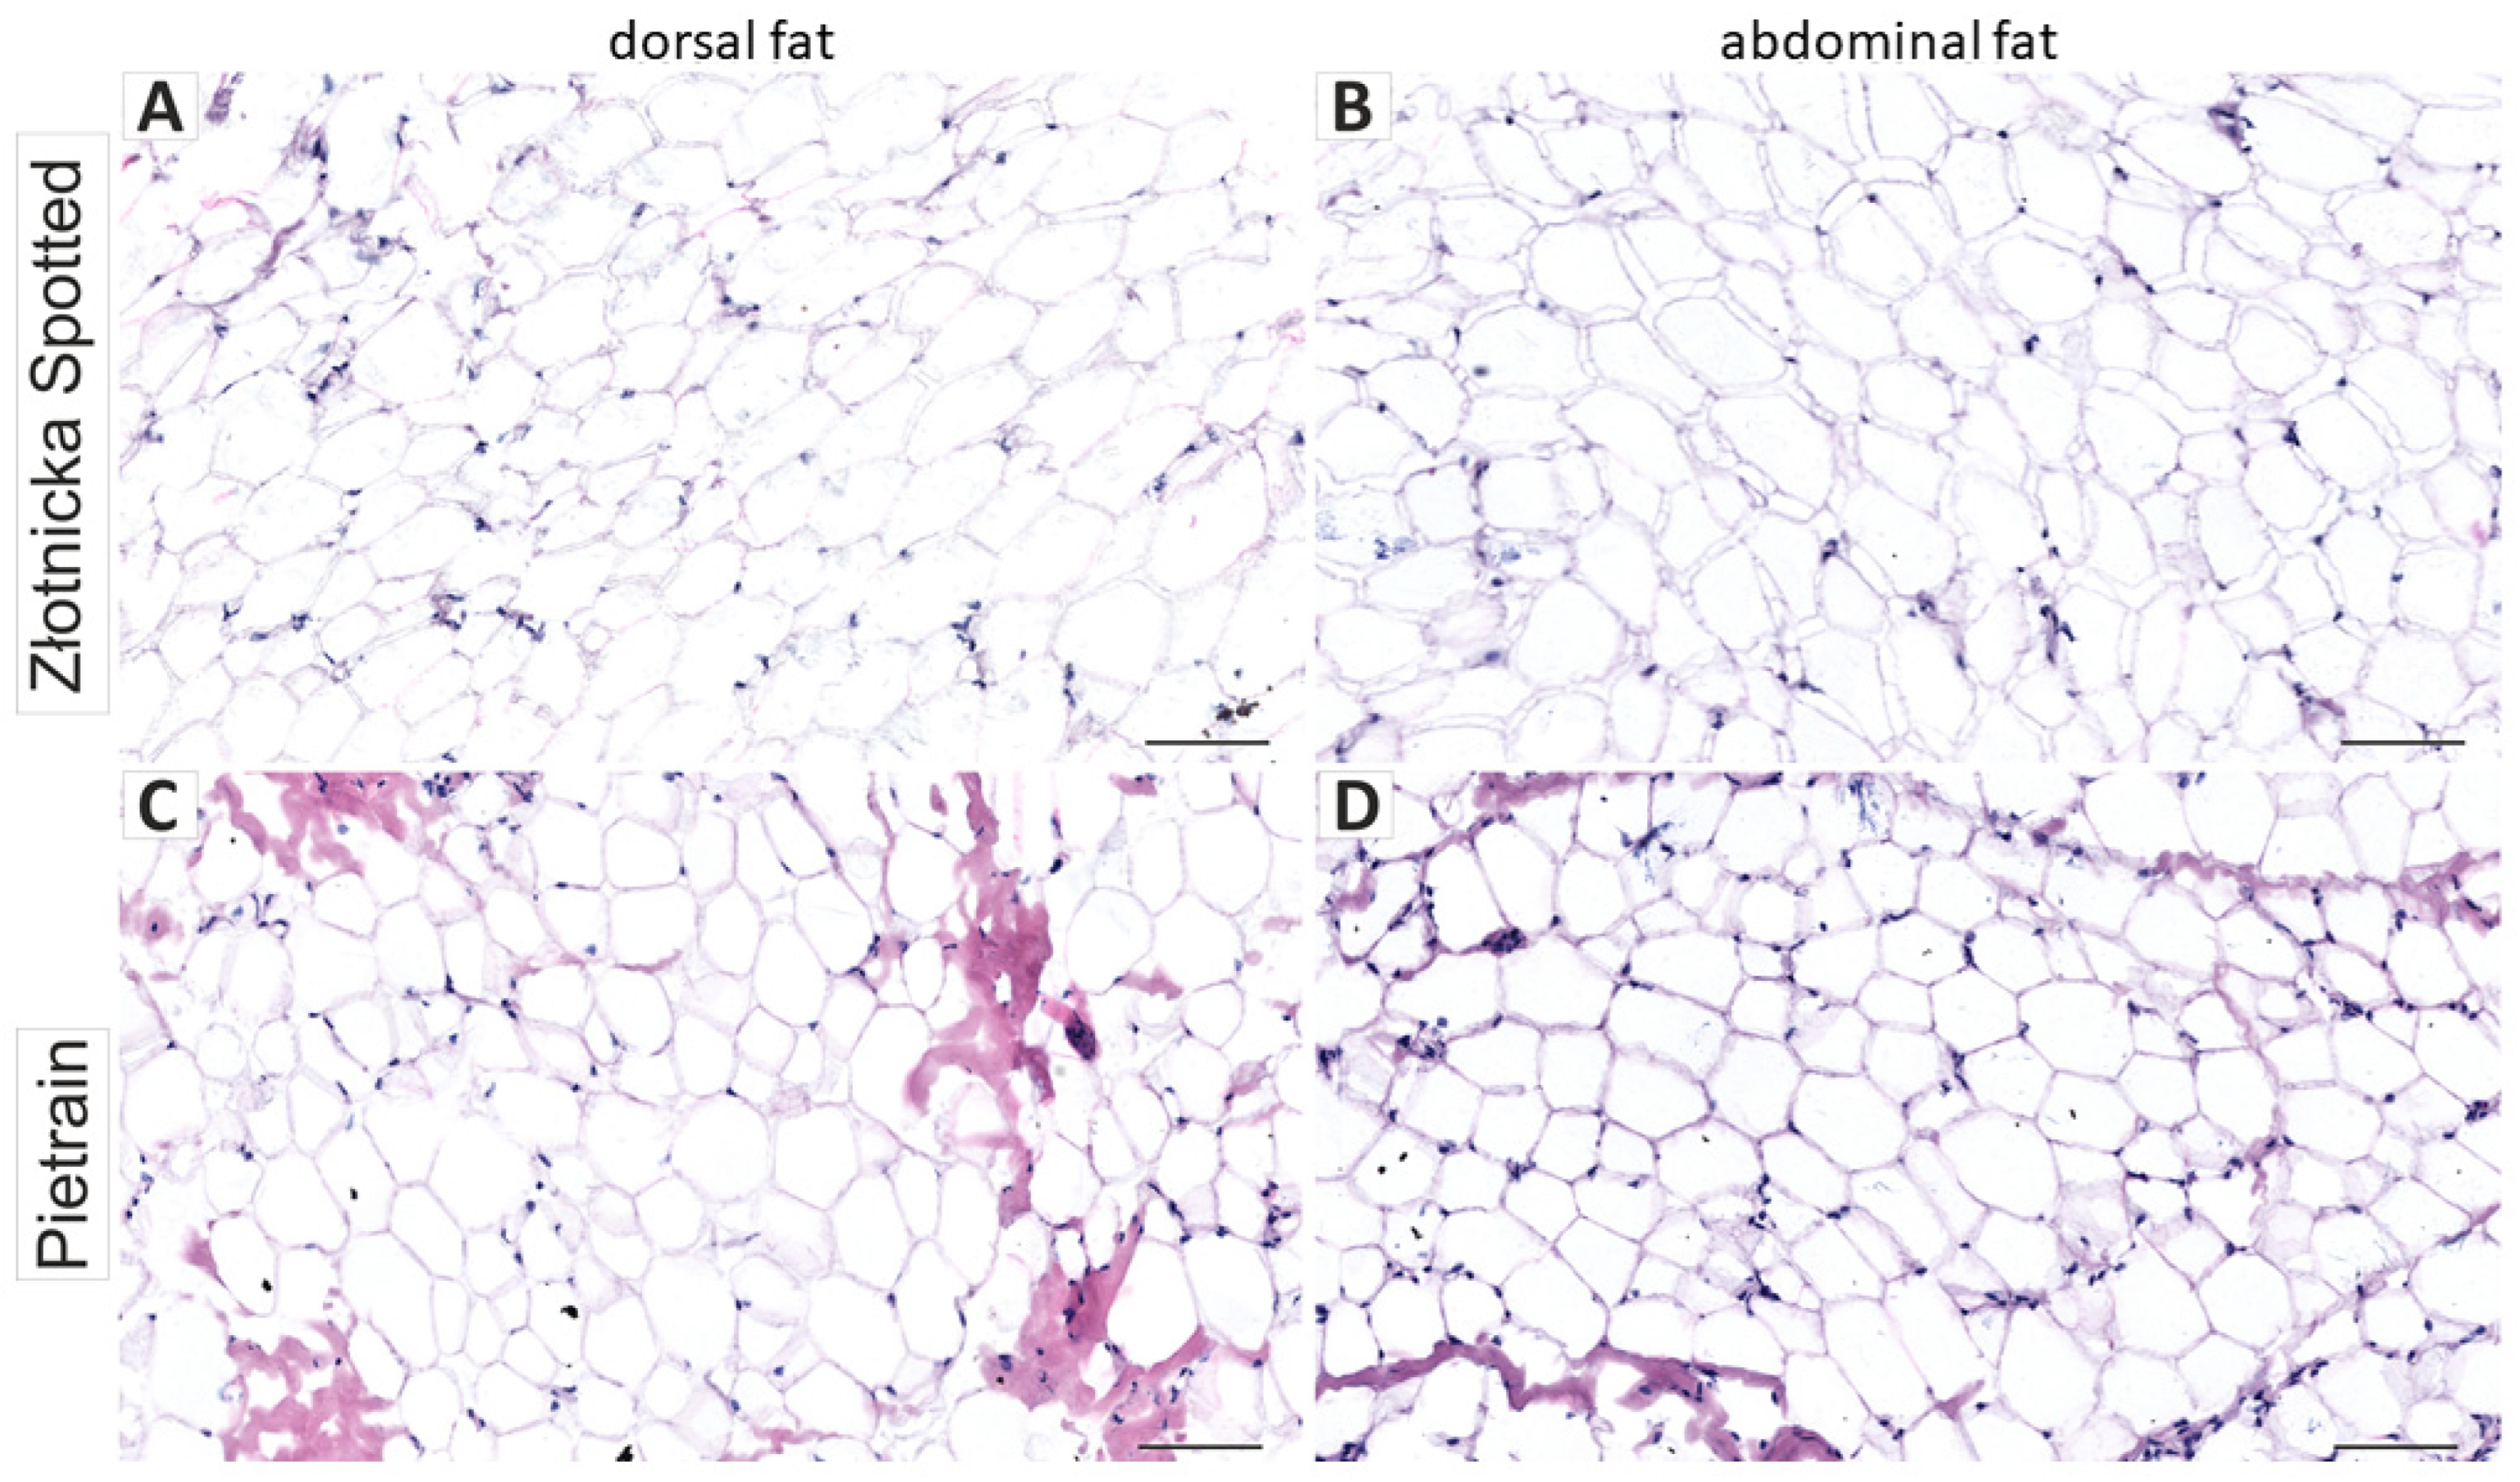
Adipocytes are visible as large, vacuolated cells with peripherally located nuclei. The adipose tissue of ZS shows larger adipocytes and greater lipid accumulation, whereas the Pietrain pigs display smaller, more compact adipocytes with relatively thicker connective tissue septa. These histological differences correspond to the higher fat-deposition capacity of ZS pigs compared with the lean, muscular phenotype of Pietrain (Figure 1).
Quantitative analysis of adipocyte morphology was performed based on measurements using ImageJ. Adipocytes from ZS pigs were significantly larger than those from Pietrain pigs in both anatomical regions. The largest adipocytes were observed in the dorsal adipose tissue of ZS pigs (mean diameter ≈ 82 µm), while the smallest occurred in the abdominal fat of Pietrain pigs (≈63 µm). These morphometric findings are consistent with the histological observations that support the classification of ZS pigs as representing a high-fat phenotype, whereas Pietrain pigs exhibit a lean phenotype characterised by smaller adipocytes and lower lipid accumulation. Two-way ANOVA was performed separately for adipocyte area and diameter, with breed (ZS and Pietrain) and anatomical region (dorsal and abdominal) as fixed factors. The analysis showed a significant effect of breed on both parameters (p < 0.001), indicating that ZS pigs had larger adipocytes than Pietrain pigs. A significant effect of region (p < 0.01) was also detected, with adipocytes in the dorsal fat being larger than in the abdominal fat. Additionally, a breed and region interaction was observed (p < 0.05), suggesting that regional differences were pronounced in ZS pigs but not in Pietrain pigs (Table 2).

3.2. Adipogenic Differentiation and Lipid Accumulation Assay

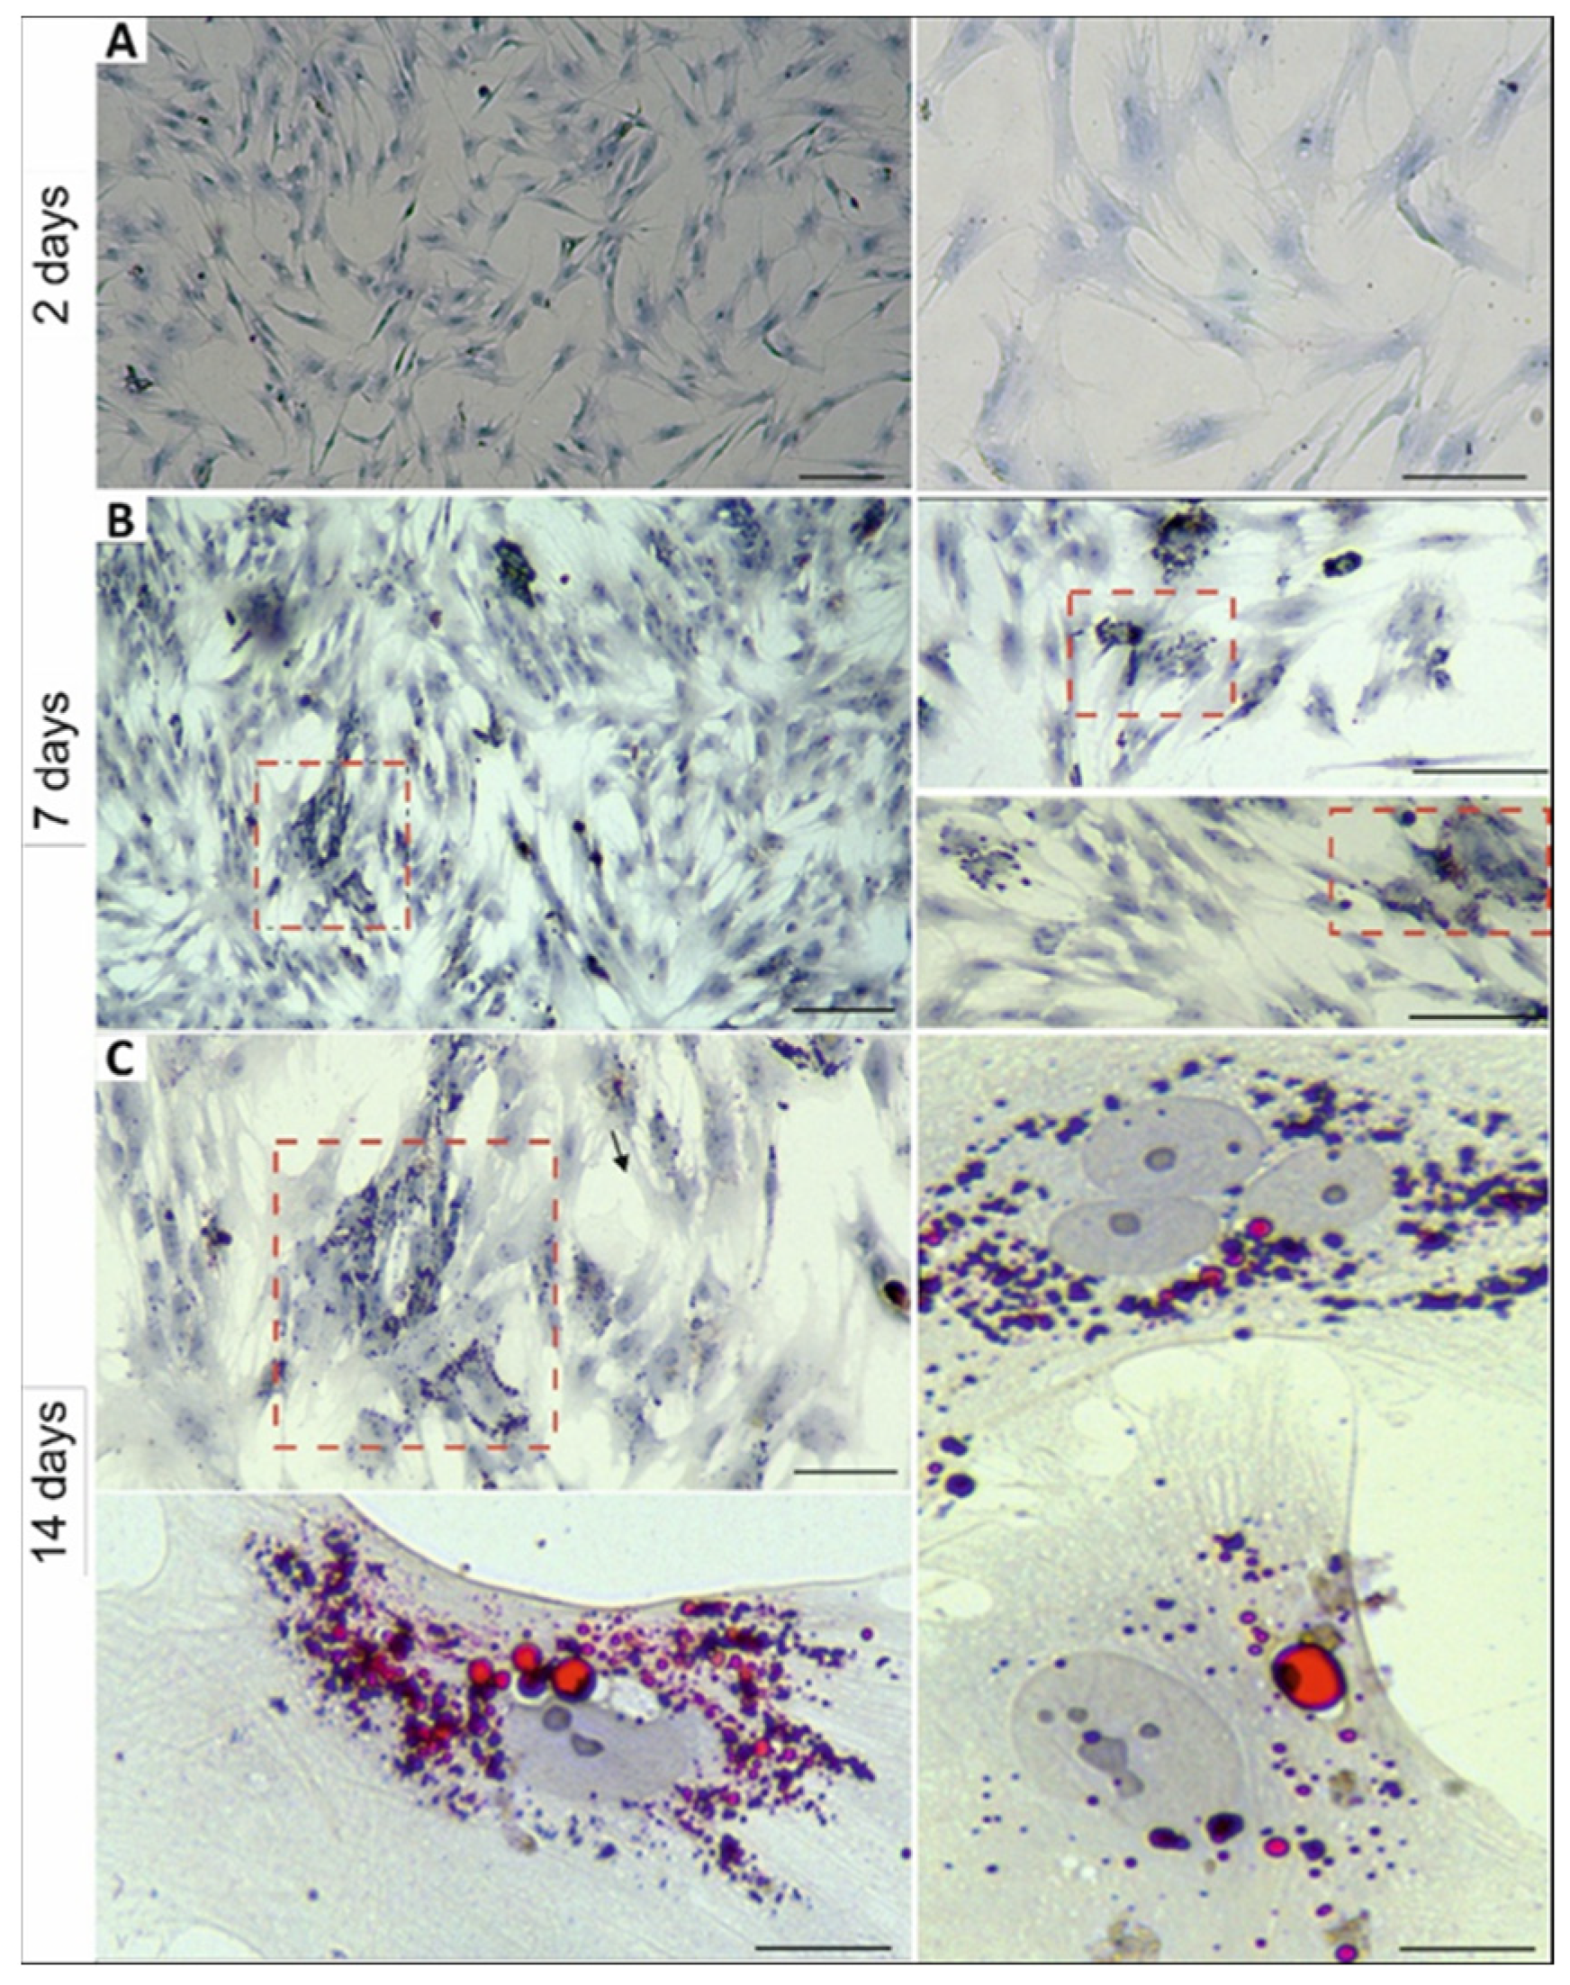
In parallel, porcine preadipocytes isolated from the dorsal depot were cultured and subjected to adipogenic differentiation. Morphological changes characteristic of adipogenesis, including increased cell size and lipid droplet formation, were observed over time. After 14 days of differentiation, Oil Red O staining confirmed successful intracellular lipid accumulation (Figure 2).

3.3. MALAT1 Promoter Sequencing

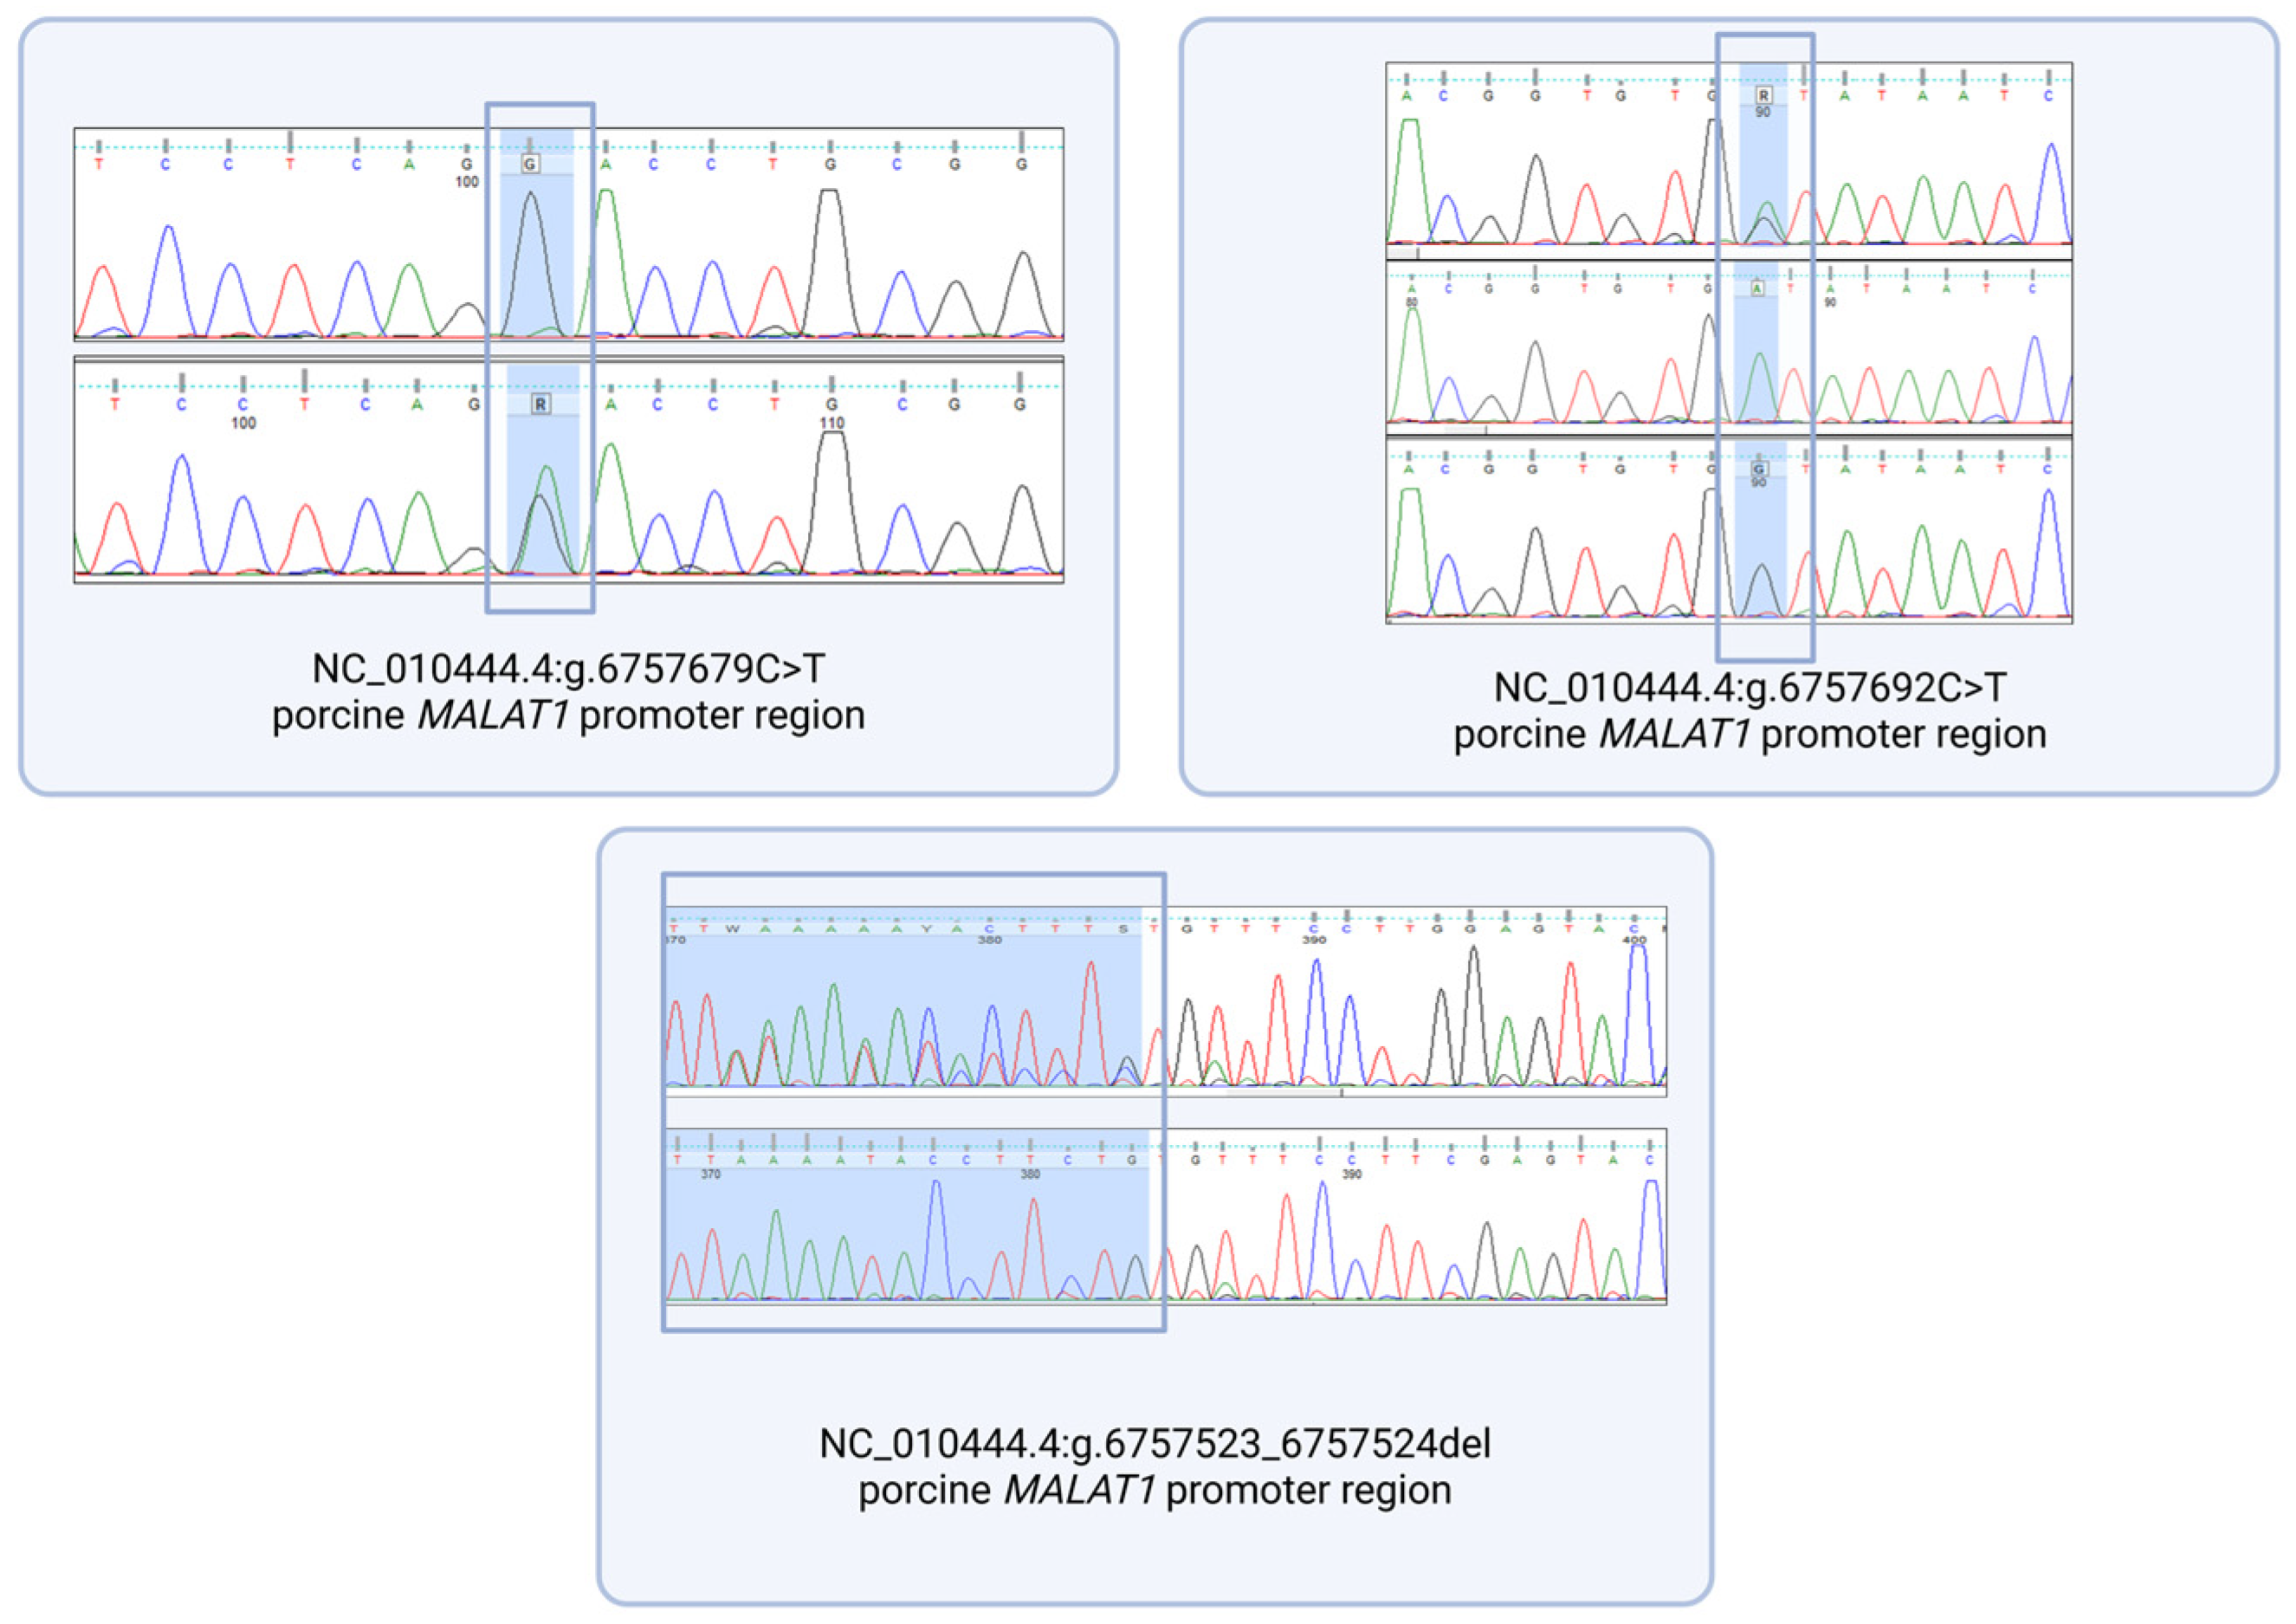
Sanger sequencing was carried out for two promoter regions corresponding to the porcine MALAT1 isoforms ENSSSCT00000080860 and ENSSSCT00000077869. The analysis included seven pig breeds representing both commercial and native Polish populations. In total, 10 polymorphisms were identified across both promoter regions. Seven of these variants had previously been reported (rs338099140, rs329590882, rs321550593, rs333963848, rs318806718, rs319966827, and rs338175674) (Ensembl genome browser 115). In addition, the following three novel variants were identified in the present study: NC_010444.4:g.6757523_6757524del, NC_010444.4:g.6757692C>T, and NC_010444.4:g.6757679C>T (Figure 3). All identified porcine MALAT1 promotor variants were submitted as haplotypes to the NCBI database under accession numbers OR941310–OR941322.
The allele frequency of these polymorphisms was estimated in seven breeds (Table 3). For example, the minor allele of rs338099140 occurred at a frequency of 27% in ZW but was rare in remaining breeds. The rs329590882 variant was found at a low frequency in PL. The rs321550593G allele showed the highest frequency (18.8%) in Złotnicka Spotted, while rs695444210(-) exceeded 30% in ZW. The newly identified deletion g.6757523_6757524del was observed exclusively in Duroc and ZS pigs. Common variants such as rs333963848G, rs318806718G, and rs338175674G were detected across all breeds, although at varying frequencies. Notably, the novel SNP NC_010444.4:g.6757718G>A exhibited the highest frequency (31.3%) in Pietrain pigs.

3.4. In Silico Prediction of Transcription Factor Binding in MALAT1 Promoters

All polymorphisms identified within the promoter regions of the porcine MALAT1 gene were analysed for their potential effects on transcription factor binding sites (TFBSs) using the XSTREME module in MEME Suite. Multiple sequence motifs corresponding to putative TFBSs were predicted (Table S2). Based on our previous transcriptomic analyses of liver and backfat tissue stratified according to fat-deposition levels [18,32] (GEO accession GSE160436), the expression of selected transcription factors was confirmed in the relevant tissues. Particular attention was given to TFs predicted to bind at polymorphism sites within the MALAT1 promoter regions. The rs329590882 variant, which was rare in Duroc and PL, was predicted to affect binding sites for NFAT5 (Nuclear Factor of Activated T-Cells 5), ZNF75D (Zinc Finger Protein 75D), and ERF (ETS2 Repressor Factor). The rs321550593 variant, which was relatively frequent in ZS, was associated with predicted binding motifs for SOX13 (SRY-Box Transcription Factor 13), SRF (Serum Response Factor), and HOMEZ (Homeodomain Leucine Zipper-Containing Factor). The novel NC_010444.4:g.6757692C>T variant, which was frequent in Pietrain, was located within predicted binding sites for MSX1 (Msh Homeobox 1) and FOXK1 (Forkhead Box K1). In addition, rs318806718, which was rare in Duroc, was located within the predicted TFBSs for PBX3 (Pre-B-Cell Leukaemia Homeobox 3), NR1D1 (Nuclear Receptor Subfamily 1 Group D Member 1), and XBP1 (X-Box Binding Protein 1). The rs319966827 variant, which was rare in the Złotnicka breeds, overlapped with predicted binding motifs for BCL6B (B-Cell CLL/Lymphoma 6 Member B) and NFATC1 (Nuclear Factor of Activated T-Cells 1). These findings suggest that sequence variation within the MALAT1 promoter may influence regulatory interactions in a tissue-specific and breed-dependent manner (Table S2).

3.5. MALAT1 Gene Expression Analysis

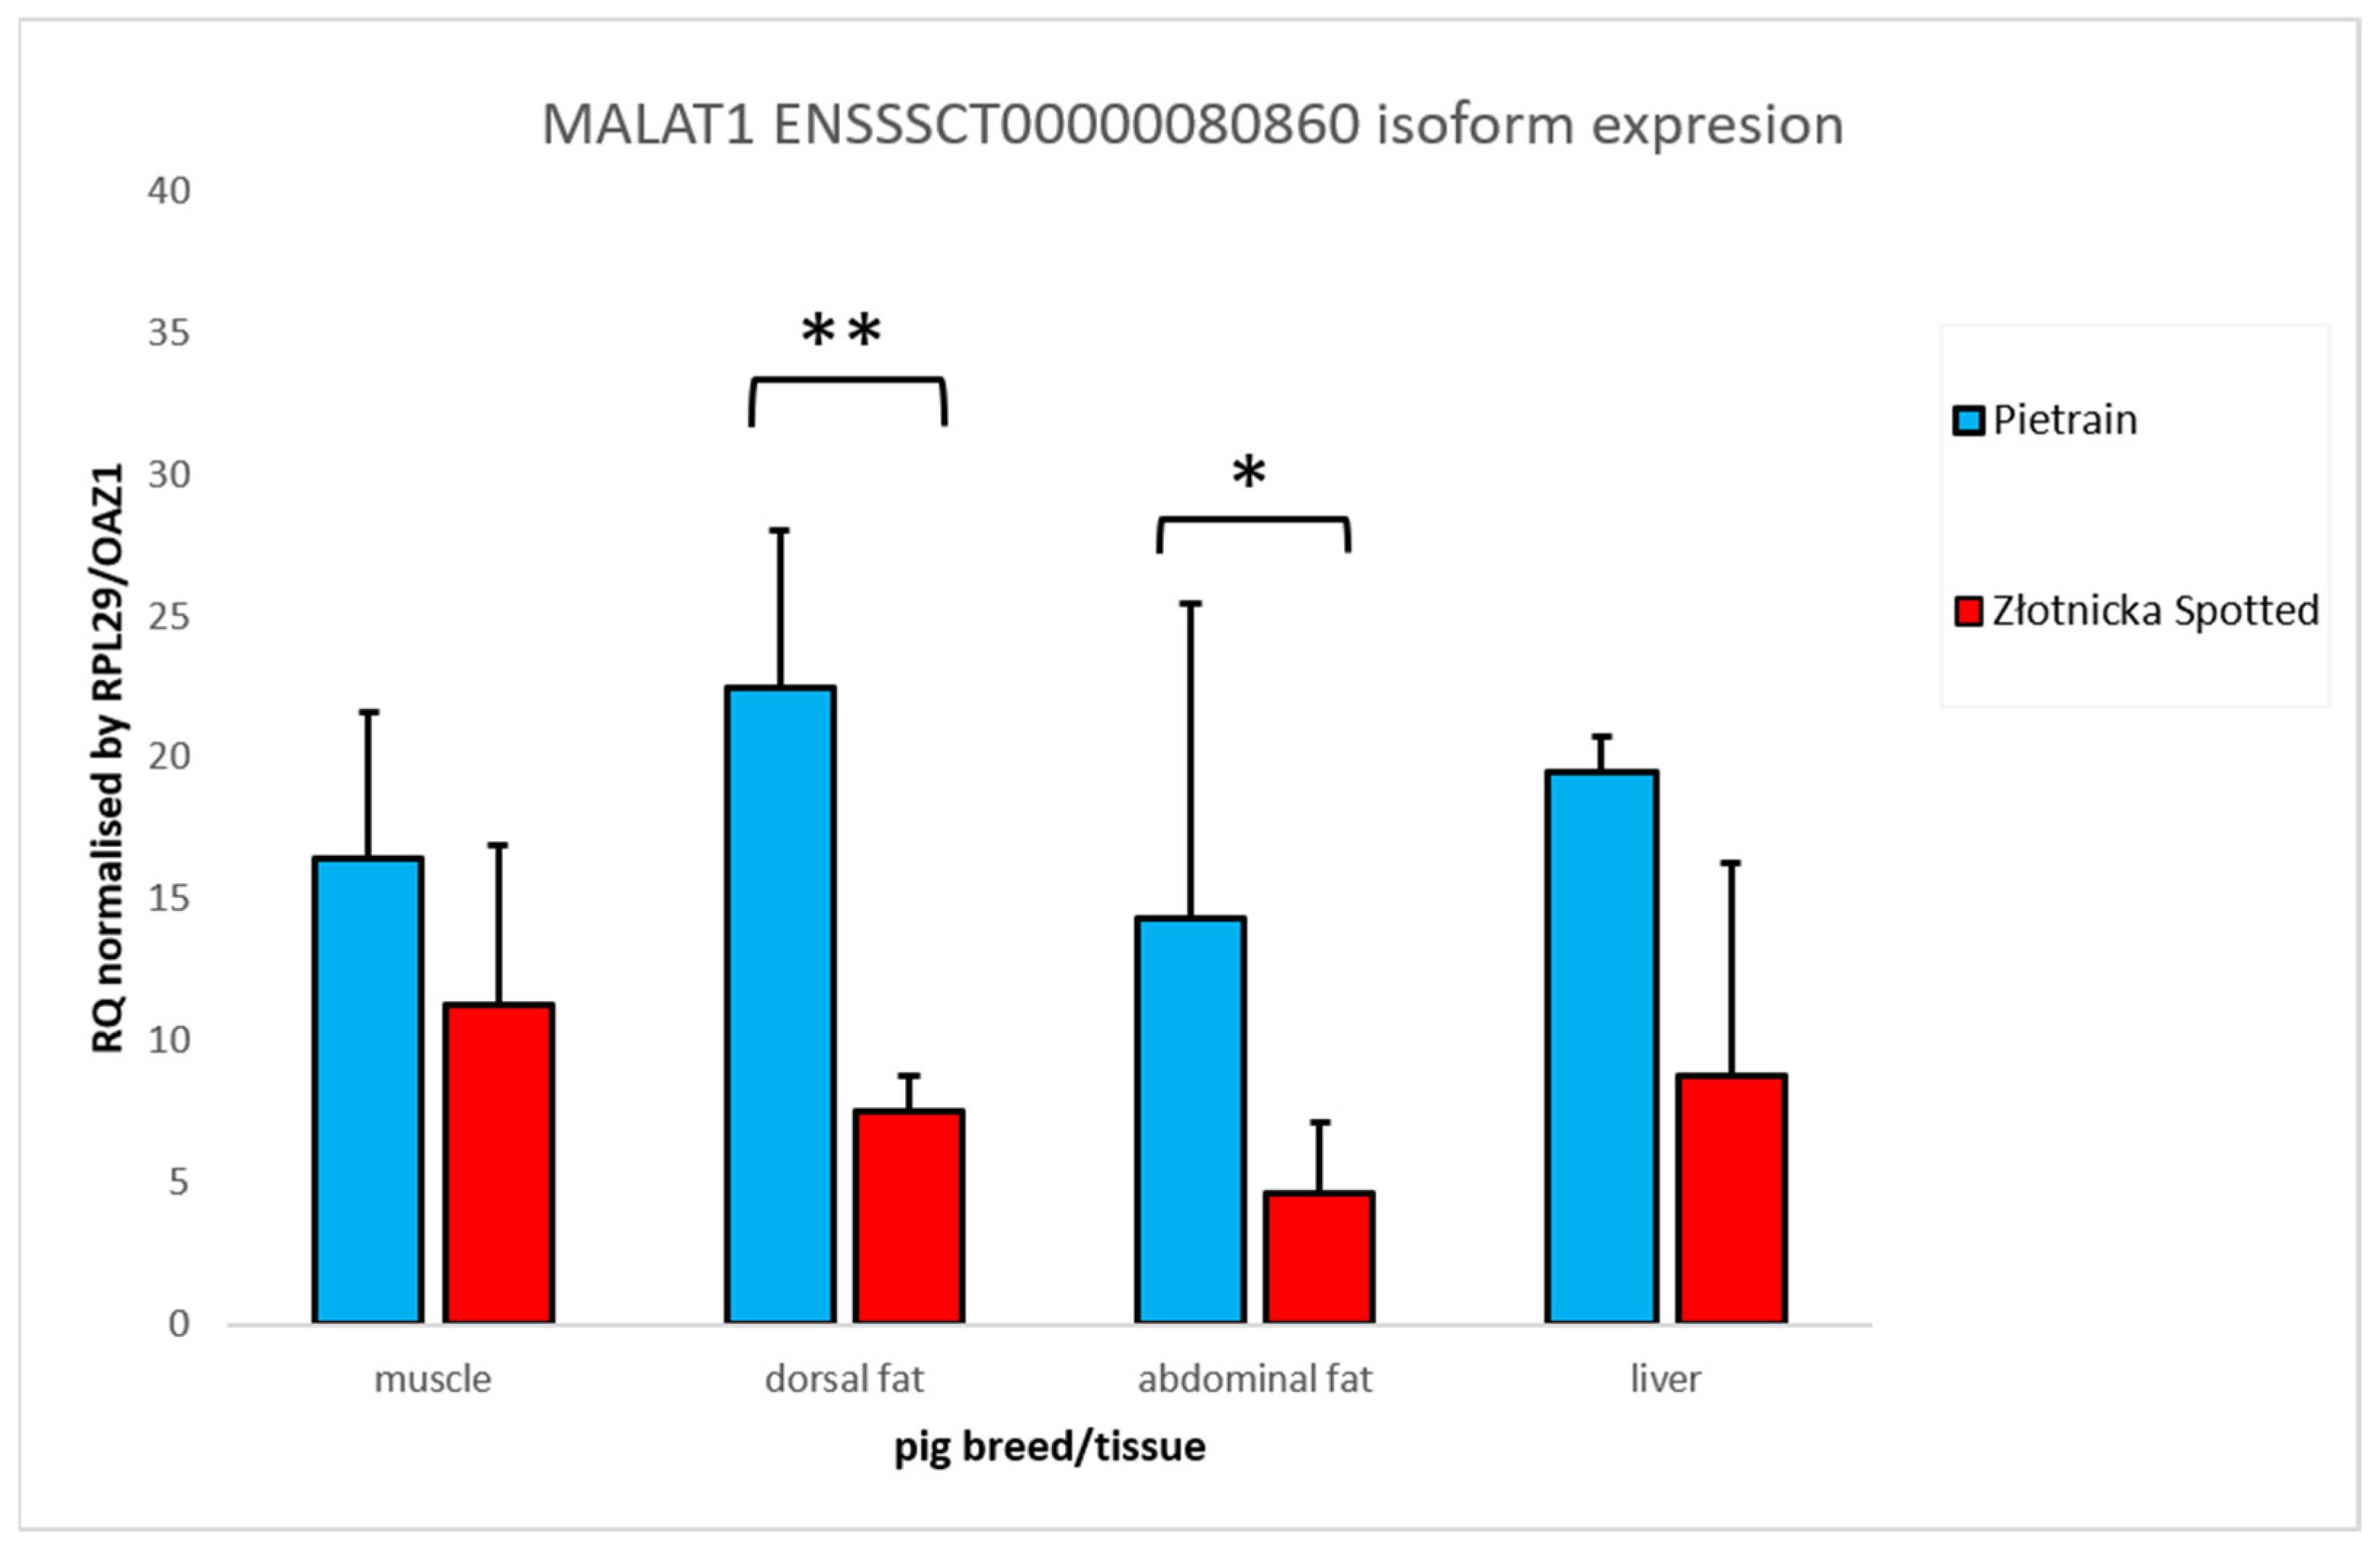
The expression profile of MALAT1 was assessed both during adipogenic differentiation and in porcine tissues associated with fat deposition. Isoform-specific quantification detected only the ENSSSCT00000080860 isoform. Its expression was significantly higher in the subcutaneous adipose tissues of Pietrain pigs, with an approximately three-fold increase in both backfat and abdominal fat compared with ZS pigs (Figure 4). No amplification signal was detected using the primer–probe set specific to the ENSSSCT00000077869 isoform, which was consistent with our subsequent observations concerning this transcript.
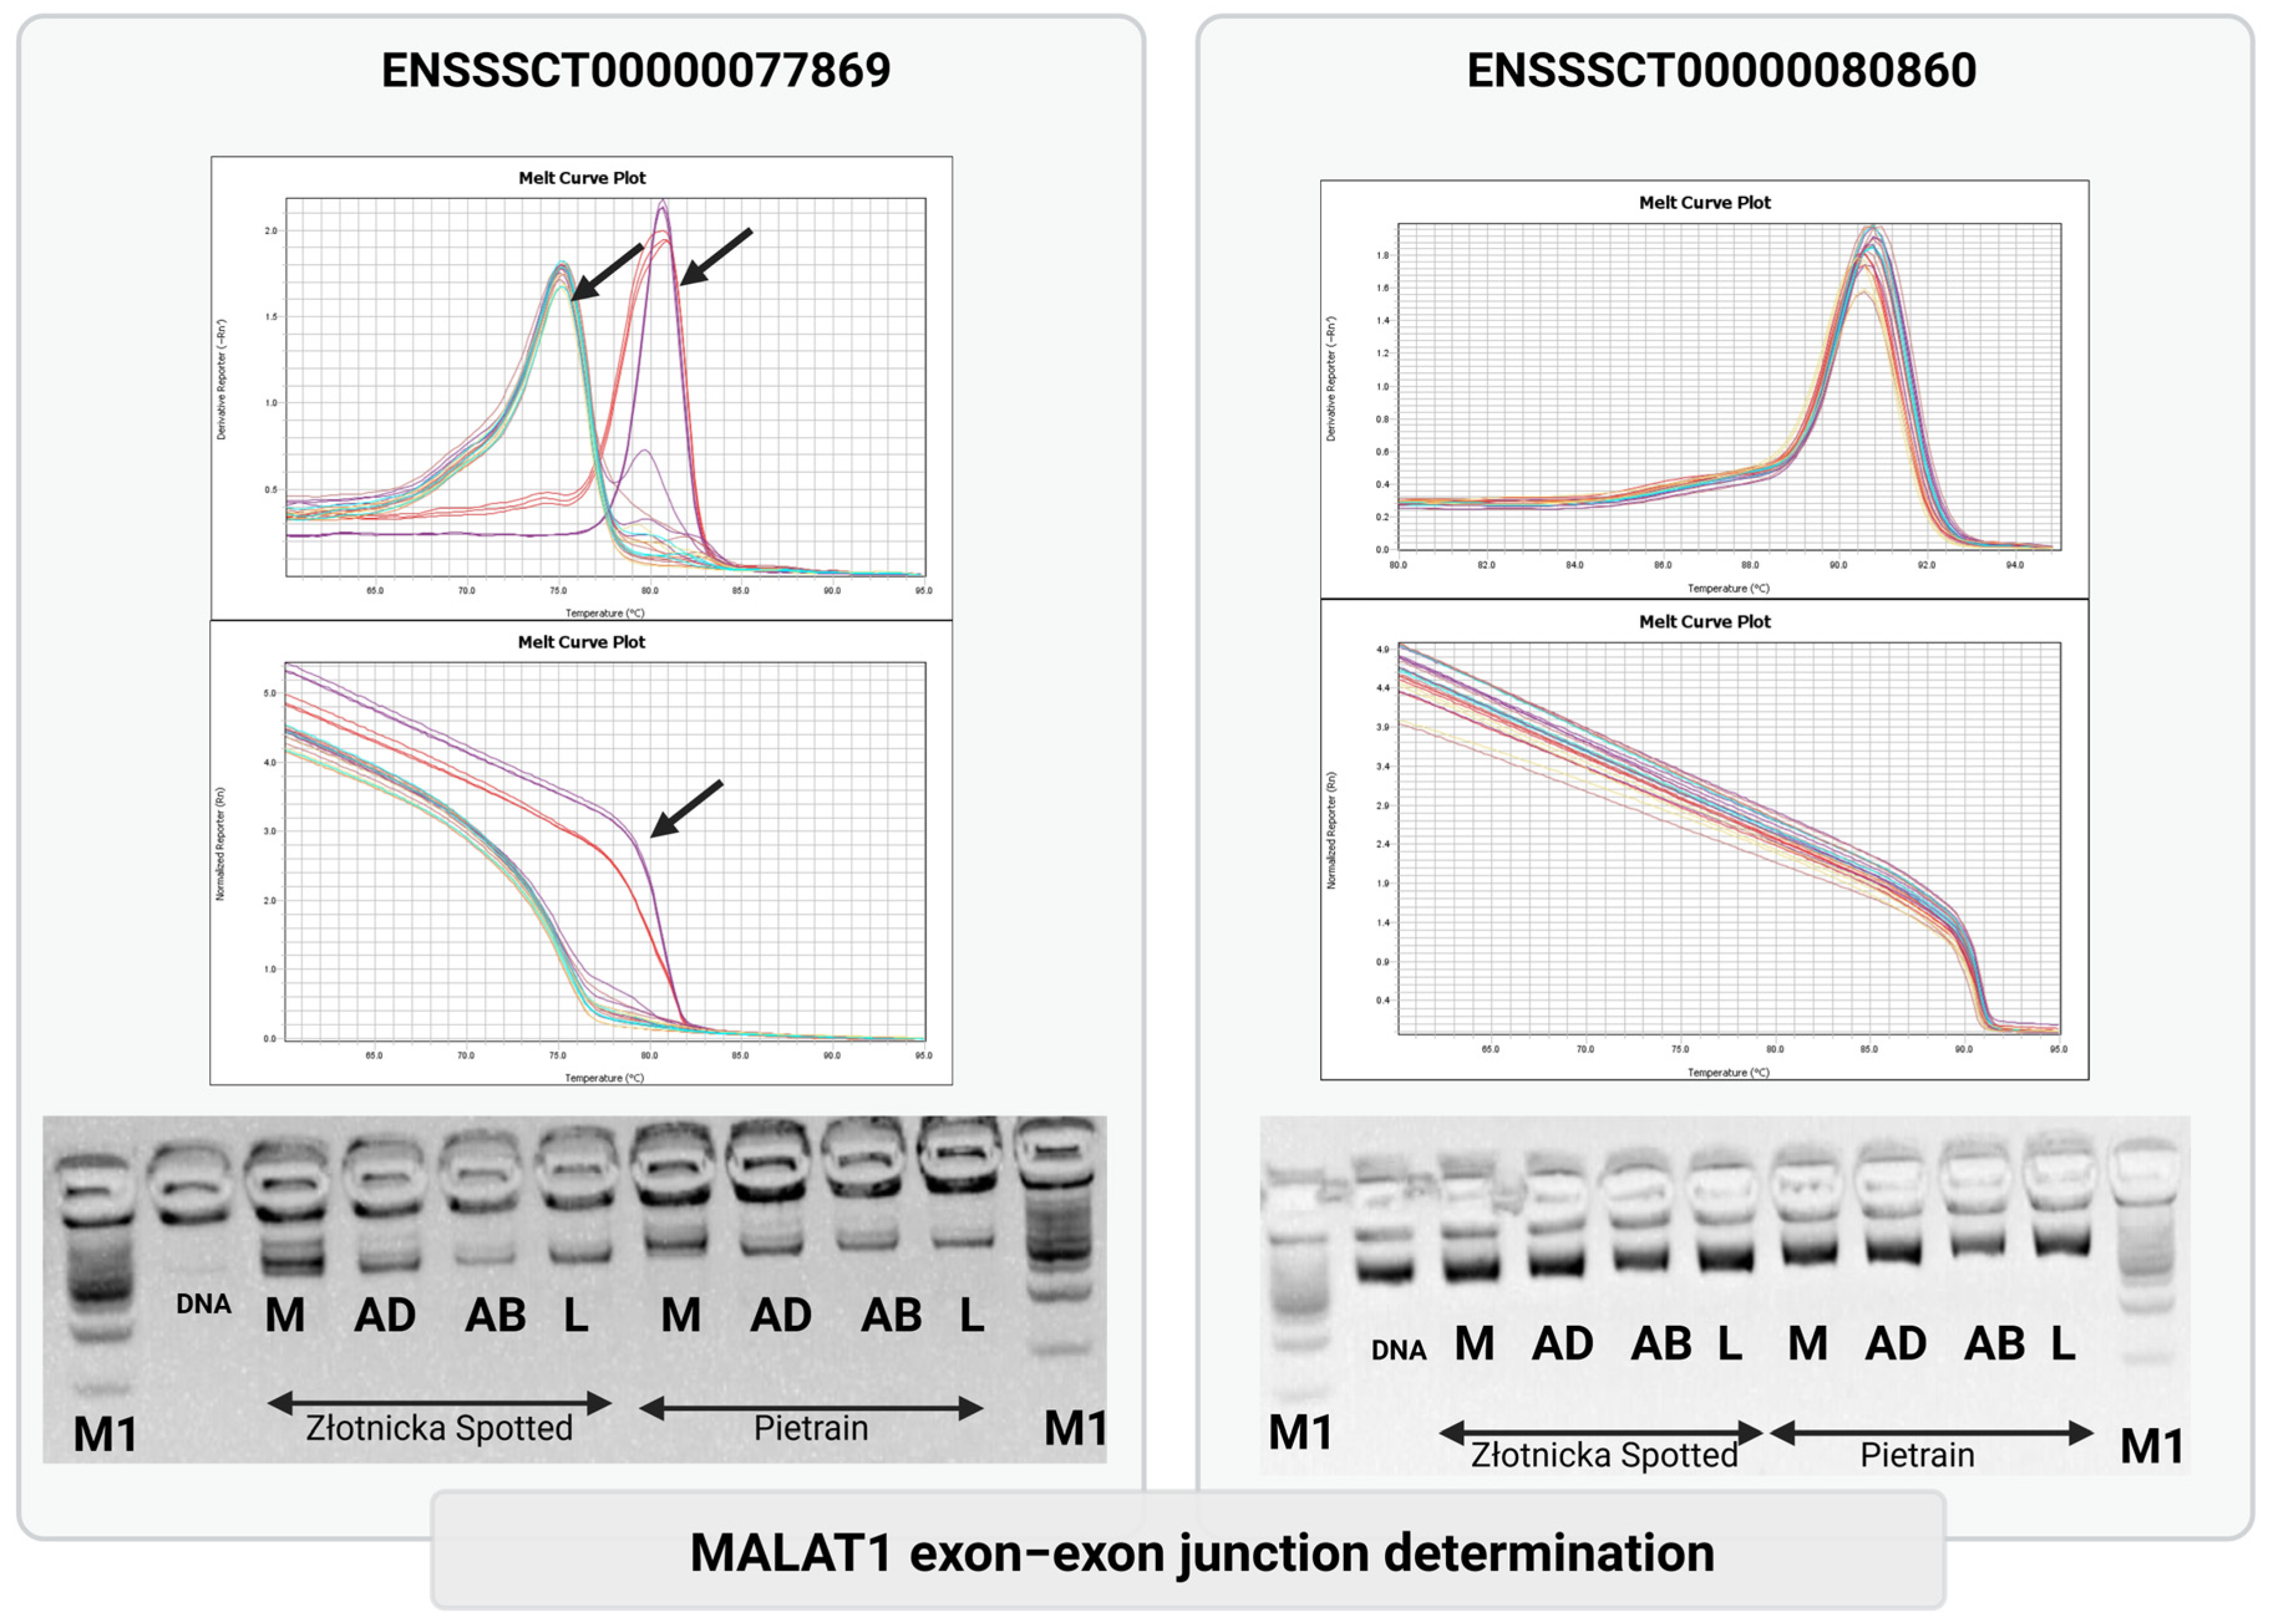
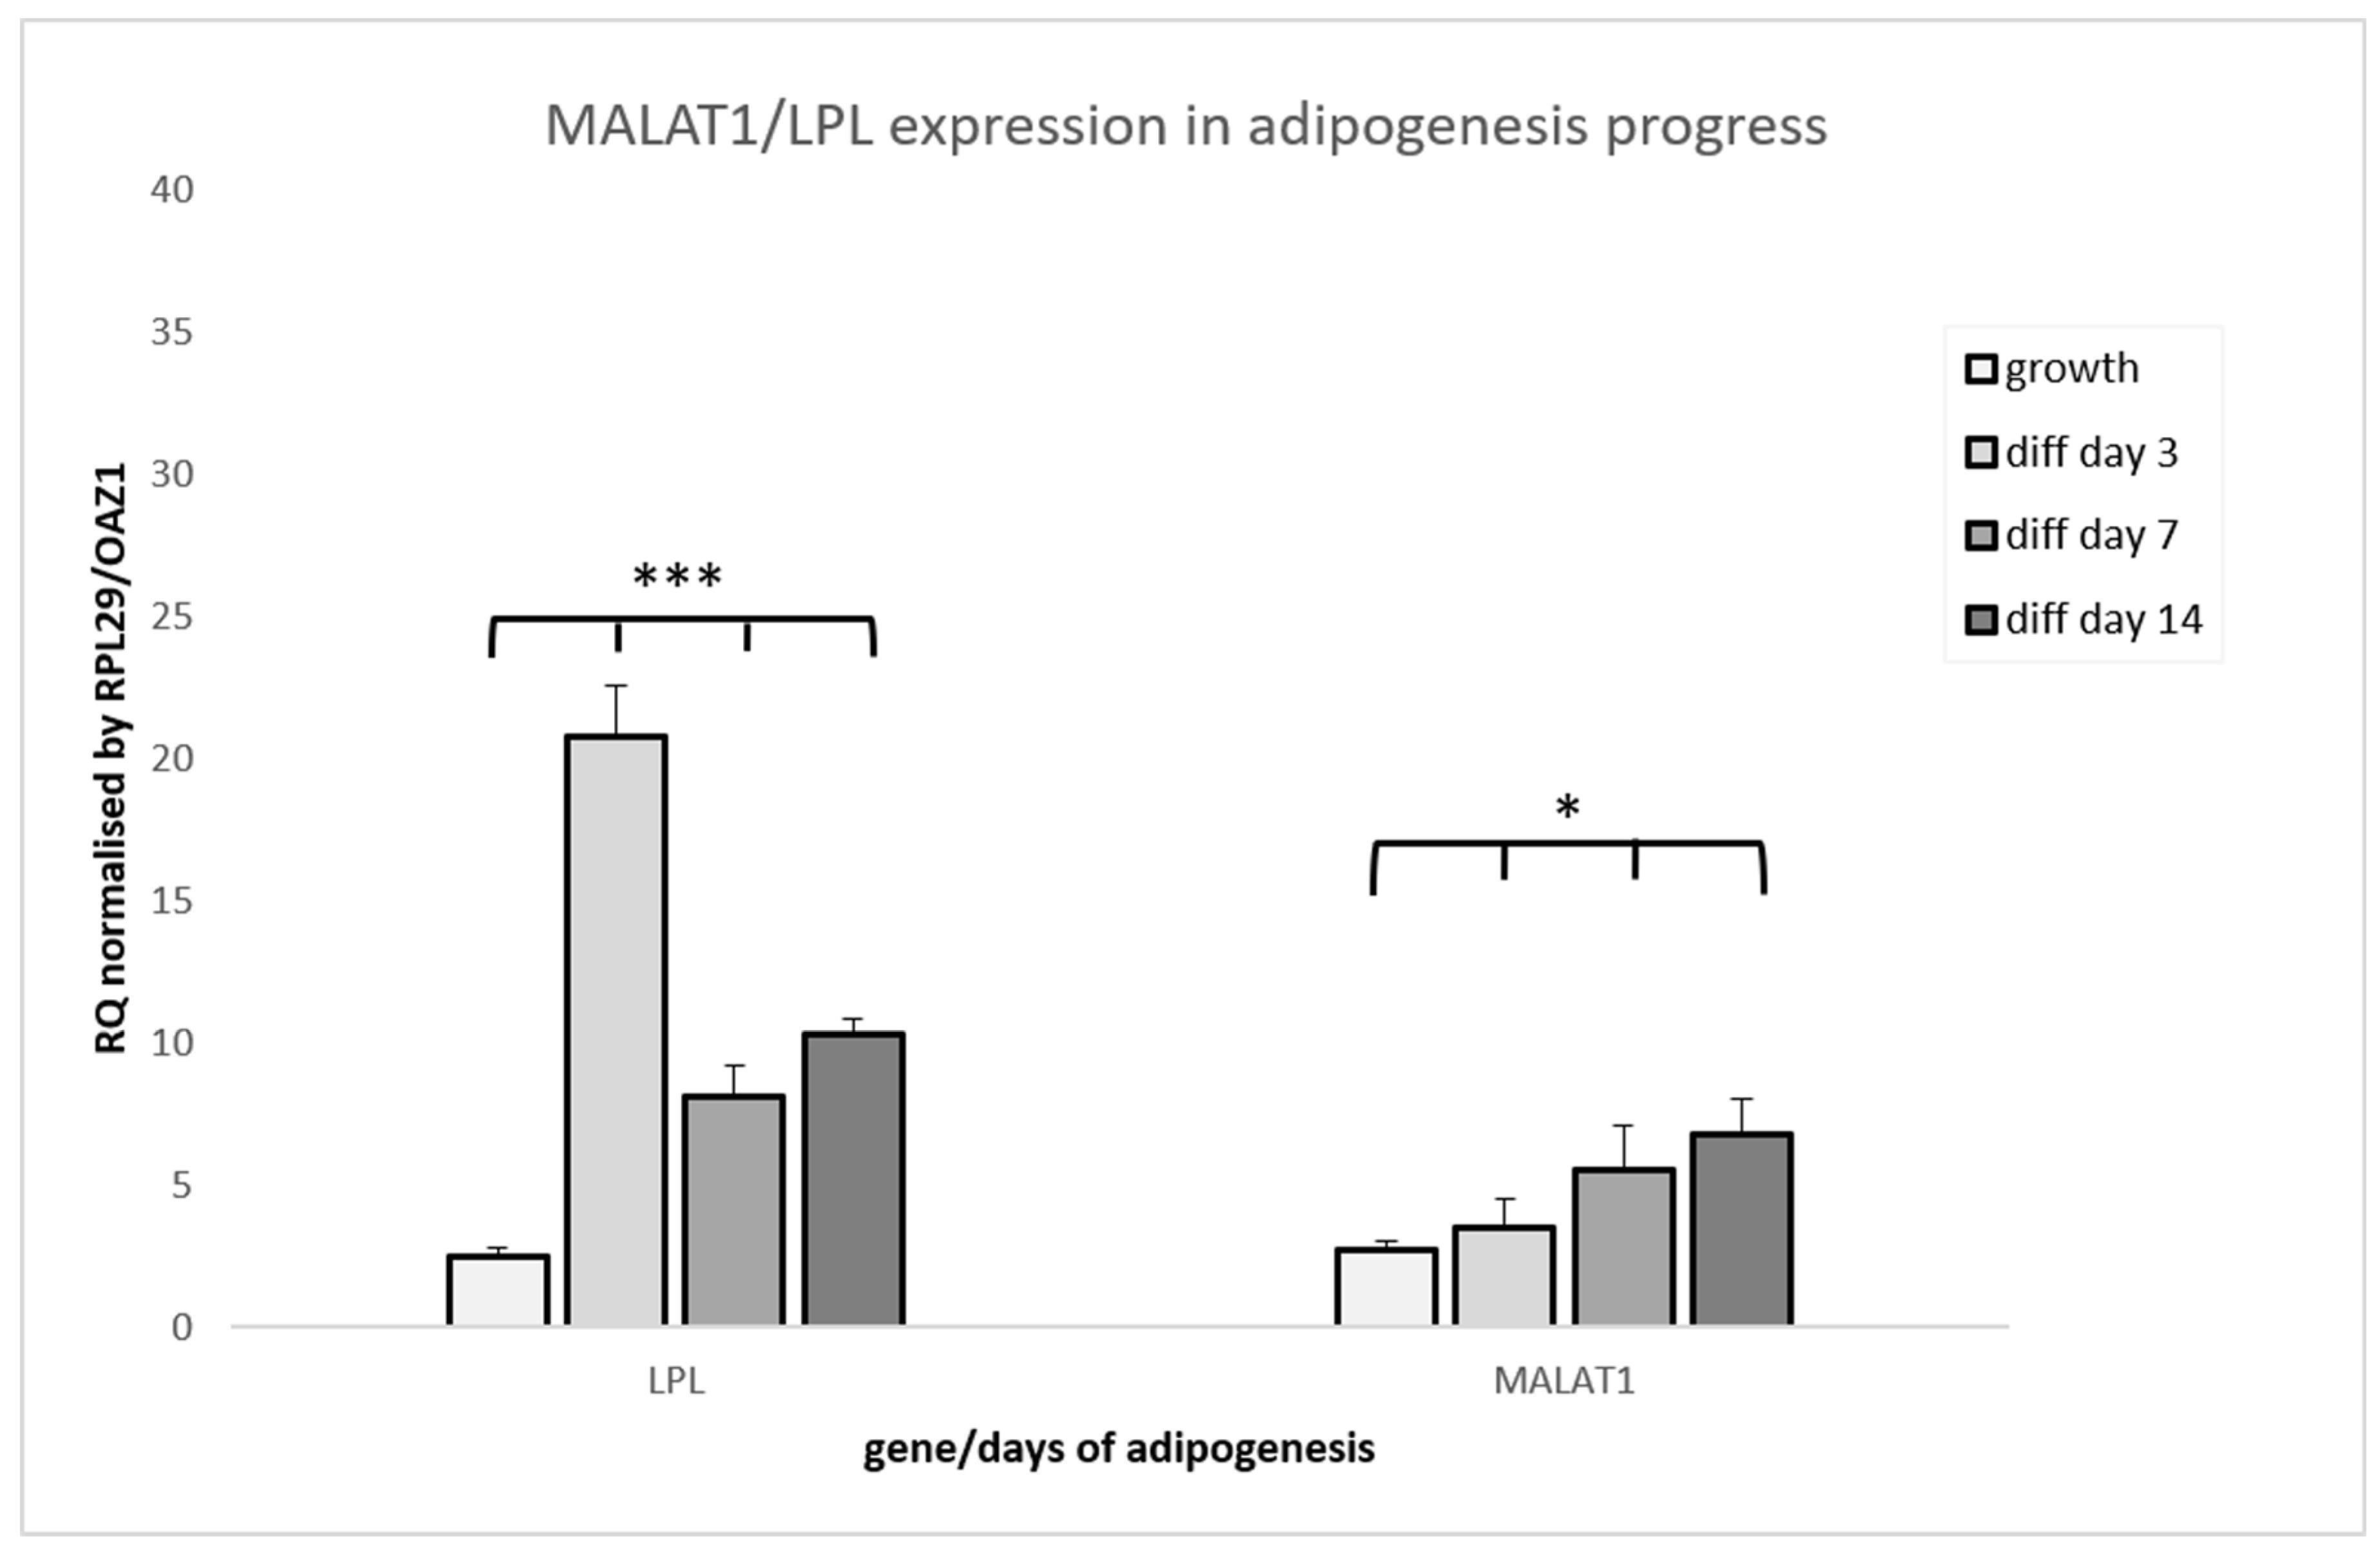
In contrast, amplification of regions shared by both isoforms, yielded two distinct PCR products. Melting curve analysis revealed reproducible differences in melting temperatures among tissues, suggesting tissue-specific variation in transcript composition (Figure 5). Agarose gel electrophoresis confirmed the presence of distinct amplicons. Subsequent nested PCR and Sanger sequencing identified 20 exon–exon junction variants. These included a transcript corresponding to ENSSSCT00000077869 and a variant of ENSSSCT00000080860 containing a retained intronic fragment, consistent with our previous observations [19]. These findings indicate the presence of additional porcine MALAT1 transcript variants that have not yet been annotated in the current genome databases. During the in vitro adipogenic differentiation of primary preadipocytes, MALAT1 expression progressively increased from day 0 to day 14, in parallel with adipocyte maturation. This expression pattern was consistent with the upregulation of LPL, a well-established marker of adipogenic differentiation (Figure 6). It was also supported by morphological changes and intracellular lipid accumulation observed via Oil Red O staining (Figure 2).

4. Discussion

MALAT1 belongs to the class of lncRNAs, whose biological functions have not yet been fully elucidated. Initially, lncRNAs were believed to primarily be antisense molecules involved in transcripts’ inactivation [33]. Subsequent studies have demonstrated their diverse roles in the regulation of gene expression. As described in the Introduction, MALAT1 has a well-established role in carcinogenesis and metastasis. Nevertheless, an increasing body of evidence also implicates MALAT1 in molecular processes associated with fat deposition and obesity. Yan et al. [34] proposed that MALAT1 promotes hepatic fat accumulation by increasing the stability of the SREBP-1c protein. Ebrahimi et al. [35] analysed MALAT1 expression in subcutaneous adipose tissue (SAT) and found no significant differences between women with and without obesity. In contrast, a study published in 2024, involving more than 300 women classified as overweight and obese, investigated the correlation between MALAT1 expression and the Cholesterol–Saturated Fat Index [15]. The authors reported a significant positive inter-action between MALAT1 expression and this index in relation to visceral adiposity and body adiposity indexes, indicating that further functional studies are needed to clarify this concept. Moreover, MALAT1 expression was positively correlated with the expression of sterol regulatory element-binding protein 1c (SREBP-1c) and peroxisome proliferator-activated receptor gamma (PPAR-γ), as well as with that of their downstream targets, fatty acid synthase (FASN) and acetyl-CoA carboxylase alpha (ACACA). A recent study investigating the effects of MALAT1 on steatosis in HepG2 cells showed that MALAT1 silencing significantly altered the expression of FASN, ACADL, CPT1A, and MTTP [36].
In the present study, we investigated the relationship between MALAT1 expression, adipogenesis and fat deposition in pigs. In the first experiment, MALAT1 expression was profiled during adipogenesis in primary porcine preadipocytes derived from subcutaneous adipose tissue and in porcine tissues associated with carcass fatness. MALAT1 expression increased significantly over the course of adipogenic differentiation, suggesting its involvement in this process. Tissue-specific analysis showed that expression of the MALAT1 isoform ENSSSCT00000080860 was higher in the SF of Pietrain pigs, which have a leaner body composition than ZS pigs. Kociucka et al. [37] reported that Pietrain pigs had considerably smaller adipocytes in subcutaneous adipose tissue than PL pigs, with mean diameters of approximately 55 and 70 µm, respectively. The corresponding backfat thickness values were 0.965 and 1.683. However, Pietrain pigs had a greater number of adipocytes per cm2. In the present study, we report a mean backfat thickness of 3.08 cm in ZS and 1.14 cm in Pietrain pigs. Our histological analysis also showed that Pietrain pigs had smaller, more compact adipocytes. In dorsal adipose tissue, their mean adipocyte area and diameter were 3428.4 µm2 and 66.1 µm compared with 5297.8 µm2 and 82.1 µm in ZS pigs (p-value < 0.0001). The higher MALAT1 expression observed in leaner Pietrain pigs, despite their smaller adipocyte size, suggests that MALAT1 may be more closely associated with preadipocyte proliferation and differentiation than with adipocyte hypertrophy. However, this hypothesis requires direct functional validation. Caron et al. [38] showed that MALAT1 silencing reduced adipocyte differentiation capacity. Moreover, in their study, shear stress was correlated with the downregulation of MALAT1 expression in adipocytes derived from mesenchymal stem cells [39]. In our experiments, the progressive increase in MALAT1 expression during adipogenesis was consistent with these findings. Similar results were reported by Han et al. [39], who revealed that MALAT1 knockdown significantly inhibited adipogenesis. This effect may be related to the ability of MALAT1 to regulate PPAR-γ expression, a key transcription regulator of numerous adipogenic genes. MALAT1 has also been identified as the most abundant lncRNA in exosomes from human adipose-tissue-derived stem cells (hADSCs) [40]. Han et al. [39] suggested that MALAT1 promotes adipose tissue formation. However, in the present study, MALAT1 expression was significantly higher in both subcutaneous tissues of Pietrain pigs than in the fatty ZS pigs. By contrast, Ebrahimi et al. [35] found lower MALAT1 expression in obese mice than in control animals. MALAT1 knockdown had no stimulatory or inhibitory effect on diet-induced fat accumulation or lipid homeostasis. Our findings were unexpected because, in our previous study, higher MALAT1 was correlated with greater fatness within a population of ZW pigs. In summary, these observations suggest that MALAT1 in adipose tissue may depend on the stage of adipogenesis, tissue context, or genetic background, which supports our above hypothesis. Our additional observation of the MALAT1 transcript structure also newly identified that exon–exon junctions differed among tissue types, suggesting the presence of tissue-specific MALAT1 transcript variants that may perform distinct biological functions [41]. In addition, we analysed the promoter regions of two porcine MALAT1 isoforms and identified substantial variation among pig breeds differing in adipose and muscle tissue contents. The rs329590882 variant was predicted to influence the binding site for transcription factors NFAT5 and ZNF75D within the porcine MALAT1 promoter region. NFAT5 has been implicated in the regulation of WAT to BAT conversion. In mice fed a high-fat diet, NFAT5 deficiency led to the formation of small, focal lipid-rich lesions in the aorta [42]; promoted cholesterol accumulation in vascular smooth muscle cells; and reduced the expression of genes involved in the management of oxidative stress or lipid handling, such as SOD1, PLIN2, FABP3, and PPARD. Thus, NFAT5 may affect lipid accumulation through several mechanisms. Although it may contribute to obesity by inhibiting the conversion of white fat tissue into “beige” or brown-like adipocytes, it also participates in cellular stress responses and inflammatory response, which may indirectly influence lipid processing and storage [43]. In the present study, the frequency of rs329590882 genotypes differed by 44% between Pietrain and ZW. The A allele, which was predicted to favour NFAT5 binding within the MALAT1 promoter region, predominated in Pietrain pigs, reaching a frequency of 58.3%. Pietrain pigs showed three-fold higher MALAT1 expression than ZS pigs. This observation suggest a potential association between rs329590882, NFAT5 binding, and MALAT1 expression; however, this relationship needs confirmation using a functional promoter assay. ZNF75D belongs to the Zinc Finger Protein family and has been suggested to participate in adipogenesis and fat accumulation. Nevertheless, its influence on the expression of key adipogenic genes and its precise role in adipose tissue biology remain to be elucidated.
The rs321550593 variant, located upstream of MALAT1, showed the highest frequency in ZS (18.8%), in which a lower MALAT1 expression was observed in both subcutaneous tissues (abdominal and dorsal tissue) was observed. Our in silico analysis predicted that this polymorphism may affect binding sites for several TFs, including SOX13 and SRF. SOX13 has been reported to promote the differentiation of mesenchymal stem cells into brown adipocytes through interactions with other adipogenic TFs, including SIX1 and RREB1 [44]. Moreover, SOX13 knockdown impairs this process and overexpression enhances it. SOX13’s role during preadipocyte proliferation is not exactly explained, though this TF is rather pinpointed as a repressor of proliferation and has been broadly described in cancer cells [44,45]. In our study, an increased frequency of the rs321550593 alternate variant favouring SOX13 binding in ZS was observed, and thus, this TF could be involved in the regulation of MALAT1; however, this should be investigated in a future study. In turn, SRF is a known inhibitor of preadipocyte proliferation and BAT adipogenesis, particularly during the early stages of commitment and differentiation, through negative regulation of the TGF-β pathway [46]; suppression of SRF-MRTF leads to enhanced adipocyte development. Nevertheless, in our study, an increased frequency of rs321550593 with the G allele in ZS pigs did not favour SRF binding; thus, SRF could be associated with the increased MALAT1 expression observed in Pietrain pigs.
The rs318806718 MALAT1 promoter variant seems to affect PBX3 and XBP1, both of which are crucial factors determining fat deposition; PBX3 is involved in preadipocyte proliferation because it influences cell cycle progression and activates the AKT signalling pathway [47]. XBP1 is a key factor in adipogenic differentiation that suppresses Wnt10b and decreases the β-catenin signalling pathway [48,49]. On the other hand, XBP1 promotes hypertrophy by activating adipogenesis in preadipocytes, which is related to the regulation of key adipogenic transcription factors like a C/EBPα. In our study, we observed a 30% increase in the frequency of the rs318806718G allele, promoting binding of PBX3 and repressing XBP1 in Pietrain pigs (58.3% of rs318806718G). Due to the more numerous and non-hypertrophic adipocytes observed in Pietrain pigs, as well as the three-fold increase in MALAT1 expression, we conclude that PBX3 could be involved in MALAT1 expression and, further, the preadipocyte proliferation process. In turn, the preference for XBP1 binding in ZS pigs could be associated with preadipocyte differentiation and, further, hypertrophy.

5. Conclusions

The function of lncRNAs is still not fully understood. Although we can preliminarily assign distinct biological functions to these molecules, it is often unclear at which molecular level each lncRNA can regulate the expression of other genes. MALAT1 has been extensively studied in humans; however, in farm animals, particularly pigs, the available knowledge is still very limited and mainly restricted to its chromosomal localisation. There is currently a significant lack of information regarding the biological function and regulatory role of lncRNAs in pigs, making studies in this field highly relevant and necessary. Our initial observations revealed that MALAT1 may be associated with adipogenesis and fat deposition in pigs, providing novel insights into the potential role of this lncRNA in porcine lipid metabolism. Although these findings are preliminary, they contribute important new knowledge to the poorly explored area of lncRNA function in swine. Nevertheless, the relatively small sample size should be considered when interpreting the findings, and future studies should include larger animal populations. Functional experiments involving MALAT1 silencing and overexpression in primary porcine preadipocytes will also be required to clarify the molecular mechanisms underlying MALAT1-mediated regulation.

Supplementary Materials

The following supporting information can be downloaded at: https://www.mdpi.com/article/10.3390/genes17080888/s1.

Author Contributions

Conceptualisation, K.P.; methodology, K.P., E.O., P.P. and L.P.; validation, P.P. and L.P.; formal analysis, K.P. and E.O.; investigation, K.P., E.O., K.W., P.P., K.Z. and L.P.; resources, K.P.; data curation, K.P.; writing—original draft preparation, K.P., E.O., P.P. and L.P.; writing—review and editing, K.P., E.O., P.P., K.Z. and L.P.; supervision, K.P.; project administration, K.P.; funding acquisition, K.P. All authors have read and agreed to the published version of the manuscript.

Funding

This study was supported by the statutory activity of the National Research Institute of Animal Production, no. 01-18-22-21.

Institutional Review Board Statement

As the animals were slaughtered for food production and tissue sampling occurred post mortem, the study did not require approval from the Animal Experimentation Committee. Nonetheless, the experiment was conducted under the supervision and approval of the Approving Experiment Committee of the National Research Institute of Animal Production in accordance with the Polish Act of 15 January 2015 on the Protection of Animals Used for Scientific or Educational Purposes, which implements Directive 2010/63/EU of the European Parliament and Council. All procedures followed institutional and national ethical standards.

Informed Consent Statement

Not applicable.

Data Availability Statement

The sequence data obtained after Sanger sequencing analysis were submitted to the GenBank NCBI (accession no. OR941310-OR941322).

Conflicts of Interest

The authors declare no conflicts of interest. The funders had no role in the design of the study; in the collection, analyses, or interpretation of data; in the writing of the manuscript, or in the decision to publish the results.

Abbreviations

The following abbreviations are used in this manuscript:
ABBackfat adipose tissue
ADDorsal subcutaneous adipose tissue
BATBrown adipose tissue
BCL6BB-Cell CLL/Lymphoma 6 Member B
ceRNACompeting endogenous RNA
FASNFatty acid synthase
H&EHaematoxylin and eosin
MALAT1Metastasis-Associated Lung Adenocarcinoma Transcript 1
LLiver
lncRNAlong non-coding RNA
MMuscle
miRNAMicroRNA
ncRNANon-coding RNA
NFAT5Nuclear Factor of Activated T-Cells 5
NFATC1Nuclear Factor of Activated T-Cells 1
PBX3Pre-B-Cell Leukaemia Homeobox 3
PPAR-γPeroxisome proliferator-activated receptor gamma
PLWPolish Large White
PLPolish Landrace
SATSubcutaneous adipose tissue
SFSubcutaneous fat
SOX13SRY-Box Transcription Factor 13
SIRT1Sirtuin 1
SRASteroid receptor RNA activator
SREBP-1cSterol Regulatory Element-Binding Protein 1c
SRFSerum response factor
TFBSTranscription binding site
WATWhite adipose tissue
XBP1X-Box Binding Protein 1
ZNF75DZinc Finger Protein 75D
ZSZłotnicka Spotted
ZWZłotnicka White

References

  1. Böhmdorfer, G.; Wierzbicki, A.T. Control of Chromatin Structure by Long Noncoding RNA. Trends Cell Biol. 2015, 25, 623–632. [Google Scholar] [CrossRef] [PubMed]
  2. Cesana, M.; Cacchiarelli, D.; Legnini, I.; Santini, T.; Sthandier, O.; Chinappi, M.; Tramontano, A.; Bozzoni, I. A long noncoding RNA controls muscle differentiation by functioning as a competing endogenous RNA. Cell 2011, 147, 358–369. [Google Scholar] [CrossRef] [PubMed]
  3. Ørom, U.A.; Derrien, T.; Beringer, M.; Gumireddy, K.; Gardini, A.; Bussotti, G.; Lai, F.; Zytnicki, M.; Notredame, C.; Huang, Q.; et al. Long noncoding RNAs with enhancer like function in human cells. Cell 2010, 143, 46–58. [Google Scholar] [CrossRef] [PubMed]
  4. Statello, L.; Guo, C.J.; Chen, L.L.; Huarte, M. Gene regulation by long non-coding RNAs and its biological functions. Nat. Rev. Mol. Cell Biol. 2021, 22, 96–118. [Google Scholar] [CrossRef] [PubMed]
  5. Chen, Y.; Long, W.; Yang, L.; Zhao, Y.; Wu, X.; Li, M.; Du, F.; Chen, Y.; Yang, Z.; Wen, Q.; et al. Functional Peptides Encoded by Long Non-Coding RNAs in Gastrointestinal Cancer. Front. Oncol. 2021, 11, 777374. [Google Scholar] [CrossRef] [PubMed]
  6. Zhang, Y.; Wang, X.; Hu, C.; Yi, H. Shiny transcriptional junk: lncRNA-derived peptides in cancers and immune responses. Life Sci. 2023, 316, 121434. [Google Scholar] [CrossRef] [PubMed]
  7. Xing, J.; Liu, H.; Jiang, W.; Wang, L. LncRNA-Encoded Peptide: Functions and Predicting Methods. Front. Oncol. 2021, 10, 622294. [Google Scholar] [CrossRef] [PubMed]
  8. Ji, P.; Diederichs, S.; Wang, W.; Böing, S.; Metzger, R.; Schneider, P.M.; Tidow, N.; Brandt, B.; Buerger, H.; Bulk, E.; et al. MALAT-1, a novel noncoding RNA, and thymosin β4 predict metastasis and survival in early-stage non-small cell lung cancer. Oncogene 2003, 22, 8031–8041. [Google Scholar] [CrossRef] [PubMed]
  9. Amodio, N.; Raimondi, L.; Juli, G.; Stamato, M.A.; Caracciolo, D.; Tagliaferri, P.; Tassone, P. MALAT1: A druggable long non-coding RNA for targeted anti-cancer approaches. J. Hematol. Oncol. 2018, 11, 63. [Google Scholar] [CrossRef] [PubMed]
  10. Arun, G.; Aggarwal, D.; Spector, D.L. MALAT1 Long Non-Coding RNA: Functional Implications. Non-Coding RNA 2020, 6, 22. [Google Scholar] [CrossRef] [PubMed]
  11. Juárez-Vicuña, Y.; Ruiz-Ojeda, D.; González-Ramírez, J.; Flores-Balderas, X.; Springall, R.; Sánchez-Muñoz, F.; Guzmán-Martín, C.A. LncRNA MALAT1 in Keratinocyte function: A review of recent advances. Non-Coding RNA Res. 2024, 9, 594–601. [Google Scholar] [CrossRef]
  12. Piórkowska, K.; Zygmunt, K.; Hunter, W.; Wróblewska, K. MALAT1: A Long Non-Coding RNA with Multiple Functions and Its Role in Processes Associated with Fat Deposition. Genes 2024, 15, 479. [Google Scholar] [CrossRef] [PubMed]
  13. Martinez-Terroba, E.; Plasek-Hegde, L.M.; Chiotakakos, I.; Li, V.; de Miguel, F.J.; Robles-Oteiza, C.; Tyagi, A.; Politi, K.; Zamudio, J.R.; Dimitrova, N. Overexpression of Malat1 drives metastasis through inflammatory reprogramming of the tumor microenvironment. Sci. Immunol. 2024, 9, eadh5462. [Google Scholar] [CrossRef] [PubMed]
  14. Hou, J.; Zhang, G.; Wang, X.; Wang, Y.; Wang, K. Functions and mechanisms of lncRNA MALAT1 in cancer chemotherapy resistance. Biomark. Res. 2023, 11, 23. [Google Scholar] [CrossRef] [PubMed]
  15. Rasaei, N.; Gholami, F.; Samadi, M.; Shiraseb, F.; Khadem, A.; Yekaninejad, M.S.; Emamgholipour, S.; Mirzaei, K. The interaction between MALAT1 and TUG1 with dietary fatty acid quality indices on visceral adiposity index and body adiposity index. Sci. Rep. 2024, 14, 12. [Google Scholar] [CrossRef] [PubMed]
  16. Shkurat, T.P.; Ammar, M.; Bocharova, O.; Teplyakova, E.; Aleksandrova, A.; Ali, R.; Lipovich, L. The Role of Genetic Variants in the Long Non-Coding RNA Genes MALAT1 and H19 in the Pathogenesis of Childhood Obesity. Non-Coding RNA 2023, 9, 22. [Google Scholar] [CrossRef] [PubMed]
  17. Yang, Y.; Zhou, R.; Zhu, S.; Li, X.; Li, H.; Yu, H.; Li, K. Systematic Identification and Molecular Characteristics of Long Noncoding RNAs in Pig Tissues. BioMed Res. Int. 2017, 2017, 6152582. [Google Scholar] [CrossRef] [PubMed]
  18. Piórkowska, K.; Żukowski, K.; Ropka-Molik, K.; Tyra, M. New long-non coding RNAs related to fat deposition based on pig model. Ann. Anim. Sci. 2022, 22, 1211–1224. [Google Scholar] [CrossRef]
  19. Han, S.M.; Nahmgoong, H.; Yim, K.M.; Kim, J.B. How obesity affects adipocyte turnover. Trends Endocrinol. Metab. 2025, 36, 147–160. [Google Scholar] [CrossRef] [PubMed]
  20. Ouni, M.; Schürmann, A. Epigenetic contribution to obesity. Mamm. Genome 2020, 31, 134–145. [Google Scholar] [CrossRef] [PubMed]
  21. Ahmad, B.; Serpell, C.J.; Fong, I.L.; Wong, E.H. Molecular Mechanisms of Adipogenesis: The Anti-adipogenic Role of AMP-Activated Protein Kinase. Front. Mol. Biosci. 2020, 7, 76. [Google Scholar] [CrossRef] [PubMed]
  22. Sufianov, A.; Beilerli, A.; Kudriashov, V.; Ilyasova, T.; Liang, Y.; Mukhamedzyanov, A.; Bessonova, M.; Mashkin, A.; Beylerli, O. The role of long non-coding RNAs in the development of adipose cells. Non-Coding RNA Res. 2023, 8, 255–262. [Google Scholar] [CrossRef]
  23. Ru, W.; Zhang, S.; Liu, J.; Liu, W.; Huang, B.; Chen, H. Non-Coding RNAs and Adipogenesis. Int. J. Mol. Sci. 2023, 24, 9978. [Google Scholar] [CrossRef] [PubMed]
  24. Li, M.; Sun, X.; Cai, H.; Sun, Y.; Plath, M.; Li, C.; Lan, X.; Lei, C.; Lin, F.; Bai, Y.; et al. Long non-coding RNA ADNCR suppresses adipogenic differentiation by targeting miR-204. Biochim. Biophys. Acta-Gene Regul. Mech. 2016, 1859, 871–882. [Google Scholar] [CrossRef]
  25. Chen, G.; Yu, D.; Nian, X.; Liu, J.; Koenig, R.J.; Xu, B.; Sheng, L. LncRNA SRA promotes hepatic steatosis through repressing the expression of adipose triglyceride lipase (ATGL). Sci. Rep. 2016, 6, 35531. [Google Scholar] [CrossRef] [PubMed]
  26. Gernapudi, R.; Wolfson, B.; Zhang, Y.; Yao, Y.; Yang, P.; Asahara, H.; Zhou, Q. MicroRNA 140 Promotes Expression of Long Noncoding RNA NEAT1 in Adipogenesis. Mol. Cell. Biol. 2016, 36, 30–38. [Google Scholar] [CrossRef] [PubMed]
  27. Carter, S.; Miard, S.; Boivin, L.; Sallé-Lefort, S.; Picard, F. Loss of Malat1 does not modify age- or diet-induced adipose tissue accretion and insulin resistance in mice. PLoS ONE 2018, 13, e0196603. [Google Scholar] [CrossRef] [PubMed]
  28. Pang, W.J.; Lin, L.G.; Xiong, Y.; Wei, N.; Wang, Y.; Shen, Q.W.; Yang, G.S. Knockdown of PU.1 AS lncRNA inhibits adipogenesis through enhancing PU.1 mRNA translation. J. Cell. Biochem. 2013, 114, 2500–2512. [Google Scholar] [CrossRef] [PubMed]
  29. Kong, X.; Patel, N.A.; Chalfant, C.E.; Cooper, D.R. Ceramide synthesis regulates biogenesis and packaging of exosomal MALAT1 from adipose derived stem cells, increases dermal fibroblast migration and mitochondrial function. Cell Commun. Signal. 2023, 21, 221. [Google Scholar] [CrossRef] [PubMed]
  30. Piorkowska, K.; Oczkowicz, M.; Różycki, M.; Ropka-Molik, K.; Piestrzyńska-Kajtoch, A. Novel porcine housekeeping genes for real-time RT-PCR experiments normalization in adipose tissue: Assessment of leptin mRNA quantity in different pig breeds. Meat Sci. 2011, 87, 191–195. [Google Scholar] [PubMed]
  31. Pfaffl, M.W.; Tichopad, A.; Prgomet, C.; Neuvians, T.P. Determination of stable housekeeping genes, differentially regulated target genes and sample integrity: BestKeeper—Excel-based tool using pair-wise correlations. Biotechnol. Lett. 2004, 26, 509–515. [Google Scholar] [CrossRef] [PubMed]
  32. Piórkowska, K.; Zukowski, K.; Ropka-Molik, K.; Tyra, M. Variations in Fibrinogen-like 1 (FGL1) Gene Locus as a Genetic Marker Related to Fat Deposition Based on Pig Model and Liver RNA-Seq Data. Genes 2022, 13, 1419. [Google Scholar] [CrossRef] [PubMed]
  33. Kung, J.T.Y.; Colognori, D.; Lee, J.T. Long Noncoding RNAs: Past, Present, and Future. Genetics 2013, 193, 651. [Google Scholar] [CrossRef] [PubMed]
  34. Yan, C.; Chen, J.; Chen, N. Long noncoding RNA MALAT1 promotes hepatic steatosis and insulin resistance by increasing nuclear SREBP-1c protein stability. Sci. Rep. 2016, 6, 22640. [Google Scholar] [CrossRef] [PubMed]
  35. Ebrahimi, R.; Toolabi, K.; Jannat Ali Pour, N.; Mohassel Azadi, S.; Bahiraee, A.; Zamani-Garmsiri, F.; Emamgholipour, S. Adipose tissue gene expression of long non-coding RNAs; MALAT1, TUG1 in obesity: Is it associated with metabolic profile and lipid homeostasis-related genes expression? Diabetol. Metab. Syndr. 2020, 12, 36. [Google Scholar] [CrossRef] [PubMed]
  36. Khalifa, O.; Ayoub, S.; Arredouani, A. Exploring the Putative Involvement of MALAT1 in Mediating the Beneficial Effect of Exendin-4 on Oleic Acid-Induced Lipid Accumulation in HepG2 Cells. Biomedicines 2025, 13, 370. [Google Scholar] [CrossRef] [PubMed]
  37. Kociucka, B.; Jackowiak, H.; Kamyczek, M.; Szydlowski, M.; Szczerbal, I. The relationship between adipocyte size and the transcript levels of SNAP23, BSCL2 and COPA genes in pigs. Meat Sci. 2016, 121, 12–18. [Google Scholar] [CrossRef] [PubMed]
  38. Caron, J.; Ghanbariabdolmaleki, M.; Marino, M.; Qiu, C.; Wang, B.; Mak, M.; Wang, S. Involvement of long non-coding RNA (lncRNA) MALAT1 in shear stress regulated adipocyte differentiation. Front. Bioeng. Biotechnol. 2025, 13, 1570518. [Google Scholar] [CrossRef] [PubMed]
  39. Han, J.; Shen, L.; Zhan, Z.; Liu, Y.; Zhang, C.; Guo, R.; Luo, Y.; Xie, Z.; Feng, Y.; Wu, G. The long noncoding RNA MALAT1 modulates adipose loss in cancer-associated cachexia by suppressing adipogenesis through PPAR-γ. Nutr. Metab. 2021, 18, 27. [Google Scholar] [CrossRef]
  40. Mattick, J.S.; Amaral, P.P.; Carninci, P.; Carpenter, S.; Chang, H.Y.; Chen, L.L.; Chen, R.; Dean, C.; Dinger, M.E.; Fitzgerald, K.A.; et al. Long non-coding RNAs: Definitions, functions, challenges and recommendations. Nat. Rev. Mol. Cell Biol. 2023, 24, 430–447. [Google Scholar] [CrossRef] [PubMed]
  41. Lee, H.H.; An, S.M.; Ye, B.J.; Lee, J.H.; Yoo, E.J.; Jeong, G.W.; Kang, H.J.; Alfadda, A.A.; Lim, S.W.; Park, J.; et al. TonEBP/NFAT5 promotes obesity and insulin resistance by epigenetic suppression of white adipose tissue beiging. Nat. Commun. 2019, 10, 3536. [Google Scholar] [CrossRef] [PubMed]
  42. Kappert, L.; Ruzicka, P.; Kutikhin, A.; De La Torre, C.; Fischer, A.; Hecker, M.; Arnold, C.; Korff, T. Loss of Nfat5 promotes lipid accumulation in vascular smooth muscle cells. FASEB J. 2021, 35, e21831. [Google Scholar] [CrossRef] [PubMed]
  43. Brunmeir, R.; Wu, J.; Peng, X.; Kim, S.Y.; Julien, S.G.; Zhang, Q.; Xie, W.; Xu, F. Comparative Transcriptomic and Epigenomic Analyses Reveal New Regulators of Murine Brown Adipogenesis. PLoS Genet. 2016, 12, e1006474. [Google Scholar] [CrossRef] [PubMed]
  44. Nelson, S.R.; Roche, S.; Cotter, M.; Garcia, P.A.; Reitmeier, D.; Zollbrecht, E.; O’Neill, F.; Clynes, M.; Doolan, P.; Medha, J.P.; et al. Genomic Profiling and Functional Analysis of let-7c miRNA-mRNA Interactions Identify SOX13 to Be Involved in Invasion and Progression of Pancreatic Cancer. J. Oncol. 2020, 2020, 2951921. [Google Scholar] [CrossRef] [PubMed]
  45. Ma, Y.Y.; Zhou, W.Y.; Qian, Y.; Mu, Y.Y.; Zhang, W. SOX13 as a potential prognostic biomarker linked to immune infiltration and ferroptosis inhibits the proliferation, migration, and metastasis of thyroid cancer cells. Front. Immunol. 2024, 15, 1478395. [Google Scholar] [CrossRef] [PubMed]
  46. Liu, R.; Xiong, X.; Nam, D.; Yechoor, V.; Ma, K. SRF-MRTF signaling suppresses brown adipocyte development by modulating TGF-β/BMP pathway. Mol. Cell. Endocrinol. 2020, 515, 110920. [Google Scholar] [CrossRef] [PubMed]
  47. Li, H.; Sun, G.; Liu, C.; Wang, J.; Jing, R.; Wang, J.; Zhao, X.; Xu, X.; Yang, Y. PBX3 is associated with proliferation and poor prognosis in patients with cervical cancer. Onco Targets Ther. 2017, 10, 5685–5694. [Google Scholar] [CrossRef] [PubMed]
  48. Cho, Y.M.; Kim, D.H.; Kwak, S.N.; Jeong, S.W.; Kwon, O.J. X-box binding protein 1 enhances adipogenic differentiation of 3T3-L1 cells through the downregulation of Wnt10b expression. FEBS Lett. 2013, 587, 1644–1649. [Google Scholar] [CrossRef] [PubMed]
  49. Sha, H.; He, Y.; Chen, H.; Wang, C.; Zenno, A.; Shi, H.; Yang, X.; Zhang, X.; Qi, L. The IRE1α-XBP1 Pathway of the Unfolded Protein Response Is Required for Adipogenesis. Cell Metab. 2009, 9, 556–564. [Google Scholar] [CrossRef] [PubMed]
Figure 1. Histological structures of subcutaneous adipose tissue collected from Złotnicka Spotted (ZS) and Pietrain pigs stained with haematoxylin and eosin (H&E). Nuclei are stained in dark purple. Samples were taken from two body regions: (A) dorsal fat and (B) abdominal fat for ZS and (C) dorsal fat and (D) abdominal fat for Pietrain pigs. Scale bars: 10 µm.
Genes 17 00888 g001
Figure 2. Lipid accumulation during adipogenic differentiation of primary preadipocytes isolated from backfat, visualised using Oil Red O staining (stained red lipid droplets). Progressive adipogenic differentiation was monitored on days 2 (A), 7 (B), and 14 (C), revealing time-dependent accumulation of intracellular lipids (red dashed squares). Oil-Red-O-positive droplets became increasingly prominent, especially at later stages. Insets highlight representative areas of lipid deposition. Scale bars: 10 µm.
Genes 17 00888 g002
Figure 3. Chromatograms of novel sequence variants identified in the promoter region of porcine MALAT1. Blue squares and shadows show new SNPs and deletion identified in the promoter regions of the MALAT1 gene. Below each chromatogram, the polymorphism name is indicated according to HGVS nomenclature.
Genes 17 00888 g003
Figure 4. lncRNA MALAT1 expression patterns in different tissue related to fat deposition in two pig breeds: ZS, representing a fatty phenotype, and Pietrain, representing a lean phenotype.* p-value < 0.05., ** p-value < 0.01.
Genes 17 00888 g004
Figure 5. Melting plots and gel band visualisation for ENSSSCT00000077869 and ENSSSCT00000080860 products. The analysis included Złotnicka and Pietrain pigs and four types of tissue (M—muscle, AD—dorsal adipose, AB—backfat adipose and L—liver tissue). M1—marker. Arrows show differences between analysed samples. Melting curves for individual analysed samples are shown in different colors.
Genes 17 00888 g005
Figure 6. Expression pattern of lncRNA MALAT1 during adipogenesis in primary preadipocytes isolated from backfat tissue of Złotnicka Spotted pigs. Expression levels were monitored from days 0 to 14 of differentiation. “diff” indicates the day of differentiation. Expression of the adipogenic marker LPL was used to confirm adipocyte maturation. * p-value < 0.05, *** p-value < 0.001.
Genes 17 00888 g006
Table 1. Characteristics of Złotnicka Spotted (ZS) and Pietrain pigs representing high and low fat-deposition traits, mean ± SD.
TraitsZS (n = 4)Pietrain (n = 4)
Mean SDMean SDp-ValueGroup Diff. *
Daily gain (g)639A18.71031B1080.0035338%
Yield percentage75.2A0.4977.5B0.620.00133%
Peritoneal fat (kg)0.80 0.310.42 0.130.0636%
Tenderloins (kg)0.30A0.060.46B0.050.00848%
Ham mass (kg)8.82A0.6911.7B0.780.0017225%
Backfat thickness at the K1 point (cm)3.38A0.750.88B0.150.00449574%
Ham fat mass with skin (kg)2.46A0.241.15B0.230.0002553%
Loin fat mass with skin (kg)2.45A0.490.83B0.210.00366%
Bacon with ribs (kg)6.2A0.135.1B0.166.39 × 10−518%
Fat over shoulder thickness (cm)3.6A0.51.9B0.190.0030156%
Lumbar fat I thickness (cm)3.35A0.651.00B0.310.00195169%
Lumbar fat II thickness (cm)2.98A0.600.7B0.00.003677%
Lumbar fat III thickness (cm)3.39A0.680.85B0.110.0033775%
Average backfat thickness (cm)3.08A0.501.14B0.150.0021463%
Loin eye area (cm2)32.05A4.9566.8B1.530.00029452%
SD—standard deviation. * Group diff.—the difference between groups in percentage. Values with the same letters belong to the same statistical group (A, B = p < 0.01). K1—backfat thickness at the K1 point (cm), describing backfat thickness over the lateral edge of the longissimus dorsi muscle.
Table 2. Morphometric characteristics of adipocytes in subcutaneous adipose tissue of Złotnicka Spotted (ZS) and Pietrain pigs (H&E staining).
BreedRegionMean Area (µm2)SD Area (µm2)Mean Diameter (µm)SD Diameter (µm)n
ZSback fat3995.5 Aa680.471.3 Aa6.150
dorsal fat5297.8 Cb1392.782.1 Cb10.850
Pietrainback fat3063.8 Bc847.962.6 Bc8.650
dorsal fat3428.4 Dd1452.666.1 Dd14.050
A, B, C, D—capital letters show significant differences among groups at a p-value < 0.0001; a, b, c d—lower letters show significant differences among groups at a p-value < 0.05.
Table 3. The frequencies of indicated minor alleles of porcine MALAT1 mutations for promoter regions accompanied both MALAT1 isoforms ENSSSCT00000080860 and ENSSSCT00000077869, including 7 pig breeds representing commercial and native Polish pigs.
Pig BreedPorcine MALAT1 Promoter Variations
rs338099140 (C)rs329590882 (A)rs321550593 (C)rs695444210
(-)
New
(-)
New
(C)
New
(T)
rs318806718
(C)
rs319966827 (C)rs338175674 (C)
Puławska068.82.10010.48.381.318.818.8
Duroc06.3008.329.22.14.246.746.7
Polish Large White2.160.402.104.2062.518.818.8
Pietrain058.36.3004.22158.337.535.4
Polish Landrace4.22.12.14.2023052.118.822.9
Złotnicka Spotted014.618.804.28.3039.68.38.3
Złotnicka White27.116.78.331.3031.3033.3031.3
Total (%)4.832.45.45.41.815.84.546.71923.8
Disclaimer/Publisher’s Note: The statements, opinions and data contained in all publications are solely those of the individual author(s) and contributor(s) and not of MDPI and/or the editor(s). MDPI and/or the editor(s) disclaim responsibility for any injury to people or property resulting from any ideas, methods, instructions or products referred to in the content.