Article

Fine Mapping of a Major Locus for Leaf Sheath Hairiness in Wheat Identifies TaSAIN1-4D as a Candidate Gene

1
Institute of Ecology, China West Normal University, Nanchong 637009, China
2
College of Agronomy, Sichuan Agricultural University, Chengdu 611130, China
3
College of Life Science, China West Normal University, Nanchong 637009, China
*
Author to whom correspondence should be addressed.
Genes 2025, 16(9), 1117; https://doi.org/10.3390/genes16091117
Submission received: 22 August 2025 / Revised: 17 September 2025 / Accepted: 19 September 2025 / Published: 20 September 2025
(This article belongs to the Special Issue Genetic Research on Crop Stress Resistance and Quality Traits)

Abstract

Background/Objectives: Leaf sheath hairiness (LSH) is an adaptive trait in wheat that improves tolerance to biotic and abiotic stresses. Although trichome development has been extensively studied in model plants, the genetic basis of LSH in Triticeae crops remains poorly defined. Methods: In this study, the inheritance and genetic architecture of LSH were investigated. Two F2 populations were used, derived from crosses between the glabrous lines ‘Shumai 830’ and ‘Shumai 2262’ and the hairy line ‘Zhongkelanmai 1’. BSA-seq was combined with KASP marker genotyping to map and refine the trait locus. Candidate genes were evaluated through comparative genomics; sequence variation; and subcellular localization prediction. Results: Phenotypic evaluation revealed that LSH is a dominant trait, segregating at a 3:1 ratio in F2 populations. BSA-seq identified a major locus, QLsh.cwnu-4D, on chromosome 4DL. Fine mapping with KASP markers refined this region to a 1.67 Mb interval overlapping a 530 kb trichome-associated linkage disequilibrium block in Aegilops tauschii. Within this interval, TaSAIN1-4D, a salt-inducible protein unique to Triticeae, was identified as the strongest candidate gene. Extensive sequence variation among alleles (TaSAIN1-4Da; TaSAIN1-4Db; TaSAIN1-4Dc), including large insertions and multiple SNPs, indicated potential functional diversification. Predicted nuclear localization of TaSAIN1-4D supports a role in trichome regulation and stress adaptation. The co-dominant KASP marker K-cwnu-4D-502238348 was tightly linked to LSH and cosegregated perfectly, making it a reliable tool for marker-assisted selection. Conclusions: This study clarifies the genetic architecture of leaf sheath hairiness in wheat and identifies TaSAIN1-4D as a likely regulator. These findings provide a practical marker-assisted selection tool that can accelerate the development of improved wheat varieties with desirable leaf surface traits.

1. Introduction

Leaf pubescence, characterized by the presence of trichomes or leaf hairs (LHs), is a common adaptive trait in angiosperms, including major cereal crops such as wheat, barley, rye, and rice [1,2]. These epidermal outgrowths range from simple unicellular projections to complex multicellular structures, with various morphologies, including straight, hooked, branched, or spiral forms. Glandular trichomes secrete secondary metabolites (e.g., terpenoids, alkaloids, phenolics, and phenylpropanoids) that deter herbivores and inhibit pathogen colonization [3]. In contrast, non-glandular trichomes enhance abiotic stress tolerance by reducing transpirational water loss, modulating leaf surface temperature, and improving moisture retention during drought conditions [4,5].
In Triticeae, natural variation in trichome traits is controlled by multiple quantitative trait loci (QTLs). In bread wheat (Triticum aestivum L.), the dominant gene Hl1 on chromosome 4BL governs medium-length trichome formation [4,6], while additional QTLs on 4BS, 7BS, 7D, and 4DL influence trichome density and distribution [7,8]. In barley (Hordeum vulgare L.), leaf-blade and sheath pubescence are mapped to chromosomes 3HL and 4HL, respectively [9,10]. The barley Hairy leaf sheath (Hsh) gene on 4HL is collinear with the rye Hairy peduncle 1 (Hp1, 5RL) and wheat Hl1 (4BL) [7,11,12]. In the D-genome progenitor Ae. tauschii, known for its dense auricle and leaf hairs, candidate loci for trichome traits include hfl on 3D and Hsh on 4DL [8,13,14]. A genome-wide association study of 242 accessions also identified a 530 kb linkage disequilibrium (LD) block on 4DL associated with marginal trichome number [15].
Breeding efforts have successfully introgressed novel trichome alleles from wild relatives into cultivated wheat. A prominent example is the introgression of an Hl1 variant (Hl1th) from Thinopyrum ponticum (2n = 10x = 70, StStStStEeEeEbEbExEx) into the wheat cultivar ‘Saratovskaya 29’ via chromosome 4th substitution. This has enabled marker-assisted dissection of gene interactions and the development of stress-resilient, high-yielding wheat lines [16]. Despite these advances, the primary genes controlling leaf pubescence in Triticeae remain unmapped and uncloned, limiting functional studies and practical breeding applications.
The present study employs bulked segregant analysis sequencing (BSA-seq) to map QTL for leaf-sheath hairiness (LSH) in two F2 populations derived from crosses between glabrous lines ‘Shumai 830’ and ‘Shumai 2262’ and the hairy line ‘Zhongkelanmai 1’, which carries the genetic lineage of ‘Chuanmai 42’ (CM42) and Th. ponticum, and may harbor QLsh.saas-4D or Hl1th [8,16]. Resultly, the Lsh locus were delimited to a 2.11 Mb interval overlapping the 530 kb Ae. tauschii LD block, refine it to 1.67 Mb with Kompetitive Allele-Specific PCR (KASP) markers, and conduct molecular cloning, sequence analysis, and subcellular localization prediction of candidate genes. This work lays the groundwork for cloning the key LSH gene and its potential deployment in wheat improvement.

2. Materials and Methods

2.1. Plant Materials

Three hexaploid wheat cultivars were utilized to generate two F2 segregating populations for BSA-seq analysis. The cultivars Shumai 830 (SM830; pedigree: SHW-L1/Chuannong 16//Pm99915-1/3/03-DH1959) and Shumai 2262 (SM2262; pedigree unknown) both exhibit glabrous leaf sheaths and blades, though SM830 retains a hairy auricle (Figure 1, Figures S1 and S2). These served as the female parents and were developed at the Triticeae Research Institute, Sichuan Agricultural University. The male parent, Zhongkelanmai 1 (ZKLM1; pedigree: Chuanmai 42/Lannuoxiaomai 12//R64002), displays a hairy leaf sheath, glabrous leaf blade, auricle, and blue grains (Figure 1, Figures S1 and S2). The blue grain trait in ‘Lannuoxiaomai 12’ originates from wheat–Th. ponticum 4EL chromosomal translocation lines. ZKLM1 was bred at the Chengdu Institute of Biology, Chinese Academy of Sciences. Crosses between SM830 × ZKLM1 and SM2262 × ZKLM1 produced two F2 populations (hereafter referred to as ‘SM830/ZKLM1’ and ‘SM2262/ZKLM1’) for subsequent bulked-segregant analysis.

2.2. Field Trial and Growth Conditions

The two F2 populations, along with their parental lines, were evaluated during the 2024–2025 growing season at the experimental farm of China West Normal University in Nanchong, Sichuan Province. Each genotype was sown in a 1.5 m single row, with 15 seedlings per row and 0.3 m between adjacent rows. Standard agronomic practices for wheat, including land preparation, irrigation, and fertilization, were followed throughout the season.

2.3. Bulk Construction and Targeted Genotyping by Sequencing

LSH is a qualitative trait, which enabled phenotyping of the F2 segregating populations by visual inspection. From the SM830/ZKLM1 F2 population, 52 LSH+ and 55 LSH− (approximately 1:1) individuals were selected to construct one mixed pool, while from the SM2262/ZKLM1 F2 population, 56 LSH+ and 28 LSH− (2:1) individuals formed a second mixed pool. Flag leaf samples were collected using a 6 mm punch, with five leaf discs taken from each plant within both pools and the parental lines. Genomic DNA was extracted using the Plant Genomic DNA Kit (DP305, Tiangen Biotech, Beijing, China). DNA quality was assessed by agarose gel electrophoresis (1%) and quantified using the Qubit Flex fluorometer (ThermoFisher Scientific, Waltham, MA, USA).
Genomic DNA from the mixed pools and parental lines was sent for 120K-4HWA SNP probe-targeted genotyping by sequencing (Tcuni, Chengdu, China). DNA libraries were constructed, probes captured, and quality controlled following Tcuni’s standard procedures. Paired-end sequencing was conducted on the DNBSEQ-T7 platform (MGI Tech, Shenzhen, China), with sequencing depths of 60× for the mixed pools and 30× for the parental lines. The paired-end sequencing comprised two rounds: the first round captured the template strand, and the second round obtained the complementary strand.

2.4. Data Processing and Variant Calling

The data analysis pipeline included raw data quality control, data alignment, variant calling, and statistical analysis. Raw sequencing reads were processed using the fastp software (version 0.23.4, parameters: -n 15 -q 15 -u 40) to ensure data quality [17]. The processing steps included: (1) removal of adapter sequences; (2) exclusion of paired reads containing more than 15 ‘N’ bases; and (3) exclusion of paired reads with more than 40% bases with quality scores (Q) ≤ 15. Clean reads were aligned to the wheat cv. Chinese Spring reference genome (RefSeq v2.1) using the MEM algorithm in BWA (v0.7.17) [18,19]. SNPs and InDels were called using GATK [20], and variants with low confidence were filtered out. High-confidence variants were annotated, and their potential effects were predicted using SnpEff [21].

2.5. BSA-Seq Analysis

Raw reads were first subjected to quality control using fastp v0.23.4. Low-quality bases (Phred score < 30) and adapter sequences were removed, and reads shorter than 50 bp after trimming were discarded. Approximately 0.61% of reads were filtered out on average across the samples. QTL identification was conducted using three complementary methods, including the Euclidean distance (ED) algorithm, the G′ statistic, and the classical Δ(SNP-index) approach [22,23,24]. For the ED analysis, SNPs exceeding the 99% confidence interval were retained, and their ED values were smoothed to highlight significant peaks. The QTLseqr R package v0.7.5.2 was employed to compute both the SNP-index and G′ statistic with a 2 Mb sliding window and 10 kb steps. Statistical significance was assessed at p < 0.05 after Bonferroni correction [25]. Candidate QTL regions were defined as genomic intervals consistently detected by all three methods. Genes within these overlapping intervals were annotated using the intervalTools utility on the WheatOmics 1.0 platform (http://202.194.139.32/tools/intervalTools.html, accessed on 16 June 2025).

2.6. KASP Marker Development and Fine Mapping

To validate and fine-map the identified QTL, 92 F2:3 family lines exhibiting extreme LSH phenotypes were selected from the SM830 × ZKLM1 F2 population for KASP analysis. Genomic DNA from these F2:3 lines and their parents was isolated as described above. KASP markers were designed based on differential SNP probes within the QTL regions, with each marker corresponding to a specific SNP locus. Primer sequences for KASP markers were designed using the PrimerServer tool on the WheatOmics 1.0 platform (http://202.194.139.32/snprimer/, accessed on 20 June 2025). Two allele-specific forward primers and a common reverse primer were synthesized by Sangon Biotech (Shanghai, China) (Table S1). Marker specificity was first confirmed between the parental lines and then genotyped across the 92 F2:3 family lines. Genotyping was performed following the protocol of Liu et al. (2024) on a BIO-RAD CFX Connect™ Real-Time PCR System (Bio-Rad, Hercules, CA, USA) [26]. Across all assays, the average call rate exceeded 98%, and the reproducibility between replicates was greater than 99%, indicating high reliability of the developed markers for fine mapping.

2.7. Molecular Cloning and Sequence Analysis of Candidate Genes

Total RNA was isolated from flag leaves of SM830 and ZKLM1 using the TaKaRa MiniBEST Plant RNA Extraction Kit (TaKaRa, Dalian, China). First-strand cDNA was synthesized with the PrimeScript RT reagent Kit (TaKaRa) according to the manufacturer’s instructions. PCR amplifications were performed on cDNA and genomic DNA templates to obtain both coding sequences (CDS) and genomic sequences of each candidate gene, following the conditions and cloning workflow described by Hu et al. (2018) [27]. Amplified fragments were purified, cloned into the pJET1.2/blunt vector (Thermo Fisher, Waltham, MA, USA), and three independent positive clones per target were sequenced by Sangon Biotech (Shanghai, China). Sequence assembly and alignment were conducted in DNAMAN 8.0. Signal peptides were predicted using SignalP v6.0 (https://services.healthtech.dtu.dk/services/SignalP-6.0/, accessed on 25 July 2025), and subcellular localization was inferred using DeepLoc v2.1 (https://services.healthtech.dtu.dk/services/DeepLoc-2.1/, accessed on 25 July 2025). All primer sequences are provided in Table S1.

3. Results

3.1. Phenotypic Evaluation

The phenotypic evaluation of the F1 hybrids, F2 populations, and their parental lines was carried out through visual observation of leaf sheath and auricle hairiness. The parental lines SM830 and SM2262 were both glabrous for the leaf sheath and blade. In contrast, ZKLM1 exhibited a distinct hairy leaf sheath phenotype (Figure 1a–c). Upon crossing these lines, both F1 hybrids, SM830/ZKLM1 and SM2262/ZKLM1, displayed leaf sheath hairiness (Figure 1d,g). This confirmed that the hairy leaf sheath trait is dominant over the glabrous phenotype. In the F2 populations derived from the SM830/ZKLM1 and SM2262/ZKLM1 crosses, the segregation of the LSH trait followed a 3:1 ratio, with approximately three-quarters of the plants showing the LSH phenotype and one-quarter exhibiting a glabrous leaf sheath (Figure 1e,h for LSH+ plants; Figure 1f,i for glabrous plants). For auricle hairiness, SM830 had hairy auricles, while SM2262 and ZKLM1 exhibited glabrous auricles (Figure S1a–c). The F1 hybrids from cross SM830/ZKLM1 exhibited hairy auricles, and approximately 75% of the F2 individuals from populations displayed auricle hairiness, irrespective of their leaf sheath phenotype (Figure S1d–f). Notably, all tested lines, including both parents and hybrids, had glabrous leaf blades (Figure S2).

3.2. Characterization of Targeted Capture Sequencing Data

To identify QTLs associated with LSH, four bulk-segregant pools (two for each F2 population) and the three parental lines were genotyped using a 120K-4HWA SNP-capture sequencing. A total of 297,110,842 raw reads (41.51 Gb) were generated during sequencing. After quality trimming, 295,242,880 clean reads (40.19 Gb) were retained, representing 99.30% to 99.51% of the total reads, with Q30 scores consistently exceeding 96%. The GC content ranged from 51.1% to 52.9%, with an average of 52.3%. Duplicate reads were kept below 4%, ensuring high-quality data (Table 1).
Mapping the clean reads to the wheat ‘Chinese Spring’ reference genome (RefSeq v2.1) resulted in an alignment rate of 99.99%. The mean sequencing coverage depths were ≥60× for the pooled samples and ≥30× for the parental lines. The capture rate of the four bulks ranged from 30.85% to 31.30%, while the capture rates of the parents ZKLM1 and SM830 were close to 30%, at 28.53% and 29.89%, respectively. In contrast, the capture rate of the parent SM2262 was lower, at only 22.84%. Regions covered by at least 10 reads (coverage ≥ 10×) accounted for over 94% in all pools. However, coverage was slightly lower for individual parental lines: 87.59% for ZKLM1, 87.45% for SM830, and 82.16% for SM2262 (Table 2). Nevertheless, because the coverage ≥10× exceeded 80% in all samples, the datasets were considered suitable for downstream Bulked-Segregant Analysis (BSA).

3.3. BSA-Seq Analysis and QTL Identification

BSA was performed on the two F2 bulk-segregant pools to map QTLs associated with the LSH trait. To reduce background noise and focus on the target signal, the three parental lines were included in the analysis. Three complementary methods were used for association mapping and QTL detection, namely the ED approach, the G′ statistic, and the Δ(SNP-index) method.
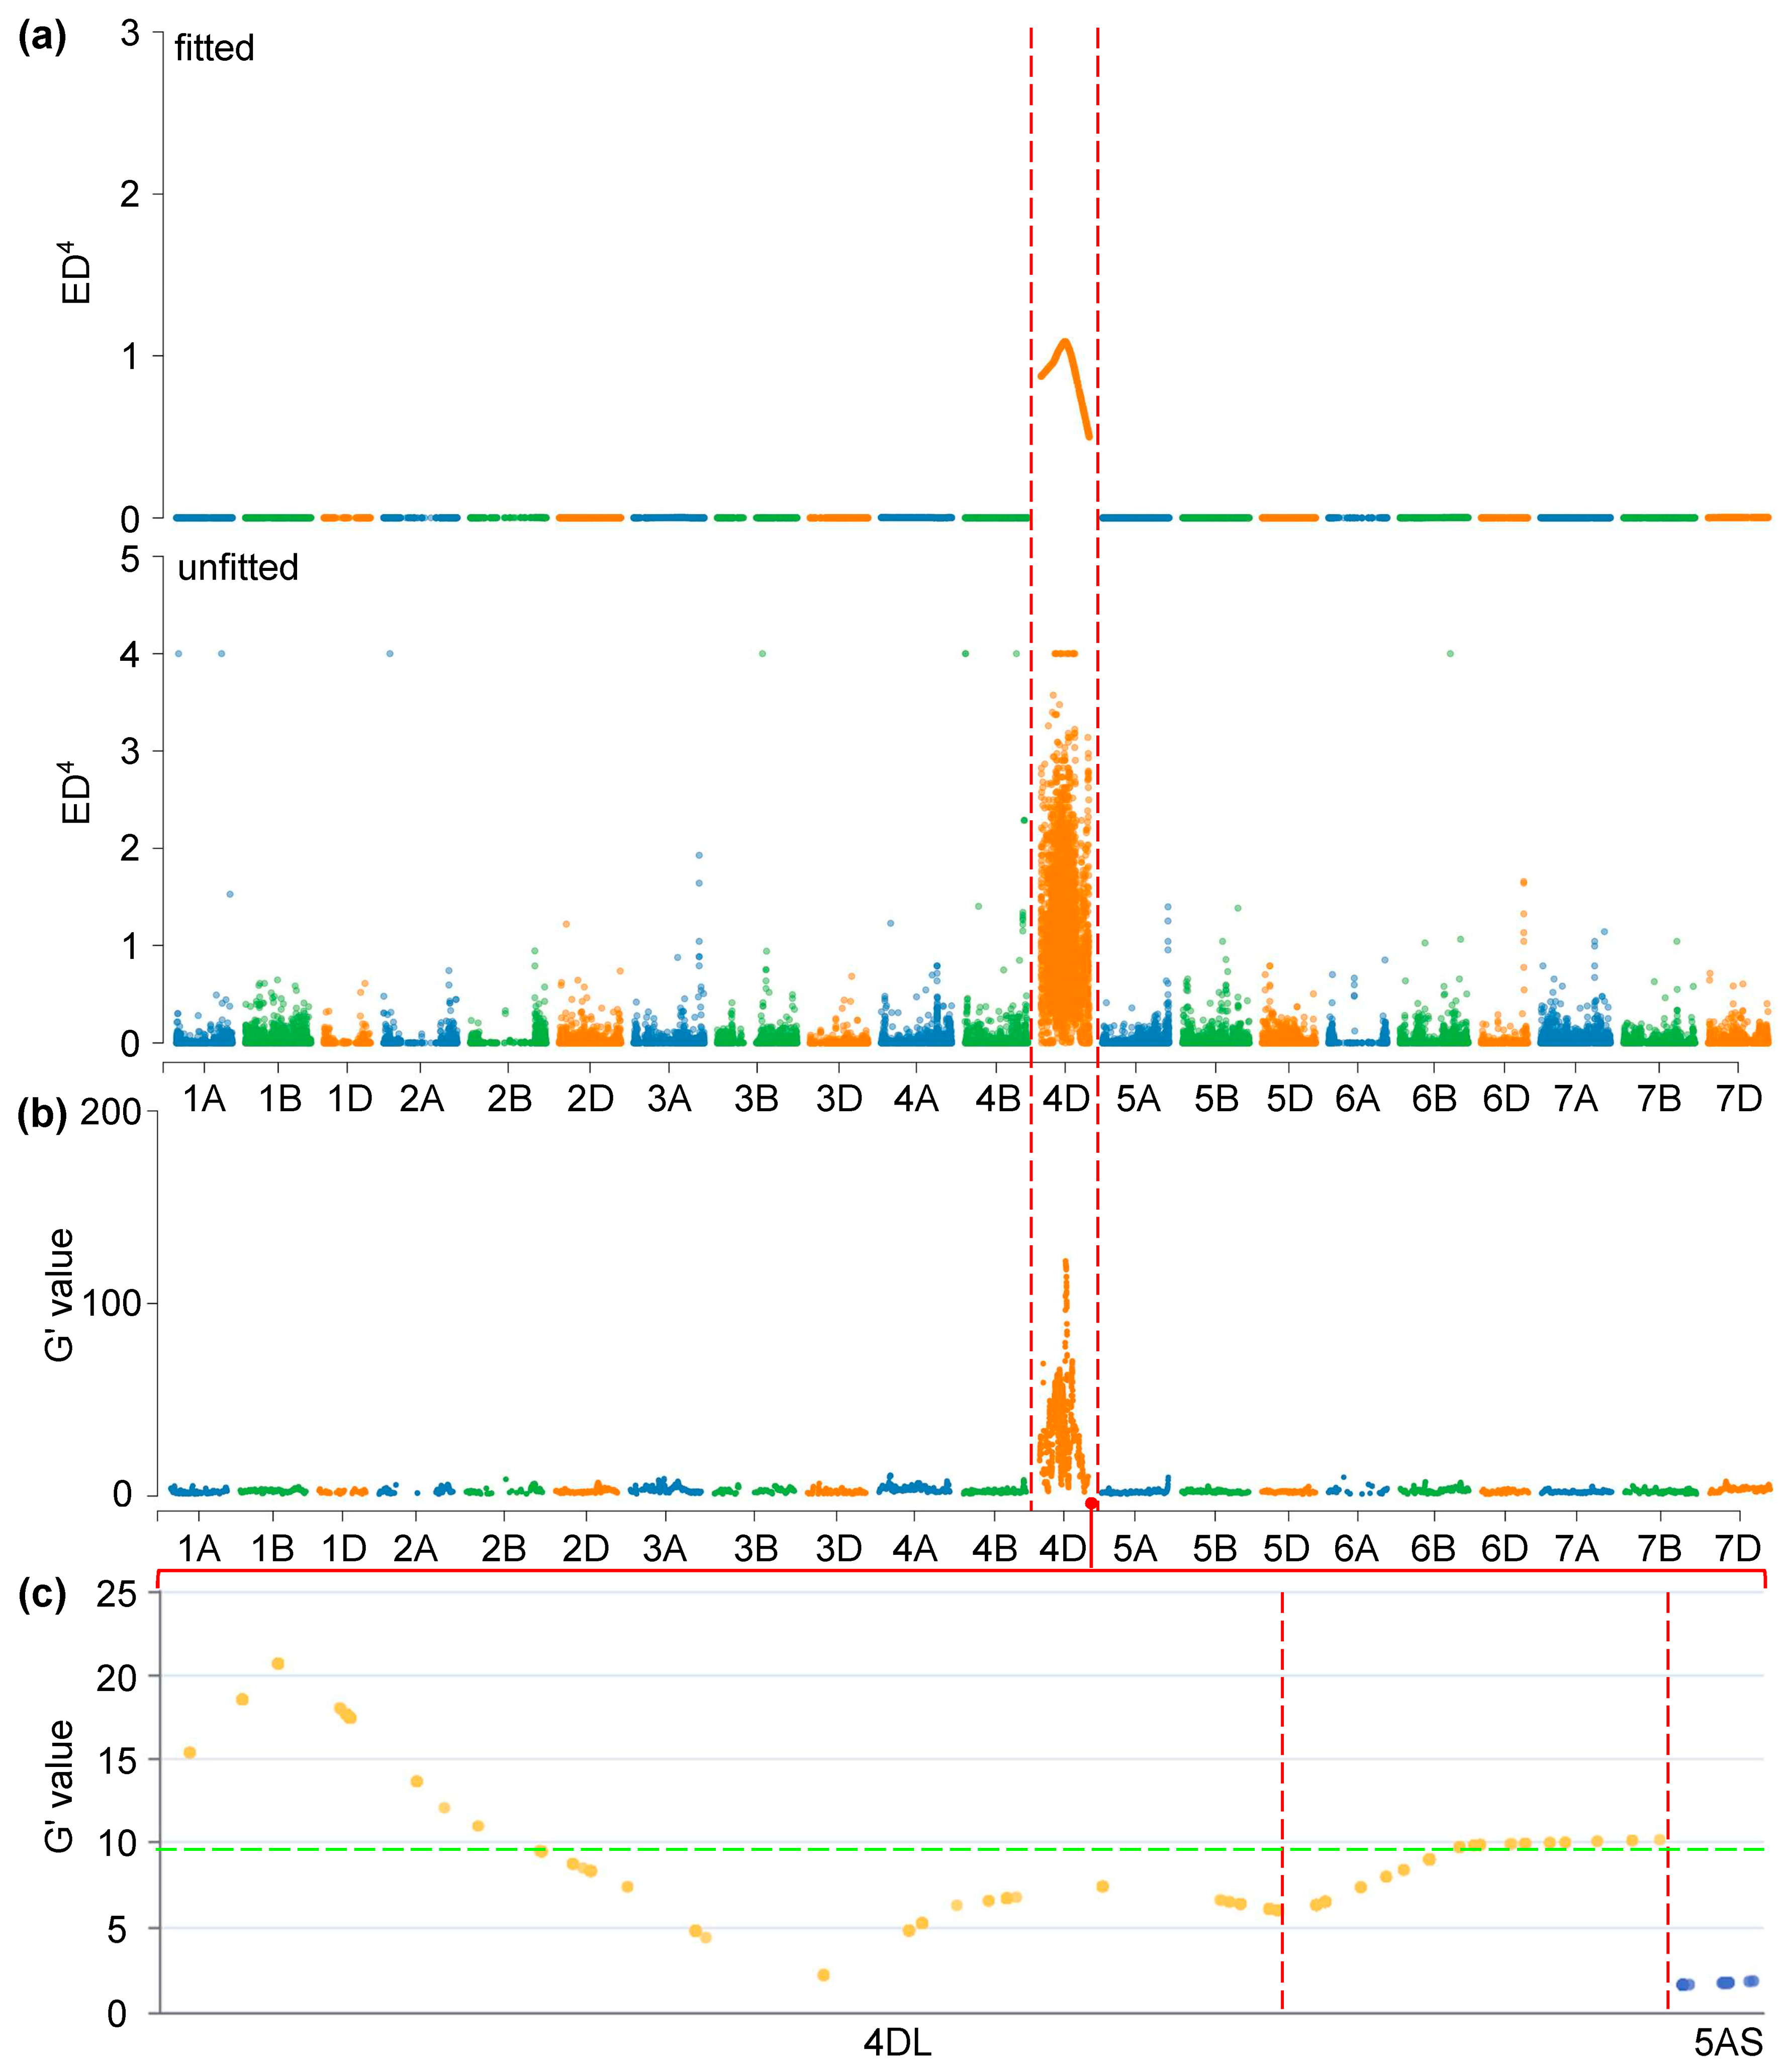
For the ED analysis, raw ED values were raised to the fourth power (ED4) and smoothed using the SNPNUM method. The significance threshold for the smoothed ED4 values was set at 0.2. In both the SM830/ZKLM1 F2 bulk-segregant pools, a strong peak in ED4 values was detected on chromosome 4D, reaching approximately 1.0 in one pool and around 0.5 in the other, while all other chromosomes remained near zero (Figure 2a and Figure S3a). This unambiguously localized the LSH-associated QTL to chromosome 4D.
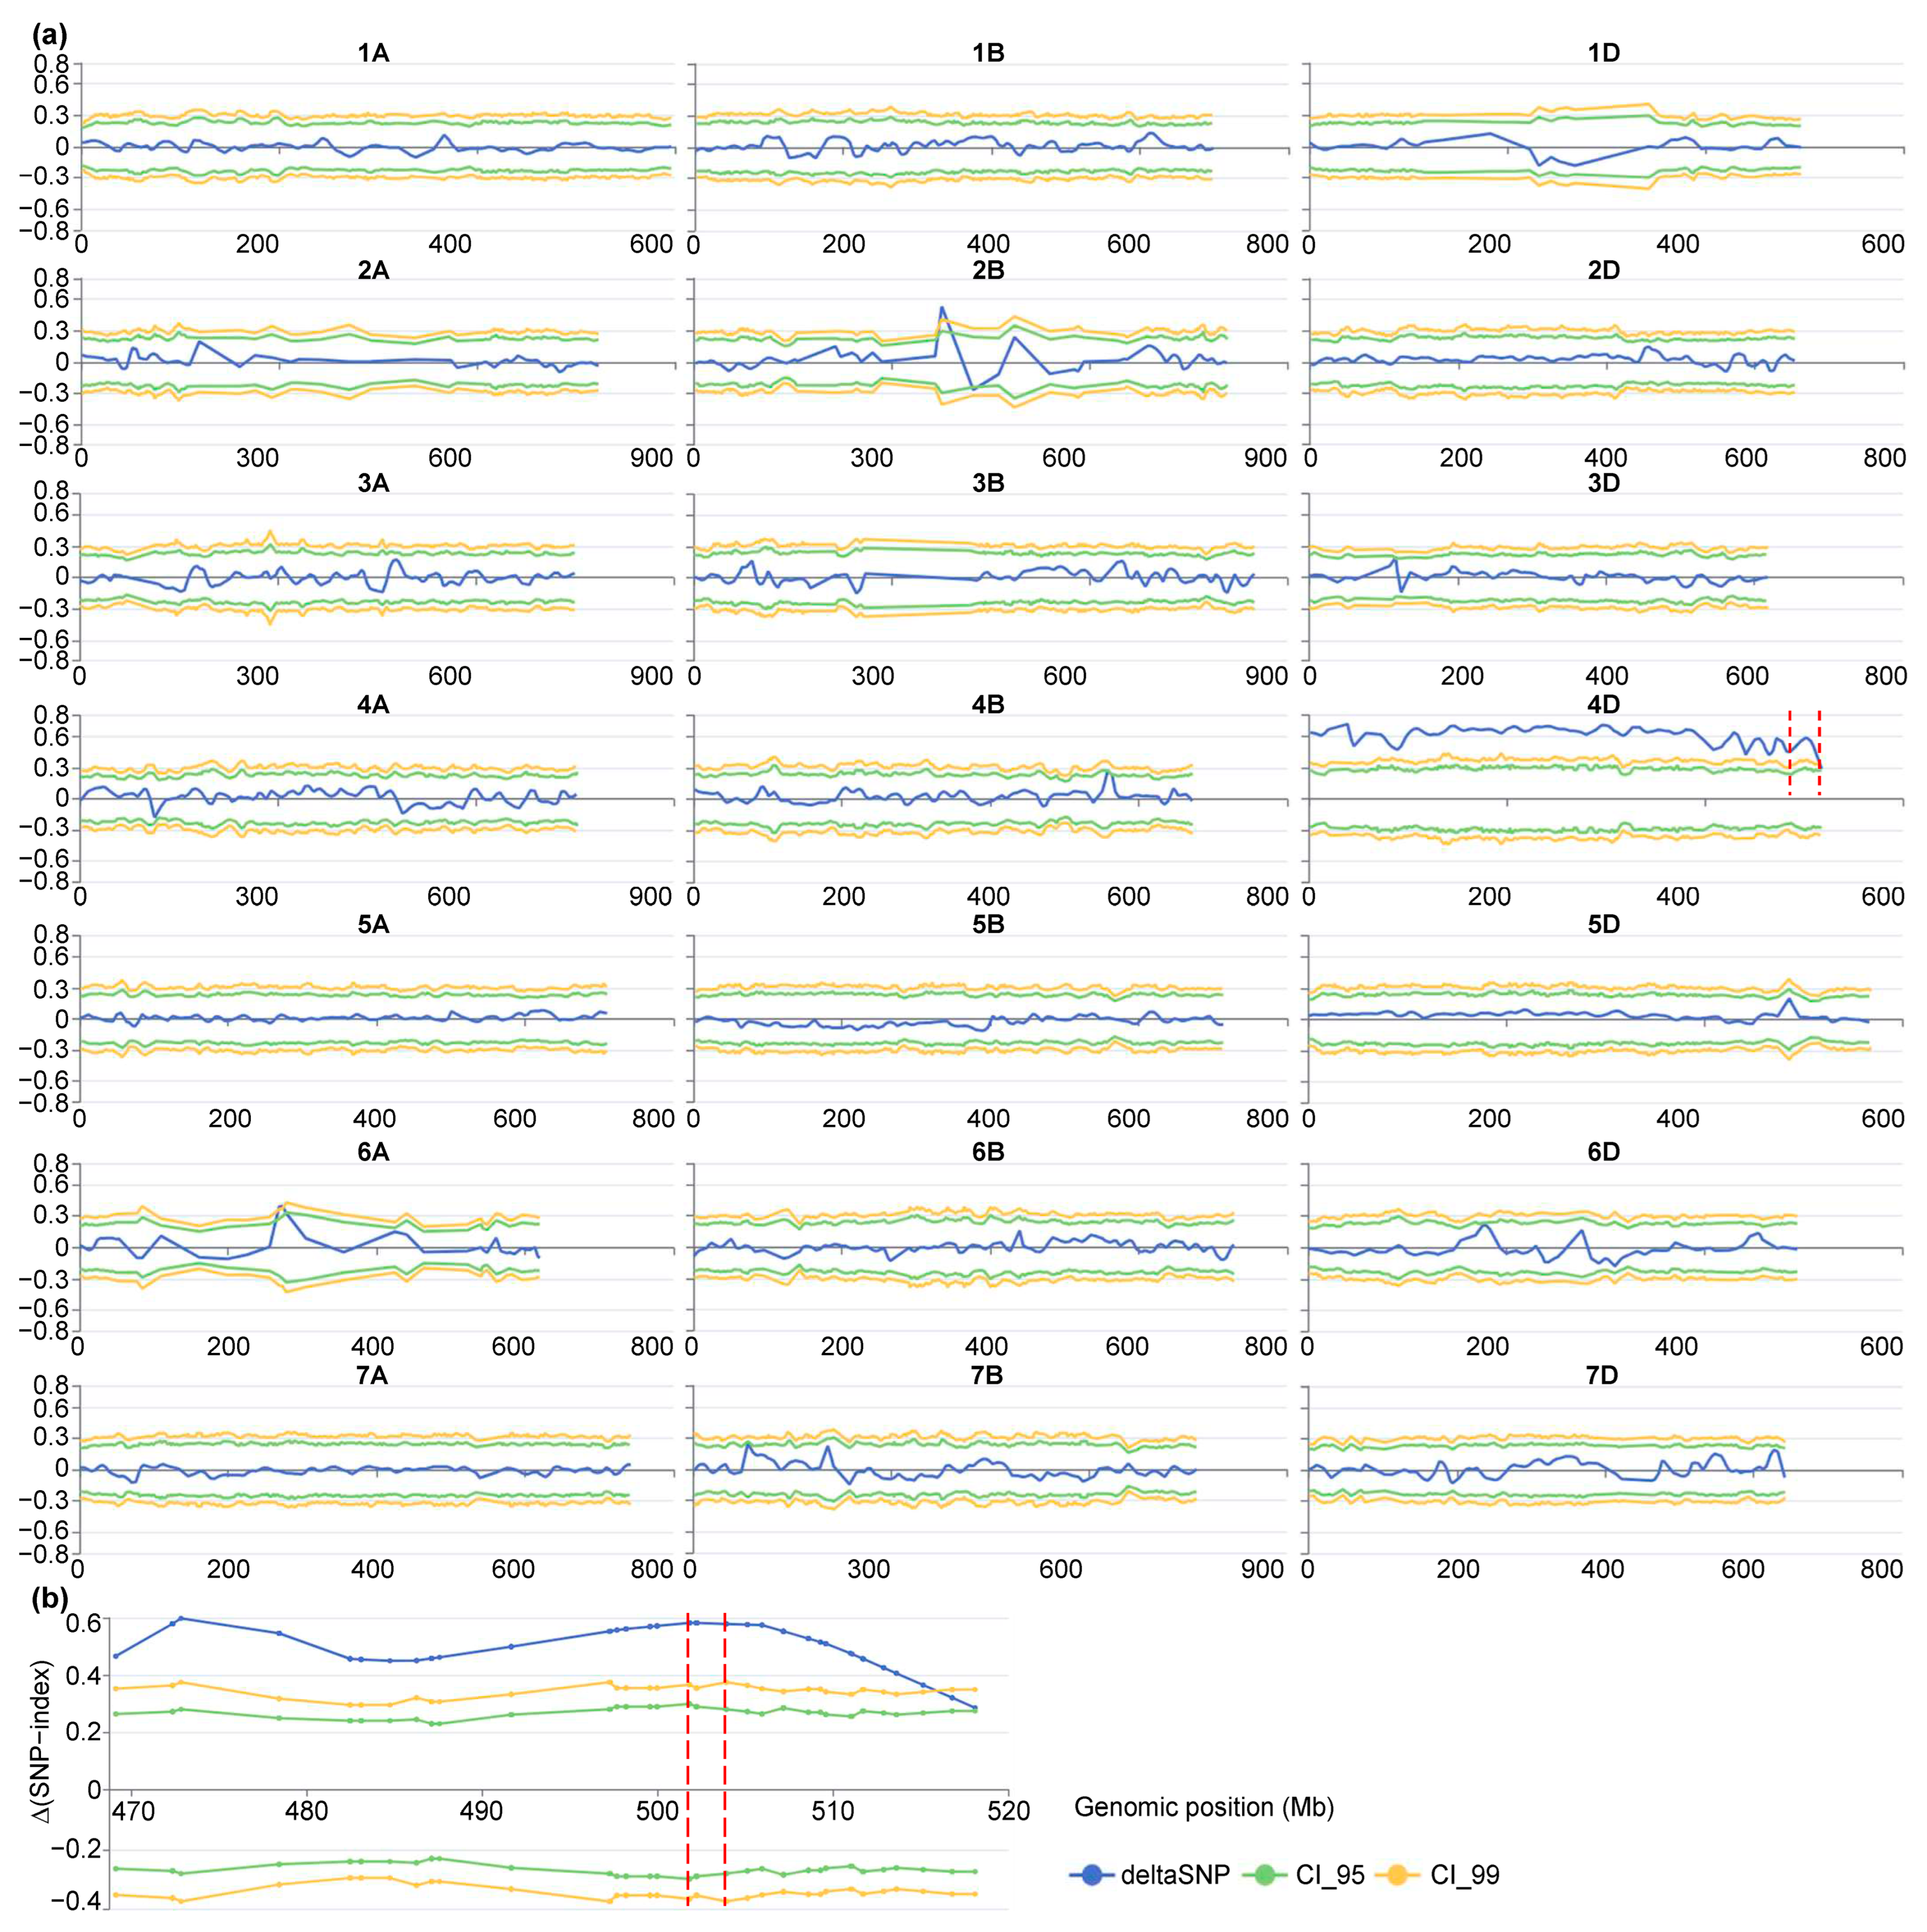
The G′ statistic corroborated the findings from the ED analysis, with a significant signal on chromosome 4D in both bulks (Figure 2b and Figure S3b). Additionally, the Δ(SNP-index) method further refined the localization, identifying significant intervals on the long arm of chromosome 4D (4DL). Four significant intervals were observed in one bulk, while only two were detected in the other (Figure 3a and Figure S4a).
By intersecting these intervals with previously reported LSH QTLs [8] and recent GWAS hits for leaf-margin trichomes [15], a consensus QTL region was identified at the distal end of chromosome 4DL. This region was designated QLsh.cwnu-4D (Figure 2c, Figure 3b, Figures S3c and S4b). The peak of this QTL spanned a 2.11 Mb interval (Chinese Spring_RefSeq v2.1: n.501803422–n.503905439), which is a strong candidate region for the LSH trait (Table 3).

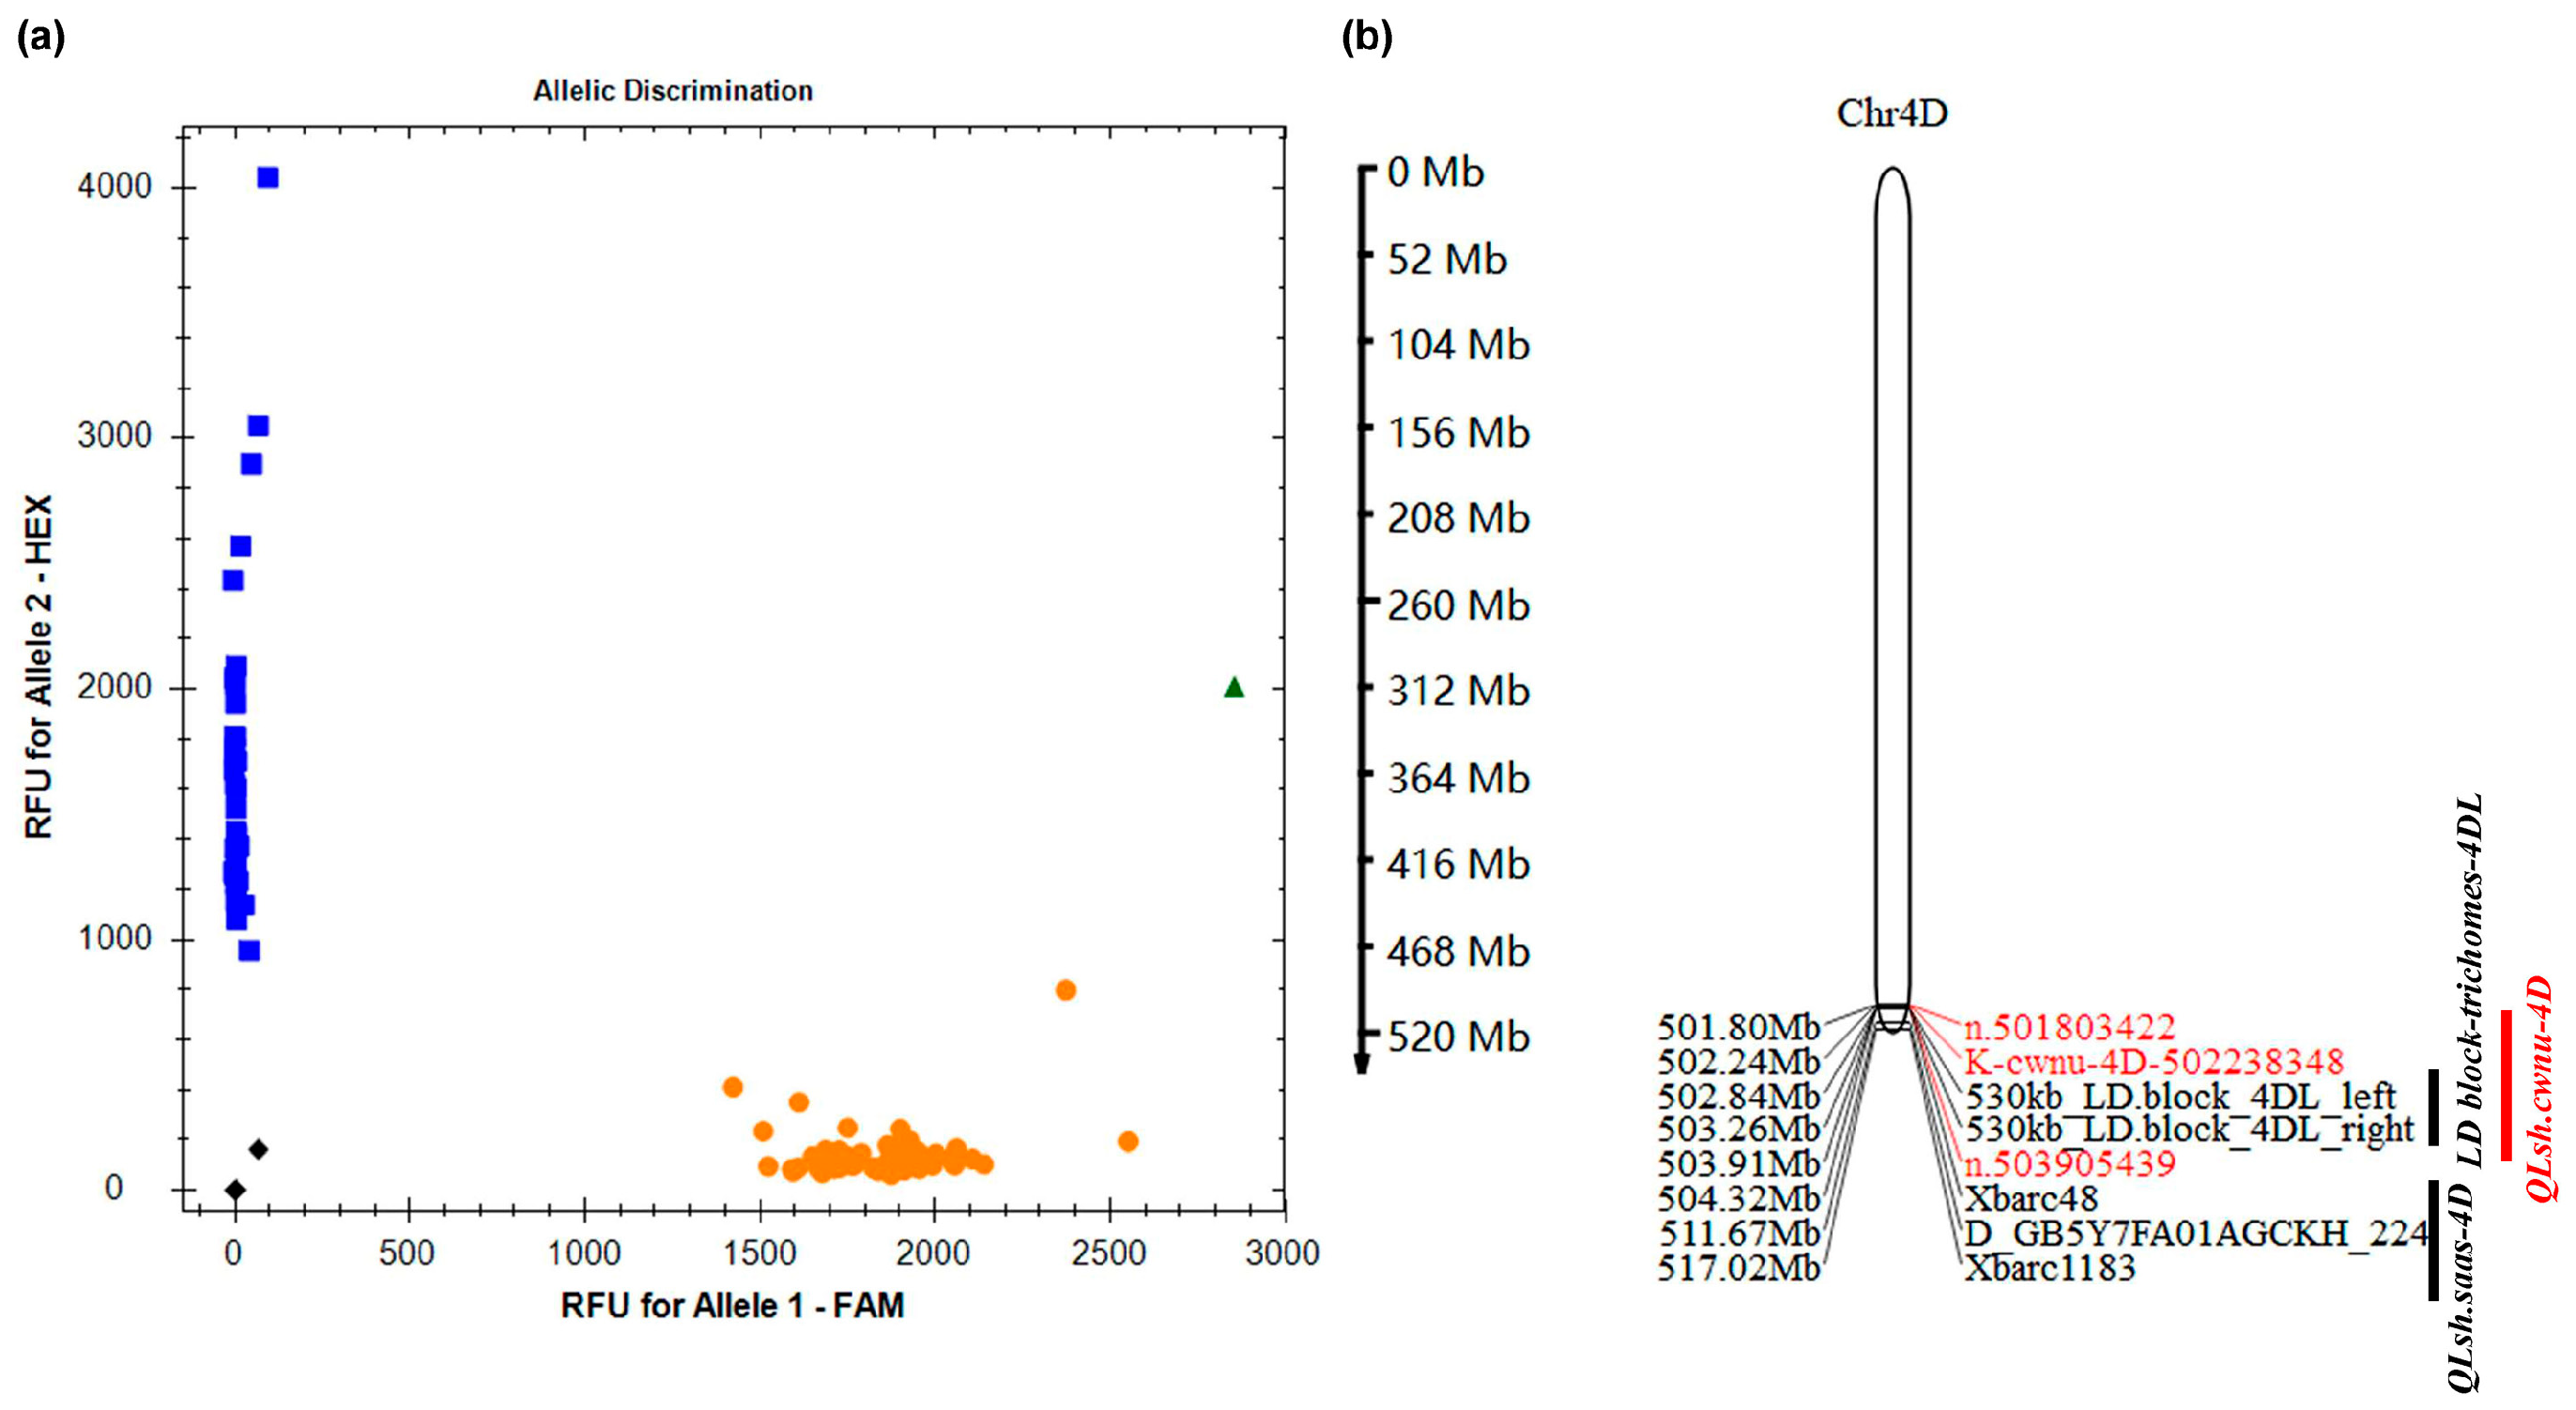
3.4. KASP Marker-Based Fine Mapping of LSH Traits

To fine-map the QTL associated with LSH, KASP markers were designed based on the SNPs identified in the QLsh.cwnu-4D region. These markers were then used to genotype a panel of 92 F2:3 family lines exhibiting extreme phenotypes for LSH from the SM830 × ZKLM1 population. Among the markers, K-cwnu-4D-502238348 produced a clear, co-dominant genotype that perfectly co-segregated with the LSH trait (Figure 4a). This marker helped narrow down the QLsh.cwnu-4D region to a 1.67 Mb segment, bounded by K-cwnu-4D-502238348 and SNP n.503905439 (502,238,348–503,905,439 bp). This refined interval overlapped a 530 kb trichome-associated LD block in Ae. tauschii and is adjacent to the previously identified QTL for LSH in the wheat cv. Chuanmai 42 (CM42) (Figure 4b).

3.5. Gene Prediction Within QLsh.cwnu-4D

Gene models within the QLsh.cwnu-4D region were extracted from the Chinese Spring reference genome (RefSeq v2.1) using the IntervalTools web server. Initially, 47 high-confidence genes were identified. After fine-mapping using KASP marker K-cwnu-4D-502238348, the region was narrowed down to 39 candidate genes. Of these, five genes were located within the 530 kb trichome-associated LD block previously defined in Ae. tauschii (Table S2). Upon examining the gene annotations, five genes within the interval were identified as potential candidates. These genes encode a cell-wall invertase (TraesCS4D03G0811800), an α/β-hydrolase superfamily protein (TraesCS4D03G0812100), a TIR-NBS-LRR disease-resistance protein (TraesCS4D03G0812400), an extracellular-matrix-binding protein (Ebh; TraesCS4D03G0812500), and the ClpB molecular chaperone (TraesCS4D03G0813100) (Table S2).
Notably, these genes were involved in cell wall modification, stress response, and disease resistance, which were consistent with the known roles of trichomes in plant defense and stress tolerance. Further analysis of the CM42 genome showed that only four high-confidence genes were predicted within the corresponding interval, and none corresponded to TraesCS4D03G0812500 (Table S3).

3.6. Structural Variation and Amplification Analysis Within QLsh.cwnu-4D

To investigate potential presence and absence variation in the fine-mapped interval, three reference assemblies were visualized, viz. T. aestivum Chinese Spring v2.1, T. aestivum CM42, and Ae. tauschii AL8/78 Aet5.0, in JBrowse. Between genes CM424D478000.1 and CM424D478100.1, an unannotated TIR-NBS-LRR disease-resistance gene was evident in CM42 and AL8/78 Aet5.0 genomes but missed in Chinese Spring v2.1 genome (Figure S5 and Table S3). However, despite multiple primer pairs, this locus failed to amplify from both genomic DNA and cDNA of ZKLM1, indicating its deletion or extensive divergence in this line (Figure S6).
The remaining four genes descending from CM424D478100.1 were then examined. In CM42, CM424D478300.1, orthologous to TraesCS4D03G0813100 in Chinese Spring, consists of four exons and three introns, whereas Chinese Spring RefSeq v2.1 annotates TraesCS4D03G0813100 as a single exon. To resolve this discrepancy, we loaded the high-quality CS-IAAS T2T assembly [28] into JBrowse and observed two identical paralogs, CSIAAS4DG0871000HC and CSIAAS4DG0871200HC, each with three exons and two introns (Figure S7). PCR amplification of this locus yielded the expected genomic fragment only in SM830, with no corresponding cDNA product, while ZKLM1 produced multiple non-specific products from both genomic DNA and cDNA (Figure S8). These data strongly suggest that the entire genomic region spanning the two TraesCS4D03G0813100 paralogs has been replaced or deleted in ZKLM1, positioning the causal gene either upstream or downstream of this structural variant.
To pinpoint the candidate region further, the 35 remaining high-confidence genes were screened for annotation and expression in T. aestivum Chinese Spring using WheatOmics 1.0. TraesCS4D03G0809500, encoding a 12-oxophytodienoate reductase-like protein and expressed in leaves, lay immediately upstream of the 530 kb trichome-associated LD block. Yet, only SM830 yielded the expected PCR products; ZKLM1 amplicons were abnormally large and, upon sequencing, proved non-target (Figure S9). This upstream deletion/replacement narrows the candidate interval to the region immediately downstream of the 530 kb LD block.

3.7. Identification and Sequence Analysis of TaSAIN1-4D

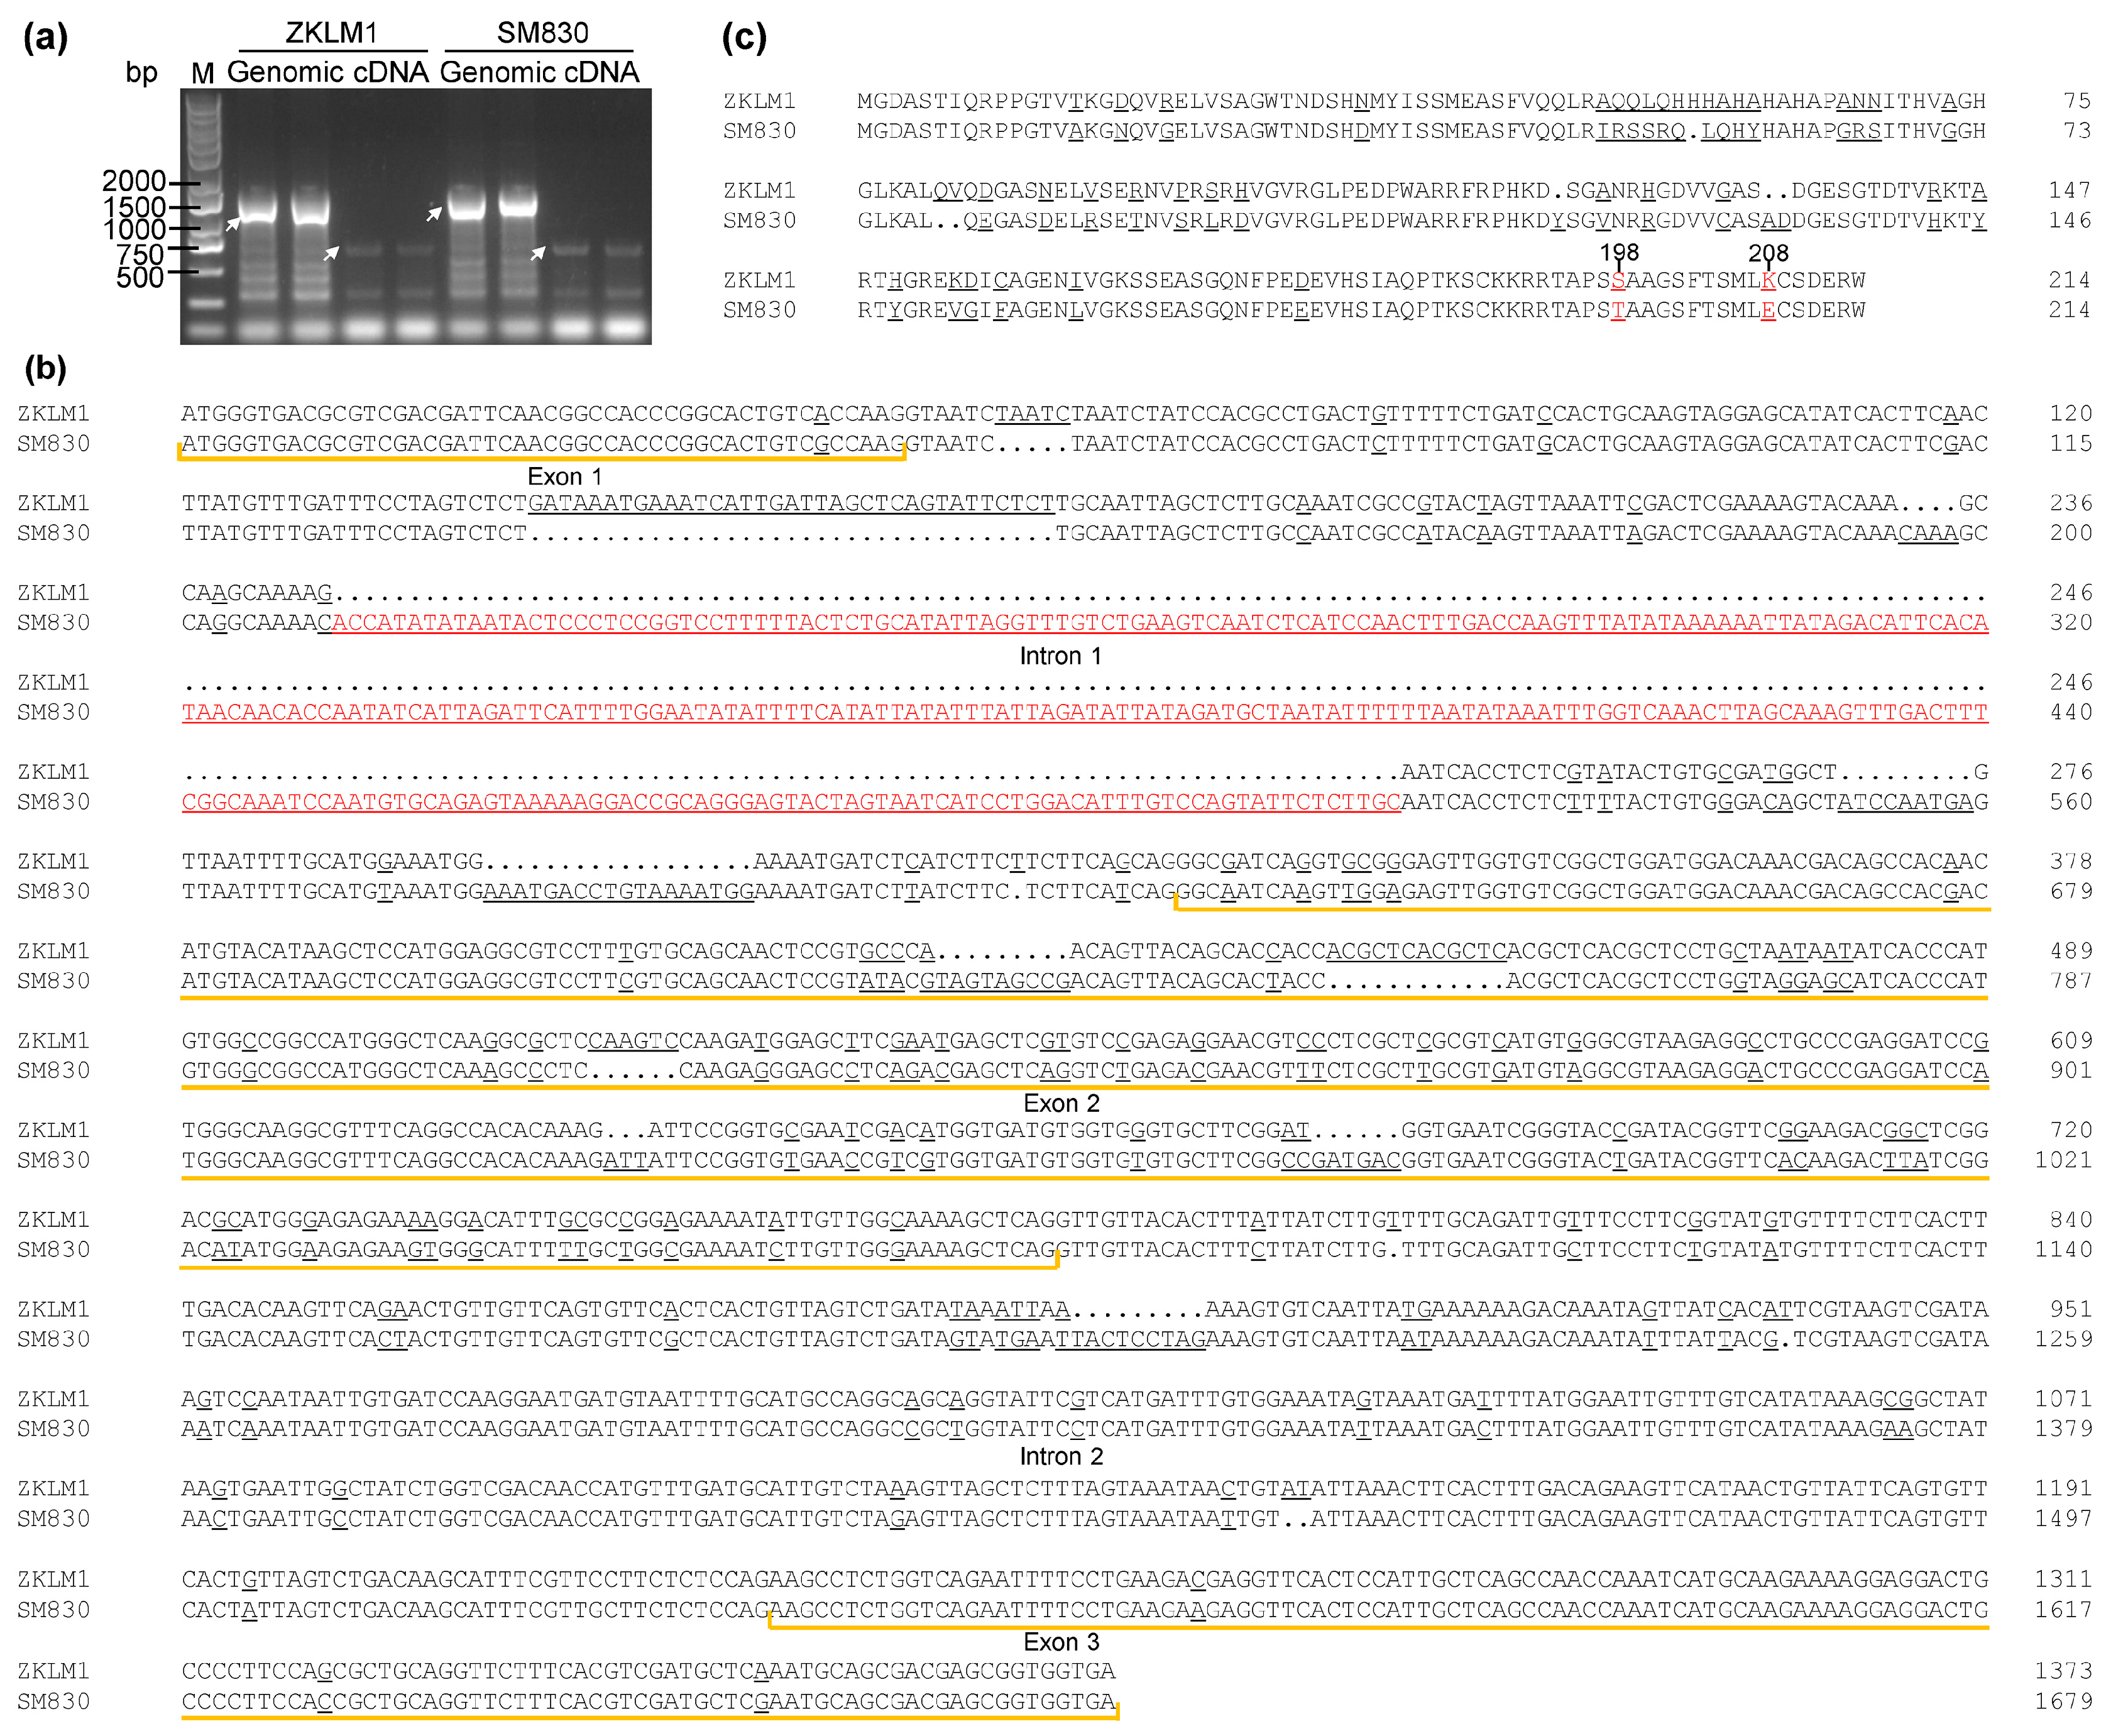
Analysis of 16 candidate genes downstream of the 530 kb LD block identified TraesCS4D03G0814900, a cold-regulated gene with high stem expression in Chinese Spring, as a potential target. PCR amplification of cDNA and genomic DNA from the parental lines ZKLM1 and SM830 produced a 0.6 kb band in both cDNA samples, and 1.4 kb and 1.6 kb bands in the genomic DNA of ZKLM1 and SM830, respectively (Figure 5a). Sequencing of the amplified fragments from SM830 confirmed the gene as a salt-inducible protein (SAIN1) gene in wheat, similar to the one in Leymus chinensis associated with salt stress tolerance (accession no. JX972110). In contrast, the amplified fragment from ZKLM1 genomic DNA exhibited only 68.6% sequence similarity with that of SM830, while the similarity for the CDS sequences was as high as 85.63%. A BLAST search in the NCBI database revealed less than 90% similarity to any wheat homologs, suggesting that this fragment likely originated from Th. ponticum rather than wheat. Additionally, no homologous genes were found in other grass species in the NCBI database.
Further analysis using the WheatOmics 1.0 platform revealed no homologous gene for this locus in A. thaliana and only 44.6% similarity to the homologous gene in rice. These findings suggest that the gene is likely unique to Triticeae species. Following the naming conventions used in the Leymus genus, it was designated TaSAIN1-4D. The homologous genes in ZKLM1 and SM830 were named TaSAIN1-4Da and TaSAIN1-4Db, respectively. Two splicing variants of TaSAIN1-4Da were identified and named TaSAIN1-4Da.1 and TaSAIN1-4Da.2 (Figure S10), and these sequences were deposited in the NCBI database (accession nos. PX116521-PX116523). The TaSAIN1-4D gene consists of three exons and two introns. Alignment of TaSAIN1-4Da.1 and TaSAIN1-4Db revealed extensive genetic variation in the first intron and second exon. Specifically, 17 SNPs and 7 InDels were identified in the first intron, with the largest InDel measuring 311 bp and the smallest only 1 bp. In the second exon, 61 SNPs and 5 InDels were detected, resulting in 34 amino acid substitutions and 6 amino acid insertions or deletions. Additionally, one SNP in the first exon and three SNPs in the third exon led to one and three amino acid substitutions, respectively (Figure 5b,c).
The homologous gene sequence of TaSAIN1-4D, named TaSAIN1-4Dc, was extracted from the whole-genome sequencing assembly of cv. CM42 and aligned with TaSAIN1-4Db. The alignment identified 19 SNPs and 3 InDels, with an overall sequence similarity of 80.92%, while that for the CDS was as high as 99.38%. Four SNPs located in exons resulted in amino acid substitutions, while the three InDels, all situated in the first intron, were 3 bp, 11 bp, and 270 bp in length, respectively (Figure S11). These sequence variations, particularly the 270 bp InDel, suggest that the two gene variants may have distinct functions, which could explain the observed differences in LSH between CM42 and SM830.

3.8. Predicted Subcellular Localization of TaSAIN1-4D

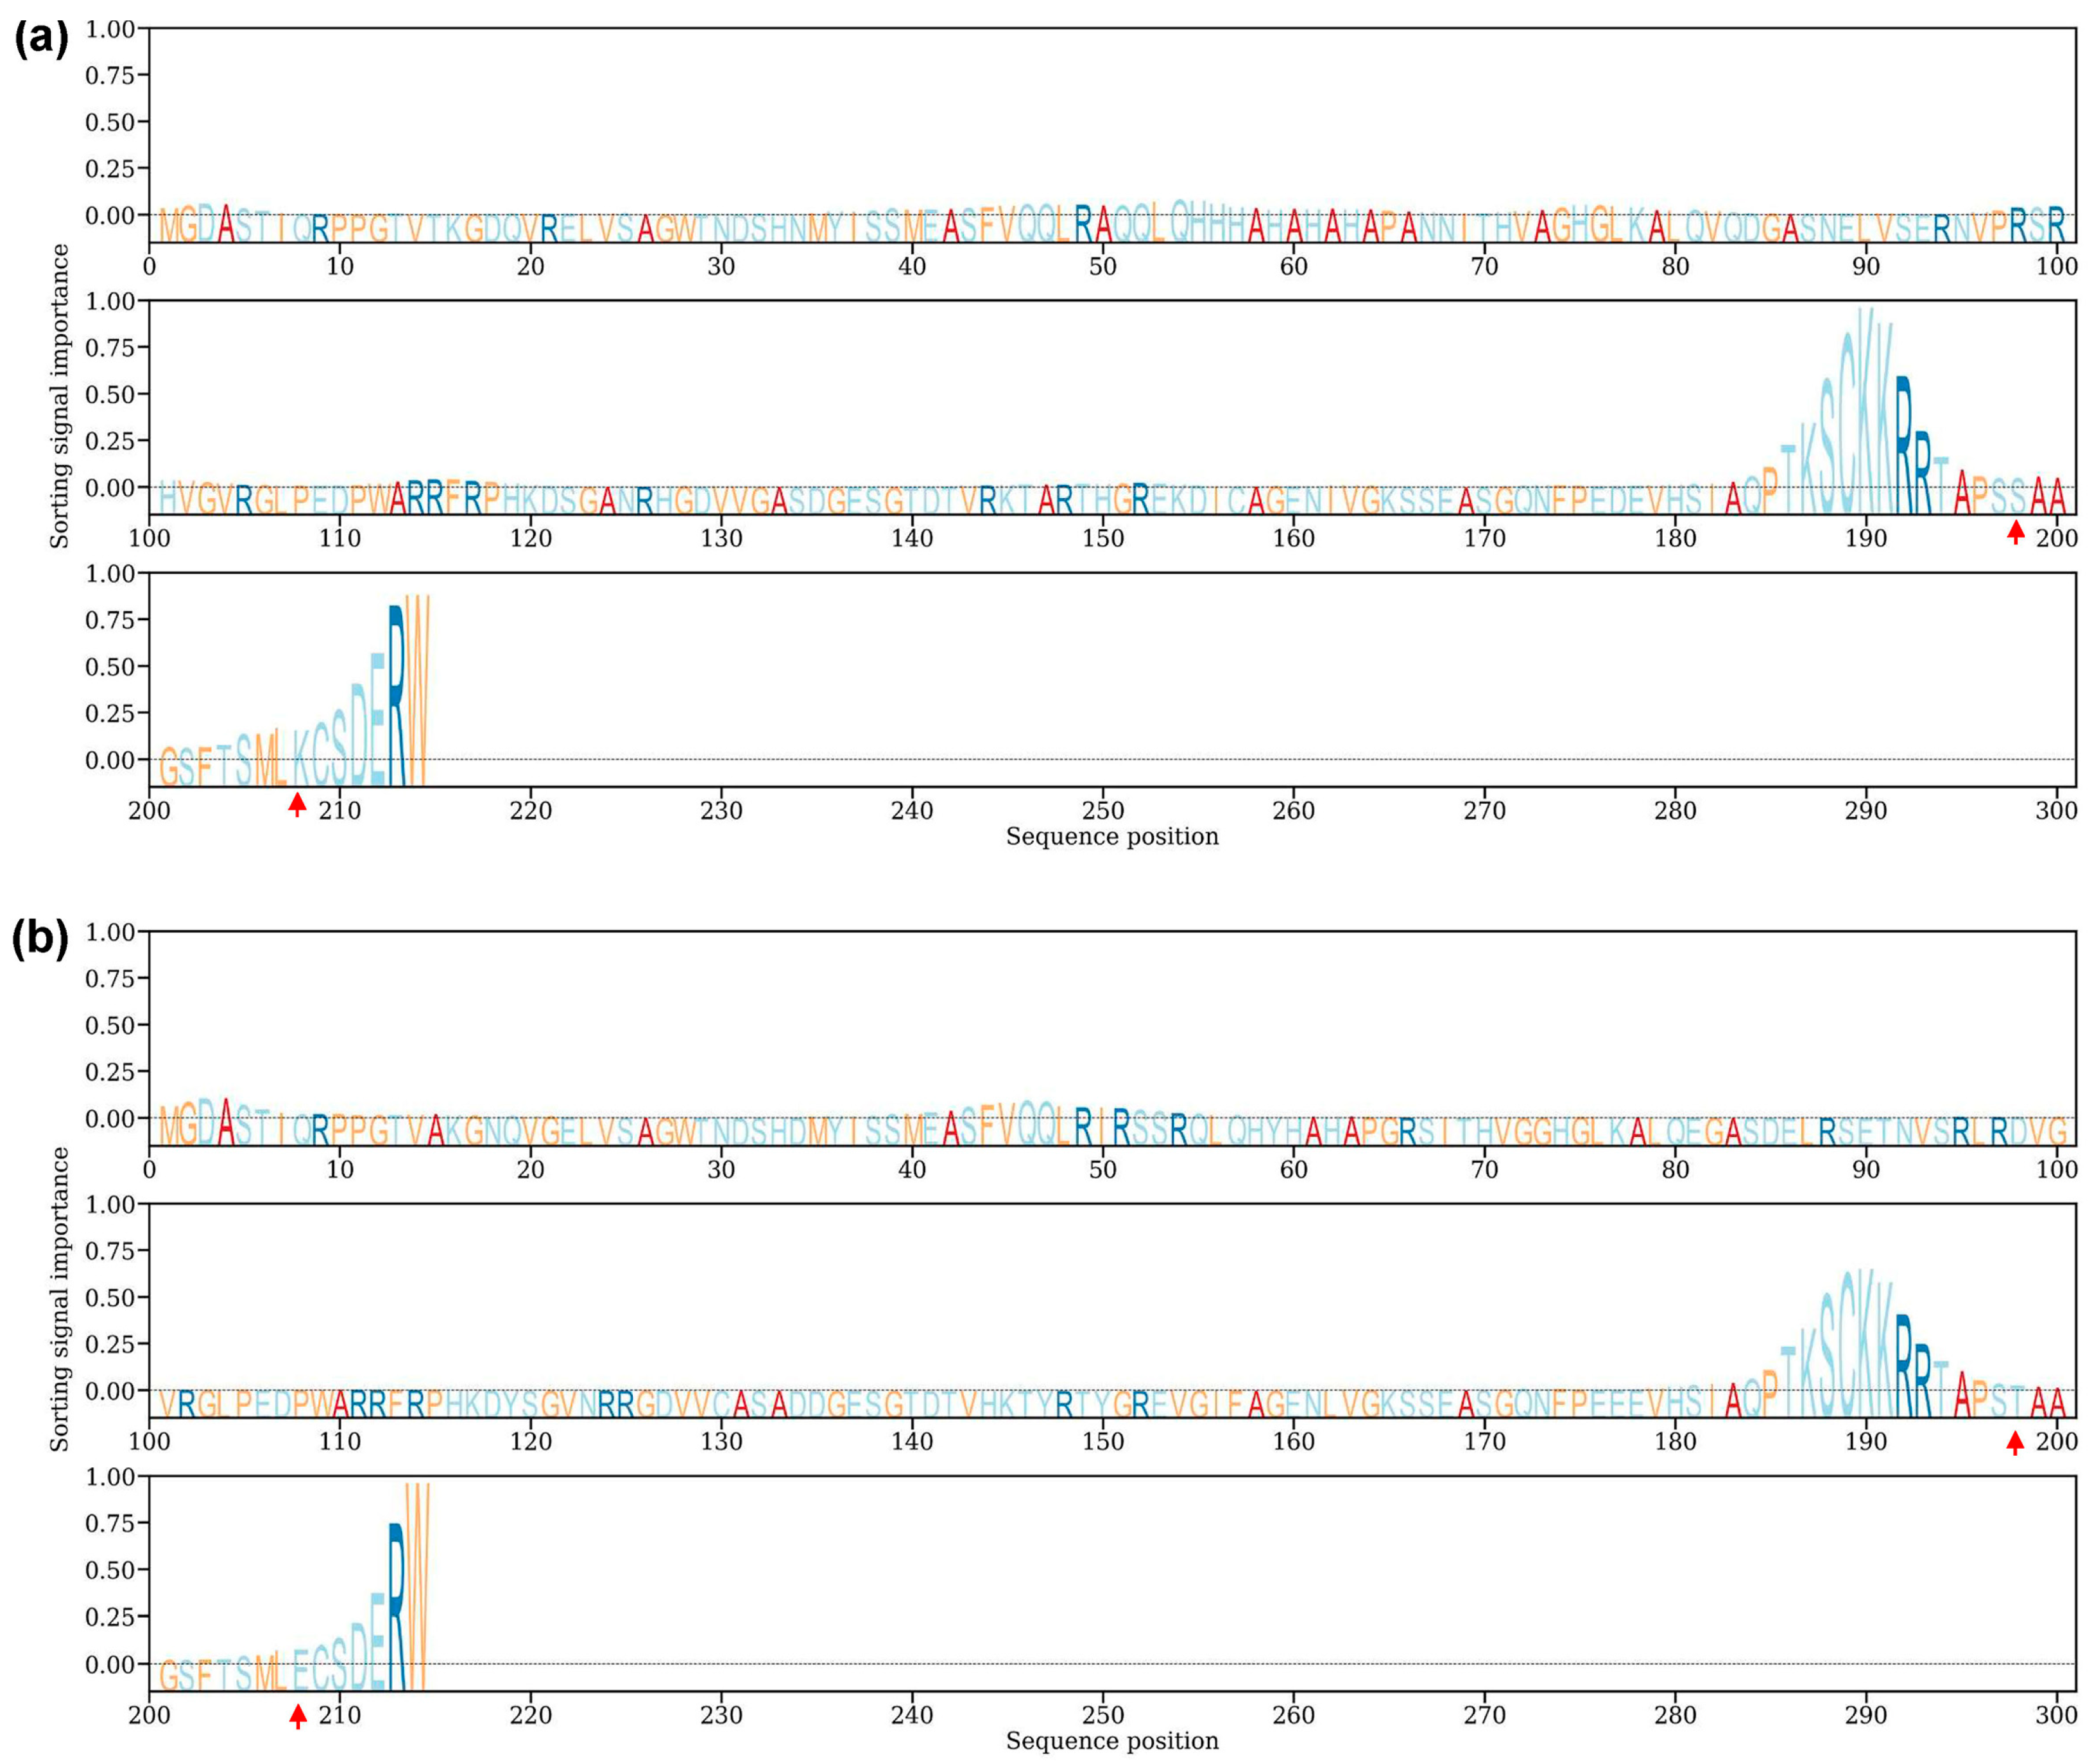
To predict the subcellular localization of the TaSAIN1-4D protein, SignalP v6.0 and DeepLoc v2.1 were used. SignalP analysis indicated the absence of a signal peptide, while DeepLoc predicted that TaSAIN1-4Da.1, TaSAIN1-4Db, and TaSAIN1-4Dc were most likely localized to the nucleus, with high probabilities of 0.9365, 0.8966, and 0.9478, respectively. All three proteins were also predicted to be associated with the soluble fraction, with probabilities of 0.8170, 0.8370, and 0.8630, respectively (Table 4). Sorting signal analysis identified nuclear localization signals in TaSAIN1-4D, supporting its predicted nuclear localization. Notably, the nuclear localization signal was stronger in ZKLM1 and CM42 than in SM830, potentially due to an S198T amino acid substitution in ZKLM1 and an I194T substitution in CM42, both relative to SM830. These substitutions occurred within the same nuclear localization signal peptide fragment (Figure 6 and Figure S12).

3.9. Comparative Analysis of TaSAIN1-4D and Known Trichome-Related Genes/QTLs

A comparative summary of TaSAIN1-4D with other known genes and QTLs involved in trichome development across cereals and model plants revealed substantial diversity in the molecular functions that regulated trichome formation (Table 5). TaSAIN1-4D, identified in wheat (4DL), encoded a salt-inducible nuclear protein unique to the Triticeae family, distinguishing it from other trichome-related genes. For instance, the Hl1 locus in wheat and the Hsh gene in barley were responsible for leaf sheath hairiness, while GL6/Mhl1 in rice and maize regulated trichome density and length. The WOX (Hg) transcription factor on wheat chromosome 1AS also contributed to trichome development. In addition, GL1, GL3, and TTG1 in Arabidopsis formed the MYB–bHLH–WD40 (MBW) complex, a conserved mechanism for trichome initiation.
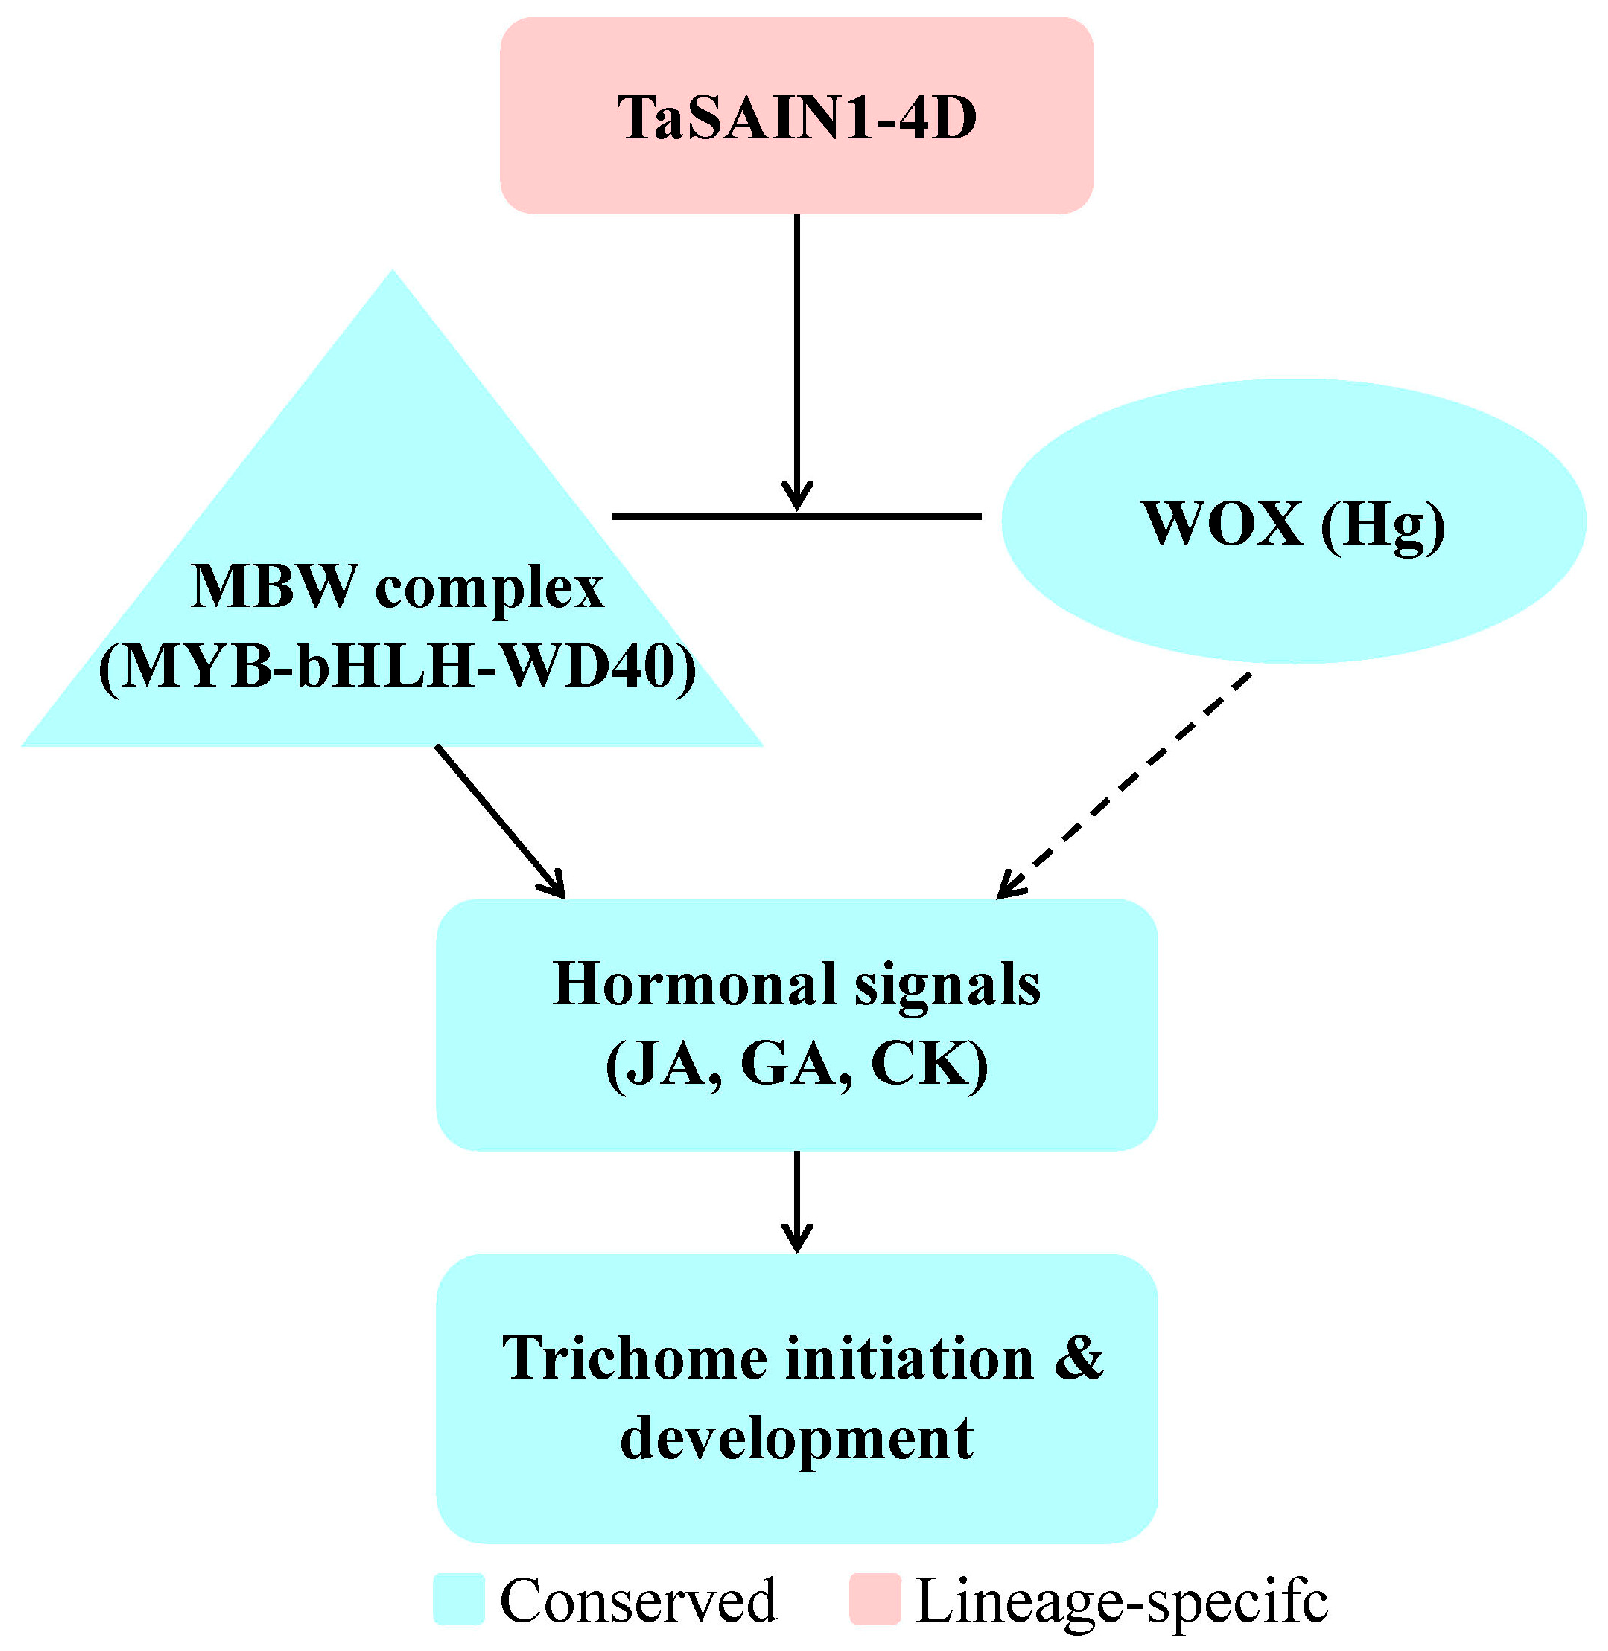
A model of the trichome regulatory network indicated that TaSAIN1-4D interacted with multiple regulatory components, including the MBW complex, the wheat WOX (Hg) homolog, and hormonal signals such as jasmonic acid (JA), gibberellins (GA), and cytokinins (CK), all of which collectively influenced trichome initiation and elongation (Figure 7). Within this framework, TaSAIN1-4D served as a central node that integrated stress cues, such as salt stress, with developmental pathways that govern epidermal differentiation. The proposed interactions positioned TaSAIN1-4D as a regulator of trichome formation with a potential role in stress adaptation.

4. Discussion

4.1. Genetic Basis of Leaf Sheath Hairiness in Wheat

This study successfully identified and fine-mapped a major QTL for LSH trait in wheat, QLsh.cwnu-4D, to a 1.67 Mb interval on chromosome 4DL. This region shares high collinearity with a previously described 530 kb LD block in Ae. tauschii, underscoring the evolutionary conservation of this trait within the Triticeae subfamily [8,15,34]. The complementary BSA-seq algorithms (Euclidean-distance, G′, and Δ(SNP-index)) used in this study provided high-resolution mapping power, comparable to approaches applied in QTL mapping in crops such as rice and maize [35,36]. The identification of this locus in both wheat and its wild relatives suggests that the genetic control of LSH has been conserved across species, making it a valuable model for understanding similar traits in related cereals.

4.2. Comparative Genomics

The QLsh.cwnu-4D interval was refined to 1.67 Mb with KASP marker K-cwnu-4D-502238348, overlapping the 530 kb LD block previously associated with marginal trichome number in Ae. tauschii [15]. This overlap suggests conservation of trichome-regulatory loci within the D genome lineage. The hairy parental line ZKLM1 traces part of its genetic background to Th. ponticum, raising the possibility that QLsh.cwnu-4D represents an introgressed haplotype conferring enhanced trichome development. This interpretation aligns with earlier successes in introgressing alleles such as Hl1th from Th. ponticum into elite wheat backgrounds [16].
Sequence alignment of TaSAIN1-4D revealed the genomic DNA and CDS sequence similarities between SM830 (TaSAIN1-4Db) and ZKLM1 (TaSAIN1-4Da.1) of 68.6% and 85.63%, respectively, while the similarities between SM830 (TaSAIN1-4Db) and CM42 (TaSAIN1-4Dc) for genomic DNA and CDS sequences were higher, at 80.92% and 99.38%, respectively. This divergence also explains why the three candidate genes, namely an unannotated TIR-NBS-LRR gene, TraesCS4D03G0813100, and TraesCS4D03G0809500, located within or upstream of the 530 kb trichome-associated LD block, could not be correctly amplified to the expected target bands (Figures S6, S8 and S9). These observations support the hypothesis that QLsh.cwnu-4D may have been introduced along with the blue grain gene (also located on 4DL) during the wheat–Th. ponticum translocation process.
Similar structural changes associated with agronomic traits like grain hardness and awn length have been documented previously [37,38,39]. In addition, TaSAIN1-4Db exhibited significant haplotypic variation, further refining the candidate region downstream of the 530 kb LD block. The presence of 311 bp and 270 bp insertions in the first intron of TaSAIN1-4Db compared to TaSAIN1-4Da.1 and TaSAIN1-4Dc, respectively, suggests that these insertions may influence its gene function, potentially altering transcriptional regulation and downstream signaling pathways involved in trichome formation.

4.3. Relationship to Stress Tolerance

Among the genes located within the refined candidate region, TraesCS4D03G0814900 (TaSAIN1-4D) emerges as a potential key regulator of LSH. This salt-inducible protein, specific to the Triticeae lineage, shows minimal homology to Arabidopsis proteins and only partial similarity (44.6%) with rice counterparts, highlighting its role in a lineage-specific adaptation [40,41]. The 311 bp and 270 bp insertion identified in TaSAIN1-4Db may alter its function, possibly affecting both trichome development and stress responses.
Previous studies have shown that salt-inducible proteins can interact with transcription factors such as bHLH to influence epidermal differentiation under saline conditions [42]. This is consistent with the idea that TaSAIN1-4D may mediate an alternative regulatory pathway in grasses, distinct from the well-characterized MYB–bHLH–WD40 complex found in Arabidopsis [29,30,31,43].

4.4. Proposed Mechanism

Extensive research in A. thaliana has established a core regulatory network for trichome development. This involves the MYB–bHLH–WD40 transcriptional activator complex, comprising the R2R3 MYB factor GLABRA1 (GL1) [29], the bHLH proteins GLABRA3 (GL3) and ENHANCER OF GLABRA3 (EGL3) [30,43], and the WD40-repeat protein TRANSPARENT TESTA GLABRA1 (TTG1) [31]—which together induce GLABRA2 (GL2), a homeodomain–leucine zipper factor essential for trichome differentiation [44,45]. Negative regulators such as TRIPTYCHON (TRY) and CAPRICE (CPC) fine-tune trichome density and spacing [32,46,47,48]. This well-defined framework provides a valuable reference point for exploring both conserved and divergent aspects of trichome regulation in cereals.
These findings suggest that while homologs of MYB and bHLH proteins may contribute to trichome development in wheat [7,9], an alternative pathway mediated by the stress-responsive gene TaSAIN1-4D is also likely involved. The nuclear localization of TaSAIN1-4D implies a role as a transcriptional co-regulator, potentially modulating genes related to cell-wall remodeling and stress signaling that facilitate trichome outgrowth. Moreover, its potential interactions with MYB or bHLH factors could integrate developmental and environmental cues, thereby regulating trichome initiation under both normal and stress conditions. This dual role, linking trichome development with abiotic stress responses, parallels the function of other wheat transcription factors, such as DREB, which mediate both drought adaptation and trichome density [33,49].
Together, these insights support a proposed mechanism in which wheat trichome development is shaped not only by canonical MYB–bHLH–WD40 complexes but also by lineage-specific, stress-inducible regulators like TaSAIN1-4D. This highlights a potentially unique regulatory architecture in cereals, offering new avenues for functional validation and crop improvement.

4.5. Implications for Wheat Breeding

The co-dominant KASP marker K-cwnu-4D-502238348, which perfectly cosegregates with LSH in 92 F2:3 family lines, provides a powerful tool for marker-assisted selection (MAS) in wheat breeding programs. The inclusion of TaSAIN1-4D alleles in elite wheat germplasm could improve stress resilience, particularly in environments prone to drought and salinity, without negatively affecting yield potential. Previous studies have shown that introgressions of stress-responsive QTL, such as those from Aegilops or Thinopyrum, have successfully enhanced drought tolerance in durum wheat and other crops [50]. Future work will explore the potential for pyramiding TaSAIN1-4D with other trichome-modulating QTL to further optimize pubescence traits for specific environmental conditions.

4.6. Future Directions

To validate the function of TaSAIN1-4D, transgenic overexpression and CRISPR/Cas9-mediated knockouts in wheat backgrounds such as CM42 and ZKLM1 will be necessary. These approaches will provide direct evidence of the role of TaSAIN1-4D in trichome formation and stress tolerance. Additionally, transcriptomic and chromatin-immunoprecipitation (ChIP) analyses will help identify downstream target genes and potential interacting partners. Investigating natural allelic variation in TaSAIN1-4D across global wheat panels may reveal superior haplotypes with enhanced stress tolerance. Integrating high-resolution phenotyping platforms will also enable precise quantification of trichome density and its associated physiological effects under field conditions, further advancing our understanding of the role of leaf pubescence in stress adaptation.

5. Conclusions

This study successfully identified and fine-mapped a major QTL, QLsh.cwnu-4D, associated with LSH in wheat, providing valuable insights into the genetic basis of this adaptive trait. The refined QLsh.cwnu-4D region on 4DL overlaps with a trichome-associated LD block in Ae. tauschii, suggesting evolutionary conservation of trichome-regulatory genes within the Triticeae subfamily. The gene TaSAIN1-4D, identified within this region, is a salt-inducible protein gene potentially involved in both trichome formation and stress response. Structural variations within TaSAIN1-4D, including significant insertions, may influence gene function and contribute to trait differentiation. These findings offer a deeper understanding of the genetic mechanisms regulating leaf pubescence and provide a foundation for developing wheat varieties with improved stress resilience. The co-dominant KASP marker K-cwnu-4D-502238348 offers a promising tool for marker-assisted selection in wheat breeding programs, enabling the introgression of stress-resilient traits into elite cultivars. Future research will focus on validating the functional role of TaSAIN1-4D through gene editing and exploring its potential in breeding strategies to optimize stress tolerance and pubescence traits for diverse environmental conditions.

Supplementary Materials

The following supporting information can be downloaded at: https://www.mdpi.com/article/10.3390/genes16091117/s1, Figure S1: Phenotypic analysis of the leaf auricle. (a) SM830; (b) SM2262; (c) ZKLM1; (d) F1 hybrid of the SM830/ZKLM1 cross; (e) and (f) leaf auricle phenotypes in the SM830/ZKLM1 F2 population; (g) F1 hybrid of the SM2262/ZKLM1 cross; (h) and (i) leaf auricle phenotypes in the SM2262/ZKLM1 F2 population. The red arrow indicates auricle hairiness; Figure S2: Phenotypic analysis of the leaf blade. (a) SM830; (b) SM2262; (c) ZKLM1; (d) F1 hybrid of the SM830/ZKLM1 cross; (e) and (f) leaf blade phenotypes in the F2 population of the SM830/ZKLM1 cross; (g) F1 hybrid of the SM2262/ZKLM1 cross; (h) and (i) leaf blade phenotypes in the F2 population of the SM2262/ZKLM1 cross; Figure S3: QTL mapping of the LSH trait in SM2262/ZKLM1 bulks using Euclidean distance (ED)- and G′-based metrics. (a) Manhattan plot of unfitted ED4 and locally fitted ED4 values across the 21 wheat chromosomes, highlighting peaks corresponding to trait-associated loci. (b) Genome-wide G′ profile showing smoothed allele frequency divergence between bulks. (c) A magnified view of the G′ profile for the distal region of chromosome 4D. G′ statistics were computed from SNP-wise G values using a sliding window smoothing method. Significance thresholds (G′ ≥ 4.263; n = 84) were assessed using empirical permutation testing and indicated using green dotted line; Figure S4: Δ(SNP-index)–based QTL analysis of the LSH trait in mixed SM2262/ZKLM1 bulks. (a) Genome-wide Δ(SNP-index) profile across all 21 wheat chromosomes. (b) An enlarged view of the distal region of chromosome 4D highlights a major QTL peak. The blue line denotes Δ(SNP-index); green and yellow lines represent the 95% and 99% confidence intervals (CI), respectively. CI (n = 84) were determined via simulation-based null distribution modeling. Significant Δ(SNP-index) peaks exceeding the 95% or 99% CI indicate potential QTLs. The red dotted line marks the genomic interval most strongly associated with LSH; Figure S5: JBrowse visualization of the genomic interval between TraesCS4D03G0811800 and TraesCS4D03G0812100 in three reference assemblies. (a) T. aestivum ‘Chinese Spring’ v2.1, (b) T. aestivum ‘Chuanmai 42’, and (c) Ae. tauschii cv. AL8/78 Aet5.0; Figure S6: PCR amplification of the genomic and CDS sequences of the unannotated gene encoding a disease-resistant protein. M, molecular size marker; Figure S7: JBrowse visualization of the allele structure of TraesCS4D03G0813100 in three reference assemblies. (a) T. aestivum ‘Chinese Spring’ v2.1, (b) T. aestivum ‘Chuanmai 42’, and (c) T. aestivum ‘Chinese Spring’ CS-IAAS T2T; Figure S8: PCR amplification of the genomic and CDS sequences of TraesCS4D03G0813100. M, molecular size marker; Figure S9: PCR amplification of the genomic and CDS sequences of TraesCS4D03G0809500 encoding a 12-oxophytodienoate reductase-like protein. M, molecular size marker. The white arrowheads indicate the target PCR bands; Figure S10: Alignment of two splicing variants of TaSAIN1-4Da; Figure S11: Alignments of TaSAIN1-4D between CM42 and SM830. (a) Nucleotide sequence alignments of TaSAIN1-4D. (b) Amino acid sequence alignments of TaSAIN1-4D. Ellipses represent the omission of the consensus sequence; Figure S12: Sorting signal importance of TaSAIN1-4D protein. (a) Sorting signal analysis of the TaSAIN1-4Dc protein. (b) Sorting signal analysis of the TaSAIN1-4Db protein. Red arrowheads highlight the acid substitution within the nuclear localization signal peptide fragment; Table S1: Primers used in this study; Table S2: High-confidence candidate genes within the QLsh.cwnu-4D interval (RefSeq v2.1); Table S3: High-confidence candidate genes within the 530-kb LD block of the Chuanmai 42 genome.

Author Contributions

Conceptualization, X.H.; methodology, L.W.; software, X.H.; validation, L.W., Y.L. and J.H. (Jinbai He); formal analysis, J.H. (Jundong He); investigation, S.S. and J.H. (Jundong He); resources, X.H.; data curation, S.S.; writing—original draft preparation, L.W.; writing—review and editing, L.W., J.H. (Jundong He), S.S. and X.H.; visualization, X.H.; supervision, X.H.; project administration, X.H.; funding acquisition, X.H. All authors have read and agreed to the published version of the manuscript.

Funding

This research was funded by “the Key Research and Development Program of Science and Technology Department of Sichuan Province, grant number 2021YFS0342” and “the basic scientific research expenses of China West Normal University, grant number 18Q053 and 20A018”.

Institutional Review Board Statement

Not applicable.

Data Availability Statement

The original contributions presented in this study are included in the article. Further inquiries can be directed toward the corresponding authors.

Acknowledgments

Thank the “Key Laboratory of Southwest China Wildlife Resources Conservation, China West Normal University, Ministry of Education” for providing experimental equipment support.

Conflicts of Interest

The authors declare no conflicts of interest.

Abbreviations

The following abbreviations are used in this manuscript:
BSA-seqBulk segregant analysis sequencing
QTLQuantitative trait locus
GWASGenome wide association study
EDEuclidean distance
KASPKompetitive Allele Specific PCR
MASMarker-assisted selection
SNPSingle nucleotide polymorphism
InDelInsertion and Deletion
CDScoding sequence
cDNAcomplementary DNA
LD blocklinkage disequilibrium block
RILsRecombinant inbred lines

References

  1. Vavilov, N.I. Scientific Foundations of Wheat Breeding; Selkhozgiz Publishers: Moscow, Russia, 1935; pp. 70–87. (In Russian) [Google Scholar]
  2. Kaur, J.; Kariyat, R. Role of trichomes in plant stress biology. In Evolutionary Ecology of Plant-Herbivore Interaction; Núñez-Farfán, J., Valverde, P., Eds.; Springer: Berlin/Heidelberg, Germany, 2020; pp. 15–35. [Google Scholar] [CrossRef]
  3. Duffey, S.S. Plant glandular trichomes: Their role in partial defense against insects. In Insects and the Plant Surface; Southwood, S.R., Juniper, B.E., Eds.; Edward Arnold Publishers: London, UK, 1986; pp. 151–172. [Google Scholar]
  4. Pshenichnikova, T.A.; Doroshkov, A.V.; Osipova, S.V.; Permyakov, A.V.; Permyakova, M.D.; Efimov, V.M.; Afonnikov, D.A. Quantitative characteristics of pubescence in wheat (Triticum aestivum L.) are associated with photosynthetic parameters under conditions of normal and limited water supply. Planta 2019, 249, 839–847. [Google Scholar] [CrossRef]
  5. Osipova, S.V.; Rudikvskii, A.V.; Permyakov, A.V.; Rudikovskaya, E.G.; Permyakova, M.D.; Verkhoturov, V.V.; Pshenichnikova, T.A. Physiological responses to water deficiency in bread wheat (Triticum aestivum L.) lines with genetically different leaf pubescence. Vavilov J. Genet. Breed. 2020, 24, 813–820. [Google Scholar] [CrossRef]
  6. Maistrenko, O.I. Identification and localization of genes controlling the pubescence of the leaf of young soft wheat plants. Genetika 1976, 12, 5–15. (In Russian) [Google Scholar]
  7. Dobrovolskaya, O.B.; Pshenichnikova, T.A.; Arbuzova, V.S.; Lohwasser, U.; Röder, M.S.; Börner, A. Molecular mapping of genes determining hairy leaf character in common wheat with respect to other species of the Triticeae. Euphytica 2007, 155, 285–293. [Google Scholar] [CrossRef]
  8. Wan, H.; Yang, Y.; Li, J.; Zhang, Z.; Yang, W. Mapping a major QTL for hairy leaf sheath introgressed from Aegilops tauschii and its association with enhanced grain yield in bread wheat. Euphytica 2015, 205, 275–285. [Google Scholar] [CrossRef]
  9. Shvachko, N.A.; Semilet, T.V.; Tikhonova, N.G. Trichomes in higher plants: Homological series in hereditary variability and molecular genetic mechanisms. Russ. J. Genet. 2020, 56, 1359–1370. [Google Scholar] [CrossRef]
  10. Saade, S.; Kutlu, B.; Draba, V.; Förster, K.; Schumann, E.; Tester, M.; Pillen, K.; Maurer, A. A donor-specific QTL, exhibiting allelic variation for leaf sheath hairiness in a nested association mapping population, is located on barley chromosome 4H. PLoS ONE 2017, 12, e0189446. [Google Scholar] [CrossRef]
  11. Korzun, V.; Malyshev, S.; Pickering, R.A.; Börner, A. RFLP mapping of a gene for hairy leaf sheath using a recombinant line from Hordeum vulgare L. × Hordeum bulbosum L. cross. Genome 1999, 42, 960–963. [Google Scholar] [CrossRef]
  12. Devos, K.M.; Atkinson, M.D.; Chinoy, C.N.; Francis, H.A.; Harcourt, R.L.; Koebner, R.M.D.; Liu, C.J.; Masojć, P.; Xie, D.X.; Gale, M.D. Chromosomal rearrangements in the rye genome relative to that of wheat. Theor. Appl. Genet. 1993, 85, 673–680. [Google Scholar] [CrossRef]
  13. Morihiro, H.; Takumi, S. Natural variation of trichome density on leaf in wild wheat Aegilops tauschii Coss. Wheat Inf. Serv. 2010, 109, 2010. [Google Scholar]
  14. Nishijima, R.; Okamoto, Y.; Hatano, H.; Takumi, S. Quantitative trait locus analysis for spikelet shape-related traits in wild wheat progenitor Aegilops tauschii: Implications for intraspecific diversification and subspecies differentiation. PLoS ONE 2017, 12, e0173210. [Google Scholar] [CrossRef]
  15. Gaurav, K.; Arora, S.; Silva, P.; Sánchez-Martín, J.; Horsnell, R.; Gao, L.; Brar, G.S.; Widrig, V.; Raupp, W.J.; Singh, N.; et al. Population genomic analysis of Aegilops tauschii identifies targets for bread wheat improvement. Nat. Biotechnol. 2022, 40, 422–431. [Google Scholar] [CrossRef]
  16. Simonov, A.V.; Gordeeva, E.I.; Genaev, M.A.; Li, W.; Bulatov, I.O.; Pshenichnikova, T.A. A new leaf pubescence gene, Hl1th, introgressed into bread wheat from Thinopyrum ponticum and its phenotypic manifestation under homoeologous chromosomal substitutions. Vavilov J. Genet. Breed. 2024, 28, 602–609. [Google Scholar] [CrossRef]
  17. Chen, S.; Zhou, Y.; Chen, Y.; Gu, J. fastp: An ultra-fast all-in-one FASTQ preprocessor. Bioinformatics 2018, 34, i884–i890. [Google Scholar] [CrossRef]
  18. Zhu, T.; Wang, L.; Rimbert, H.; Rodriguez, J.C.; Deal, K.R.; De Oliveira, R.; Choulet, F.; Keeble-Gagnère, G.; Tibbits, J.; Rogers, J.; et al. Optical maps refine the bread wheat Triticum aestivum cv. Chinese Spring genome assembly. Plant J. 2021, 107, 303–314. [Google Scholar] [CrossRef]
  19. Li, H. Aligning sequence reads, clone sequences and assembly contigs with BWA-MEM. Genomics 2013, 1303, 3997. [Google Scholar] [CrossRef]
  20. McKenna, A.; Hanna, M.; Banks, E.; Sivachenko, A.; Cibulskis, K.; Kernytsky, A.; Garimella, K.; Altshuler, D.; Gabriel, S.; Daly, M.; et al. The Genome Analysis Toolkit: A MapReduce framework for analyzing next-generation DNA sequencing data. Genome Res. 2010, 20, 1297–1303. [Google Scholar] [CrossRef]
  21. Cingolani, P.; Platts, A.; Wang, L.L.; Coon, M.; Nguyen, T.; Wang, L.; Land, S.J.; Lu, X.; Ruden, D.M. A program for annotating and predicting the effects of single nucleotide polymorphisms. SnpEff: SNPs in the genome of Drosophila melanogaster strain w1118; iso-2; iso-3. Fly 2012, 6, 80–92. [Google Scholar] [CrossRef]
  22. Hill, J.T.; Demarest, B.L.; Bisgrove, B.W.; Gorsi, B.; Su, Y.C.; Yost, H.J. MMAPPR: Mutation mapping analysis pipeline for pooled RNA-seq. Genome Res. 2013, 23, 687–697. [Google Scholar] [CrossRef]
  23. Magwene, P.M.; Willis, J.H.; Kelly, J.K. The statistics of bulk segregant analysis using next generation sequencing. PLoS Comput. Biol. 2011, 7, e1002255. [Google Scholar] [CrossRef]
  24. Takagi, H.; Abe, A.; Yoshida, K.; Kosugi, S.; Natsume, S.; Mitsuoka, C.; Uemura, A.; Utsushi, H.; Tamiru, M.; Takuno, S.; et al. QTL-seq: Rapid mapping of quantitative trait loci in rice by whole genome resequencing of DNA from two bulked populations. Plant J. 2013, 74, 174–183. [Google Scholar] [CrossRef]
  25. Mansfeld, B.N.; Grumet, R. QTLseqr: An R package for bulk segregant analysis with next-generation sequencing. Plant Genome 2018, 11, 180006. [Google Scholar] [CrossRef]
  26. Liu, Q.; Xuan, Q.; Lan, Y.; Xie, X.; Chen, B.; You, J.; Su, L.; Lohani, M.N.; Wu, L.; Hu, X.; et al. Genetic identification and characterization of a novel locus for wheat kernel length. J. Integr. Agric. 2024; in press. [Google Scholar] [CrossRef]
  27. Hu, X.K.; Dai, S.F.; Ouellet, T.; Balcerzak, M.; Rocheleau, H.; Khanizadeh, S.; Pu, Z.J.; Yan, Z.H. Characterization of novel D-hordeins from Psathyrostachys juncea. Biol. Plant. 2018, 62, 369–378. [Google Scholar] [CrossRef]
  28. Liu, S.; Li, K.; Dai, X.; Qin, G.; Lu, D.; Gao, Z.; Li, X.; Song, B.; Bian, J.; Ren, D.; et al. A telomere-to-telomere genome assembly coupled with multi-omic data provides insights into the evolution of hexaploid bread wheat. Nat. Genet. 2025, 57, 1008–1020. [Google Scholar] [CrossRef]
  29. Oppenheimer, D.G.; Herman, P.L.; Sivakumaran, S.; Esch, J.; Marks, M.D. A myb gene required for leaf trichome differentiation in Arabidopsis is expressed in stipules. Cell 1991, 67, 483–493. [Google Scholar] [CrossRef]
  30. Zhang, F.; Gonzalez, A.; Zhao, M.; Payne, C.T.; Lloyd, A. A network of redundant bHLH proteins functions in all TTG1-dependent pathways of Arabidopsis. Development 2003, 130, 4859–4869. [Google Scholar] [CrossRef]
  31. Walker, A.R.; Davison, P.A.; Bolognesi-Winfield, A.C.; James, C.M.; Srinivasan, N.; Blundell, T.L.; Esch, J.J.; Marks, M.D.; Gray, J.C. The TRANSPARENT TESTA GLABRA1 locus, which regulates trichome differentiation and anthocyanin biosynthesis in Arabidopsis, encodes a WD40 repeat protein. Plant Cell 1999, 11, 1337–1350. [Google Scholar] [CrossRef]
  32. Schellmann, S.; Schnittger, A.; Kirik, V.; Wada, T.; Okada, K.; Beermann, A.; Thumfahrt, J.; Jürgens, G.; Hülskamp, M. TRIPTYCHON and CAPRICE mediate lateral inhibition during trichome and root hair patterning in Arabidopsis. EMBO J. 2002, 21, 5036–5046. [Google Scholar] [CrossRef]
  33. Morran, S.; Eini, O.; Pyvovarenko, T.; Parent, B.; Singh, R.; Ismagul, A.; Eliby, S.; Shirley, N.; Langridge, P.; Lopato, S. Improvement of stress tolerance of wheat and barley by modulation of expression of DREB/CBF factors. Plant Biotechnol. J. 2011, 9, 230–249. [Google Scholar] [CrossRef]
  34. Pshenichnikova, T.A.; Doroshkov, A.V.; Simonov, A.V.; Afonnikov, D.A.; Börner, A. Diversity of leaf pubescence in bread wheat and relative species. Genet. Resour. Crop Evol. 2017, 64, 1761–1773. [Google Scholar] [CrossRef]
  35. Zheng, Y.; Khine, E.; Thi, K.; Nyein, E.; Huang, L.; Lin, L.; Xie, X.; Lin, M.H.W.; Oo, K.T.; Moe, M.M.; et al. Multi-environment BSA-seq using large F3 populations is able to achieve reliable QTL mapping with high power and resolution: An experimental demonstration in rice. Crop J. 2024, 12, 549–557. [Google Scholar] [CrossRef]
  36. Du, H.; Zhu, J.; Su, H.; Huang, M.; Wang, H.; Ding, S. Bulked segregant RNA-seq reveals differential expression and SNPs of candidate genes associated with waterlogging tolerance in maize. Front. Plant Sci. 2017, 8, 1022. [Google Scholar] [CrossRef]
  37. Zhao, J.; Xingwei, Z.; Ling, Q.; Chenkang, Y.; Bangbang, W.; Ziming, H.; Yuqing, T.; Li, G.; Yang, Z.; Zheng, J.; et al. Genome wide association study reveals structural chromosome variations (SCVs) with phenotypic effects in wheat (Triticum aestivum L.). Plant J. 2022, 112, 1447–1461. [Google Scholar] [CrossRef]
  38. Li, W.; Huang, L.; Gill, B. Recurrent deletions of puroindoline genes at the grain hardness locus in four independent lineages of polyploid wheat. Plant Physiol. 2007, 146, 200–212. [Google Scholar] [CrossRef]
  39. Zhang, S.; Zhao, J.; Zhang, H.; Fu, D.; Qiao, L.; Wu, B.; Li, X.; Hao, Y.; Zheng, X.; Liang, Z.; et al. Structural chromosome variations from Jinmai 47 and Jinmai 84 affected agronomic traits and drought tolerance of wheat. J. Integr. Agric. 2024; in press. [Google Scholar] [CrossRef]
  40. Wang, Y.; Liu, S.; Lin, T.; Kan, S.; Yu, P. The DUF506 gene family in Triticum aestivum: Genome-wide identification and expression profiling under salt stress. Agronomy 2025, 15, 281. [Google Scholar] [CrossRef]
  41. Ma, J.; Wang, R.; Zhao, H.; Li, L.; Zeng, F.; Wang, Y.; Chen, M.; Chang, J.; He, G.; Yang, G.; et al. Genome-wide characterization of the VQ genes in Triticeae and their functionalization driven by polyploidization and gene duplication events in wheat. Int. J. Biol. Macromol. 2023, 243, 125264. [Google Scholar] [CrossRef]
  42. Zahaf, O.; Blanchet, S.; De Zélicourt, A.; Alunni, B.; Plet, J.; Laffont, C.; De Lorenzo, L.; Imbeaud, S.; Ichanté, J.; Diet, A.; et al. Comparative transcriptomic analysis of salt adaptation in roots of contrasting Medicago truncatula genotypes. Mol. Plant 2012, 5, 1068–1081. [Google Scholar] [CrossRef]
  43. Payne, C.T.; Zhang, F.; Lloyd, A.M. GL3 encodes a bHLH protein that regulates trichome development in Arabidopsis through interaction with GL1 and TTG1. Genetics 2000, 156, 1349–1362. [Google Scholar] [CrossRef]
  44. Masucci, J.D.; Rerie, W.G.; Foreman, D.R.; Zhang, M.; Galway, M.E.; Marks, M.D.; Schiefelbein, J.W. The homeobox gene GLABRA2 is required for position-dependent cell differentiation in the root epidermis of Arabidopsis thaliana. Development 1996, 122, 1253–1260. [Google Scholar] [CrossRef]
  45. Wang, S.; Chen, J.G. Arabidopsis transient expression analysis reveals that activation of GLABRA2 may require concurrent binding of GLABRA1 and GLABRA3 to the promoter of GLABRA2. Plant Cell Physiol. 2008, 49, 1792–1804. [Google Scholar] [CrossRef]
  46. Wada, T.; Kurata, T.; Tominaga, R.; Koshino-Kimura, Y.; Tachibana, T.; Goto, K.; Marks, M.D.; Shimura, Y.; Okada, K. Role of a positive regulator of root hair development, CAPRICE, in Arabidopsis root epidermal cell differentiation. Development 2002, 129, 5409–5419. [Google Scholar] [CrossRef] [PubMed]
  47. Larkin, J.C.; Oppenheimer, D.G.; Lloyd, A.M.; Paparozzi, E.T.; Marks, M.D. Roles of the GLABROUS1 and TRANSPARENT TESTA GLABRA genes in Arabidopsis trichome development. Plant Cell 1994, 6, 1065–1076. [Google Scholar] [CrossRef] [PubMed]
  48. Marks, M.D. Molecular genetic analysis of trichome development in Arabidopsis. Annu. Rev. Plant Physiol. Plant Mol. Biol. 1997, 48, 137–163. [Google Scholar] [CrossRef] [PubMed]
  49. Mei, F.; Chen, B.; Du, L.; Li, S.; Zhu, D.; Chen, N.; Zhang, Y.; Li, F.; Wang, Z.; Cheng, X.; et al. A gain-of-function allele of a DREB transcription factor gene ameliorates drought tolerance in wheat. Plant Cell 2022, 34, 4472–4494. [Google Scholar] [CrossRef]
  50. Merchuk-Ovnat, L.; Barak, V.; Fahima, T.; Ordon, F.; Lidzbarsky, G.; Krugman, T.; Saranga, Y. Ancestral QTL alleles from wild emmer wheat improve drought resistance and productivity in modern wheat cultivars. Front. Plant Sci. 2016, 7, 452. [Google Scholar] [CrossRef]
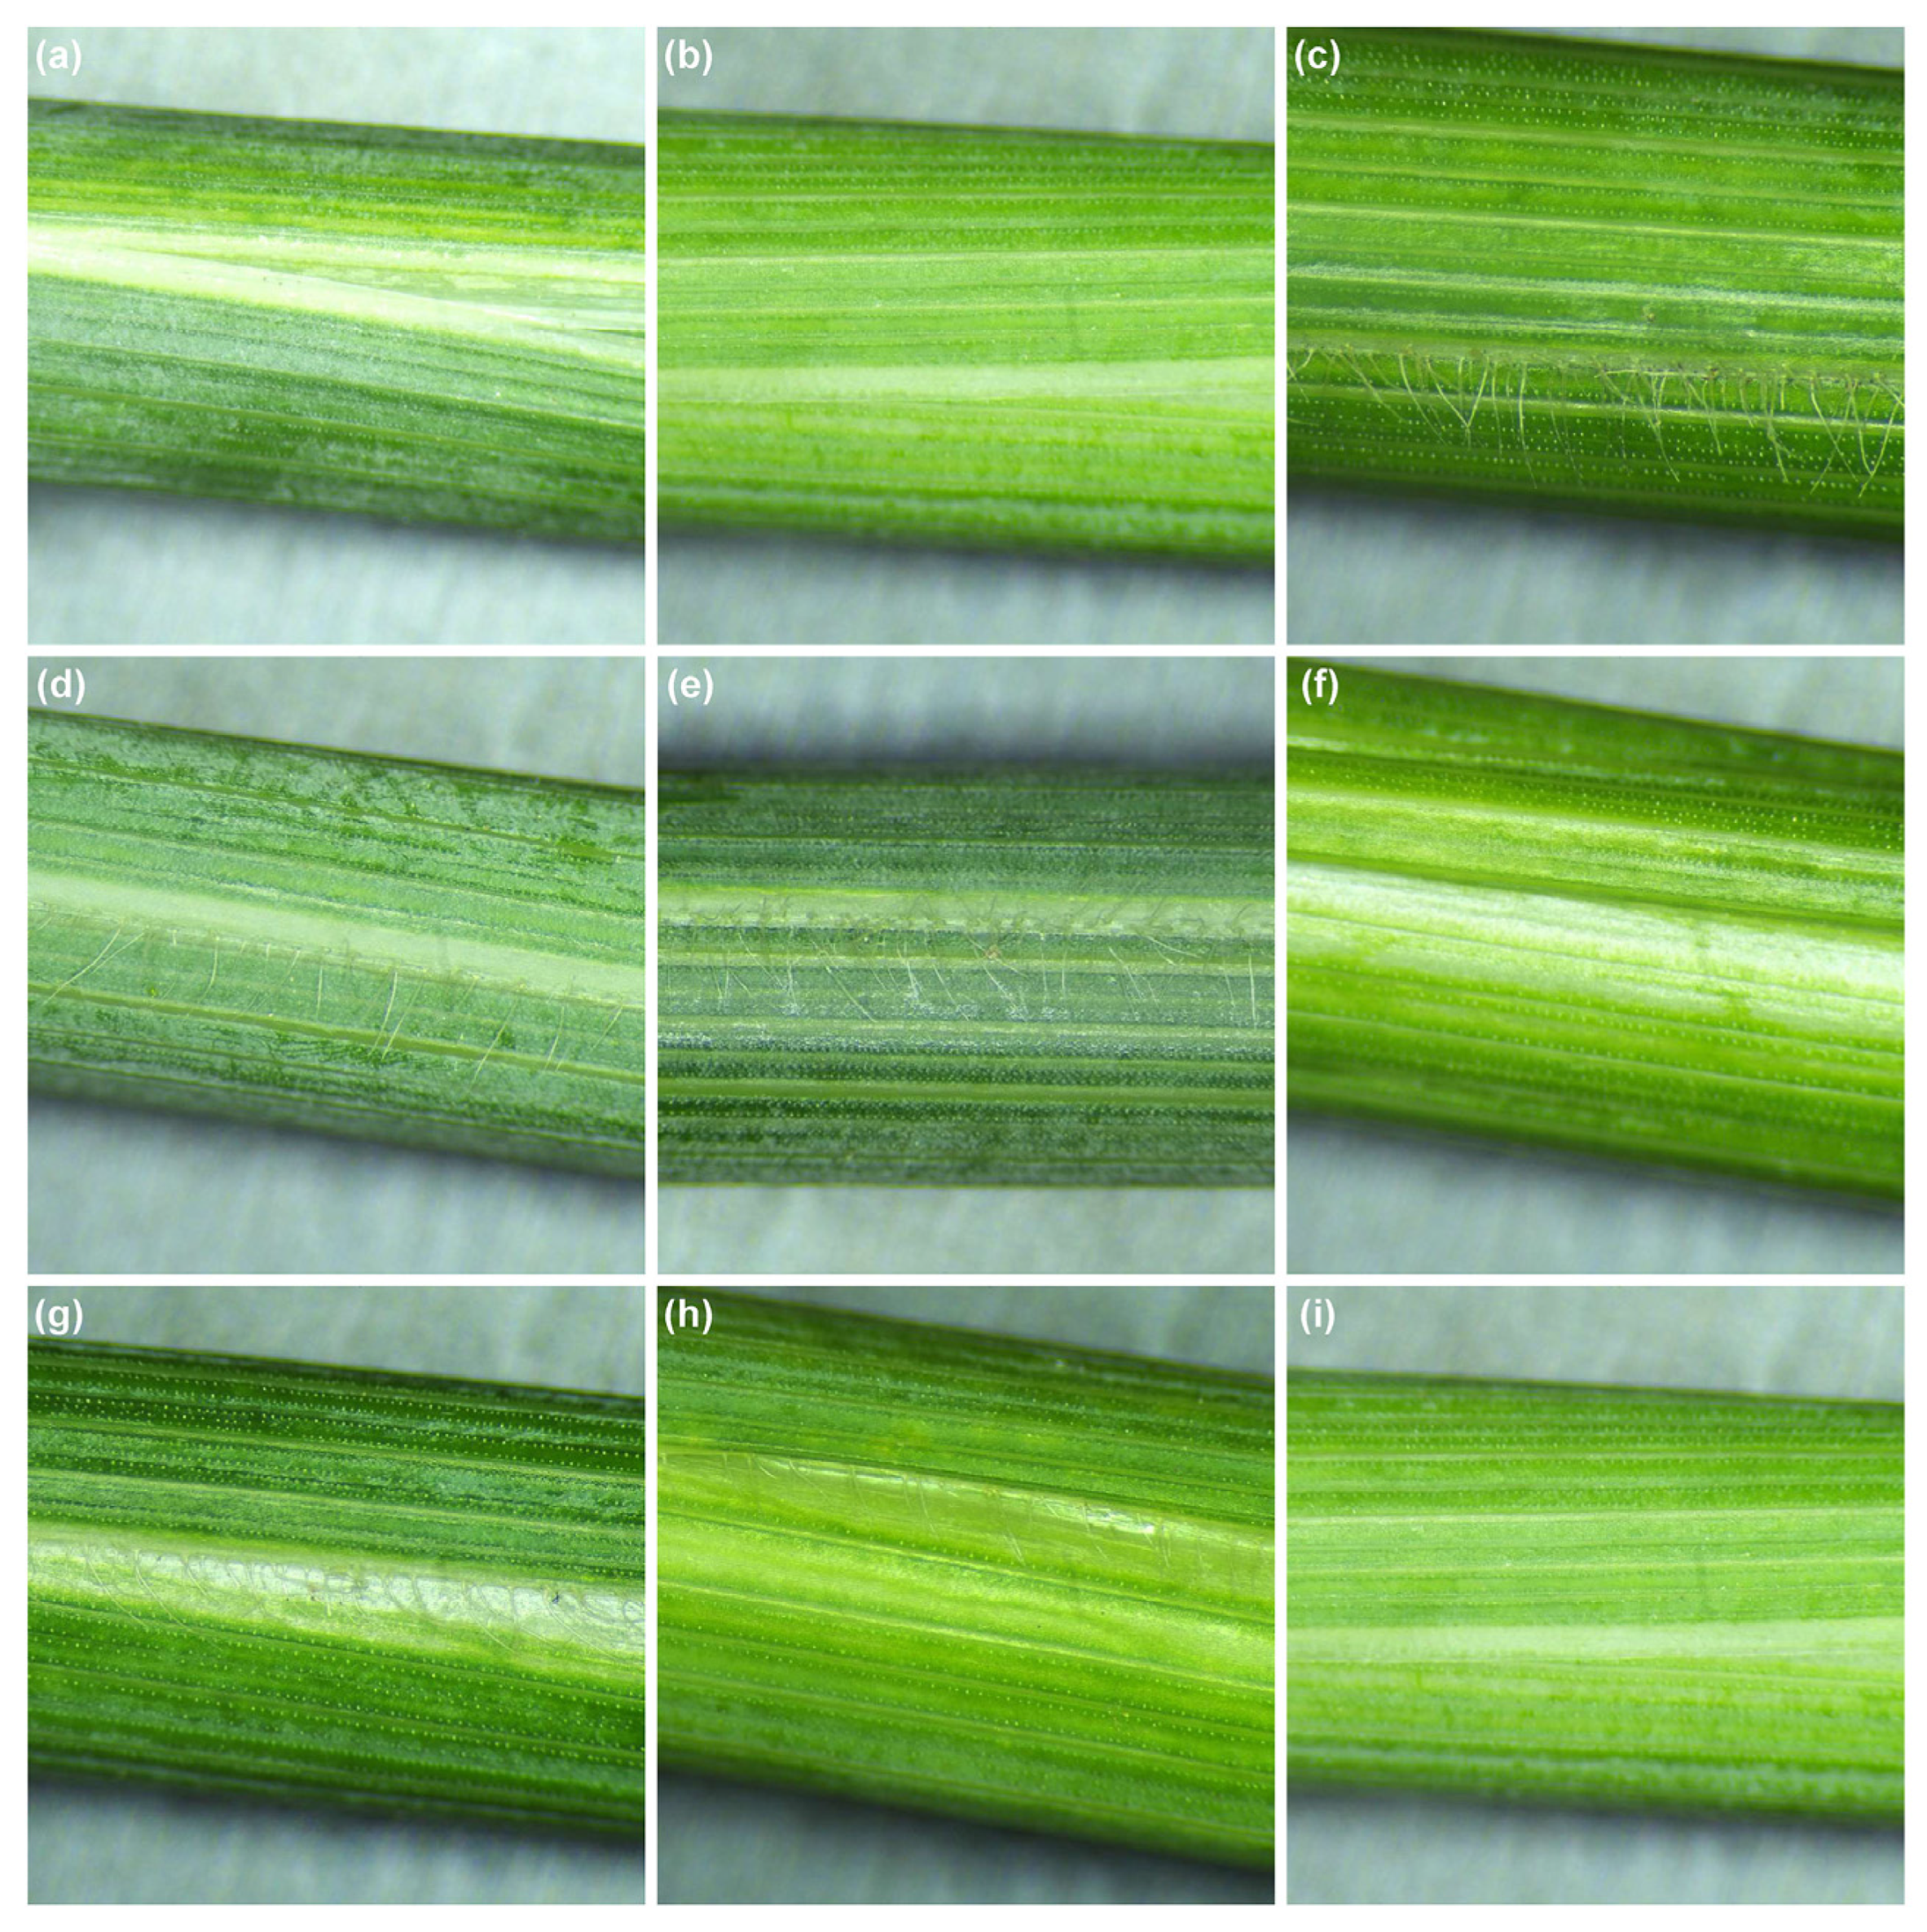
Figure 1. Phenotypic of the leaf sheath. (a) SM830; (b) SM2262; (c) ZKLM1; (d) F1 hybrid of the SM830/ZKLM1 cross; (e, f) LSH phenotypes in the SM830/ZKLM1 F2 population; (g) F1 hybrid of the SM2262/ZKLM1 cross; (h, i) LSH phenotypes in the SM2262/ZKLM1 F2 population.
Genes 16 01117 g001
Figure 2. QTL mapping of the LSH trait in SM830/ZKLM1 bulks using Euclidean distance (ED)- and G′-based metrics. (a) Manhattan plot of unfitted ED4 and locally fitted ED4 values across all 21 wheat chromosomes, highlighting peaks corresponding to trait-associated loci. (b) Genome-wide G′ profile showing smoothed allele frequency divergence between bulks. (c) An enlarged view of the G′ profile for the distal region of chromosome 4D. G′ statistics were computed from SNP-wise G values using a sliding window smoothing method. Significance thresholds (G′ ≥ 9.714; n = 107) were assessed using empirical permutation testing and indicated using green dotted line.
Genes 16 01117 g002
Figure 3. QTL analysis of the LSH trait based on the Δ(SNP-index) algorithm applied to mixed pools of SM830/ZKLM1. (a) Line charts depict the trend of Δ(SNP-index) across all 21 chromosomes, and (b) an enlarged view of the distal region of chromosome 4D highlights a major QTL peak. The blue, green, and yellow lines represent the Δ(SNP-index), 95% confidence interval (CI), and 99% CI, respectively. CI (n = 107) were determined via simulation-based null distribution modeling. Significant Δ(SNP-index) peaks exceeding the 95% or 99% CI indicate potential QTLs. The red dashed line marks the genomic interval most strongly associated with the LSH trait.
Genes 16 01117 g003
Figure 4. KASP marker analysis and construction of the physical map. (a) Genotyping of 92 F2:3 family lines with extreme phenotypes using KASP markers. (b) Physical map depicting the major QTLs associated with LSH or trichome traits. Circles, squares, triangles, and diamonds represent allele 1, allele 2, heterozygous genotypes, and non-template control (NTC), respectively.
Genes 16 01117 g004
Figure 5. Isolation and characterization of the candidate gene TaSAIN1-4D. (a) PCR amplification of genomic DNA and CDS sequences of the candidate gene TaSAIN1-4D. (b) Nucleotide sequence alignments of TaSAIN1-4D between ZKLM1 and SM830. (c) Amino acid sequence alignments of TaSAIN1-4D. M indicates the molecular size marker. White arrowheads highlight the target PCR bands. Polymorphic sites are underlined, and critical polymorphic sites are highlighted in red font.
Genes 16 01117 g005
Figure 6. Sorting signal importance of the amino acid sequence of TaSAIN1-4D protein. (a) Sorting signal analysis of the TaSAIN1-4Da.1 protein. (b) Sorting signal analysis of the TaSAIN1-4Db protein. Red arrowheads highlight the acid substitution within the nuclear localization signal peptide fragment.
Genes 16 01117 g006
Figure 7. Proposed model of the role of TaSAIN1-4D in the wheat trichome regulatory network. TaSAIN1-4D functions as a central regulator that integrates signals from the MBW complex (MYB-bHLH-WD40), the wheat WOX (Hg) homolog, and hormonal pathways including JA, GA, and CK.
Genes 16 01117 g007
Table 1. Filtering and statistical analysis of the 120K-4HWA targeted-capture SNP sequencing data.
SamplesRaw Bases (bp)Raw Reads (bp)Clean Bases (bp)Clean Reads (bp)Clean Bases (%)Clean Reads (%)Q30 1 (%)GC (%)Duplication 2 (%)
LSH_pool1+7,354,933,80049,032,8927,125,150,34648,695,50696.8899.3196.952.54.1
LSH_pool1−8,657,837,70057,718,9188,390,741,33457,334,82896.9199.3396.752.63.9
LSH_pool2+7,762,636,20051,750,9087,606,138,89851,401,22697.9899.3296.152.94.0
LSH_pool2−7,286,962,20048,579,7487,046,164,01648,241,02496.7099.3097.052.94.1
ZKLM1+4,711,597,50031,410,6504,526,831,57231,254,28296.0899.5097.051.94.1
SM830−4,432,805,40029,552,0364,250,976,33029,393,96495.9099.4796.952.33.5
SM2262−4,359,853,50029,065,6904,211,924,81428,922,05096.6199.5196.751.13.9
1 Q30 (%) denotes the percentage of bases with a Phred score > 30; 2 Duplication (%) indicates the proportion of duplicated reads. LSH_pool1+ and LSH_pool1- are pools of F2 individuals from the SM830 × ZKLM1 cross with (+) or without (−) LSH, respectively; LSH_pool2+ and LSH_pool2− are the corresponding pools from the SM2262 × ZKLM1 cross.
Table 2. Alignment statistics for the targeted-capture sequencing data.
SamplesMapping Rate 1 (%) Average Depth 2 (×) Coverage 3 ≥ 4× (%)Coverage ≥ 10× (%)Coverage ≥ 30× (%)Capture Rate 4 (%)
LSH_pool1+99.9960.4697.1694.3373.1131.30
LSH_pool1−99.9969.9797.2394.5977.6931.15
LSH_pool2+99.9959.7497.2694.4672.8931.12
LSH_pool2−99.9959.9197.1894.1172.5330.85
ZKLM1+99.9937.6294.6587.5948.5228.53
SM830−99.9936.5594.5087.4547.6829.89
SM2262−99.9928.0993.1782.1632.4822.84
1 Mapping rate (%) refers to the proportion of reads aligned to the reference genome relative to the total number of reads; 2 Average depth (×) is the ratio of the total number of bases aligned to the core region to the total number of bases in the core region; 3 Coverage ≥ 4×, ≥10×, or ≥30× denotes the percentage of target regions covered by at least 4, 10, or 30 reads, respectively; 4 Capture rate (%) indicates the proportion of reads that fall within the capture area relative to the total number of reads in that region.
Table 3. Comparison of QTLs identified in this study with previously published QTLs.
PopulationsQTLs/LD BlockPeak IntervalsPositions 1 (Mb)References
C8 RILsQLsh.saas-4DXbarc48—D_GB5Y7FA01AGCKH_224504.32–511.67[8]
CC RILsQLsh.saas-4DXbarc48–Xbarc1183504.32–517.02[8]
Ae. tauschii accessionsLD block-trichomes-4DLBetween 530 kb LD block on 4DL502.84–503.26[15]
SM830/ZKLM1 F2QLsh.cwnu-4Dn.501803422–n.503905439501.80–503.91This study
SM2262/ZKLM1 F2QLsh.cwnu-4Dn.501803422–n.503905382501.80–503.91This study
1 Positions, physical positions are based on the Chinese Spring RefSeq v2.1 genome.
Table 4. Predicted subcellular localization and membrane-association type of TaSAIN1-4D protein.
CultivarsProbabilities of Localization (Top 4)Probabilities of Membrane Association Type
CytoplasmNucleusMitochondrionPeroxisomePeripheralTransmembraneLipid anchorSoluble
ZKLM10.26620.93650.14830.17950.35500.14200.08700.8170
SM8300.28200.89660.11860.31410.30800.10900.07200.8370
CM420.21220.94780.10610.43600.25400.09500.04500.8630
Table 5. Comparative summary of TaSAIN1-4D and known trichome-related genes/QTLs across cereals and model plants.
Gene/QTLSpecies/LocusMolecular Type and FunctionReferences
TaSAIN1-4DWheat (4DL)Salt-inducible nuclear protein; unique to TriticeaeThis study
Hl1/Hl1thWheat (4BL)/Th. ponticum introgressionDominant locus for leaf-blade/sheath pubescence[16]
QLsh.saas-4DWheat (4DL)QTL for hairy leaf sheath (LSH)[8]
HshBarley (4HL)Gene controlling leaf sheath hairiness (Hsh)[9]
Hp1Rye (5RL)Hairy peduncle gene (Hp)[9]
GL6/Mhl1Rice (Chr. 6)/Maize (Chr. 9)Homologous loci regulating trichome density/length[9]
Hg (WOX3-like)Wheat (1AS)WOX transcription factor[9]
GL1 (R2R3-MYB)ArabidopsisActivator of trichome initiation (MBW complex)[29]
GL3/EGL3 (bHLH)ArabidopsisPartners with GL1 and TTG1; activates GL2[30]
TTG1 (WD40)ArabidopsisWD40 scaffold protein[31]
TRY/CPC (R3-MYBs)ArabidopsisMobile negative regulators of trichome density[32]
DREB familyWheat (Various loci)AP2/ERF transcription factors[33]
Disclaimer/Publisher’s Note: The statements, opinions and data contained in all publications are solely those of the individual author(s) and contributor(s) and not of MDPI and/or the editor(s). MDPI and/or the editor(s) disclaim responsibility for any injury to people or property resulting from any ideas, methods, instructions or products referred to in the content.