Article

De  Novo Transcriptome Sequencing and Profiling of Ovarian Development of Argas persicus Along the Trophogonic Cycle

1
Research Center for Parasites & Vectors (RCPV), College of Veterinary Medicine, Hunan Agricultural University, Changsha 410128, China
2
Guizhou Provincial Key Laboratory for Biodiversity Conservation and Utilization in the Fanjing Mountain Region, Tongren University, Tongren 554300, China
*
Authors to whom correspondence should be addressed.
Genes 2025, 16(9), 1107; https://doi.org/10.3390/genes16091107
Submission received: 12 July 2025 / Revised: 15 September 2025 / Accepted: 17 September 2025 / Published: 19 September 2025
(This article belongs to the Section Animal Genetics and Genomics)

Abstract

BackgroundArgas persicus is a hematophagous ectoparasite of poultry and is the vector of several agents infectious to poultry. This study aims to explore the key genes affecting the ovarian development of A. persicus. Methods: RNA-seq was performed on the ovaries of A. persicus before blood-feeding, on the day of engorgement, and 6 days post-engorgement. Utilizing the threshold padj < 0.05 and|log2(foldchange)| > 1, differentially expressed genes were identified, and hub genes were determined by constructing protein–protein interaction (PPI) networks. Results: A total of 1008 differentially expressed genes were obtained during the feeding period, including 448 up-regulated and 560 down-regulated genes. Further, 2179 differentially expressed genes were screened in the preoviposition stage, including 1957 up-regulated and 222 down-regulated genes. These genes are mainly annotated in functions such as peptidase activity (especially serine protease activity), protein folding, protein assembly, and cell component assembly, and enriched in pathways such as protein processing in endoplasmic reticulum, lysosome, glutathione metabolism, and sphingolipid metabolism. In addition, some proteins that are closely related to ovarian development, including heat shock protein 70, protein disulfide isomerase, paramyosin, troponin I, hexosaminidase, serine protease, Kunitz serine protease inhibitors, and vitellogenin, were obtained. Conclusions: These findings fill the gap in the biological data for the ovarian development of soft ticks, provide a reference database for subsequent proteomics research, and offer fundamental support for the screening and development of candidate antigens for anti-tick vaccines.

1. Introduction

Argas persicus is a member of the order Ixodida, family Argasidae, and genus Argas, and mainly parasitizes domestic fowls and wild birds [1]. Heavy infestation of nymphs can lead to tick paralysis [2]. The life cycle of A. persicus includes four stages: eggs, larvae, nymphs (commonly with two to five instars), and adults [3]. During this period, ticks need to blood-feed to grow, molt, and lay eggs. A. persicus, when biting infected hosts, can transmit various pathogens, including Borrelia anserina, the causative agent of avian spirochetosis; Francisella tularensis, responsible for tularemia; Coxiella burnetii, which causes Q fever; Pasteurella avicida, associated with fowl cholera; and Acinetobacter haemolyticus [4,5,6]. Thus, A. persicus have become an important vector for the transmission of pathogens, causing significant losses to livestock and poultry breeding.
After the tick feeds, the oocytes grow rapidly and protrude in a grape-like shape. During a certain period in engorged females, oocytes at stages I, II, III, and IV of the Denardi [7] classification can be observed simultaneously in the ovary, but oocytes at stage V are only visible in the oviducts [8]. Studies have shown that in mated female ticks, vitellogenesis was evident 4 days after engorgement, and the number of mature oocytes (stage IV) reaches the maximum 6 days after engorgement [8,9]. After oviposition, the ovaries gradually return to the simple tube-like structure and await the next gonotrophic cycle. Female A. persicus usually can undergo 4–6 gonotrophic cycles and can survive for 1 year in a starved state [3,9]. Their characteristics of being multi-host, highly reproductive, and starvation-tolerant increase the harmfulness of the population.
Vaccine immunization is an economical, effective, and environmentally friendly method for tick control. However, the use of vaccines also has limitations. For instance, although the Bm86 subunit vaccine derived from the midgut has been successfully launched on the market, there are regional and tick species differences in its immune efficacy [10,11]. Currently, the functional protein vaccines that had been identified have insufficient protective efficacy and cannot replace the chemical acaricides completely. Therefore, we need to explore more efficient, broader-spectrum, and safer antigens. The development of omics has accelerated the process of functional molecular screening. So far, ovarian transcriptome investigations have been performed in hard ticks, including Haemaphysalis flava [12], Ixodes Ricinus [13], Haemaphysalis longicornis [14], Amblyomma sculptum [15], Rhipicephalus microplus [16,17], and Dermacentor albipictus [18]. However, transcriptome investigations of the ovary of argasid ticks, including A. persicus, are unavailable. Therefore, in this study, we used RNA-seq to catalog the transcriptome and to identify potential differentially expressed genes (DEGs) in the ovaries associated with ovarian development at three time points of two key stages (the blood uptake period and the preoviposition period) of the reproductive nutritional cycle in A. persicus ticks. Our findings will provide new insights for screening the candidate antigens for anti-tick vaccine development.

2. Materials and Methods

2.1. Animals and Sample Collection

A. persicus were collected from the wall crevices of chicken coops at a farm in Jiayuguan (39°85′N, 98°46′E), China, and were identified and reared at the Parasite and Vector Research Center of Hunan Agricultural University. A total of 420 female ticks, each weighing 19 ± 3 mg and having just completed molting, were allowed to freely mate with twice the number of male ticks under controlled conditions (28 °C, 85% relative humidity). All females originated from the same batch of hatched eggs, and only two nymphal stages were present. After 10 days, 120 female ticks were randomly selected to be dissected to obtain ovaries (OV0). Pools of another 300 were placed on Sanhuang chickens to feed 2 h, and 120 fully engorged ticks (detached freely) were collected to isolate ovaries (OV1), while the ovaries of the 120 females at preoviposition were collected 6 days after blood meal (OV2) and the remaining 60, including unengorged and oviposited females, were discarded. At each time point, the 120 tick ovaries obtained were stored in three cryovials, with each vial containing 40 tick ovaries. This approach ensures that there are three biological replicates for each time point. The ovaries were washed three times with pre-cooled sterile PBS (PH = 7.4) and frozen in liquid nitrogen for RNA-seq and qPCR.

2.2. RNA Isolation and Library Construction

Total RNA was isolated from the ovaries in OV0, OV1, and OV2 of A. persicus using TRIzol reagent (Invitrogen, Waltham, MA, USA) in accordance with a previously established protocol [19]. The extracted RNAs were detected by Agilent 2100 bioanalyzer (Agilent, Santa Clara, CA, USA), and RNA purity and concentration were evaluated by NanoDrop2000 (Thermo Fisher, Waltham, MA, USA). A total of 3 μg RNA per ovary sample was used to construct each sequencing library using the Ultra™ RNA Library Prep Kit (NEB, Ipswich, MA, USA), according to the manufacturer’s instructions. Briefly, mRNA was enriched from the RNA using Oligo (dT) magnetic beads, and the fragmentation buffer was used to break it into small fragments of about 200 bp. Subsequently, the first and second strands of cDNA were synthesized successively using fragmented mRNA as a template. The purified double-stranded cDNA was subjected to end repair, A-tailing, and ligation of sequencing adapters. The cDNA of approximately 250–300 bp was selected using the AMPure XP system (Beckman Coulter, Brea, CA, USA) for PCR amplification and purification. Finally, the library quality was assessed on the Agilent Bioanalyzer 2100 system (Agilent, Santa Clara, CA, USA) and sequencing was conducted by synthesis on an Illumina NovaSeq 6000 platform (illumina, San Diego, CA, USA) to generate raw reads of 150 bp.

2.3. Transcript Splicing and Functional Annotation

To obtain high-quality clean reads, the raw reads were processed to filter the sequences containing adapter, high N rate, length, and low-quality reads using the NGS QC Toolkit (v2.3.3). Additionally, data quality was evaluated using FastQC (http://www.bioinformatics.babraham.ac.uk/projects/fastqc (accessed on 29 March 2022)). The clean reads were assembled into transcripts using Trinity (v2.6.6) [20]. The Corset program (https://code.google.com/p/corset-project/ (accessed on 29 March 2022)) was used to perform hierarchical clustering on the transcripts. In each cluster, the longest transcript was selected as the representative sequence in that cluster and defined as the Unigene. Benchmarking Universal Single-Copy Orthologs (BUSCO, Arthropoda__odb10 database) was used to evaluate the quality of transcript splicing [21]. To obtain comprehensive gene function information, we annotated the Unigenes across seven major databases, including NR (NCBI non-redundant protein sequences), NT (NCBI nucleotide sequences), KEGG (Kyoto Encyclopedia of Genes and Genomes), GO (Gene Ontology), SwissProt (a manually annotated and reviewed protein sequence database), KOG/COG (COG: Clusters of Orthologous Groups of proteins; KOG: euKaryotic Ortholog Groups), and PFAM (Protein family). Subsequently, the Unigene sequence was taken as the reference sequence, and the clean reads of each sample were aligned with the reference sequence using the RSEM (v1.1.17). The number of reads aligned to a certain gene is called the read count.

2.4. Differential Expression Analysis of Genes

Considering the impact of sequencing depth and gene length on fragment counts, the Fragments Per Kilobase of exon model per Million mapped fragments (FPKM) is the current method to estimate the gene expression level. Therefore, RSEM was used to convert the read count to FPKM [22]. DEGs between OV1 and OV0, as well as OV2 and OV1, were selected using the threshold padj < 0.05 and| log2(foldchange)| > 1 [23]. The expression-based sample clustering and principal component analysis were performed via DESeq2 (1.20.0) [24].

2.5. Functional Enrichment Analysis

To obtain the functional information of the genes, we performed the functional annotation on the Unigene sequence. GO [25] and KEGG [26] enrichment analysis was executed by GOseq (1.10.0) and KOBAS (v2.0.12) between OV1 and OV0, as well as OV2 and OV1, respectively. GO terms and KEGG pathways with padj < 0.05 were defined as significantly enriched.

2.6. Screening of Candidate Genes Related to Ovarian Development

The DEGs were mapped for coding sequence (CDs) prediction according to the priority order of NR protein library, SwissProt protein library, and TransDecoder (version 3.0.1) software. The CDs were uploaded to the STRING 12.0 database (http://string-db.org/ (accessed on 19 June 2025)) to obtain their predicted protein–protein interaction (PPI). PPI networks with scores greater than 0.7 and interaction relationships less than 10 were retained. Visualization of gene interaction was achieved using Cytoscape (v3.7.1). The hub gene was identified through the Maximum Clique Centrality (MCC) algorithm of its plugin cytoHubba [27], and the genes related to ovarian development were obtained in combination with the literature analysis.

2.7. Quantitative Real-Time PCR (qPCR) for mRNA Quantitation

Total RNA (1 μg) remaining after the construction of the ovarian library was used for cDNA synthesis through EasyScript® One-Step gDNA Removal and cDNA Synthesis SuperMix (Transgen, Beijing, China). We selected seven DEGs for validation, including the candidate genes paramyosin, vitellogenin, and heat shock protein 70, as well as additional DEGs: fatty acid-binding protein, chitinase, and ferritin heavy-chain. Following the method described by Kim [28], we determined that the β-actin gene would serve as the reference gene for this experiment. qPCR was performed using a 20 μL reaction volume containing 10 μL of 2 × PerfectStart® Green qPCR SuperMix (Transgen, Beijing, China), 0.8 μL of forward and reverse primers, 4 μL of cDNA, and 5.2 μL RNase and DNase-free water. The qPCR reaction was run on a ABI7300 platform (Applied Biosystems, Foster City, CA, USA) set at 95 °C for 30 s, 35 cycles of 95 °C for 10 s, 60 °C for 30 s, and 72 °C for 10 s. β-Actin and glyceraldehyde 3-phosphate dehydrogenase (GAPDH) gene were used as internal control genes and the relative expression of the genes was calculated using the 2−△△CT method. A significant difference was statistically evaluated with Student’s t-test using SPSS 26.0. The primers used for the differential gene expression analyses are listed in Table 1.

3. Results

3.1. Quality Analysis of RNA Sequencing

A total of 201,335,043 clean reads were obtained from the nine ovary samples after quality control. The ratios of clean reads/raw reads were all greater than 89.97%. Meanwhile, the GC content ranged from 51.83 to 54.37%. The percentages of Q20 base were all greater than 96.07%, and the percentages of Q30 base were all greater than 90.23%, indicating that the sequencing results were highly reliable. After assembly, 163,186 transcripts (N50 2111 bp) were obtained, and the results of Corset hierarchical clustering were combined to define the Unigene. We obtained 63,500 Unigenes (N50 1693 bp) with lengths ranging from 301 bp to 22,653 bp. In addition, 32,440 annotated genes (51.08%) were obtained and were used in the subsequent analyses (Table 2). After clustering the Trinity database and removing redundancy with the Corset, the BUSCO results indicated an increase in single-copy orthologs and a decrease in duplicate orthologs. The BUSCO completeness score for Unigenes was 91.6%, demonstrating high-quality assemblies suitable for further analysis. (Figure S1, Table S1).

3.2. The Profiling of DEGs of A. persicus Ovaries

In total, 1008 DEGs were detected, including 448 up-regulated and 560 down-regulated genes in the OV1 and OV0 ovaries (Figure 1A). Furthermore, we identified 2179 DEGs between the OV2 and OV1 ovaries, containing 1957 up-regulated and 222 down-regulated genes (Figure 1C). Hierarchical clustering showed distinguishable expression patterns of DEGs in the samples (Figure 1B,D). The top 10 up-regulated and down-regulated DEGs were preferentially selected from the blood-sucking and preoviposition periods, respectively. Detailed information can be found in Table 3 and Table 4.

3.3. GO Analysis of DEGs

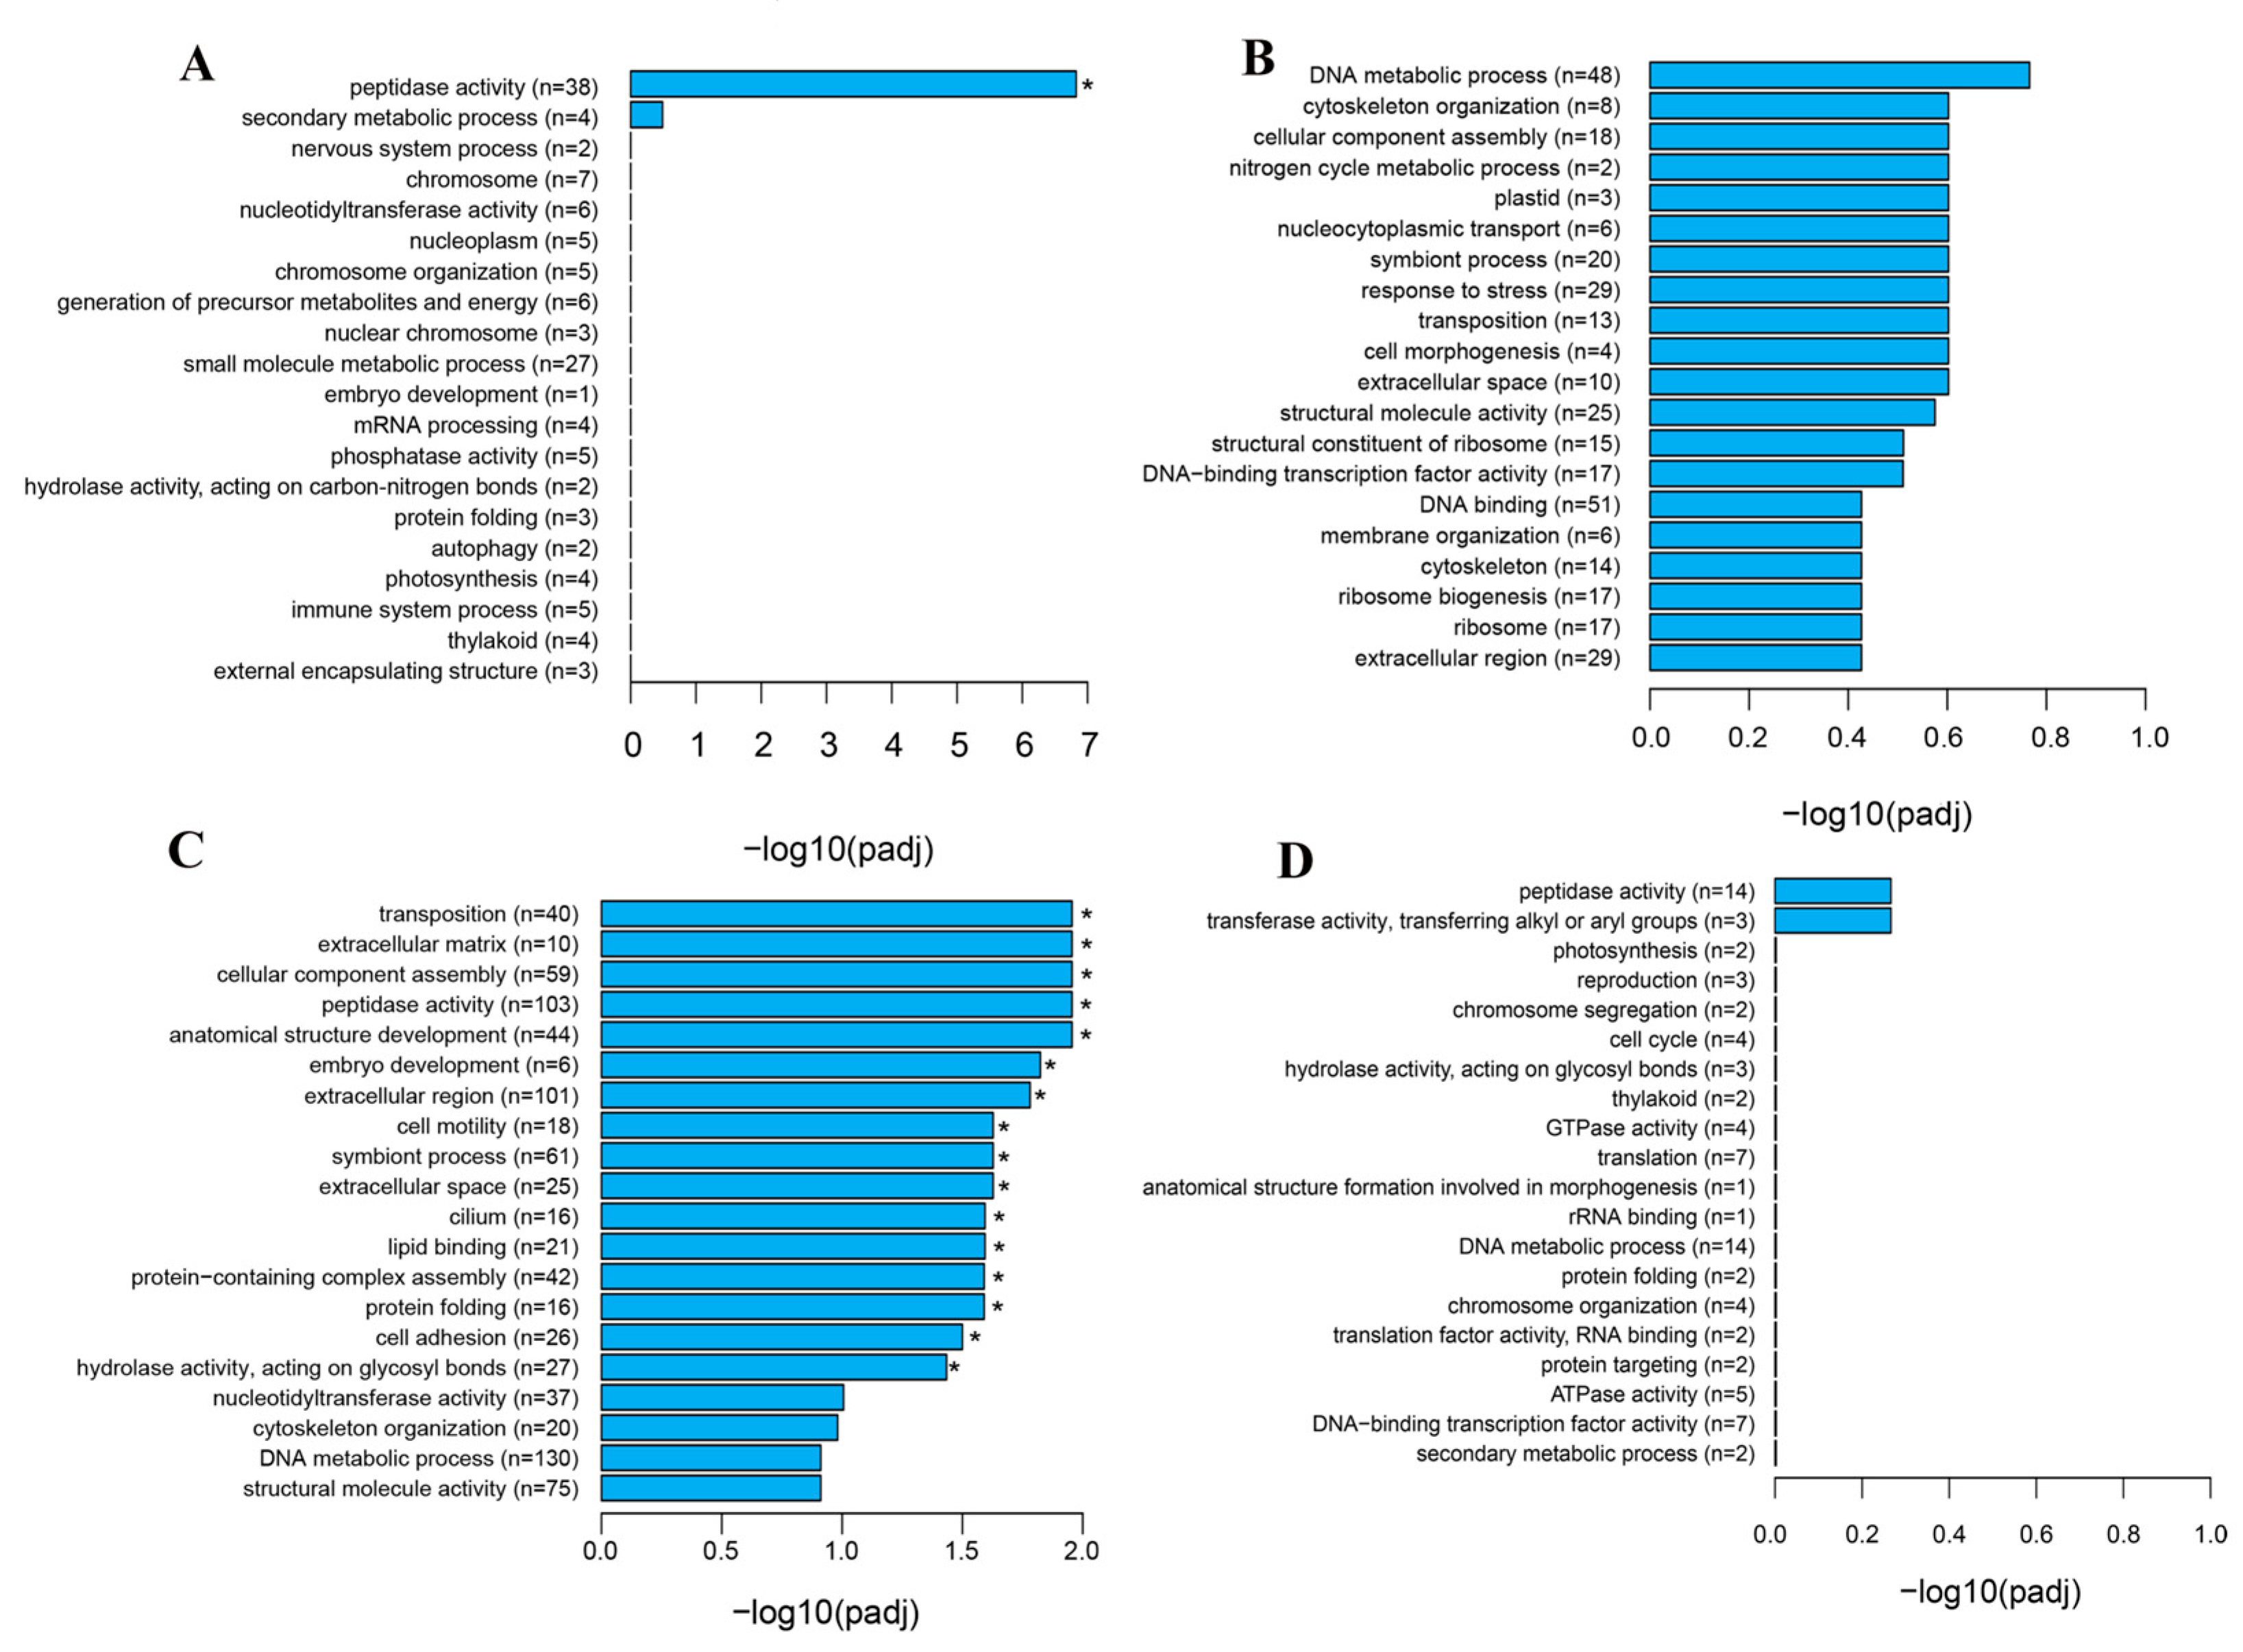
GO enrichment analyses were performed on the DEGs. The up-regulated genes of OV1 vs. OV0 were enriched in 100 GO terms, among which peptidase activity was significantly enriched, and the down-regulated genes were enriched in 118 GO terms, although none of them were significantly enriched (Figure 2A,B). The up-regulated genes of OV2 vs. OV1 were enriched in 130 GO terms, of which 17 were significantly enriched, including nutrition-related functional categories, such as peptidase activity, hydrolase activity, and acting on glycosyl bonds. Furthermore, up-regulated genes related to peptidase activity can be further annotated to serine-type peptidase activity, metallopeptidase activity, cysteine-type peptidase activity, aspartic-type peptidase activity, and so forth. The down-regulated genes of OV2 vs. OV1 were enriched in 87 GO terms, but none of them were significantly enriched (Figure 2C,D).

3.4. KEGG Analysis of DEGs

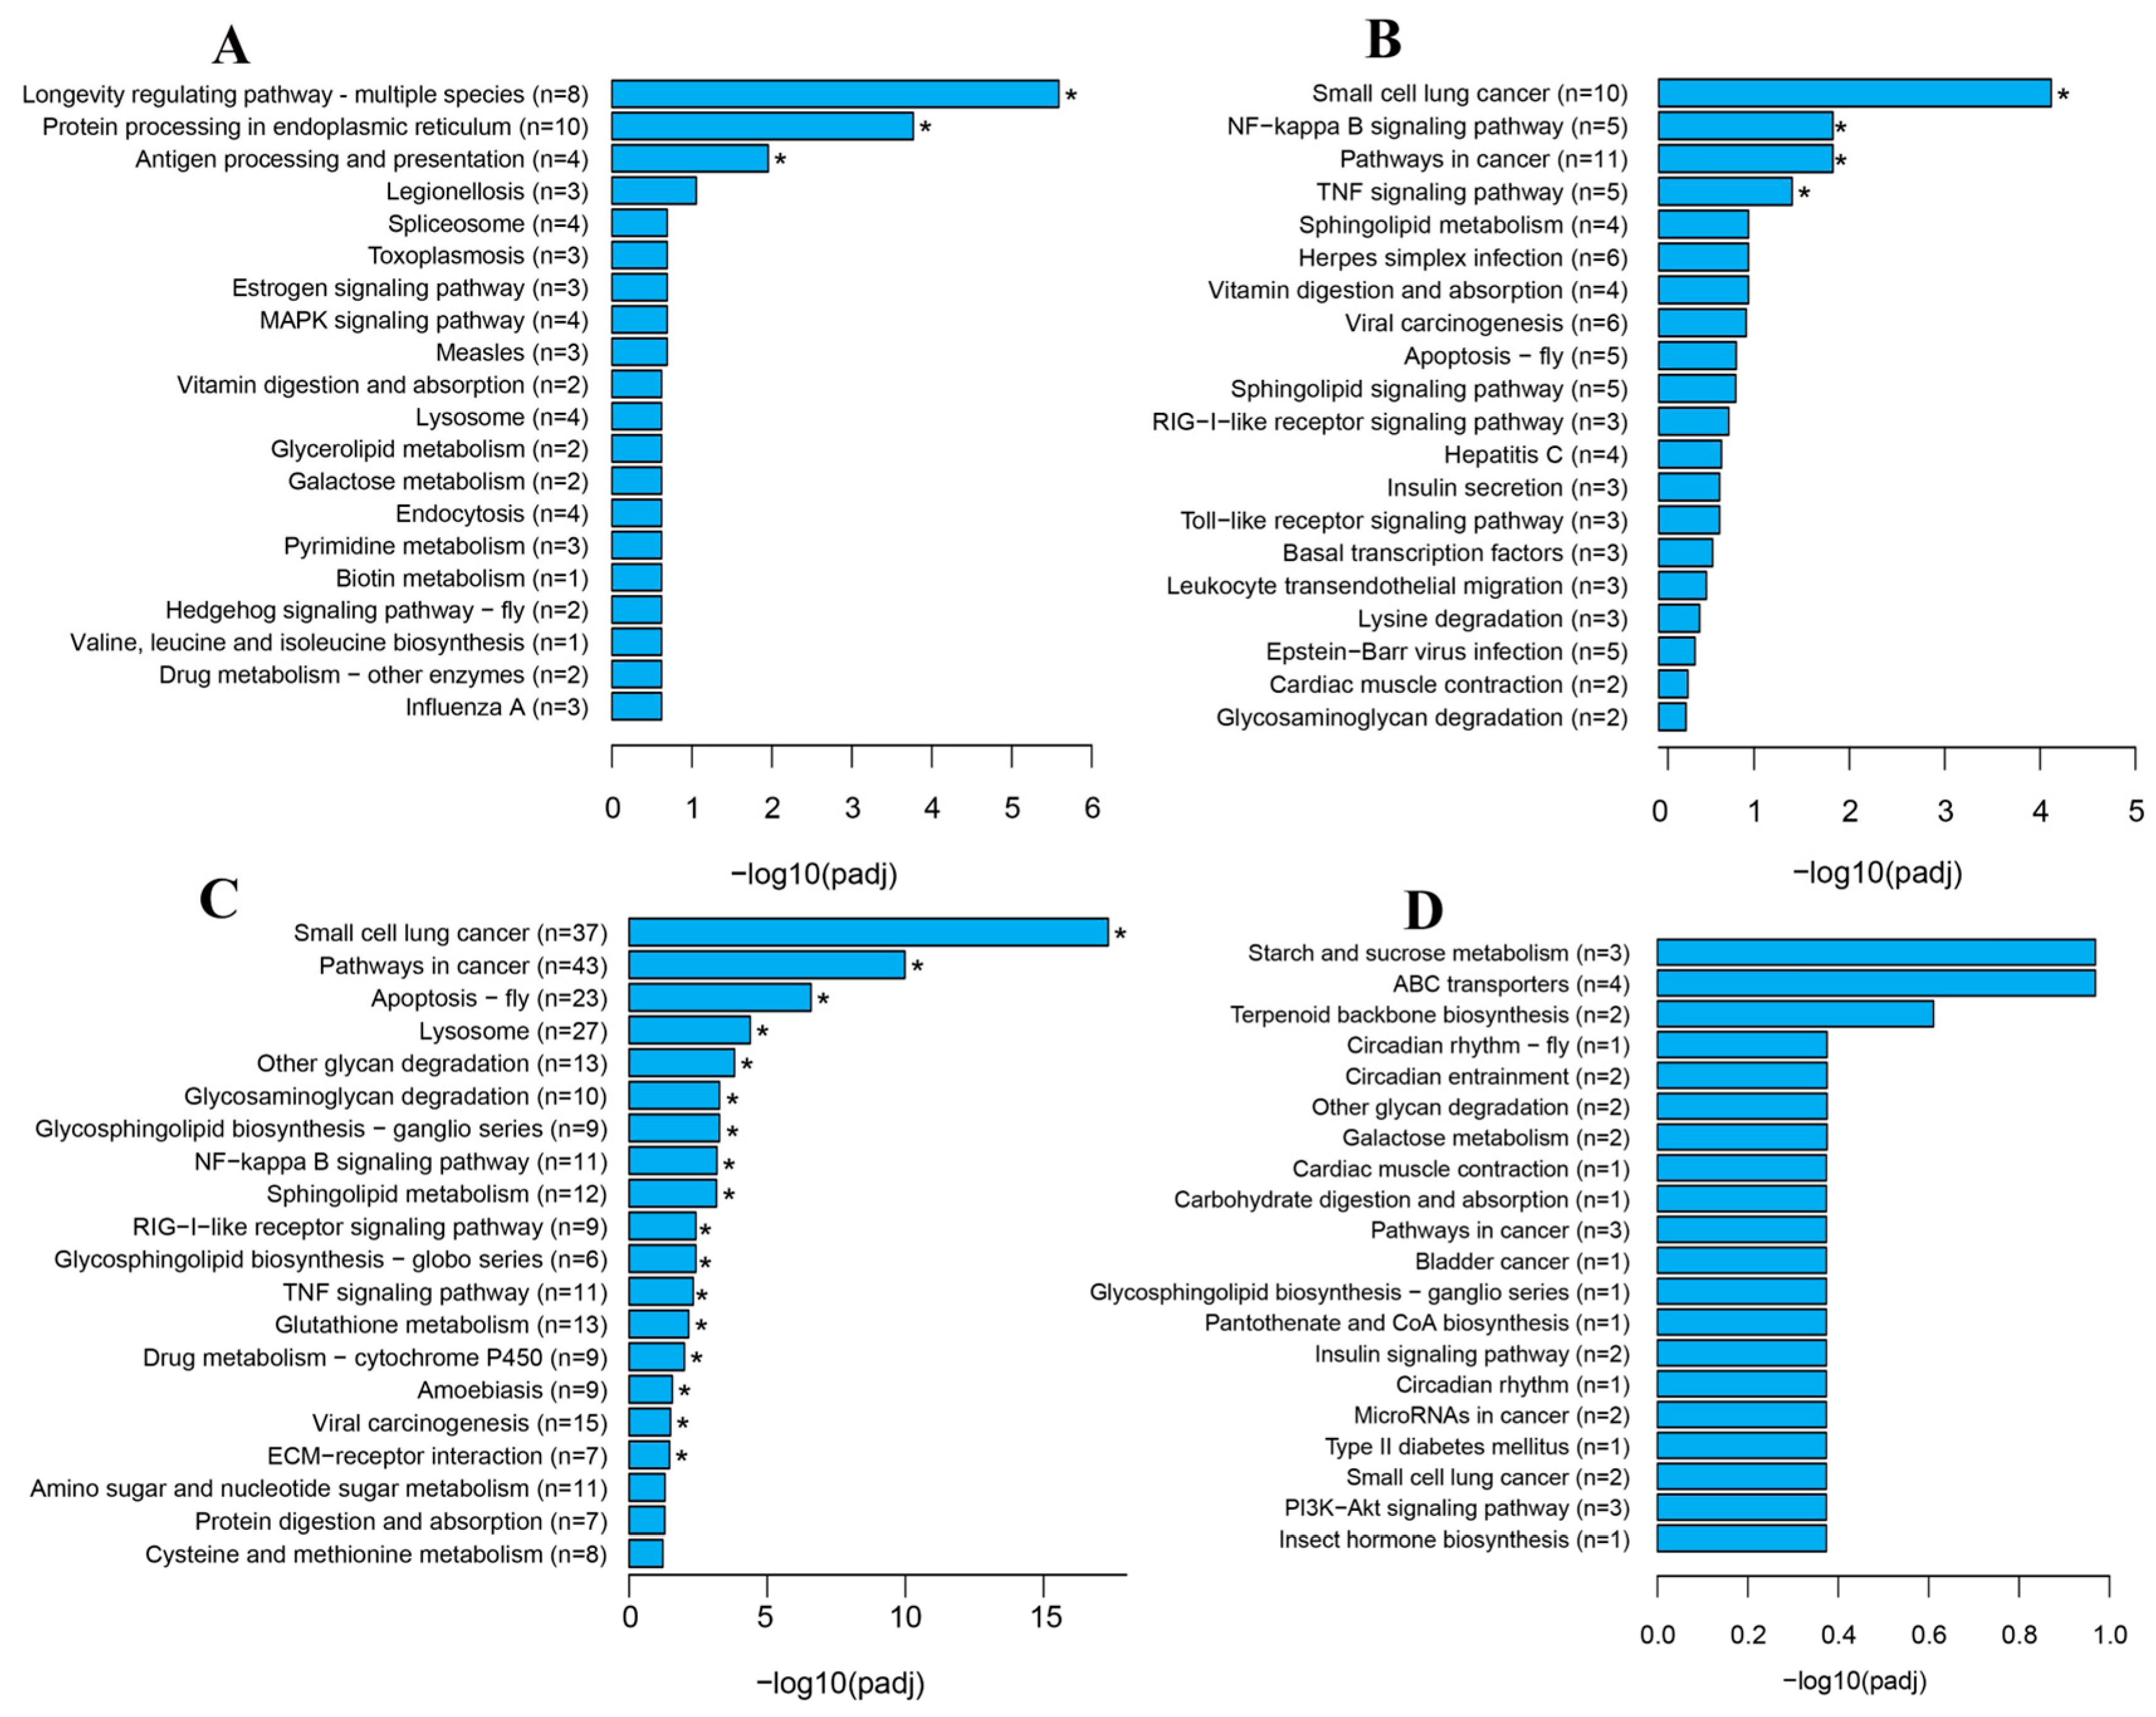
The DEGs were also annotated using KEGG to identify the enriched pathways. The up-regulated genes of OV1 vs. OV0 were enriched in 88 pathways, of which 3 pathways were significantly enriched, including protein processing in endoplasmic reticulum and antigen processing and presentation (Figure 3A). The down-regulated genes of OV1 vs. OV0 were enriched in 156 pathways, 4 of which were significantly enriched, including NF-kappa B signaling pathway and TNF signaling pathway. Furthermore, the up-regulated genes of OV2 vs. OV1 were enriched in 240 pathways, of which 17 pathways were significantly enriched, including lysosome, NF-kB signaling pathway, other glycan degradation, sphingolipid metabolism, RIG-I-like receptor signaling pathway, glutathione metabolism, and ECM–receptor interaction (Figure 3C). The down-regulated genes of OV2 vs. OV1 were enriched in 73 pathways, but none of them were significantly enriched (Figure 3D).

3.5. Candidate Genes Related to Ovarian Development

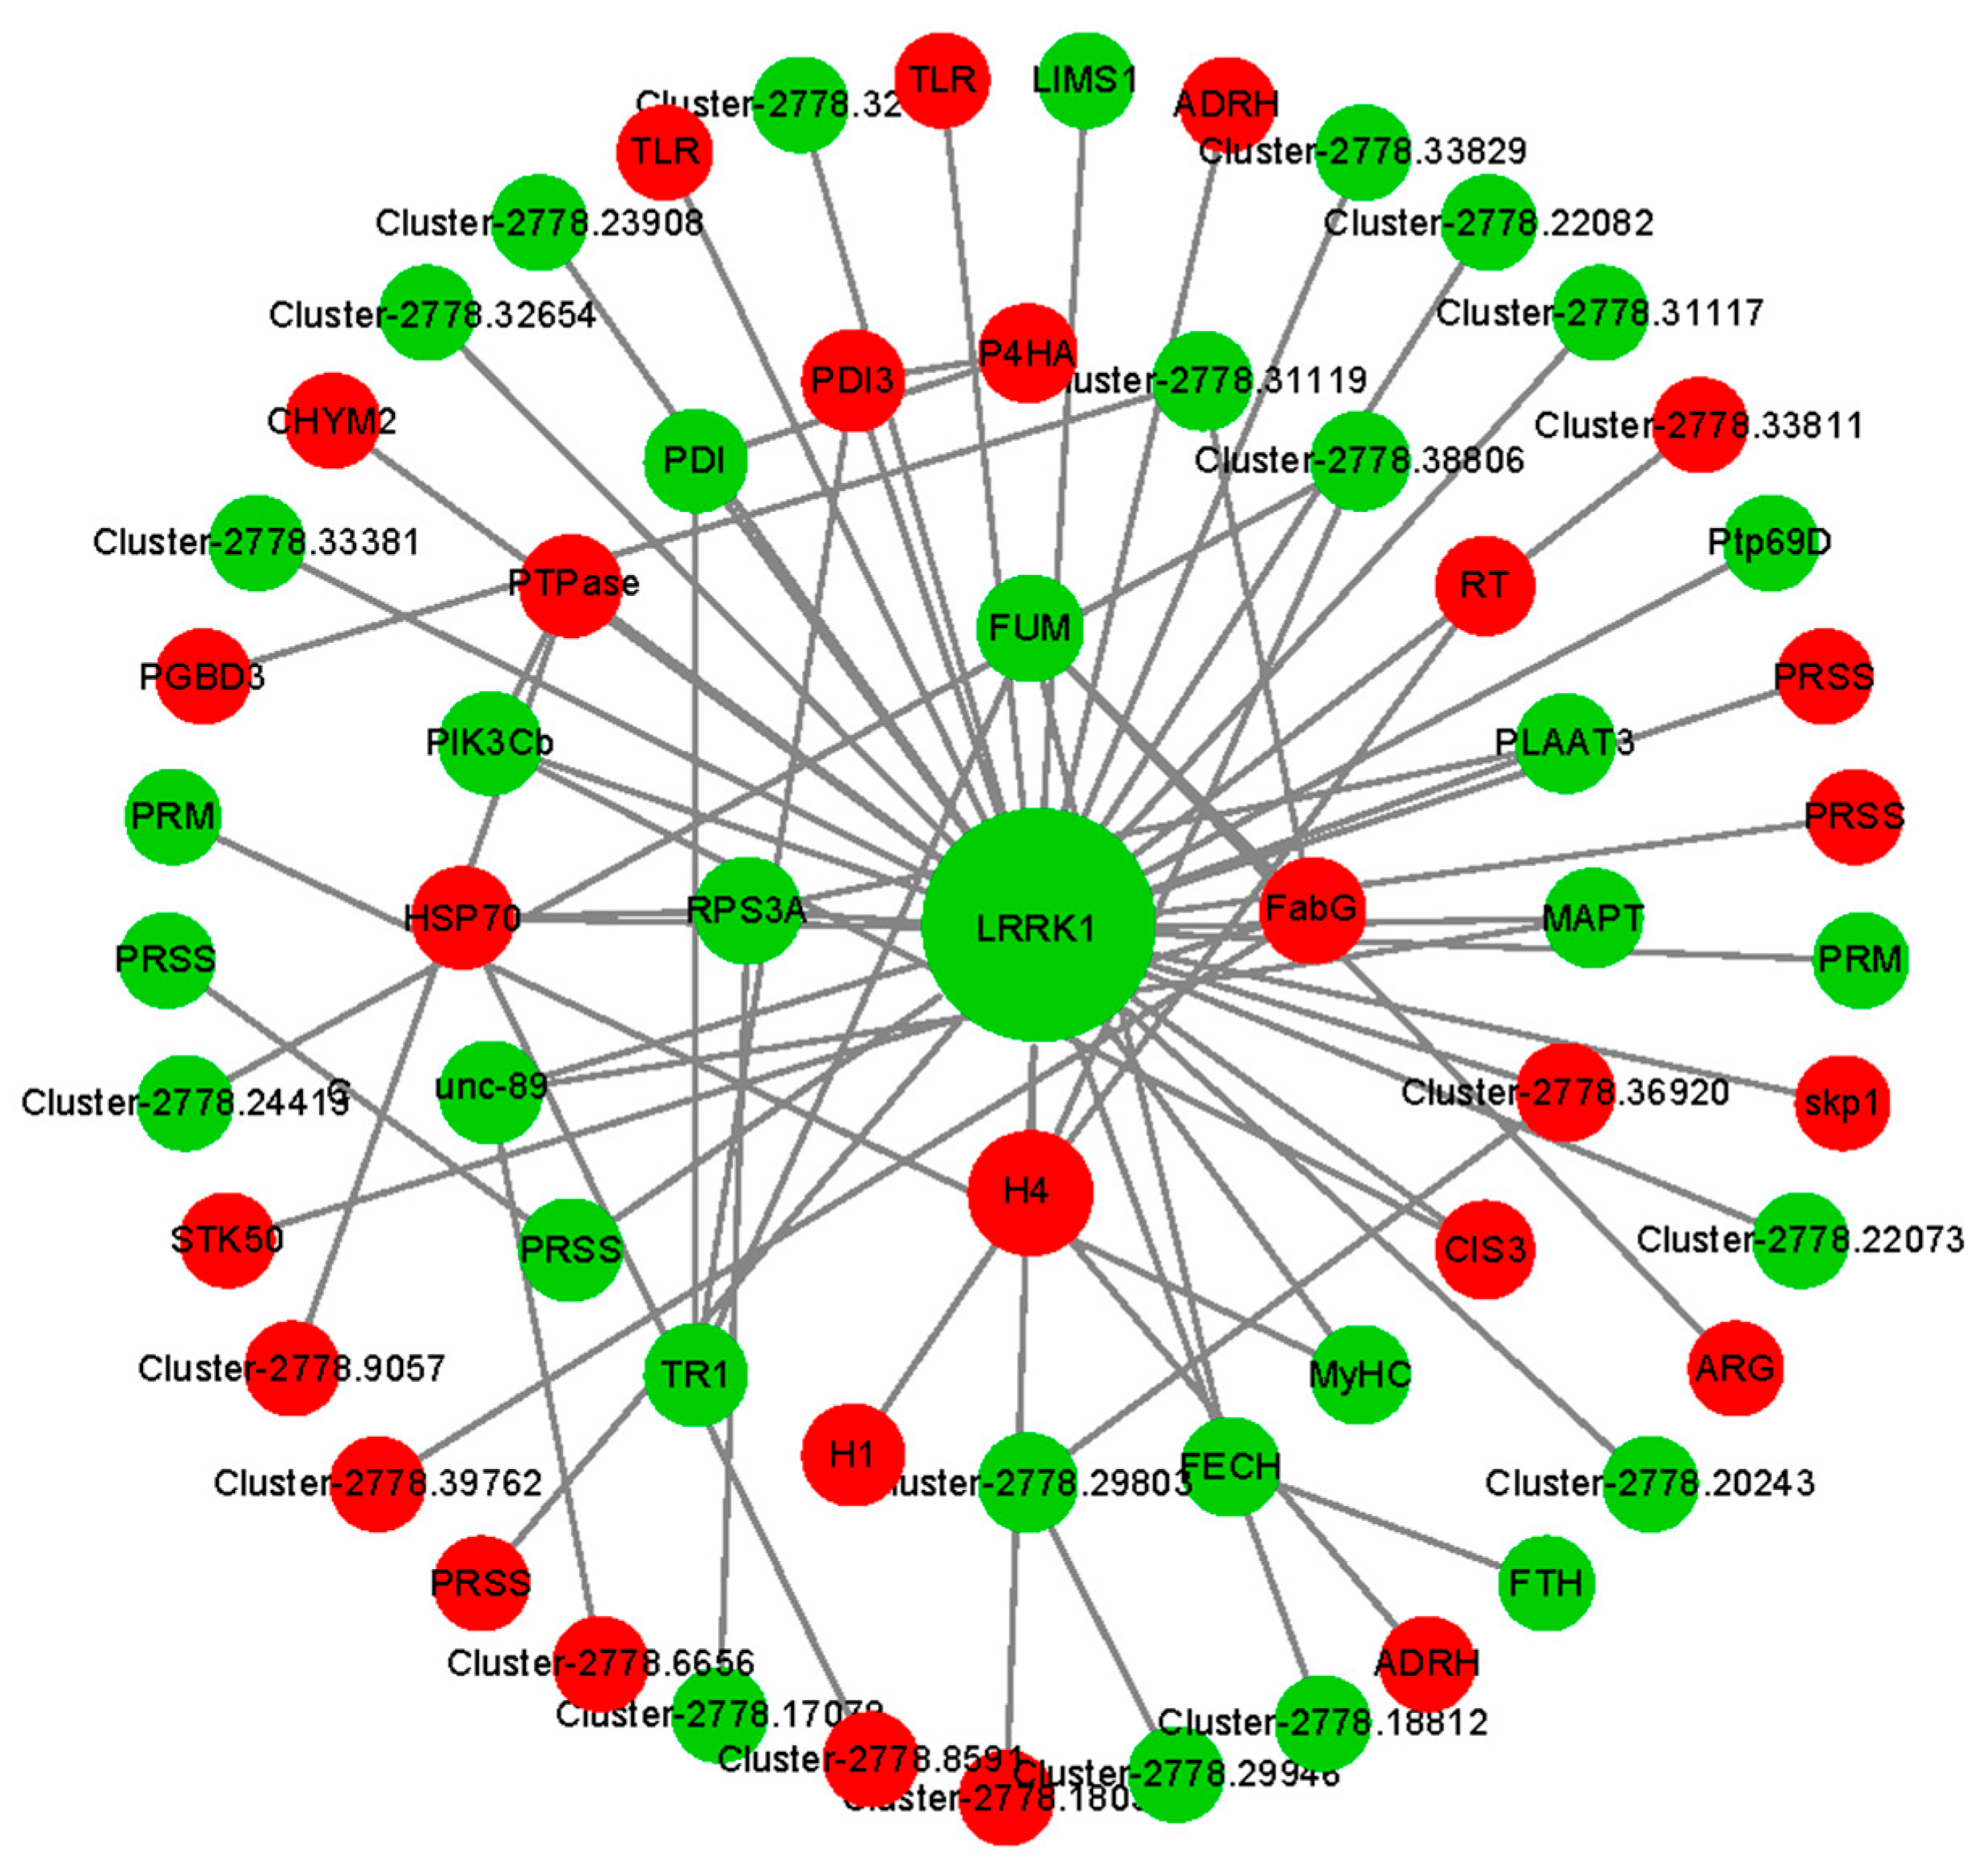
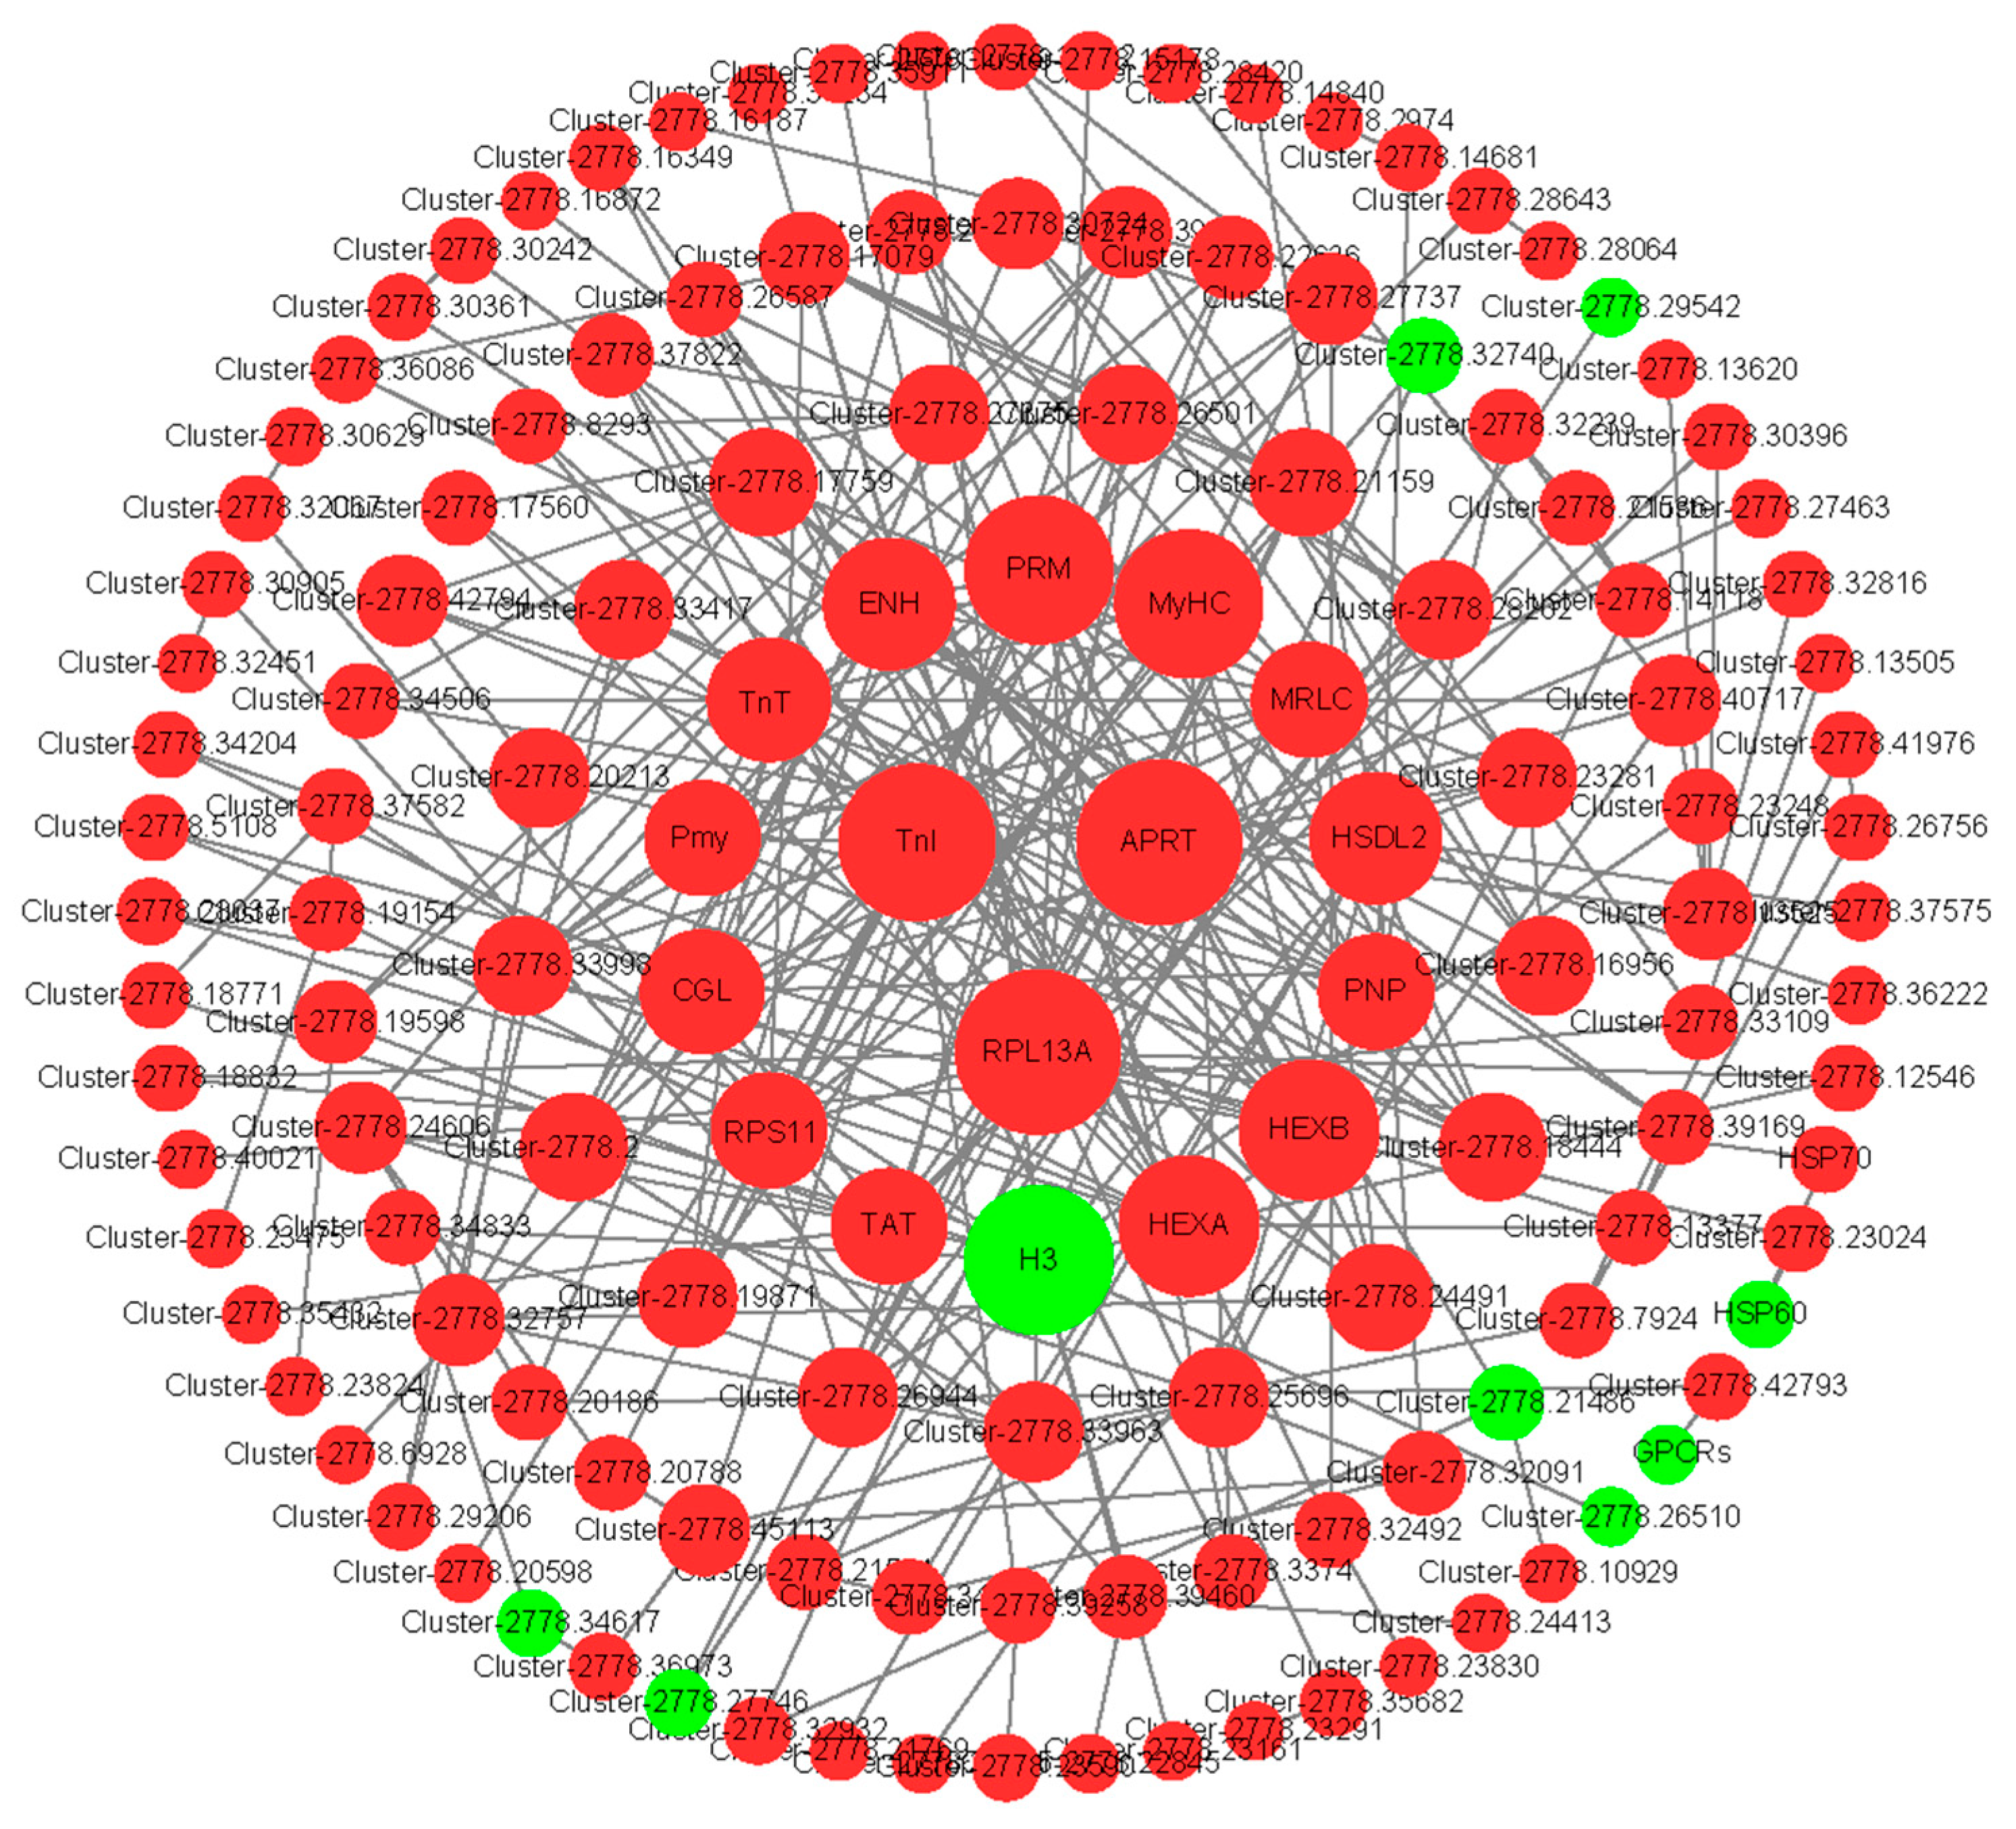
To further explore the functional relationship between DEGs, a PPI regulated network was constructed (Figure 4 and Figure 5). During the blood-feeding and preoviposition periods, 316 and 814 differentially expressed gene-encoded CDs, respectively, matched the protein sequences of Ixodes scapularis (NCBI Taxonomy ID: 6945). In the network, there were 264 nodes and 68 interaction relationships during the feeding period (p < 5.27 × 10⁻⁵), while there were 197 nodes and 398 interaction relationships during the preoviposition period (p < 1.0 × 10⁻¹⁶). Ten hub genes were identified using the MCC algorithm of the cytoHubba plugin (Table 5 and Table 6). The hub gene coding sequences were compared with homologous proteins from the Ixodes scapularis (NCBI taxonomy ID: 6945) and UniprotKB database, with the results presented in Table 5 and Table 6. During the blood-feeding stage, fumarase (FUM) is related to energy metabolism, protein disulfide isomerase (PDI), protein disulfide isomerase 3 (PDI3), and 40S ribosomal protein S3a (RPS3A) are related to protein synthesis and modification in the blood-feeding phase. 3-oxoacyl-(acyl carrier protein) reductase (FabG) is a key enzyme for fatty acid synthesis (Table 5). Heat shock protein 70 (HSP70) is a molecular chaperone, PIK3Cb and PTEN jointly regulate the PI3K/AKT/mTOR pathway, and H4 is involved in the regulation of the cell cycle (Table 5). Among these, seven hub-gene-encoded proteins demonstrate over 71% amino acid sequence similarity with proteins from other tick species, as indicated in Table S2. During the preoviposition stage, sex-hormone-related enzymes such as hydroxysteroid dehydrogenase protein 2 (HSDL2), cytoskeletal-protein-related proteins troponin I (TnI), paramyosin (PRM), and myosin heavy chain (MyHC), as well as hydrolases like adenine phosphoribosyltransferase (APRT), beta-hexosaminidase subunit beta (HEXB), and beta-hexosaminidase subunit alpha (HEXA), were included (Table 6). Notably, six hub-gene-encoded proteins demonstrate over 80% amino acid sequence similarity with proteins from other tick species, as shown in Table S3.

3.6. Verification of DEGs

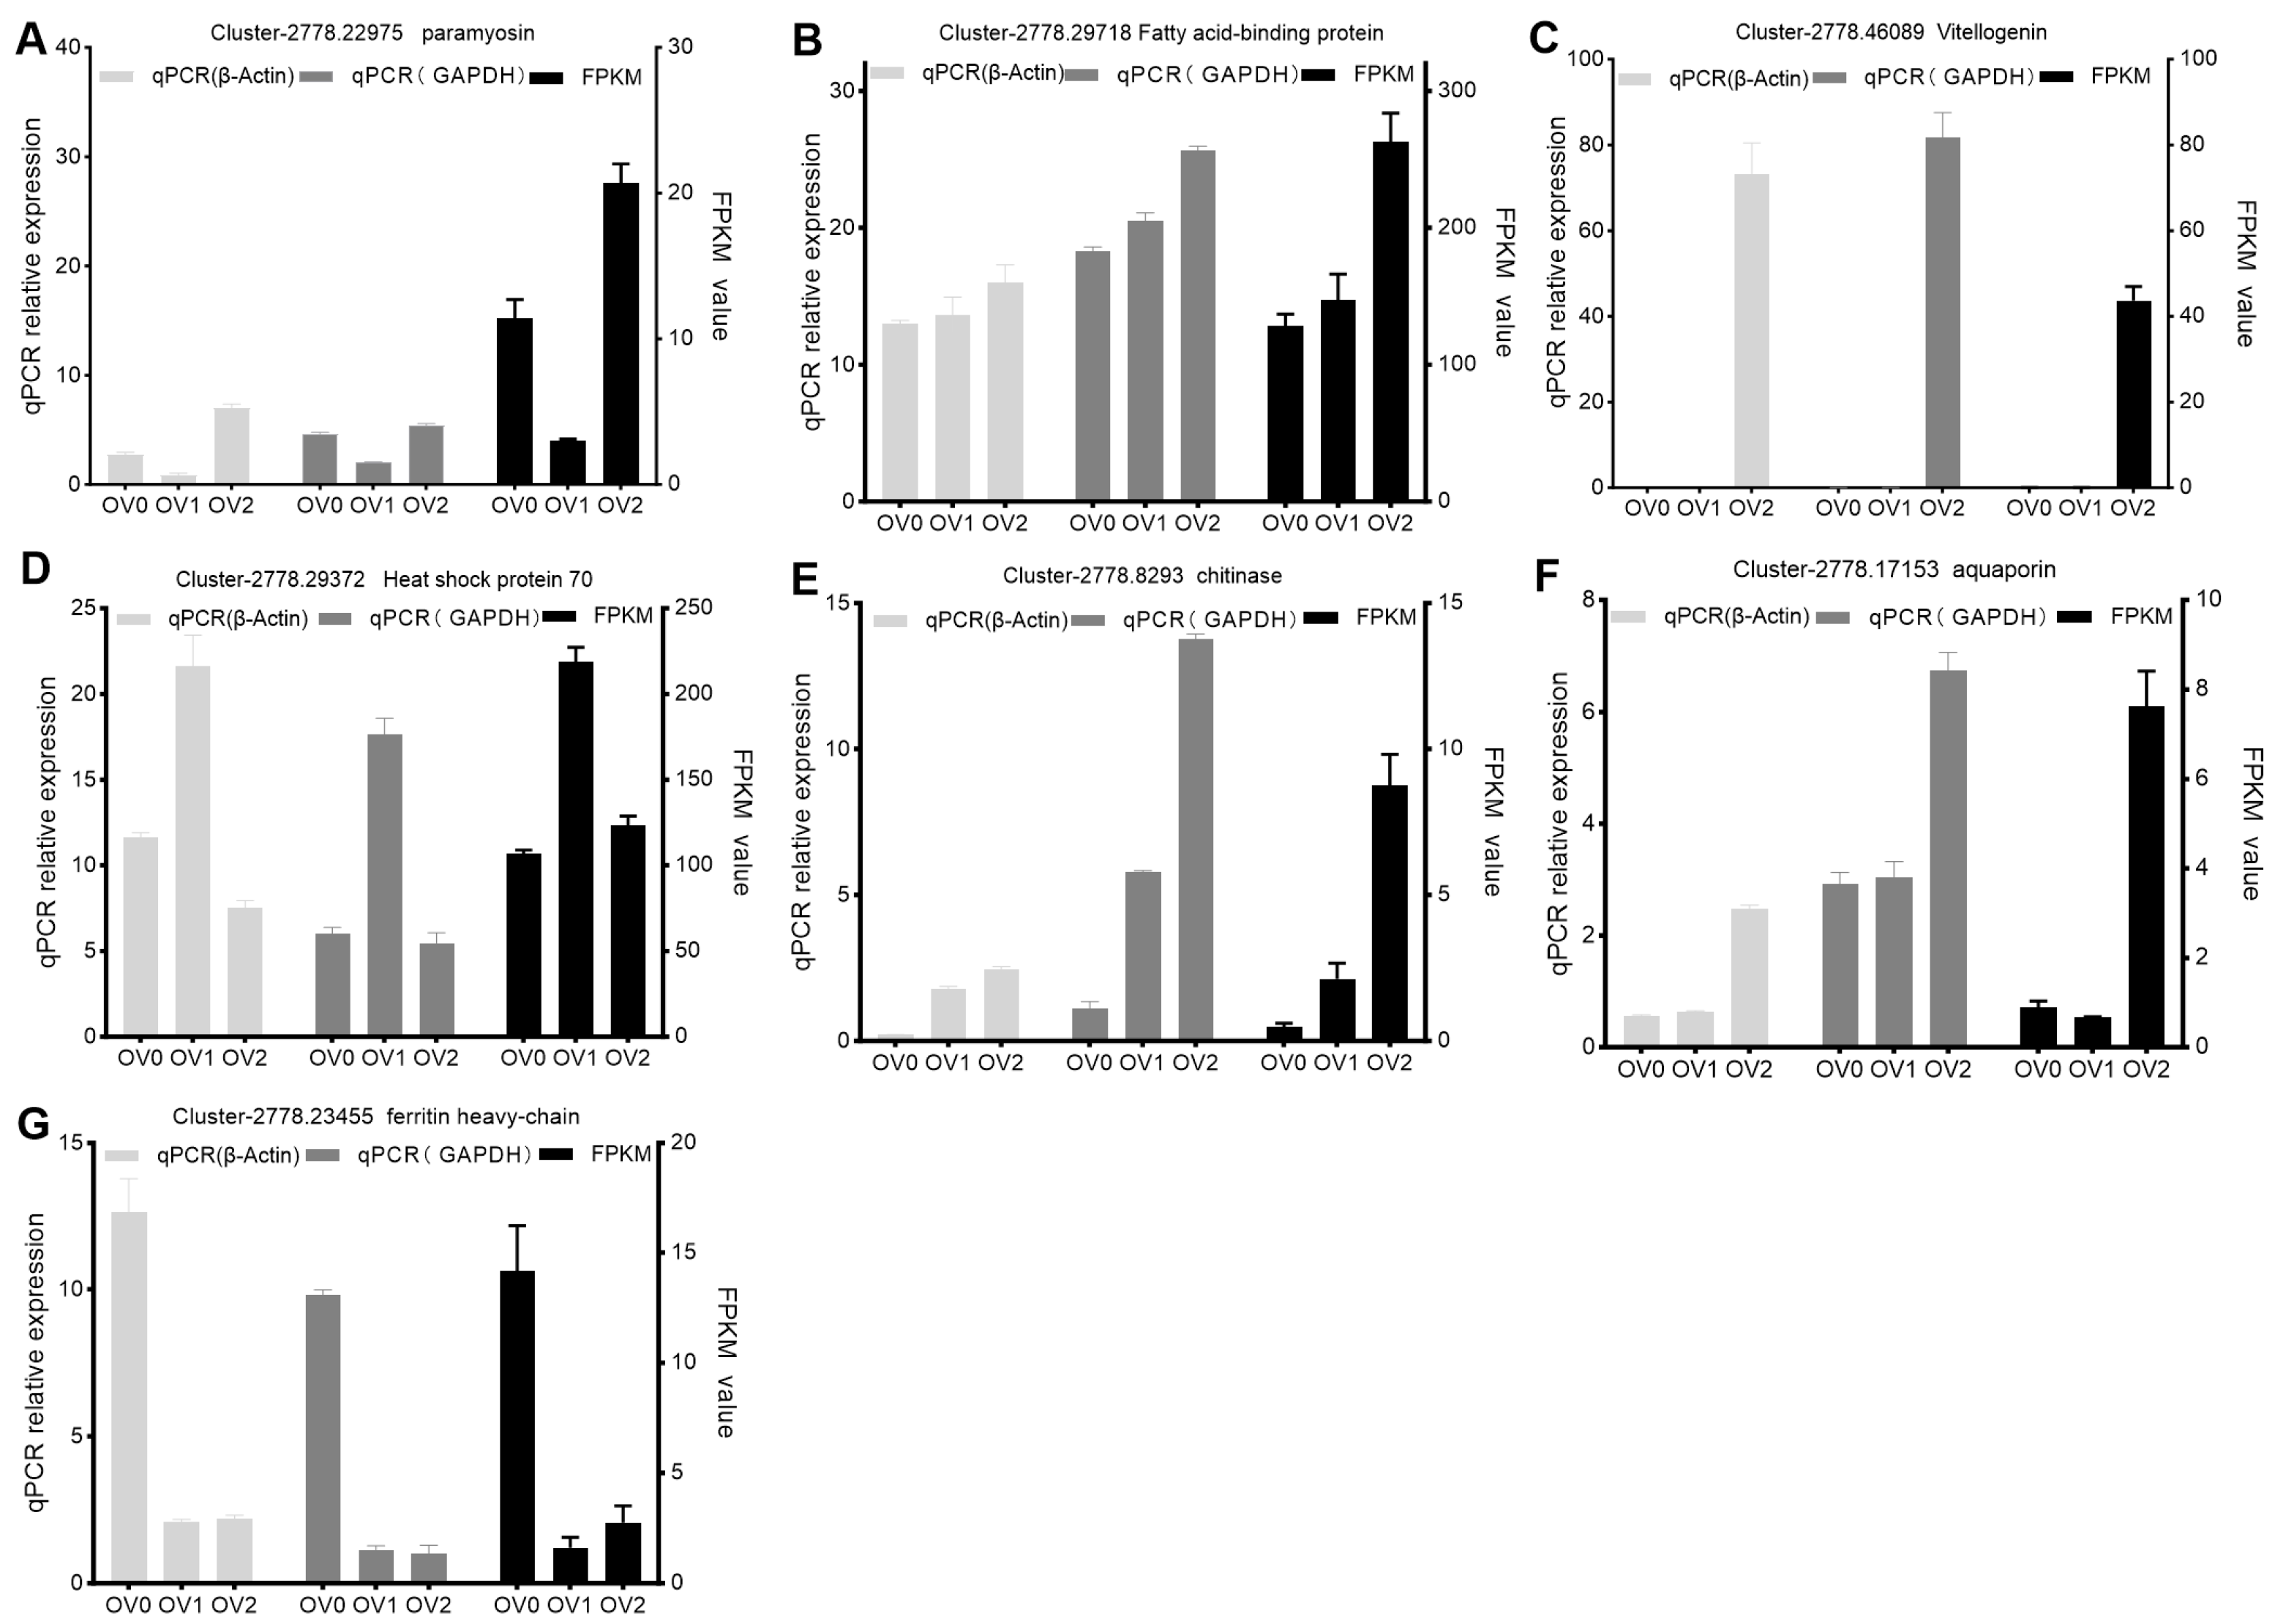
To verify the results of RNA-seq data, seven DEGs were selected for qPCR analyses. qPCR data (Figure 6) suggest that the RNA-seq results are reliable and can represent the virtual expression pattern at the three time points of two key stages (the feeding period and the preoviposition period) of the reproductive nutritional cycle in A. persicus.
Figure 6. Verification of the expression of DEGs at the three time points of two key stages in A. persicus. (AG) presents the qPCR (left: β-Actin as internal control; middle: GAPDH as internal control) and RNA-seq (right) analyses for the selected seven genes: paramyosin, fatty acid-binding protein, vitellogenin, heat shock protein 70, chitinase, aquaporin, and ferritin heavy-chain. β-Actin (left) and GAPDH (middle) were utilized as internal reference genes. The left Y-axis indicates the relative gene expression levels derived from the qRT-PCR analysis, while the right Y-axis displays the FPKM values obtained from RNA sequencing. The X-axis represents ovary samples at different time points. The error bars indicate the standard deviation of three biological replicates.
Genes 16 01107 g006

4. Discussion

During blood-feeding, host immunoglobulins enter the tick’s midgut along with the blood meal, traverse the intestinal wall in their original form, and subsequently enter the hemolymph, where they can reach the ovaries and bind to specific antigens [29,30]. This binding within the tick’s ovaries suggests that targeting ovarian proteins as antigens presents a strategic approach for the long-term and sustainable control of tick populations by regulating their reproduction. Research indicates that the ovarian protein vitellin [31] provides partial protection to sheep against R. microplus, while the recombinant protein vaccine of follistatin-related protein [32] significantly reduces tick egg production. Furthermore, the knockdown of the vitellogenin receptor not only reduces fecundity but also disrupts the pathway for Babesia spp. to colonize the ovaries, thereby affecting the transovarial transmission of the tick-borne pathogen [33]. This indicates that vaccines developed based on ovarian proteins have considerable potential in preventing tick-borne pathogen transmission. Research suggests that, in addition to protein conservation being a critical factor influencing vaccine efficacy, combined immunization targeting different organs/tissues of ticks may enhance IgG responses [34,35]. Therefore, constructing a tick ovarian transcriptome library and screening for candidate antigens is essential for the development of anti-tick vaccines.
A. persicus has a very short feeding time, and mostly feeding takes place within 20–30 min, so these ticks were fully engorged within two hours. During this period, no changes in morphology were observed; however, significant differential expression was noted between ovarian transcripts (OV1 vs. OV0) [36]. The up-regulated genes are mainly enriched in peptidase activity and involved in the protein processing in endoplasmic reticulum pathway, indicating that blood uptake behavior can rapidly stimulate the ovarian transcription of peptidase activity and genes related to protein synthesis. The antigen processing and presentation (up-regulation), NF-kappa B signaling pathway (down-regulation), and TNF signaling pathway (down-regulation) related pathways are associated with immunity and stress [37,38,39]. Previous studies [37,38,39] mostly focused on the relationship between ticks and tick-borne pathogens, and the molecular mechanism that promotes ovarian development remains unclear. After engorged with blood, the A. persicus will detach from the host. Subsequently, the oocytes protruding from the ovaries grow rapidly for 5 to 6 days until they mature (OV2 vs. OV1) [36]. During this period, the number of up-regulated genes was significantly greater than that of down-regulated genes. The up-regulated genes were significantly enriched in the lysosome pathway, glutathione metabolism, and sphingolipid metabolism, which all relate to the meiosis of germ cells [40,41,42,43,44,45] and may be involved in cell proliferation. Ticks require a large amount of energy during physiological processes such as yolk formation, egg-laying, and embryonic development [40,46]. Research indicates that peptidase is present in the highest concentrations during the final stage of vitellogenesis, where it hydrolyzes proteins to release energy [40,46]. In this study, the up-regulated genes annotated to peptidase activity and glycosylated bond hydrolases suggest that genes related to nutritional digestion are indispensable during ovarian development.
We observed that among the top 10 up-regulated genes during the blood-feeding period (Table 3), serine protease had the largest up-regulation and down-regulation amplitudes from before blood uptake to before oviposition, while its inhibitor was significantly up-regulated in the preoviposition stage (Table 4). Unlike salivary glands [47], the transcripts of serine-type peptidases are the most abundant among the peptidases in the DEGs of the ovary, indicating that serine proteases play a crucial role in this biological process. As a proteolytic enzyme, serine protease is involved in physiological activities such as digestion, development, signal transduction, and immunity [48]. The Nudel gene encoding serine protease in Drosophila can cause female infertility [49] or prevent sperm from entering the egg by participating in the polar development of the egg and influencing the early cleavage process [50,51]. Mutations of the ovarian serine protease gene can cause reproduction to be hindered in pests such as Plutella xylostella [52], Spodoptera litura [53], Bombyx mori [54], and Ostrinia furnacalis [51]. In the study of ticks, the vaccine prepared prepared from longistatin, a serine protease, was approximately 73% effective in inhibiting the infestation of H. longicornis [55]. Furthermore, tick serine protease inhibitors such as Kunitz-type protease inhibitors [56,57] and serpin [58] play a significant role in regulating tick physiology by inhibiting serine protease activity. Kunitz-type serine protease inhibitors, including IrSPI [59], Doenitin-1 [60], and BmTI-A [56], are mainly involved in the inflammatory and hemostatic processes, which may be the candidate antigens for controlling ticks and developing new antithrombotic drugs in the future. Before egg-laying in this study, the expression level of the Vg (Cluster-2778.46089) was significantly up-regulated (Table 4), which might be related to the massive synthesis of Vg protein in the ovary. After Vg is ingested/synthesized, it is processed into vitellin (Vn) in the oocyte for storage. The content of Vn accounts for more than 85% of the total protein in the oocyte, thereby fulfilling the nutritional requirements during embryonic development [61]. Vg is not only the main nutrient for egg reserve, but also can bind to heme, reduce heme-induced cellular oxidative damage, and even affect the infection and transmission of tick-borne pathogens [62,63].
Three key genes affecting ovarian development during the uptake period, namely, HSP70, PDI, and PDI3, were identified from PPI analysis. HSP70 is widely distributed in various tick tissues; besides its molecular chaperone effect, it also plays an anticoagulant role during the blood-sucking process [64]. Further research has indicated that HSP70 is closely related to the expression of vitellogenin (Vg) and can regulate ovarian maturation [65,66]. The PDI and PDI3 genes discovered in this study belong to the PDI family, which is involved in the folding, assembly, and post-translational modification of proteins in the endoplasmic reticulum and is involved in collagen synthesis [67]. PDI is essential for the embryonic development of Caenorhabditis elegans [68]. In addition, specific PDI has the effect of inhibiting the colonization and transmission of tick-borne pathogens [69]. Furthermore, three additional key genes (PRM, TnI, and HEX) affecting ovarian development prior to oviposition, were also determined through PPI analysis. PRM is a muscle protein [70] that exists exclusively in invertebrates and has been utilized to develop vaccines against Trichinella spiralis [71], Schistosoma japonicum [72], tapeworm [73], and poultry red mite [74]. The recombinant protein of PRM and PRM epitope could produce 60.37% and 70.86% efficacy against female H. longicornis, respectively [75]. TnI, an essential component of muscle tissue, also plays a role in inhibiting angiogenesis [76]. Immunization of the host with TnI recombinant protein significantly reduced the engorgement rates of larval and adult ticks as well as the female fecundity of H. longicornis [77]. HEX, a lysosomal hydrolase comprising two subtypes (HEXA and HEXB) [78], participates in chitin degradation [79] and fertilization processes [78], making it a potential target for insect control. The application of R. microplus HEX polyclonal antibody has been shown to decrease the oviposition of R. microplus by 26% [80]. Due to the limited availability of genomic library data for soft ticks, we opted to screen hub genes based on the protein–protein interaction (PPI) network constructed from the I. scapularis database. Tables S2 and S3 demonstrate that the amino acid sequences of the proteins encoded by HSP70, PDI, PRM, TnI, and HEXB exhibit over 75% similarity with their homologous proteins in Ixodes scapularis, thereby validating the accuracy of the annotation of these core genes within the PPI network. Furthermore, the coding sequences (CDS) of these five genes show more than 83.4% similarity with homologous proteins from other tick species in the UniprotKB database, indicating the presence of partially conserved sequences. The development of a broad-spectrum anti-tick vaccine is contingent upon the identification of highly conserved tick proteins. The results indicate that HSP70, PDI, PDI3, PRM, TnI, and HEX have the potential to develop anti-tick vaccine antigens.

5. Conclusions

This study successfully assembled and constructed an ovarian transcriptome database for A. persicus de novo. Analysis of the transcriptome libraries at three time points during the trophogonic cycle revealed functions such as peptidase activity (particularly serine protease activity), protein folding, protein assembly, and cellular component assembly. Furthermore, pathways related to protein processing in the endoplasmic reticulum, lysosomes, glutathione metabolism, and sphingolipid metabolism are crucial for ovarian development. The identified candidates HSP70, PDI, PRM, TnI, HEX, serine protease, Kunitz, and Vg are potential antigens for the development of anti-tick vaccines. Given that some of the DEG-encoded proteins in this PPI network are not involved, and the number of interactions is relatively small, it can be inferred that the identification of PPIs affecting the ovarian development of A. persicus is not yet exhaustive. Therefore, it is essential to continue studying the interactions between proteins that influence the ovarian development of A. persicus. Additionally, functional validation and immunogenicity testing can be employed to more thoroughly assess the potential of these candidate genes for the development of anti-tick vaccines.

Supplementary Materials

The following supporting information can be downloaded at: https://www.mdpi.com/article/10.3390/genes16091107/s1, Figure S1 and Tables S1: Assessing the completeness of Argas persicus ovary transcriptome assembly using BUSCO. Tables S2–S3: Hub genes related to ovarian development during the feeding period (OV1 vs OV0) and the preoviposition period (OV2 vs OV1), respectively.

Author Contributions

T.C., F.Y., and D.D. designed the experiments. F.Y. and D.D. are responsible for the tick rearing facility and provided all ticks used in this study. F.Y., J.M., and T.C. analyzed the data and collaborated in writing and editing the manuscript. All authors have read and agreed to the published version of the manuscript.

Funding

This study was financially supported by the National Key Research and Development Program of China (2024YFD1800103).

Institutional Review Board Statement

All experiments were supervised by the Animal Ethics Committee of Hunan Agricultural University (No. 43321418) and performed in accordance with the regulations and guidelines of this committee. Approval Date: 2021/11/07.

Informed Consent Statement

Not applicable.

Data Availability Statement

All data obtained in this study was deposited at the National Center for Biotechnology Information (NCBI) with the accession number PRJNA1285112.

Conflicts of Interest

The authors declare that the research was conducted in the absence of any commercial or financial relationships that could be construed as potential conflicts of interest.

Abbreviations

The following abbreviations are used in this manuscript:
A. persicusArgas persicus
DEGsdifferentially expressed genes
PPIprotein–protein interaction
LDlinear dichroism
HSP70heatshockprotein70
PDIprotein disulfide isomerase
PDI3protein disulfide isomerase 3
PRMparamyosin
TnItroponin I protein
HEXbeta-hexosaminidase
Vgvitellogenin
Vnvitellin
H. longicornisHaemaphysalis longicornis

References

  1. Kohls, G.M.; Hoogstraal, H.; Clifford, C.M.; Kaiser, M.N. The Subgenus Persicargas (Ixodoidea, Argasidae, Argas). 9. Redescription and New World Records of Argas (P.) persicus (Oken), and Resurrection, Redescription, and Records of A. (P.) radiatus Railliet, A. (P.) sanchezi Duges, and A. (P.) miniatus Koch, New World Ticks Misidentified as A. (P.) persicus. Ann. Entomol. Soc. Am. 1970, 63, 590–606. [Google Scholar] [CrossRef]
  2. Gothe, R. Paralysis in chickens caused by Argas (Persicargas) persicus larvae. I. The effect of the degree of engorgement and infection rate on clinical symptoms. Z. Fur Parasitenkd. 1971, 35, 298–307. [Google Scholar] [CrossRef]
  3. Zahid, H.; Muñoz-Leal, S.; Khan, M.Q.; Alouffi, A.S.; Labruna, M.B.; Ali, A. Life Cycle and Genetic Identification of Argas persicus Infesting Domestic Fowl in Khyber Pakhtunkhwa, Pakistan. Front. Vet. Sci. 2021, 8, 664731. [Google Scholar] [CrossRef]
  4. Duan, D.-Y.; Liu, Y.-K.; Liu, L.; Liu, G.-H.; Cheng, T.-Y. Microbiome analysis of the midguts of different developmental stages of Argas persicus in China. Ticks Tick-Borne Dis. 2022, 13, 101868. [Google Scholar] [CrossRef]
  5. Cutler, S.; Abdissa, A.; Adamu, H.; Tolosa, T.; Gashaw, A. Borrelia in Ethiopian ticks. Ticks Tick-Borne Dis. 2012, 3, 14–17. [Google Scholar] [CrossRef]
  6. Pader, V.; Buniak, J.N.; Abdissa, A.; Adamu, H.; Tolosa, T.; Gashaw, A.; Cutler, R.R.; Cutler, S.J. Candidatus Rickettsia hoogstraalii in Ethiopian Argas persicus ticks. Ticks Tick-Borne Dis. 2012, 3, 338–345. [Google Scholar] [CrossRef] [PubMed]
  7. Denardi, S.E.; Bechara, G.H.; de Oliveira, P.R.; Nunes, É.T.; Saito, K.C.; Mathias, M.I.C. Morphological characterization of the ovary and vitellogenesis dynamics in the tick Amblyomma cajennense (Acari: Ixodidae). Vet. Parasitol. 2004, 125, 379–395. [Google Scholar] [CrossRef] [PubMed]
  8. Marzouk, A.S.; Swelim, H.H.; Ali, A.A.B. Ultrastructural changes induced by the entomopathogenic fungus Beauveria bassiana in the ovary of the tick Argas (Persicargas) persicus (Oken). Ticks Tick-Borne Dis. 2020, 11, 101507. [Google Scholar] [CrossRef] [PubMed]
  9. El Kammah, K.M.; Abdel Wahab, K.S. Argas (Persicargas) persicus life cycle under controlled and outdoor conditions. Acarologia 1980, 21, 163–172. [Google Scholar]
  10. Rodríguez, M.; Penichet, M.; Mouris, A.; Labarta, V.; Luaces, L.L.; Rubiera, R.; Cordovés, C.; Sánchez, P.; Ramos, E.; Soto, A.; et al. Control of Boophilus microplus populations in grazing cattle vaccinated with a recombinant Bm86 antigen preparation. Vet. Parasitol. 1995, 57, 339–349. [Google Scholar] [CrossRef]
  11. Fuente, J.D.; Rodríguez, M.; García-Garí, J.C. Immunological control of ticks through vaccination with Boophilus microplus gut antigens. Ann. N. Y. Acad. Sci. 2000, 916, 617–621. [Google Scholar] [CrossRef]
  12. Zhao, Y.; Qu, Z.-H.; Jiao, F.-C. De novo transcriptome sequencing and comparative profiling of the ovary in partially engorged and fully engorged Haemaphysalis flava ticks. Parasitol. Int. 2021, 83, 102344. [Google Scholar] [CrossRef]
  13. Vechtova, P.; Fussy, Z.; Cegan, R.; Sterba, J.; Erhart, J.; Benes, V.; Grubhoffer, L. Catalogue of stage-specific transcripts in Ixodes ricinus and their potential functions during the tick life-cycle. Parasites Vectors 2020, 13, 311. [Google Scholar] [CrossRef] [PubMed]
  14. Wang, T.; Wang, T.; Zhang, M.; Shi, X.; Zhang, M.; Wang, H.; Yang, X.; Yu, Z.; Liu, J. The Ovarian Development Genes of Bisexual and Parthenogenetic Haemaphysalis longicornis Evaluated by Transcriptomics and Proteomics. Front. Vet. Sci. 2021, 8, 783404. [Google Scholar] [CrossRef]
  15. Moreira, H.N.S.; Barcelos, R.M.; Vidigal, P.M.P.; Klein, R.C.; Montandon, C.E.; Maciel, T.E.F.; Carrizo, J.F.A.; de Lima, P.H.C.; Soares, A.C.; Martins, M.M.; et al. A deep insight into the whole transcriptome of midguts, ovaries and salivary glands of the Amblyomma sculptum tick. Parasitol. Int. 2017, 66, 64–73. [Google Scholar] [CrossRef]
  16. Tirloni, L.; Braz, G.; Nunes, R.D.; Gandara, A.C.P.; Vieira, L.R.; Assumpcao, T.C.; Sabadin, G.A.; da Silva, R.M.; Guizzo, M.G.; Machado, J.A.; et al. A physiologic overview of the organ-specific transcriptome of the cattle tick Rhipicephalus microplus. Sci. Rep. 2020, 10, 18296. [Google Scholar] [CrossRef]
  17. Santos, I.K.F.D.M.; Valenzuela, J.G.; Ribeiro, J.M.C.; DE Castro, M.; Costa, J.N.; Costa, A.M.; DA Silva, E.R.; Neto, O.B.R.; Rocha, C.; Daffre, S.; et al. Gene discovery in Boophilus microplus, the cattle tick: The transcriptomes of ovaries, salivary glands, and hemocytes. Ann. N. Y. Acad. Sci. 2004, 1026, 242–246. [Google Scholar] [CrossRef] [PubMed]
  18. Edwards, R.T.M.; Antoshechkin, I.; Hill, E.; Perry, M.W.; Olafson, P.U.; Saelao, P.; Lohmeyer, K.H.; Akbari, O.S. First transcriptome analysis of the winter tick (Dermacentor albipictus) reveals sex-specific expression patterns and potential targets for genetic control. G3 Genes Genomes Genet. 2025, 15, jkaf116. [Google Scholar] [CrossRef] [PubMed]
  19. Rio, D.C.; Ares, M., Jr.; Hannon, G.J.; Nilsen, T.W. Purification of RNA using TRIzol (TRI reagent). Cold Spring Harb. Protoc. 2010, 2010, pdb.prot5439. [Google Scholar] [CrossRef]
  20. Grabherr, M.G.; Haas, B.J.; Yassour, M.; Levin, J.Z.; Thompson, D.A.; Amit, I.; Adiconis, X.; Fan, L.; Raychowdhury, R.; Zeng, Q.D.; et al. Full-length transcriptome assembly from RNA-Seq data without a reference genome. Nat. Biotechnol. 2011, 29, 644–652. [Google Scholar] [CrossRef]
  21. Manni, M.; Berkeley, M.R.; Seppey, M.; A Simão, F.; Zdobnov, E.M.; Kelley, J. BUSCO Update: Novel and Streamlined Workflows along with Broader and Deeper Phylogenetic Coverage for Scoring of Eukaryotic, Prokaryotic, and Viral Genomes. Mol. Biol. Evol. 2021, 38, 4647–4654. [Google Scholar] [CrossRef]
  22. Trapnell, C.; Williams, B.A.; Pertea, G.; Mortazavi, A.; Kwan, G.; Van Baren, M.J.; Salzberg, S.L.; Wold, B.J.; Pachter, L. Transcript assembly and quantification by RNA-Seq reveals unannotated transcripts and isoform switching during cell differentiation. Nat. Biotechnol. 2010, 28, 511–515. [Google Scholar] [CrossRef]
  23. Tang, Y.; Ghosal, S.; Roy, A. Nonparametric bayesian estimation of positive false discovery rates. Biometrics 2007, 63, 1126–1134. [Google Scholar] [CrossRef]
  24. Love, M.I.; Huber, W.; Anders, S. Moderated estimation of fold change and dispersion for RNA-seq data with DESeq2. Genome Biol. 2014, 15, 550. [Google Scholar] [CrossRef]
  25. Young, M.D.; Wakefield, M.J.; Smyth, G.K.; Oshlack, A. Gene ontology analysis for RNA-seq: Accounting for selection bias. Genome Biol. 2010, 11, R14. [Google Scholar] [CrossRef] [PubMed]
  26. Kanehisa, M.; Araki, M.; Goto, S.; Hattori, M.; Hirakawa, M.; Itoh, M.; Katayama, T.; Kawashima, S.; Okuda, S.; Tokimatsu, T.; et al. KEGG for linking genomes to life and the environment. Nucleic Acids Res. 2008, 36, D480–D484. [Google Scholar] [CrossRef] [PubMed]
  27. Chin, C.-H.; Chen, S.-H.; Wu, H.-H.; Ho, C.-W.; Ko, M.-T.; Lin, C.-Y. cytoHubba: Identifying hub objects and sub-networks from complex interactome. BMC Syst. Biol. 2014, 8 (Suppl. S4), S11. [Google Scholar] [CrossRef]
  28. Kim, T.K.; Waldman, J.; Ibanez-Carrasco, F.; Tirloni, L.; Waltero, C.; Calixo, C.; Braz, G.R.; Mulenga, A.; Junior, I.d.S.V.; Logullo, C. Stable internal reference genes for quantitative RT-PCR analyses in Rhipicephalus microplus during embryogenesis. Ticks Tick-Borne Dis. 2023, 14, 102251. [Google Scholar] [CrossRef]
  29. Chinzei, Y.; Minoura, H. Host immunoglobulin G titre and antibody activity in haemolymph of the tick, Ornithodoros moubata. Med. Vet. Entomol. 1987, 1, 409–416. [Google Scholar] [CrossRef]
  30. Galay, R.L.; Matsuo, T.; Hernandez, E.P.; Talactac, M.R.; Kusakisako, K.; Umemiya-Shirafuji, R.; Mochizuki, M.; Fujisaki, K.; Tanaka, T. Immunofluorescent detection in the ovary of host antibodies against a secretory ferritin injected into female Haemaphysalis longicornis ticks. Parasitol. Int. 2018, 67, 119–122. [Google Scholar] [CrossRef] [PubMed]
  31. Tellam, R.; Kemp, D.; Riding, G.; Briscoe, S.; Smith, D.; Sharp, P.; Irving, D.; Willadsen, P. Reduced oviposition of Boophilus microplus feeding on sheep vaccinated with vitellin. Vet. Parasitol. 2002, 103, 141–156. [Google Scholar] [CrossRef] [PubMed]
  32. Zhou, J.; Liao, M.; Hatta, T.; Tanaka, M.; Xuan, X.; Fujisaki, K. Identification of a follistatin-related protein from the tick Haemaphysalis longicornis and its effect on tick oviposition. Gene 2006, 372, 191–198. [Google Scholar] [CrossRef] [PubMed]
  33. Hussein, H.E.; Johnson, W.C.; Taus, N.S.; Suarez, C.E.; Scoles, G.A.; Ueti, M.W. Silencing expression of the Rhipicephalus microplus vitellogenin receptor gene blocks Babesia bovis transmission and interferes with oocyte maturation. Parasites Vectors 2019, 12, 7. [Google Scholar] [CrossRef]
  34. Domingues, L.N.; Bendele, K.G.; Bodine, D.M.; Halos, L.; Cutolo, A.A.; Liebstein, M.; Widener, J.; Figueiredo, M.; Moreno, Y.; Epe, C.; et al. A reverse vaccinology approach identified novel recombinant tick proteins with protective efficacy against Rhipicephalus microplus infestation. Ticks Tick-Borne Dis. 2024, 15, 102403. [Google Scholar] [CrossRef]
  35. Parthasarathi, B.C.; Kumar, B.; Bhure, S.K.; Sharma, A.K.; Manisha; Nagar, G.; Kumar, S.; Nandi, A.; Manjunathachar, H.V.; Chigure, G.M.; et al. Co-Immunization Efficacy of Recombinant Antigens against Rhipicephalus microplus and Hyalomma anatolicumTick Infestations. Pathogens 2023, 12, 433. [Google Scholar] [CrossRef]
  36. El Shoura, S.M.; Banaja, A.A.; Roshdy, M.A. Fine structure of the developing oocytes in adult Argas (Persicargas) arboreus (Ixodoidea: Argasidae). Exp. Appl. Acarol. 1989, 6, 143–156. [Google Scholar] [CrossRef]
  37. Le Gall, V.L.; Klafke, G.M.; Torres, T.T. Detoxification mechanisms involved in ivermectin resistance in the cattle tick, Rhipicephalus (Boophilus) microplus. Sci. Rep. 2018, 8, 12401. [Google Scholar] [CrossRef]
  38. Leyria, J.; Orchard, I.; Lange, A.B. The involvement of insulin/ToR signaling pathway in reproductive performance of Rhodnius prolixus. Insect Biochem. Mol. Biol. 2021, 130, 103526. [Google Scholar] [CrossRef]
  39. Valanne, S.; Wang, J.-H.; Rämet, M. The Drosophila Toll signaling pathway. J. Immunol. 2011, 186, 649–656. [Google Scholar] [CrossRef] [PubMed]
  40. Franta, Z.; Frantová, H.; Konvičková, J.; Horn, M.; Sojka, D.; Mareš, M.; Kopáček, P. Dynamics of digestive proteolytic system during blood feeding of the hard tick Ixodes ricinus. Parasites Vectors 2010, 3, 119. [Google Scholar] [CrossRef] [PubMed]
  41. Yu, Z.; Pei, T.; Shi, X.; Nwanade, C.F.; Bing, Z.; Gao, Z.; Meng, J.; Li, L.; Liu, J. The functions of DNA methyltransferases during the feeding and development of Haemaphysalis longicornis are potentially associated with lysosome pathways. BMC Genom. 2024, 25, 1109. [Google Scholar] [CrossRef] [PubMed]
  42. Sabadin, G.A.; Parizi, L.F.; Kiio, I.; Xavier, M.A.; Matos, R.d.S.; Camargo-Mathias, M.I.; Githaka, N.W.; Nene, V.; Vaz, I.d.S. Effect of recombinant glutathione S-transferase as vaccine antigen against Rhipicephalus appendiculatus and Rhipicephalus sanguineus infestation. Vaccine 2017, 35, 6649–6656. [Google Scholar] [CrossRef]
  43. Ndawula, C.; Xavier, M.A.; Villavicencio, B.; Lopes, F.C.; Juliano, M.A.; Parizi, L.F.; Verli, H.; Vaz, I.d.S.; Ligabue-Braun, R. Prediction, mapping and validation of tick glutathione S-transferase B-cell epitopes. Ticks Tick-Borne Dis. 2020, 11, 101445. [Google Scholar] [CrossRef]
  44. Nagan, N.; A Zoeller, R. Plasmalogens: Biosynthesis and functions. Prog. Lipid Res. 2001, 40, 199–229. [Google Scholar] [CrossRef]
  45. Ohanian, J.; Ohanian, V. Sphingolipids in mammalian cell signalling. Cell. Mol. Life Sci. 2001, 58, 2053–2068. [Google Scholar] [CrossRef]
  46. Xavier, M.A.; Tirloni, L.; Pinto, A.F.M.; Diedrich, J.K.; Yates, J.R.; Mulenga, A.; Logullo, C.; Vaz, I.d.S.; Seixas, A.; Termignoni, C. A proteomic insight into vitellogenesis during tick ovary maturation. Sci. Rep. 2018, 8, 4698. [Google Scholar] [CrossRef]
  47. Oleaga, A.; Soriano, B.; Llorens, C.; Pérez-Sánchez, R.; Caimano, M.J. Sialotranscriptomics of the argasid tick Ornithodoros moubata along the trophogonic cycle. PLoS Neglected Trop. Dis. 2021, 15, e0009105. [Google Scholar] [CrossRef]
  48. Verma, J. Antiviral Mechanism of Serine Protease in Various Insects. In Trends in Insect Molecular Biology and Biotechnology; Kumar, D., Gong, C., Eds.; Springer International Publishing: Cham, Switzerland, 2018; pp. 143–161. [Google Scholar]
  49. LeMosy, E.K.; Leclerc, C.L.; Hashimoto, C. Biochemical defects of mutant nudel alleles causing early developmental arrest or dorsalization of the Drosophila embryo. Genetics 2000, 154, 247–257. [Google Scholar] [CrossRef]
  50. Zou, P.; Wu, L.; Wen, S.; Pei, Y.; Hu, Z.; Zuo, Y. Disruption of Spodoptera exigua serine protease 2 (Ser2) results in male sterility by CRISPR/Cas9 technology. Pest Manag. Sci. 2025, 81, 498–506. [Google Scholar] [CrossRef] [PubMed]
  51. Zhang, P.; Jialaliding, Z.; Gu, J.; Merchant, A.; Zhang, Q.; Zhou, X. Knockout of ovary serine protease Leads to Ovary Deformation and Female Sterility in the Asian Corn Borer, Ostrinia furnacalis. Int. J. Mol. Sci. 2023, 24, 16311. [Google Scholar] [CrossRef] [PubMed]
  52. Asad, M.; Liao, J.; Chen, J.; Munir, F.; Pang, S.; Abbas, A.N.; Yang, G. Exploring the role of the ovary-serine protease gene in the female fertility of the diamondback moth using CRISPR/Cas9. Pest Manag. Sci. 2024, 80, 3194–3206. [Google Scholar] [CrossRef] [PubMed]
  53. Xu, X.; Bi, H.; Wang, Y.; Li, X.; Xu, J.; Liu, Z.; He, L.; Li, K.; Huang, Y. Disruption of the ovarian serine protease (Osp) gene causes female sterility in Bombyx mori and Spodoptera litura. Pest Manag. Sci. 2020, 76, 1245–1255. [Google Scholar] [CrossRef]
  54. Xu, X.; Wang, Y.; Chen, J.; Du, X.; Yao, L.; Xu, J.; Zhang, Y.; Huang, Y.; Wang, Y. Mutation of Serine protease 1 Induces Male Sterility in Bombyx mori. Front. Physiol. 2022, 13, 828859. [Google Scholar] [CrossRef] [PubMed]
  55. Anisuzzaman; Islam, M.K.; Alim, M.A.; Miyoshi, T.; Hatta, T.; Yamaji, K.; Matsumoto, Y.; Fujisaki, K.; Tsuji, N. Longistatin is an unconventional serine protease and induces protective immunity against tick infestation. Mol. Biochem. Parasitol. 2012, 182, 45–53. [Google Scholar] [CrossRef] [PubMed]
  56. Costa, G.C.; Silva, F.A.; Manzato, V.M.; Torquato, R.J.S.; Gonzalez, Y.G.; Parizi, L.F.; Junior, I.d.S.V.; Tanaka, A.S. A multiepitope chimeric antigen from Rhipicephalus microplus-secreted salivary proteins elicits anti-tick protective antibodies in rabbit. Vet. Parasitol. 2023, 318, 109932. [Google Scholar] [CrossRef]
  57. Camillo, L.d.M.B.; Ferreira, G.C.; Duran, A.F.A.; da Silva, F.R.S.; Garcia, W.; Scott, A.L.; Sasaki, S.D. Structural modelling and thermostability of a serine protease inhibitor belonging to the Kunitz-BPTI family from the Rhipicephalus microplus tick. Biochimie 2021, 181, 226–233. [Google Scholar] [CrossRef]
  58. Xu, Z.; Yan, Y.; Cao, J.; Zhou, Y.; Zhang, H.; Xu, Q.; Zhou, J. A family of serine protease inhibitors (serpins) and its expression profiles in the ovaries of Rhipicephalus haemaphysaloides. Infect. Genet. Evol. 2020, 84, 104346. [Google Scholar] [CrossRef]
  59. Liu, X.Y.; de la Fuente, J.; Cote, M.; Galindo, R.C.; Moutailler, S.; Vayssier-Taussat, M.; Bonnet, S.I.; Vinetz, J.M. IrSPI, a tick serine protease inhibitor involved in tick feeding and Bartonella henselae infection. PLoS Neglected Trop. Dis. 2014, 8, e2993. [Google Scholar] [CrossRef]
  60. Lu, J.; Wang, K.; Gao, Z.; Zhang, S.; Li, H.; Shi, Y.; Song, X.; Liu, J.; Yu, Z.; Yang, X. Doenitin-1: A novel Kunitz family protein with versatile functions during feeding and reproduction of the tick Haemaphysalis doenitzi. Front. Vet. Sci. 2022, 9, 872244. [Google Scholar] [CrossRef]
  61. Chinzei, Y. Quantitative changes of vitellogenin and vitellin in adult female ticks, Ornithodoros moubata, during vitellogenesis. Mie Med. J. 1983, 27, 117–127. [Google Scholar]
  62. Logullo, C.; Moraes, J.; Dansa-Petretski, M.; Vaz, I.; Masuda, A.; Sorgine, M.; Braz, G.; Masuda, H.; Oliveira, P. Binding and storage of heme by vitellin from the cattle tick, Boophilus microplus. Insect Biochem. Mol. Biol. 2002, 32, 1805–1811. [Google Scholar] [CrossRef]
  63. Kuniyori, M.; Sato, N.; Yokoyama, N.; Kawazu, S.-I.; Xuan, X.; Suzuki, H.; Fujisaki, K.; Umemiya-Shirafuji, R. Vitellogenin-2 Accumulation in the Fat Body and Hemolymph of Babesia-Infected Haemaphysalis longicornis Ticks. Front. Cell. Infect. Microbiol. 2022, 12, 908142. [Google Scholar] [CrossRef] [PubMed]
  64. He, X.-M.; Liu, L.; Cheng, T.-Y. HSC70 from Haemaphysalis flava (Acari: Ixodidae) exerts anticoagulation activity in vitro. Ticks Tick-Borne Dis. 2019, 10, 170–175. [Google Scholar] [CrossRef]
  65. Wang, F.; Wang, Y.; Wang, G.; Zhang, H.; Kuang, C.; Zhou, Y.; Cao, J.; Zhou, J. Ovary Proteome Analysis Reveals RH36 Regulates Reproduction via Vitellin Uptake Mediated by HSP70 Protein in Hard Ticks. Front. Cell. Infect. Microbiol. 2020, 10, 93. [Google Scholar] [CrossRef] [PubMed]
  66. Xu, J.; Shu, J.; Zhang, Q. Expression of the Tribolium castaneum (Coleoptera: Tenebrionidae) hsp83 gene and its relation to oogenesis during ovarian maturation. J. Genet. Genom. 2010, 37, 513–522. [Google Scholar] [CrossRef]
  67. Myllyharju, J. Prolyl 4-hydroxylases, the key enzymes of collagen biosynthesis. Matrix Biol. 2003, 22, 15–24. [Google Scholar] [CrossRef]
  68. Winter, A.D.; McCormack, G.; Page, A.P. Protein disulfide isomerase activity is essential for viability and extracellular matrix formation in the nematode Caenorhabditis elegans. Dev. Biol. 2007, 308, 449–461. [Google Scholar] [CrossRef] [PubMed]
  69. Tang, X.; Cui, Y.; Namarra, U.; Tian, X.; Rivas-Giorgi, F.; Fikrig, E.; Norris, S.J. Dual roles for a tick protein disulfide isomerase during the life cycle of the Lyme disease agent. mBio 2024, 15, e0175424. [Google Scholar] [CrossRef]
  70. Elfvin, M.; Levine, R.J.; Dewey, M.M. Paramyosin in invertebrate muscles. I. Identification and localization. J. Cell Biol. 1976, 71, 261–272. [Google Scholar] [CrossRef]
  71. Yang, J.; Yang, Y.; Gu, Y.; Li, Q.; Wei, J.; Wang, S.; Boireau, P.; Zhu, X. Identification and characterization of a full-length cDNA encoding paramyosin of Trichinella spiralis. Biochem. Biophys. Res. Commun. 2008, 365, 528–533. [Google Scholar] [CrossRef]
  72. McManus, D.P.; Wong, J.Y.; Zhou, J.; Cai, C.; Zeng, Q.; Smyth, D.; Li, Y.; Kalinna, B.H.; Duke, M.J.; Yi, X. Recombinant paramyosin (rec-Sj-97) tested for immunogenicity and vaccine efficacy against Schistosoma japonicum in mice and water buffaloes. Vaccine 2001, 20, 870–878. [Google Scholar] [CrossRef]
  73. Gazarian, K.G.; Solis, C.F.; Gazarian, T.G.; Rowley, M.; Laclette, J.P. Synthetic peptide-targeted selection of phage display mimotopes highlights immunogenic features of α-helical vs non-helical epitopes of Taenia solium paramyosin: Implications for parasite- and host-protective roles of the protein. Peptides 2012, 34, 232–241. [Google Scholar] [CrossRef]
  74. Nisbet, A.J.; Huntley, J.F.; MacKELLAR, A.; Sparks, N.; Mcdevitt, R. A house dust mite allergen homologue from poultry red mite Dermanyssus gallinae (De Geer). Parasite Immunol. 2006, 28, 401–405. [Google Scholar] [CrossRef]
  75. Wu, P.-X.; Cui, X.-J.; Cao, M.-X.; Lv, L.-H.; Dong, H.-M.; Xiao, S.-W.; Liu, J.-Z.; Hu, Y.-H. Evaluation on two types of paramyosin vaccines for the control of Haemaphysalis longicornis infestations in rabbits. Parasites Vectors 2021, 14, 309. [Google Scholar] [CrossRef]
  76. Fukumoto, S.; Sakaguchi, T.; You, M.; Xuan, X.; Fujisaki, K. Tick troponin I-like molecule is a potent inhibitor for angiogenesis. Microvasc. Res. 2006, 71, 218–221. [Google Scholar] [CrossRef]
  77. You, M.-J. Immunization effect of recombinant P27/30 protein expressed in Escherichia coli against the hard tick Haemaphysalis longicornis (Acari: Ixodidae) in rabbits. Korean J. Parasitol. 2004, 42, 195–200. [Google Scholar] [CrossRef] [PubMed]
  78. Pasini, M.E.; Intra, J.; Gomulski, L.M.; Calvenzani, V.; Petroni, K.; Briani, F.; Perotti, M.E. Identification and expression profiling of Ceratitis capitata genes coding for β-hexosaminidases. Gene 2011, 473, 44–56. [Google Scholar] [CrossRef] [PubMed]
  79. Liu, T.; Zhang, H.; Liu, F.; Wu, Q.; Shen, X.; Yang, Q. Structural determinants of an insect beta-N-Acetyl-D-hexosaminidase specialized as a chitinolytic enzyme. J. Biol. Chem. 2011, 286, 4049–4058. [Google Scholar] [CrossRef]
  80. Del Pino, F.A.; Brandelli, A.; Gonzales, J.C.; Henriques, J.A.; Dewes, H. Effect of antibodies against beta-N-acetylhexosaminidase on reproductive efficiency of the bovine tick Boophilus microplus. Vet. Parasitol. 1998, 79, 247–255. [Google Scholar] [CrossRef] [PubMed]
Figure 1. Volcano maps and hierarchical clustering analysis showing the expression profiles of genes between OV1 and OV0 (A,B), as well as OV2 and OV1 (C,D), in A. persicus. In the volcano plots (A,B), red dots represent upregulated genes, green dots indicate downregulated genes, and blue dots represent genes with no significant differences. The differentially expressed genes were selected using the threshold padj<0.05 and| log2(foldchange)| > 1.
Genes 16 01107 g001
Figure 2. Gene ontology (GO) enriched terms associated with the DEGs in OV1 vs. OV0 (A,B) and OV2 vs. OV1 (C,D) of ovaries from A. persicus. (A,C) Up-regulated DEGs, (B,D) down-regulated DEGs. The top 20 most significant GO terms were illustrated for each compared pair. The mark symbol * indicates significantly enriched GO terms assigned to the differentially expressed transcripts (padj < 0.05). The X-axis represents the −log10 (p-value) of the enrichment analysis. The Y-axis indicates the GO terms, with “n” in parentheses representing the number of enriched genes.
Genes 16 01107 g002
Figure 3. Statistics of the top 20 KEGG pathways for the DEGs in OV1 vs. OV0 (A,B) and OV2 vs. OV1 (C,D) of ovaries from A. persicus. (A,C) Up-regulated DEGs, (B,D) down-regulated DEGs. The top 20 most significant KEGG terms were illustrated for each compared pair. The mark symbol * indicates significantly enriched KEGG terms assigned to the differentially expressed transcripts (padj < 0.05). The X-axis represents the −log10 (p-value) of the enrichment analysis. The Y-axis indicates the KEGG pathway, with “n” in parentheses representing the number of enriched genes.
Genes 16 01107 g003
Figure 4. Potentially functional genes compose the interactive network between OV1 and OV0 ovaries. The red and green represent up-regulation and down-regulation, respectively. Larger node sizes indicate higher degree values.
Genes 16 01107 g004
Figure 5. Potentially functional genes compose the interactive network between OV2 and OV1 ovaries. The red and green represent up-regulation and down-regulation, respectively. Larger node sizes indicate higher degree values.
Genes 16 01107 g005
Table 1. Primer sequence for qRT-PCR.
Gene IDGeneNucleotide Sequence (5′–3′)Size (bp)
Cluster-2778.22975paramyosinF: CAACCGCCGCATTCACGAGTAC123
R: CGTTGGCACTTGGCTTCCTCCT
Cluster-2778.29718Fatty acid-binding proteinF: TAGGATGGGGCGGAAATGTG125
R: CTTCATCGTCCACTGGTCCC
Cluster-2778.46089VitellogeninF: TGGCAGCAACTCCTCCGTCAAC194
R: TGGTCAGCACAAGTGGCGACAA
Cluster-2778.29372Heat shock protein 70F: CGACATGGACGCCAACGGTATC139
R: CTGTTCAGCCTCCTTCAGCATCC
Cluster-2778.8293chitinaseF: GCTCTGAAATCGAGCGCAAG138
R: CAGACAGCGAAGTGTTTGCC
Cluster-2778.17153aquaporinF: CGCCCTGGTGTACCTCATTT106
R: GGGGTACGTAGCGAAGATGG
Cluster-2778.23455ferritin heavy-chainF: AGACCCTGGATGGAGATGACT97
R: CAAGGTCAACCACAGAAGAGC
Reference 1β-ActinF: AGAGCAAGCGTGGCATCCTGA109
R: CGCAGCTCGTTGTAGAAGGTGT
Reference 2GAPDHF: ATGAAGCCTGCCCAGATTCC122
R: ACCACCTTTTTGGCTCCTCC
Table 2. Statistical results of ovarian transcriptome assembly data.
SummaryNumber of GenesPercentage (%)
Statistics of transcriptome assembly
Total transcripts163,186 
Total Unigenes63,500 
Longest Unigene (bp)22,653 
Shortest Unigene (bp)301 
N50 transcript length (bp)2111 
N50 Unigene length (bp)1693 
GC_pct 51.83–54.37 (mean = 53.61)
Statistics of transcriptome annotation
Annotated in NR24,79639.04
Annotated in NT935314.72
Annotated in KEGG10,88717.14
Annotated in SwissProt16,80726.46
Annotated in PFAM21,55533.94
Annotated in GO21,55233.94
Annotated in KOG/COG885513.94
Annotated in all databases33055.2
Annotated in at least one database32,44051.08
Total number of CDS29,69546.76
Number of transdecoder-predicted CDS985933.2
Number of CDS searched in databases19,83666.8
Note: NR (NCBI non-redundant protein sequences), NT (NCBI nucleotide sequences), KEGG (Kyoto Encyclopedia of Genes and Genomes), SwissProt (a manually annotated and reviewed protein sequence database), PFAM (Protein family), GO (Gene Ontology), KOG/COG (COG: Clusters of Orthologous Groups of proteins; KOG: euKaryotic Ortholog Groups), CDS (coding sequence).
Table 3. The top 10 up-regulated and top 10 down-regulated DEGs in the A. persicus ovarian transcriptome during the blood-feeding period (OV1 vs. OV0).
GeneIDFPKM (OV0)FPKM (OV1)log2FCpadjNR Description
Cluster-2778.4096807.988.01121.58 × 10−10serine protease
Cluster-2778.819502.6537.50784.66 × 10−9--
Cluster-2778.103520.0739.82677.16249.35 × 10−9serine protease
Cluster-2778.4181608.84676.93242.55 × 10−7--
Cluster-2778.664802.616.87122.67 × 10−7--
Cluster-2778.75800.033.666.80667.71 × 10−8serine protease
Cluster-2778.4065202.40676.71531.29 × 10−6--
Cluster-2778.3822002.336.4613.51 × 10−6--
Cluster-2778.92890.2219.0676.43527.43 × 10−113Na(+)/citrate cotransporter
Cluster-2778.827201.686.38754.76 × 10−6--
Cluster-2778.378730.4030−5.72590.0002864--
Cluster-2778.153720.9830−5.75560.00052655tcb1
Cluster-2778.382612.220−5.99019.37 × 10−5--
Cluster-2778.118772.2470−6.30439.11 × 10−6--
Cluster-2778.383511.590−6.41199.02 × 10−6cubilin
Cluster-2778.172802.020−6.57291.98 × 10−6MPV17L
Cluster-2778.154501.7030−6.6261.45 × 10−6 
Cluster-2778.229203.4430−6.65831.61 × 10−6--
Cluster-2778.210976.7630.0567−6.71361.46 × 10−7Allergen
Cluster-13619.00.8230−6.73091.21 × 10−6--
Note: log2FC: log2(FoldChange); a positive value of log2FC suggests gene up-regulation, while a negative value indicates gene down-regulation. The symbol “--” signifies that the gene is not annotated in the NR database.
Table 4. The top 10 up-regulated and top 10 down-regulated DEGs in the A. persicus ovarian transcriptome during the preoviposition period (OV2 vs. OV1).
GeneIDFPKM (OV1)FPKM (OV2)log2FCpadjNR Description
Cluster-2778.432420.07646.64313.1632.44 × 10−90--
Cluster-2778.118880.5931205.4410.980--
Cluster-2778.428530.13244.06310.931.30 × 10−120--
Cluster-2778.231880.04370.45710.6191.97 × 10−36--
Cluster-2778.181390.237266.78310.1461.50 × 10−49--
Cluster-2778.98490208.2539.9983.62 × 10−16--
Cluster-2778.460890.0543.6939.94471.30 × 10−126vitellogenin
Cluster-2778.316311.271224.019.92750--
Cluster-2778.1351029.9279.9244.18 × 10−16monotonin
Cluster-2778.1477065.359.67531.31 × 10−15Kunitz-type serine protease inhibitors
Cluster-2778.407301.210−5.62850.00024--
Cluster-2778.86901.8370−5.63490.000274--
Cluster-2778.363691.6270−5.75330.000128--
Cluster-2797.03.1570−5.77660.000137--
Cluster-2987.01.2530−5.81110.000108--
Cluster-2778.412211.4870−5.81520.000175--
Cluster-2778.208304.4170−5.96645.37 × 10−5--
Cluster-2778.408431.2930−6.14182.58 × 10−5--
Cluster-2778.406522.4070−6.70341.59 × 10−6--
Cluster-2778.75803.660.033−6.79428.86 × 10−8serine protease
Note: log2FC: log2(FoldChange); a positive value of log2FC suggests gene up-regulation, while a negative value indicates gene down-regulation. The symbol “--” signifies that the gene is not annotated in the NR database.
Table 5. Hub genes related to ovarian development during the blood-feeding period (OV1 vs. OV0).
Gene IDNameScoreFPKMlog2FCAnnotation
OV0OV1
Cluster-2778.209LRRK1392.20.057−5.0273leucine-rich repeat serine/threonine-protein kinase 1
Cluster-2778.34485RPS3A514.786.96−1.068440S ribosomal protein S3a
Cluster-2778.38419H450.912.331.3937Histone 4
Cluster-2778.13663FabG43.5710.791.62863-oxoacyl-[acyl carrier protein] reductase
Cluster-2778.24606FUM42.340.62−1.8773fumarase
Cluster-2778.21121PIK3Cb41.770.49−1.755phosphatidylinositol 4,5-bisphosphate 3-kinase catalytic subunit beta isoform
Cluster-2778.34617PDI335.2310.5571.0391protein disulfide isomerase 3
Cluster-2778.26261PDI3126.8260.43−1.0714protein disulfide isomerase
Cluster-2778.24796PTEN32.8391.6946phosphatidylinositol triP phosphatase
Cluster-2778.29372HSP703106.83218.941.0625heat shock protein 70
Note: “Score indicates the degree of nodes in the PPI network; log2FC: log2FoldChange.
Table 6. Hub genes related to ovarian development during the preoviposition period (OV2 vs. OV1).
Gene IDNameScoreFPKMlog2FCAnnotation
OV1OV2
Cluster-2778.23724APRT1413.5734.251.3188adenine phosphoribosyltransferase
Cluster-2778.29659RPL13A14437.09876.261.0599ribosomal protein L13A
Cluster-2778.34298TnI133.3115.872.2441troponin I protein
Cluster-2778.22975PRM123.9327.592.7926paramyosin
Cluster-2778.30915MyHC122.6416.042.5853myosin heavy chain
Cluster-2778.38419H3122.31.1−1.1013Histone 3
Cluster-2778.17397HEX (HEXB)111.388.192.5592beta-hexosaminidase subunit beta
Cluster-2778.32843HEX (HEXA)116.1329.882.2908beta-hexosaminidase subunit alpha
Cluster-2778.33259ENH102.536.921.4376adaptor protein enigma
Cluster-2778.26644HSDL2101.553.371.1192hydroxysteroid dehydrogenase protein 2
Note: “Score” indicates the degree of nodes in the PPI network; log2FC: log2FoldChange.
Disclaimer/Publisher’s Note: The statements, opinions and data contained in all publications are solely those of the individual author(s) and contributor(s) and not of MDPI and/or the editor(s). MDPI and/or the editor(s) disclaim responsibility for any injury to people or property resulting from any ideas, methods, instructions or products referred to in the content.