Article

Comparative Genomics and Functional Profiling Reveal Lineage-Specific Metabolic Adaptations in Globally Emerging Fluoroquinolone-Resistant Salmonella Kentucky ST198

1
School of Veterinary Medicine, Texas Tech University, Amarillo, TX 79106, USA
2
Animal Disease Diagnostic Laboratory, Department of Comparative Pathobiology, College of Veterinary Medicine, Purdue University, West Lafayette, IN 47907, USA
3
United States National Poultry Research Center, Agriculture Research Service, United States Department of Agriculture, Athens, GA 30605, USA
4
Environmental Microbial and Food Safety Laboratory, Beltsville Agricultural Research Center, Agricultural Research Service, United States Department of Agriculture, Beltsville, MD 20705, USA
*
Author to whom correspondence should be addressed.
Genes 2025, 16(9), 1051; https://doi.org/10.3390/genes16091051
Submission received: 17 July 2025 / Revised: 26 August 2025 / Accepted: 27 August 2025 / Published: 8 September 2025

Abstract

Background: Salmonella Kentucky comprises two major lineages, ST152 and fluoroquinolone-resistant (FluR) ST198, which have diverged genotypically and phenotypically along distinct evolutionary and epidemiological trajectories. ST198 is linked to global human disease, while ST152 is primarily animal-associated in the U.S. We hypothesized that lineage-specific metabolic adaptations contribute to their differing host associations and pathogenicity. Methods: We performed comparative metabolic profiling of ST198 (n = 3) and ST152 (n = 4) strains across 948 substrates and environmental conditions. Growth assays tested the ability of these lineages and other non-typhoidal Salmonella (NTS) serovars (n = 5) to utilize myo-inositol and lactulose as sole carbon sources. Comparative genomic analyses of 294 ST198, 173 ST152, and 1300 other NTS serovars identified nutrient utilization genes. Results: ST198 exhibited significantly higher respiratory activity and broader metabolic versatility across carbon, nitrogen/sulfur sources, and stress conditions. The canonical iol gene cluster for myo-inositol catabolism was conserved in ST198 but absent in ST152, which nonetheless showed weak growth on myo-inositol, suggesting an alternative metabolic pathway for myo-inositol may exist. We also report for the first time that, despite lineage-specific differences in metabolic efficiency, multiple NTS serovars, including S. Kentucky, can metabolize lactulose, a synthetic disaccharide traditionally associated with beneficial gut microbes. These results suggest the potential existence of a novel lactulose metabolic pathway in NTS. Conclusions: These findings highlight ST198’s metabolic adaptability and reveal novel metabolic capacities in NTS. A mechanistic understanding of nutrient utilization pathways, particularly of myo-inositol and lactulose, will provide novel insights into the mechanisms underlying nutrient metabolism that likely modulate the ecological success and pathogenic potential of NTS in human and animal hosts.

1. Introduction

Non-typhoidal Salmonella (NTS), a genetically and antigenically diverse enteric pathogen with >1500 serotypes, is a leading cause of foodborne enteric illness and a significant contributor to antimicrobial resistance (AMR) worldwide, responsible for ~150 million infections and 60,000 deaths each year [1]. Among the various NTS serovars, Salmonella Kentucky (S. Kentucky) is frequently isolated from food animals in the United States, particularly chicken, turkey, swine, and cattle [2,3,4]. Two predominant genetic lineages of S. Kentucky, ST198 and ST152, exhibit distinct epidemiological and genetic characteristics [3,4,5,6,7,8,9]. ST152 is frequently isolated from U.S. food animals but is rarely associated with human illness. ST198 comprises two sub-clades: fluoroquinolone-susceptible (FluS) ST198.1, primarily isolated from U.S. food animals [2,4,10], and fluoroquinolone-resistant (FluR) ST198.2, predominantly isolated from food animals in North Africa, the Middle East, Europe, and South Asia, and often identified as a cause of human illnesses, including U.S. travelers returning from international travel [2,4,5,8,9,11].
The FluR ST198.2 sub-clade (hereafter referred to as FluR ST198) has been increasingly detected in human clinical cases globally, posing a significant public health threat [7,12,13,14]. In North America, FluR ST198 is commonly associated with travel-associated illnesses, particularly among travelers returning from North Africa, the Middle East, and South Asia, and it is often linked to the consumption of poultry or poultry-related products [2,4,9]. Notably, FluR ST198 harbors two mutations in gyrA and three mutations in parC in the quinolone resistance-determining region (QRDR), which is concerning given that ciprofloxacin remains the first-line antibiotic for the treatment of NTS infections in humans worldwide [6,15]. Recently, FluR ST198 of S. Kentucky was implicated in a nosocomial infection in a hospitalized American black bear at a veterinary teaching hospital in New York [16], highlighting the potential risk this lineage poses to animal health, food safety, and public health in the USA.
We previously reported that FluR ST198 has undergone microevolution driven by the accumulation of lineage-specific mutations [2,9]. Similar microevolutionary changes in other Salmonella serotypes and multidrug-resistant (MDR) lineages of NTS serovars, such as S. Typhimurium ST213/ST313 and S. Enteritidis ST11, exhibit enhanced metabolic capacities, improved host adaptation, and pathogenicity [17,18,19]. However, whether lineage-specific mutations among ST152 and FluR ST198 have resulted in distinct metabolic capacities remains unknown. Understanding these differences could provide critical insights into the mechanisms driving emergence, pathogenicity, and niche-specific adaptation of FluR ST198.
In this study, we hypothesized that the globally emerging FluR ST198 and domestically prevalent ST152 lineages have genetically evolved to exhibit distinct metabolic capabilities. To test this hypothesis, we conducted metabolic fingerprinting of seven epidemiologically distinct strains of ST152 (n = 4) and FluR ST198 (n = 3) by measuring respiratory activity (RA) across 948 substrates and environmental conditions. Our results demonstrate that FluR ST198 consistently exhibits significantly higher (p < 0.01) RA than ST152 when utilizing several carbon and nitrogen/sulfur compounds as sole sources of energy. Notably, FluR ST198 showed markedly increased RA and growth in media supplemented with two gut-associated nutrients, lactulose and myo-inositol, commonly used as dietary supplements. We report that the myo-inositol-mediated metabolic fitness of FluR ST198 and several other NTS serovars is likely due to the conserved carriage of the myo-inositol catabolism gene cluster (iolCatGC), which is completely absent in the ST152 lineage and a few other NTS serovars. Furthermore, we report that different NTS, including FluR ST198, can efficiently metabolize lactulose as a sole energy source for growth in a serotype-independent manner, due to an unknown genetic mechanism. Together, these findings suggest that FluR ST198 has acquired distinct metabolic traits that may modulate its fitness, pathogenic potential, and capacity for global dissemination.

2. Materials and Methods

2.1. Strain Selection and Growth

A subset of seven well-characterized epidemiologically and genetically distinct strains of S. Kentucky ST152 (n = 4) and ST198 (n = 3) were used in this study [9]. All ST198 strains in this study were resistant to fluoroquinolones (FluR), exhibited multidrug resistance, and were isolated from individuals with travel histories to Asia, Africa, or the Middle East (Table 1). Conversely, all ST152 strains were fluoroquinolone-sensitive (FluS), with three strains isolated from poultry sources and one isolated from a human case without travel history outside the USA (Table 1). Five additional NTS strains representing clinically relevant serovars (S. Typhimurium, S. Hadar, S. Enteritidis, S. Montevideo, and S. Schwarzengrund) were also tested in individual growth kinetics experiments in this study [20]. All strains were revived from −80 °C storage by streaking on tryptic soy agar (TSA) followed by incubation at 37 °C for 16 h. Colonies grown on TSA were used for Phenotype Microarray and/or growth assays.

2.2. Comparative Metabolic Profiling of ST152 and FluR ST198

We performed comparative metabolic profiling of ST152 (n = 4) and FluR ST198 (n = 3) strains across 948 metabolic substrates and environmental conditions using Phenotype Microarray (PM) (Biolog, Hayward, CA, USA). The PM analysis included eight metabolic panels for carbon (PM-1-2), nitrogen (PM-3, PM-6-8), sulfur (PM-4), phosphorus (PM-4), and nutrient supplements (PM-5) as energy sources. Additionally, two sensitivity panels (PM-9 and PM-10) evaluated the sensitivity of strains to osmolytes, toxicities, and various pH conditions. Testing was performed following previously established protocols [21,22,23]. Each strain was inoculated onto PM-1 to PM-10 plates and incubated at 42 °C for 48 h. Respiratory activity (RA) was measured by the reduction in tetrazolium violet dye, with color change indicating cellular respiration and electron transport chain function. The data from PM tests were organized in Microsoft Excel (Table S1) and analyzed via hierarchical clustering (Euclidean distance, complete linkage) for each nutrient/condition using RStudio (R version 4.4.1). The RA differences between ST152 and FluR ST198 were compared using Student’s t-test, and a mean RA difference ≥ 50 units between ST152 and FluR ST198 with p < 0.01 was considered statistically significant [21,22,23]. The heatmaps for hierarchical clustering were generated using the pheatmap package within RStudio (version 4.4.1) [24].

2.3. Benchtop Growth Assay

To confirm the differential metabolic fitness traits between ST152 and FluR ST198 strains detected by the PM array, each strain was tested in a benchtop growth assay for its ability to utilize two representative carbon compounds, including myo-inositol and lactulose, at mammalian (37 °C) and avian (42 °C) physiological temperatures. Briefly, bacterial colonies were revived by streaking on TSA and incubated overnight at 37 °C. Next, colonies were resuspended in M9 broth (BD, Sparks, MD, USA) to a 0.5 McFarland standard, followed by serial 10-fold dilutions to achieve approximately 200 colony-forming units (CFU)/mL. Approximately 360 CFU of each strain was inoculated into 1.8 mL of M9 media (200 CFU/mL) in 96-well blocks supplemented with varying concentrations of lactulose (1, 10, and 20 mM) and myo-inositol (1, 10, and 20 mM) and incubated at 42 °C for 96 h. At 24 h intervals, 100 µL from each culture was withdrawn, followed by plating of 10-fold dilutions on TSA and incubation for 16 h at 37 °C to determine the CFUs at each time point. In each of the experiments, M9 broth supplemented with glucose (1, 10, and 20 mM) was used as a positive control, M9 broth without any nutrient supplementation was used as a negative control, and glucose (20 mM) without bacterial inoculation was used as a sterility control. To determine the growth of ST152 and FluR ST198 at mammalian physiological temperature (37 °C), a single concentration of lactulose (20 mM) or myo-inositol (20 mM) was used, and the CFU determinations were conducted up to 72 h. Growth in each metabolite and each concentration at both temperatures was tested in duplicates in three independent experiments. Growth assay results were expressed as log10 CFU/mL. The growth data were organized and analyzed using Microsoft Excel (Version 2408) and RStudio (R version 4.4.1). A log10 difference was calculated as the difference in the log10 CFU between the end-time-point (72 or 96 h) and the starting inoculum (0 h). Doubling times (Td) were calculated as previously described [22] using the formula t/(3.3 × log(b/B)), where t is the end time-point for Td calculation (96 h for 42 °C growth data and 72 h for 37 °C growth data), b is CFU at the endpoint (72 h or 96 h), and B is the initial inoculum (CFU at 0 h). Log10 and Td differences were calculated and compared using Student’s t-test. A p-value of <0.05 was considered statistically significant. To determine the ability of other NTS serovars to utilize myo-inositol and lactulose for growth, we tested five NTS strains representing the following serovars (S. Typhimurium, S. Infantis, S. Hadar, S. Enteritidis, S. Montevideo, and S. Schwarzengrund). These NTS strains were grown in M9 media supplemented with lactulose (20 mM) and myo-inositol (20 mM) by incubating at 37 °C for 72 h. The growth of each strain was determined by calculating the log10 increase at 72 h post-incubation.

2.4. Comparative Genomics Analysis

To identify and inventory lineage-specific genes likely associated with the differential metabolic potential of ST198 and ST152 lineages, pan-genome analysis of the 7 epidemiologically distinct strains of S. Kentucky ST152 (n = 4) and FluR ST198 (n = 3) used in this study was performed using PanExplorer followed by gene functional enrichment analysis [25]. Follow-up comparative genomics analysis focused on determining the genetic basis of myo-inositol and lactulose-mediated differential metabolic fitness of ST152 and FluR ST198. To determine the genetic basis of differential utilization of myo-inositol between ST152 and FluR ST198 strains, we compared the genomes of the ST152 and FluR ST198 strains used in this study to identify the iol gene cluster (iolCatGC) known to contribute to myo-inositol metabolism and growth of S. Typhimurium in the presence of myo-inositol as the sole energy source [26,27], using MultiGeneBlast version 1.1.13 [28]. To confirm whether differential carriage of the iol gene cluster was consistent across ST152 and ST198 lineages, we expanded genetic screening to the publicly available whole-genome sequences of 294 ST198 strains and 173 ST152 strains along with a few other STs, including ST314 (n = 14), ST2132 (n = 3), ST19 (n = 2), and ST32, ST64, ST166, ST318, ST639, and ST1679 (n = 1 each) (Table S2), using the compare region viewer tool of the Bacterial and Viral Bioinformatics Resource Center (BV-BRC) [29]. Finally, to determine carriage of the iol gene cluster among other NTS serovars, a total of 1300 complete high-quality genomes representing 106 different NTS serovars (Table S2) were evaluated using the compare region viewer tool of BV-BRC.
Lactulose metabolism is widespread among gut microbes and is typically attributed to glycoside hydrolases (GHs) that hydrolyze the β-1,4-glycosidic bond of lactulose into fermentable monosaccharides (e.g., fructose, galactose) [30,31,32,33]. However, lactulose metabolism by NTS has not been described, and its genetic basis remains unknown. Thus, to identify any gene encoding a putative GH protein likely involved in lactulose metabolism in Salmonella, we first searched through the genome of S. Kentucky strain PU131, a reference strain of FluR ST198 [15]. We then searched the candidate proteins against the CAZy database to identify putative glycoside transporters and β-galactosidases that can hydrolyze the β-1,4-glycosidic bond in lactulose and metabolize it to monosaccharides [31,32,34]. To determine the carriage of putative transporter and β-galactosidase among other Salmonella genomes, we screened the whole-genome sequences of 294 ST198 strains and 173 ST152 strains along with a few other STs, including ST314 (n = 14) and other STs (n = 11) of S. Kentucky and 1300 complete high-quality genomes, representing 106 NTS serovars (other than S. Kentucky) (Table S3).

2.5. RT-qPCR

RT-qPCR was conducted to confirm the upregulation of myo-inositol inducible genes (iolT1 and reiD) in NTS when grown in the presence of myo-inositol as the sole source of energy. Total RNA was extracted from a representative strain of S. Kentucky ST198 (PU61), which carries the iol gene cluster and also exhibited higher growth in the presence of myo-inositol as the sole energy source. Briefly, the PU61 strain was grown overnight in TSA at 37 °C. Next, ~108 CFU of this strain was resuspended in M9 media containing 20 mM of myo-inositol or glucose (control) and incubated at 37 °C for 6 h. After 6 h, ~109 CFUs were harvested by centrifugation at 10,000 RCF for 10 min at 4 °C for RNA extraction. Total RNA was extracted using the Direct-zol RNA Miniprep Plus Kit (Zymo Research, Irvine, CA, USA) following the manufacturer’s instructions with minor modifications, which included in-tube DNase treatment using Turbo DNase (Invitrogen, Waltham, MA, USA) followed by RNA clean up using the RNA Clean & Concentrator-25 (Zymo Research). An equal concentration (~820 ng) of total RNA was used to prepare cDNA using the High-Capacity cDNA Reverse Transcription Kit (Applied Biosystems, Waltham, MA, USA) according to the manufacturer’s protocol. Finally, 2 µL of cDNA and 800 nM of pre-designed primers (Table S4) for inositol catabolic genes (iolT1 and reiD) were used for qPCR using the PowerUp SYBR Master Mix (Applied Biosystems) with the following conditions: 1 cycle at 50 °C for 2 min, 1 cycle at 95°C for 2 min, 40 cycles at 95°C for 15 s, and 40 cycles at 60°C for 1 min. Cq values were obtained and compared with glucose as the reference condition. Each sample was tested in triplicate. Gene expression was analyzed using the ΔCq method, which represents the difference in Cq between the test condition (myo-inositol) and the control condition (glucose). Log2 fold change was computed as log2 (2−ΔCq), and the calculation was performed in Python (version 3.11.13) using the NumPy package. The null hypothesis tested was that the mean ΔCq = 0 (i.e., no change in expression relative to glucose). A p-value < 0.05 was considered statistically significant.

3. Results and Discussion

3.1. Differences in Metabolic Fitness Between ST152 and FluR ST198 Lineages

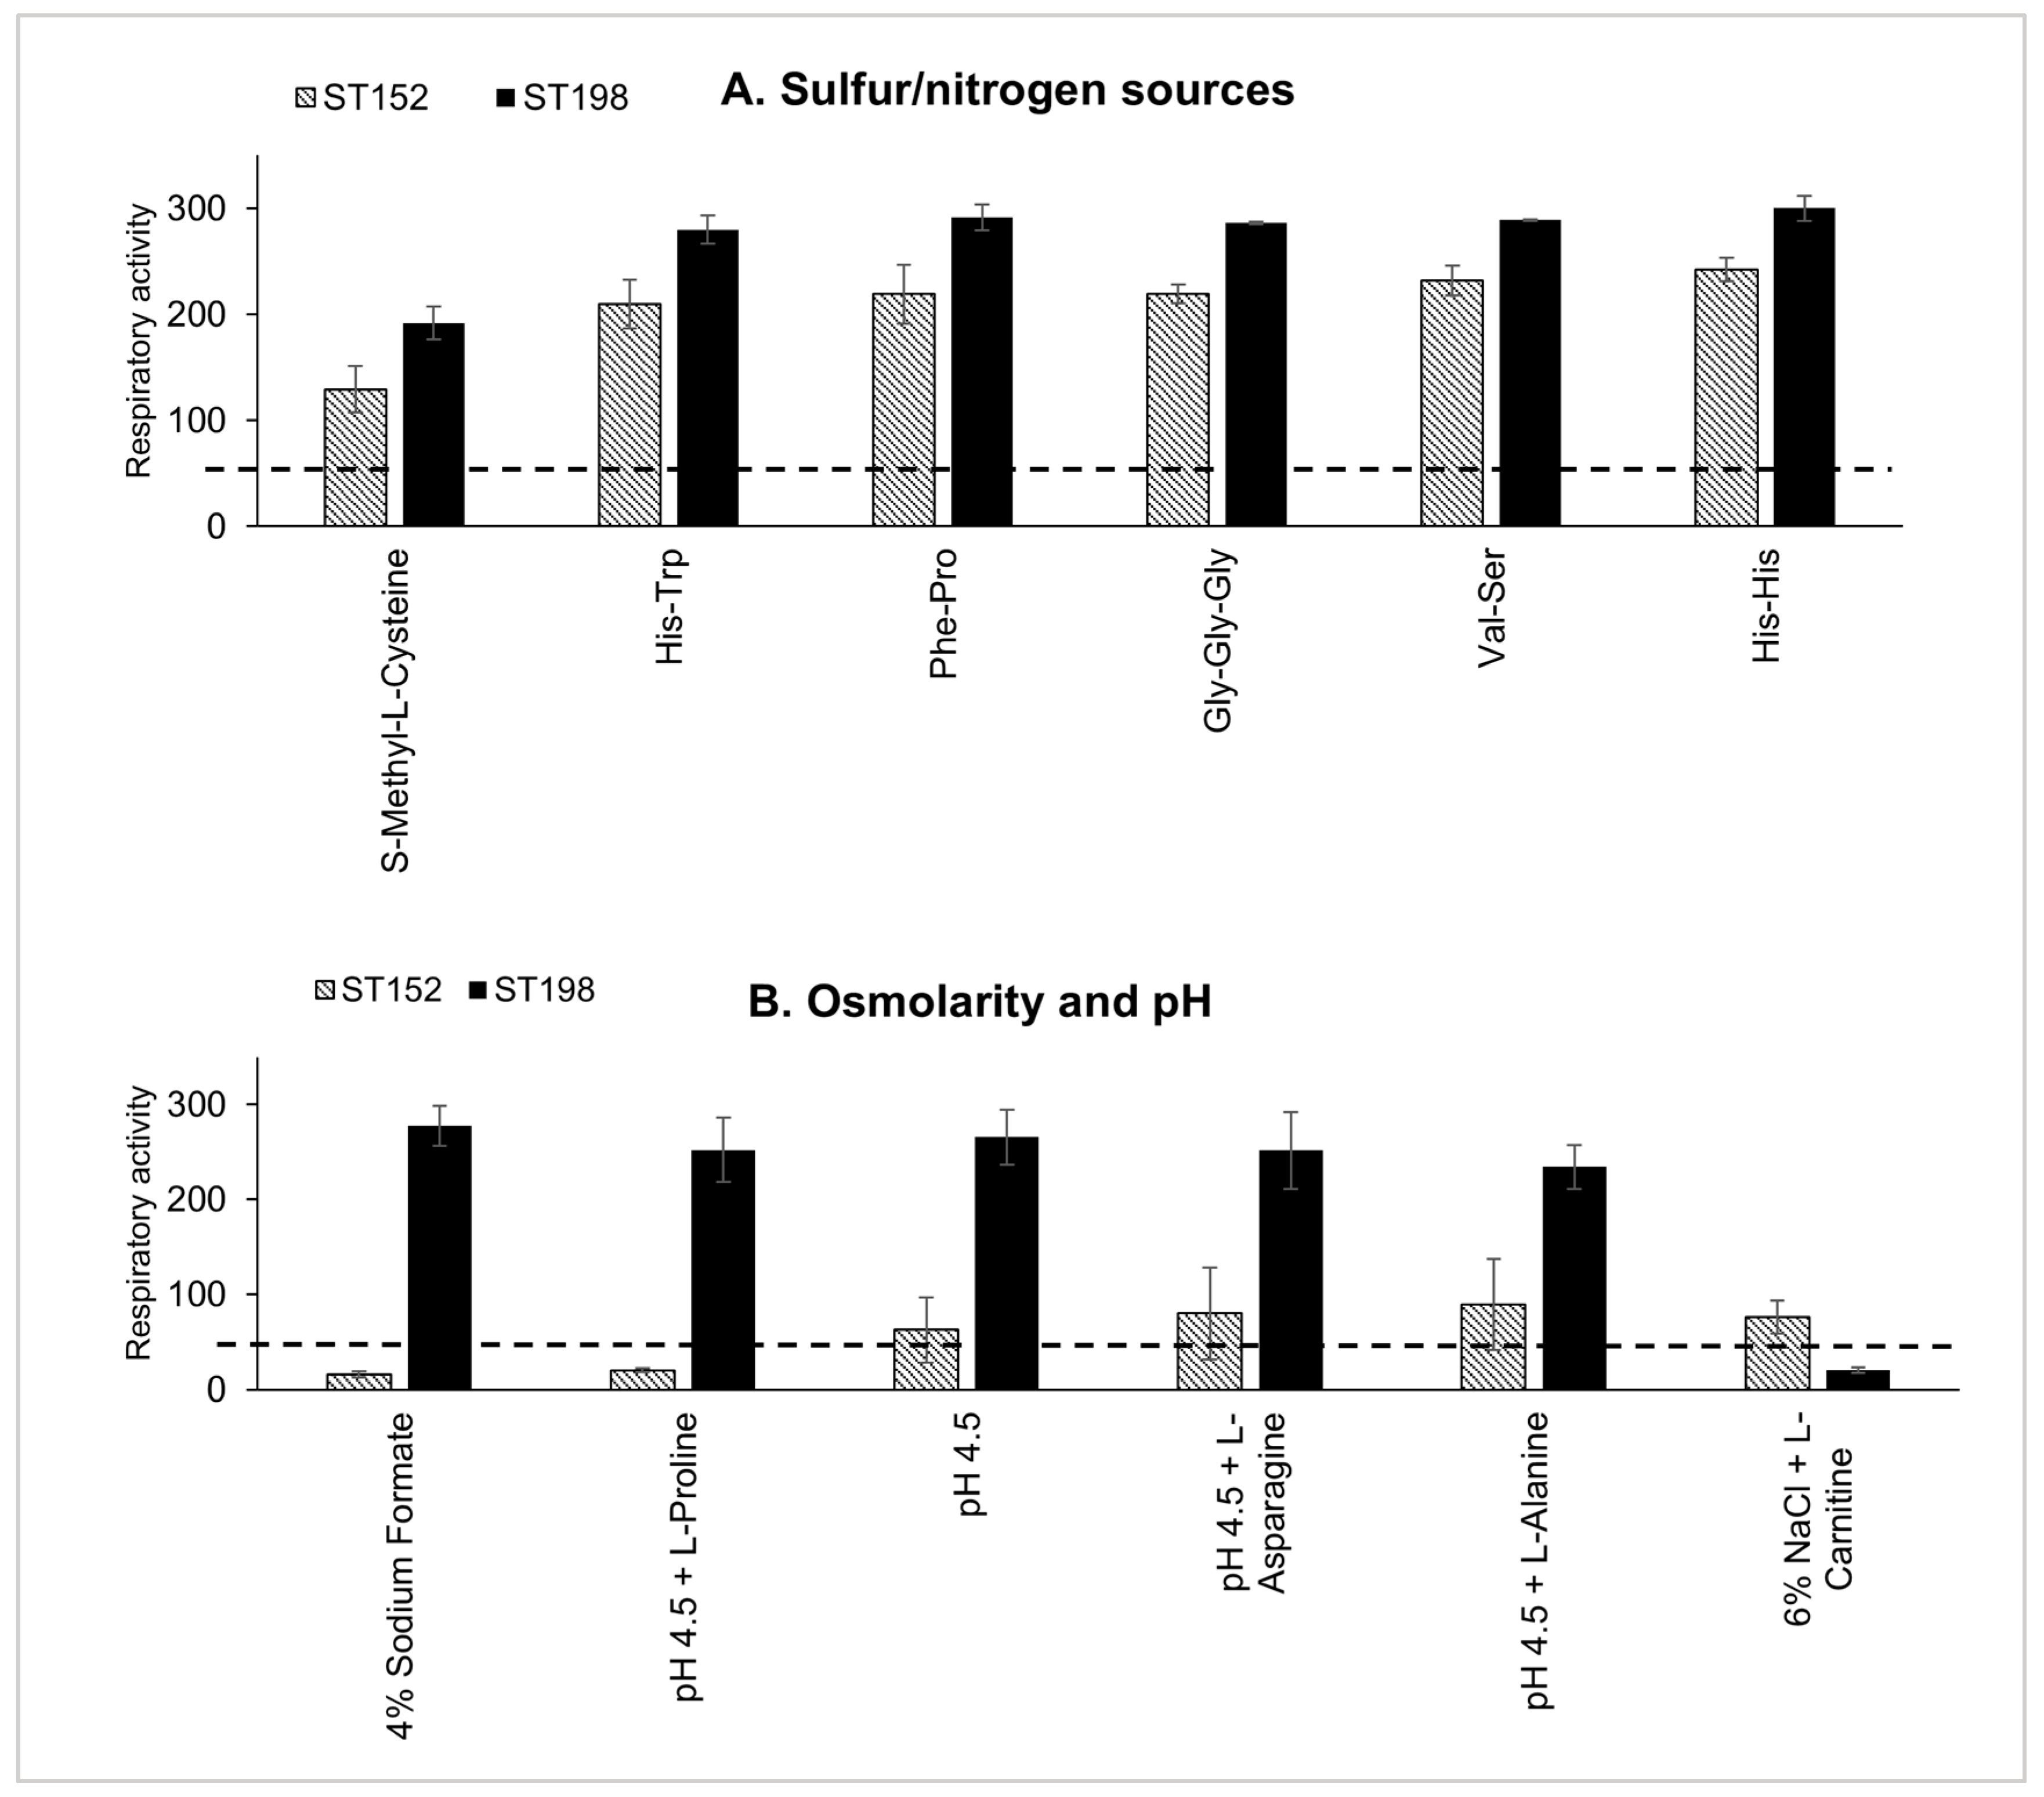
The metabolic fitness differences between ST152 and FluR ST198 lineages were evaluated by measuring the respiratory activity (RA) of multiple epidemiologically distinct S. Kentucky strains across 948 metabolic conditions (Table S1). Hierarchical clustering revealed distinct metabolic profiles, with FluR ST198 lineage strains exhibiting broader and more efficient metabolic capacities via utilization of various energy sources compared to the ST152 lineage strains (Figure 1 and Figure S1). Statistical analysis showed significantly higher RA (p < 0.01) for FluR ST198 strains in 17 out of 948 (1.79%) conditions, including six carbon sources, six nitrogen/sulfur sources, and five stress conditions (Table S1). The largest RA differences for FluR ST198 strains were observed with myo-inositol (RA difference: 247.9, p-value < 0.01) and lactulose (RA difference: 152.9, p-value < 0.01) as sole energy sources (Figure 1). In addition, FluR ST198 strains also displayed significantly higher RA (RA difference > 50, p-value < 0.01) when utilizing glycine, mono-methyl succinate, dextrin, and laminarin as the sole energy sources. Conversely, ST152 strains exhibited significantly higher RA with melibionic acid as the sole energy source (RA difference: 213.6, p-value < 0.01) (Figure 1). For nitrogen/sulfur metabolism, FluR ST198 strains outperformed ST152 strains in utilizing S-Methyl-L-Cysteine, His-Trp, Phe-Pro, Val-Ser, Gly-Gly-Gly, and His-His as sole energy sources, with no nitrogen/sulfur substrates favoring ST152 (Figure 2A). FluR ST198 strains also demonstrated great resilience under environmental stress, with higher RA under five of the six stress conditions tested, notably 4% sodium formate, pH 4.5 + L-Alanine, pH 4.5 + L-Asparagine, and pH 4.5 with or without L-Proline (Figure 2B). Conversely, ST152 strains exhibited significantly higher RA when grown with 6% NaCl with L-Carnitine (Figure 2B).
These data suggest that globally emerging FluR ST198 lineage exhibits enhanced nutritional fitness, utilizing diverse carbon sources that likely contribute to its ecological success and pathogenic potential. Similar lineage-specific metabolic divergence has been reported in other NTS serovars, such as S. Typhimurium ST213/ST313 and S. Enteritidis ST11, where lineage-specific genome degradation has been linked to distinct metabolic capacities, host adaptation, and pathogenicity [17,18,19,35,36]. For instance, the ST313 lineage of S. Typhimurium exhibits distinct metabolic profiles, particularly the enhanced ability to utilize several carbon compounds as sole energy sources, which likely facilitate its adaptation to host-associated niches and contribute to the ability to cause extraintestinal invasive disease [17]. Therefore, it is likely that the metabolic differences observed between ST152 and FluR ST198 reflect lineage-specific adaptations that modulate persistence in food-production systems and host environments. Overall, these results indicate that the FluR ST198 lineage possesses an expanded and more efficient capacity to utilize a range of carbon and nitrogen/sulfur substrates and enhanced tolerance and survival under a range of stressful environmental conditions, which may confer a metabolic fitness advantage in diverse or host-associated environments.

3.2. Lineage- and Temperature-Dependent Differences in Myo-Inositol Utilization by ST152 and FluR ST198 Strains

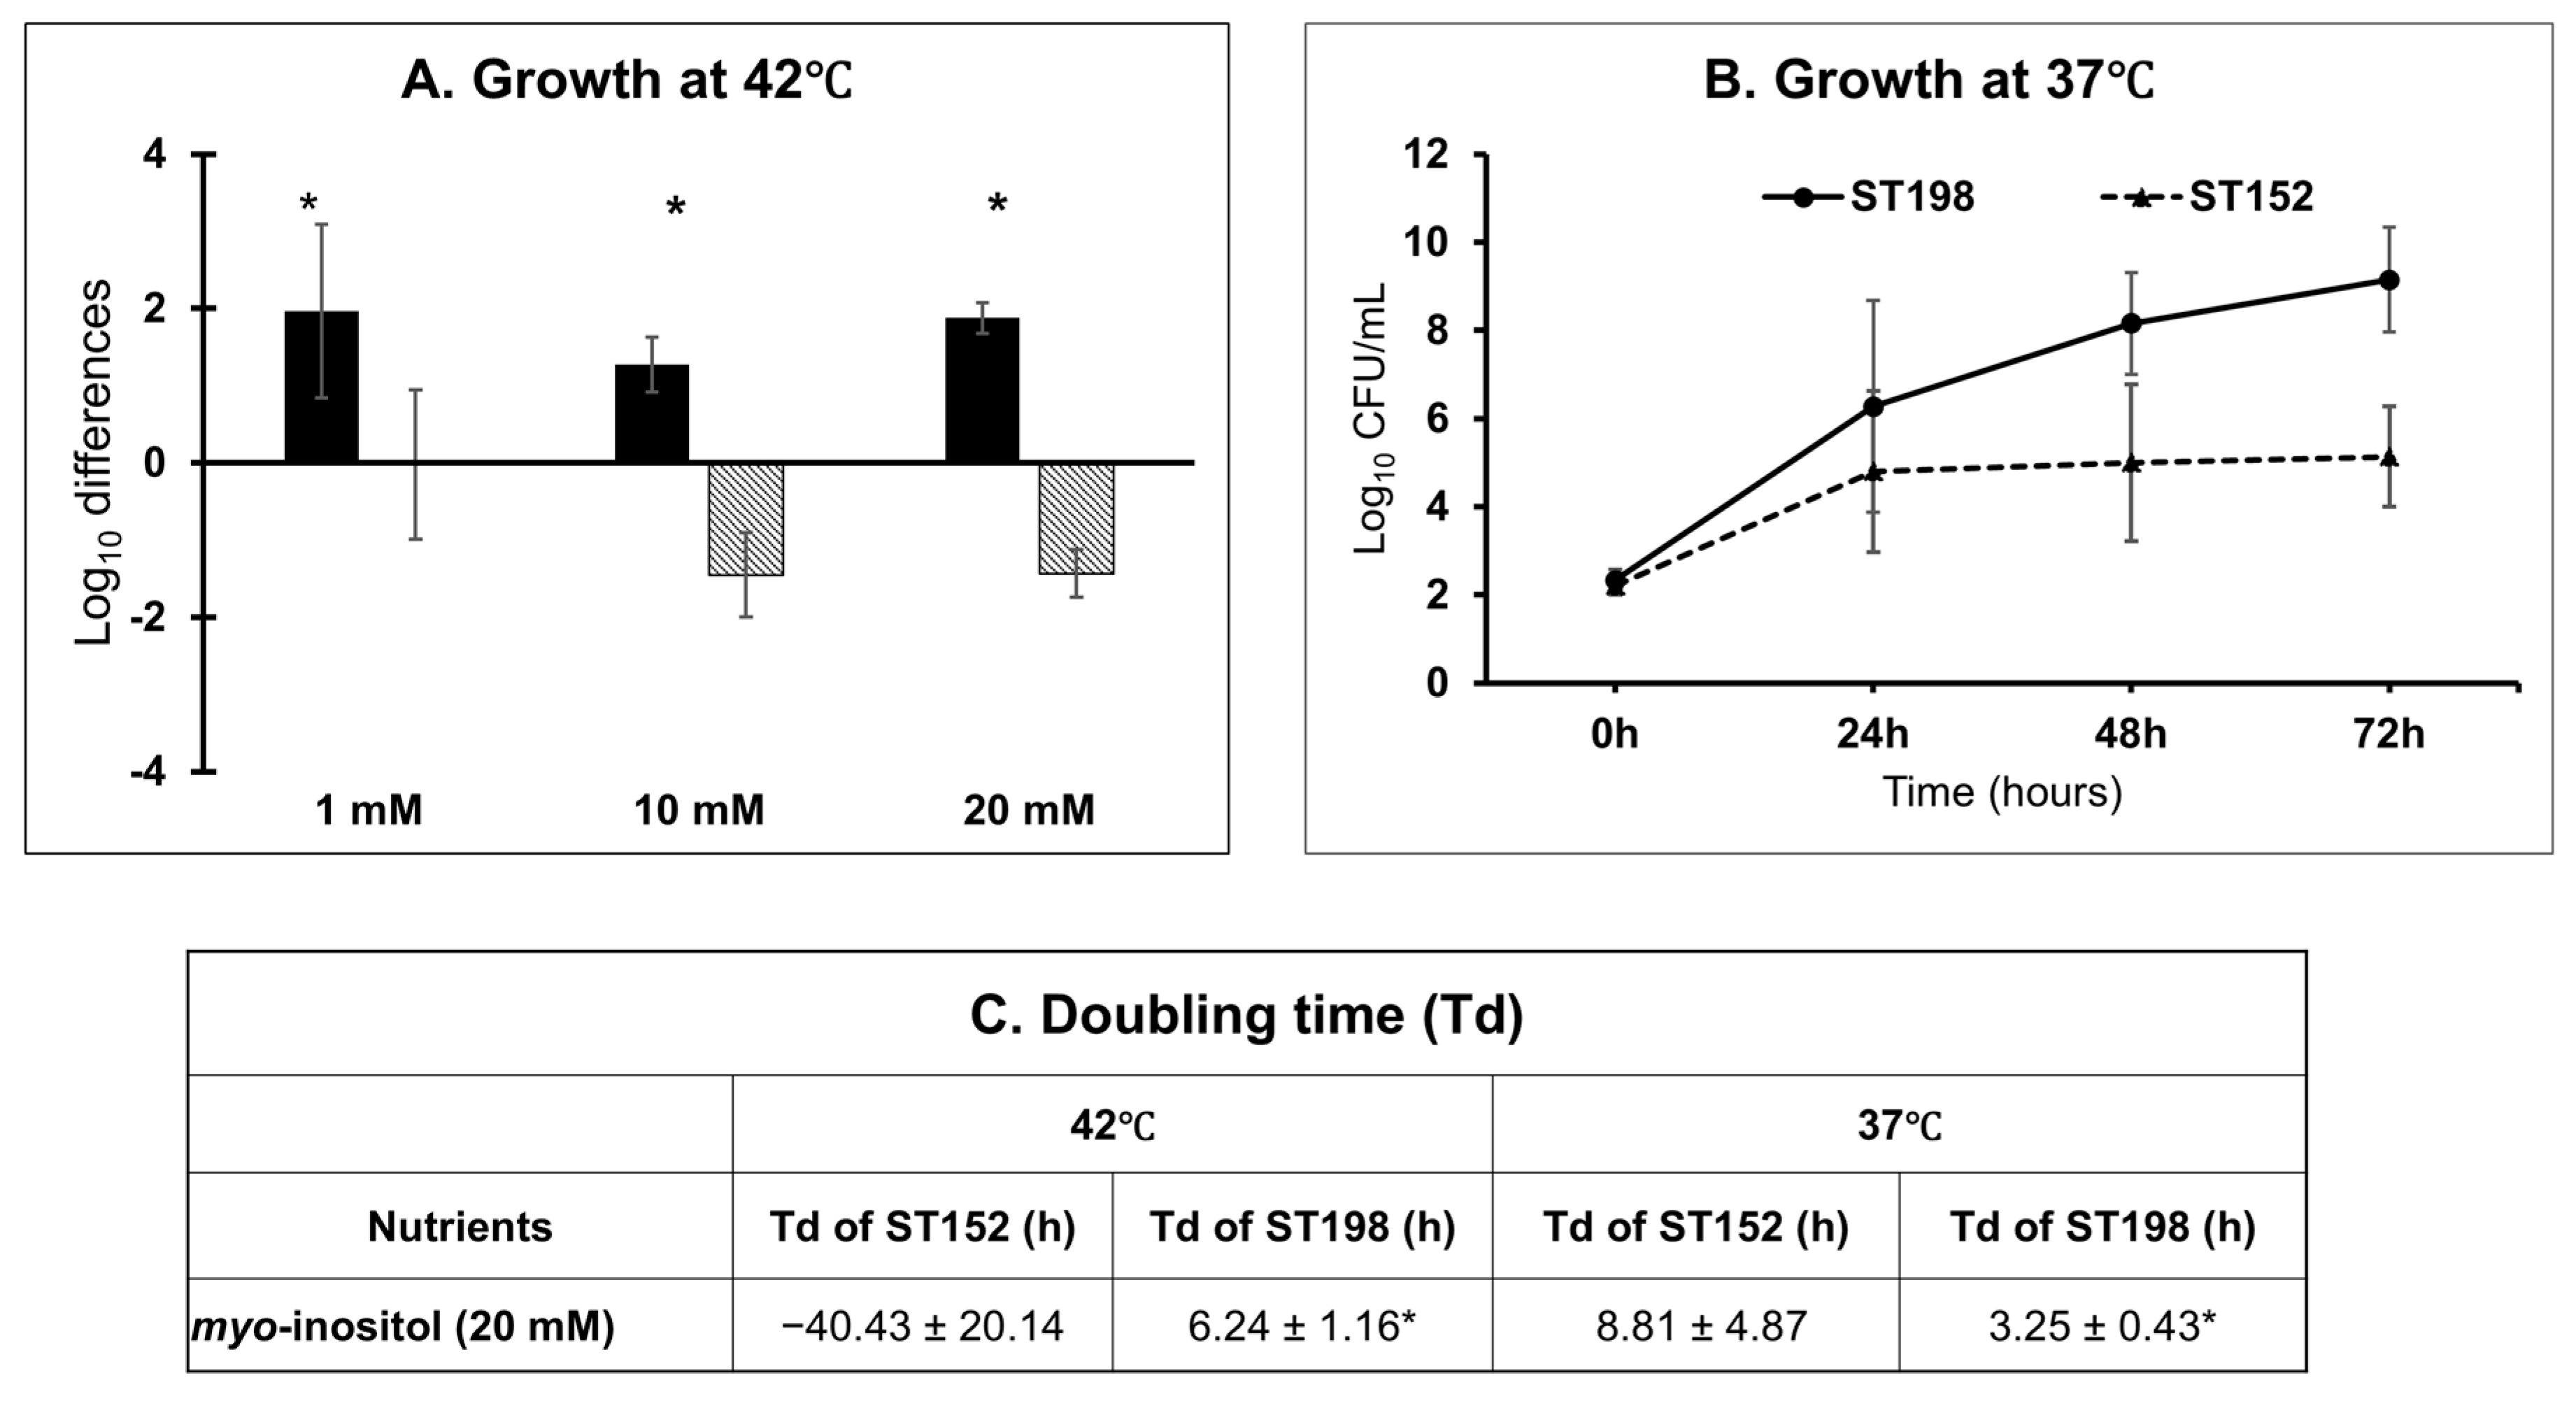
To validate the differential utilization of myo-inositol, growth kinetics assays were performed in media supplemented with varying concentrations (1 mM, 10 mM, and 20 mM) of myo-inositol at avian physiological temperature (42 °C). FluR ST198 strains exhibited significantly increased growth (1.96 ± 1.12 to 1.88 ± 0.2 log10 CFU/mL increase) across all concentrations of myo-inositol tested, with most consistent growth by all strains achieved at 20 mM concentration (Figure 3A,C). In contrast, the ST152 strains showed a consistent decline in viable counts across all concentrations at 42 °C, indicating an inability to effectively utilize myo-inositol as a sole energy source under avian physiological conditions.
To further evaluate temperature-dependent effects, growth assays were repeated at the mammalian physiological temperature (37 °C) using 20 mM myo-inositol, the concentration that supported maximal ST198 growth and has been used in previous in vitro and infection studies [37,38]. At 37 °C, FluR ST198 strains reached significantly higher cell densities (9.15 ± 1.19 log10 CFU/mL 72 h post-incubation with a Td of 3.25 ± 0.43 h) compared to ST152 strains (5.14 ± 1.14 log10 CFU/mL 72 h post-incubation with a Td of 8.81 ± 4.87 h) (Figure 3B,C). These results suggest that ST152 strains possess a markedly reduced capacity to metabolize myo-inositol, although they are capable of residual growth at 37 °C. The absence of growth at 42 °C but limited growth at 37 °C in ST152 strains may reflect temperature-sensitive regulation or partial functionality of pathways involved in myo-inositol utilization. Together, these findings indicate that FluR ST198 strains can efficiently use myo-inositol at both avian and mammalian physiological temperatures, whereas ST152 strains exhibit impaired and temperature-dependent utilization.

3.3. Lineage- and Temperature-Dependent Differences in Lactulose Utilization by ST152 and FluR ST198 Strains

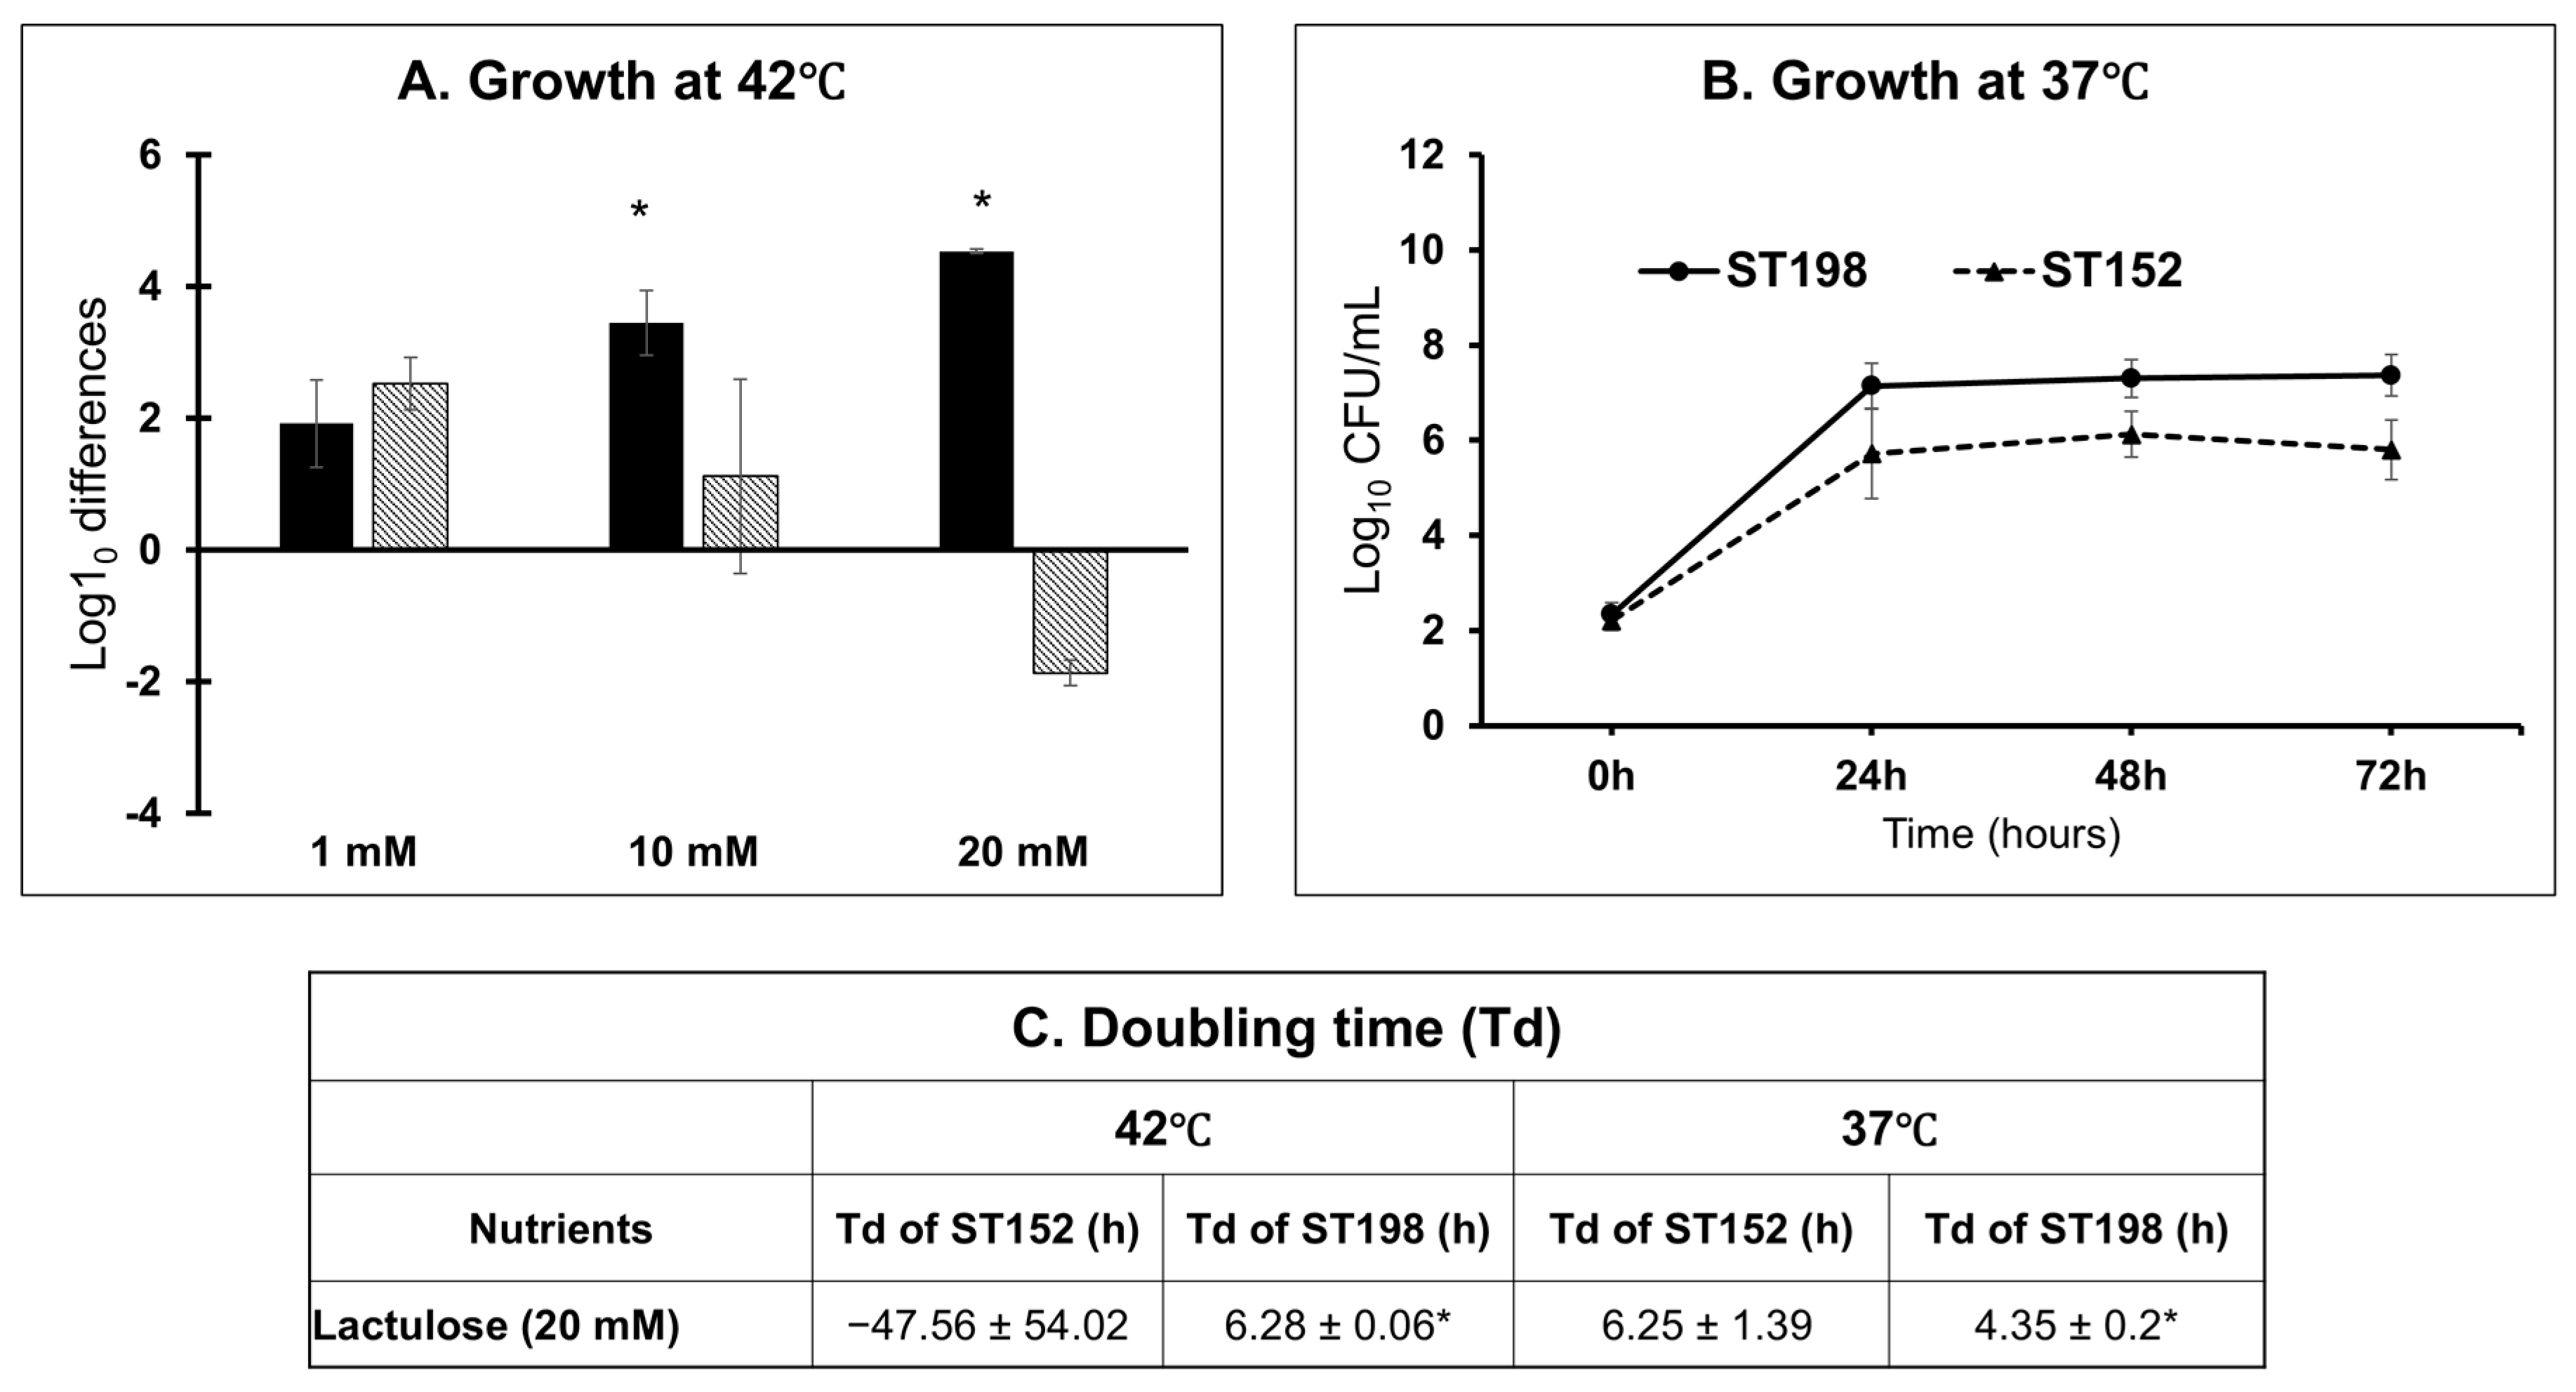
Growth kinetics assays in media supplemented with lactulose (1 mM, 10 mM, and 20 mM) at the avian physiological temperature (42 °C) revealed striking lineage-specific differences in lactulose utilization as the sole source of energy for growth. FluR ST198 strains exhibited a clear dose-dependent increase in growth, with viable counts rising from 1.92 ± 0.66 log10 CFU/mL at 1 mM to 3.45 ± 0.49 log10 CFU/mL at 10 mM and 4.54 ± 0.03 log10 CFU/mL at 20 mM, indicating efficient metabolism of lactulose as a sole energy source (Figure 4A). In contrast, ST152 strains showed a consistent decline in growth, from 2.53 ± 0.40 log10 CFU/mL at 1 mM to 1.12 ± 1.47 log10 CFU/mL at 10 mM, and a net loss of viability (−1.86 ± 0.20 log10 CFU/mL) at 20 mM, suggesting either an inability to catabolize lactulose or potential toxic effects at higher concentrations at the avian physiological temperature.
Follow-up assays at mammalian physiological temperature (37 °C) using 20 mM lactulose demonstrated that strains within both lineages were capable of growth. However, ST152 strains exhibited reduced proliferation compared to ST198 (p < 0.05), reaching 5.80 ± 0.63 log10 CFU/mL at 72 h with a doubling time of 6.25 ± 1.39 h, while FluR ST198 strains reached 7.36 ± 0.43 log10 CFU/mL with a faster doubling time of 4.35 ± 0.2 h (Figure 4B,C).
Taken together, these results highlight the superior metabolic flexibility of ST198, which can efficiently utilize lactulose across both avian and mammalian physiological temperatures. In contrast, ST152 shows temperature-dependent impairment in lactulose utilization with significantly reduced growth at avian physiological temperature; however, this effect is minimized at mammalian physiological temperature. These metabolic constraints suggest lactulose may differentially modulate ecological adaptation in different hosts, impacting fitness, environmental persistence, or zoonotic potential.

3.4. Pan-Genome and Comparative Gene Functional Analysis of ST152 and FluR ST198 Strains

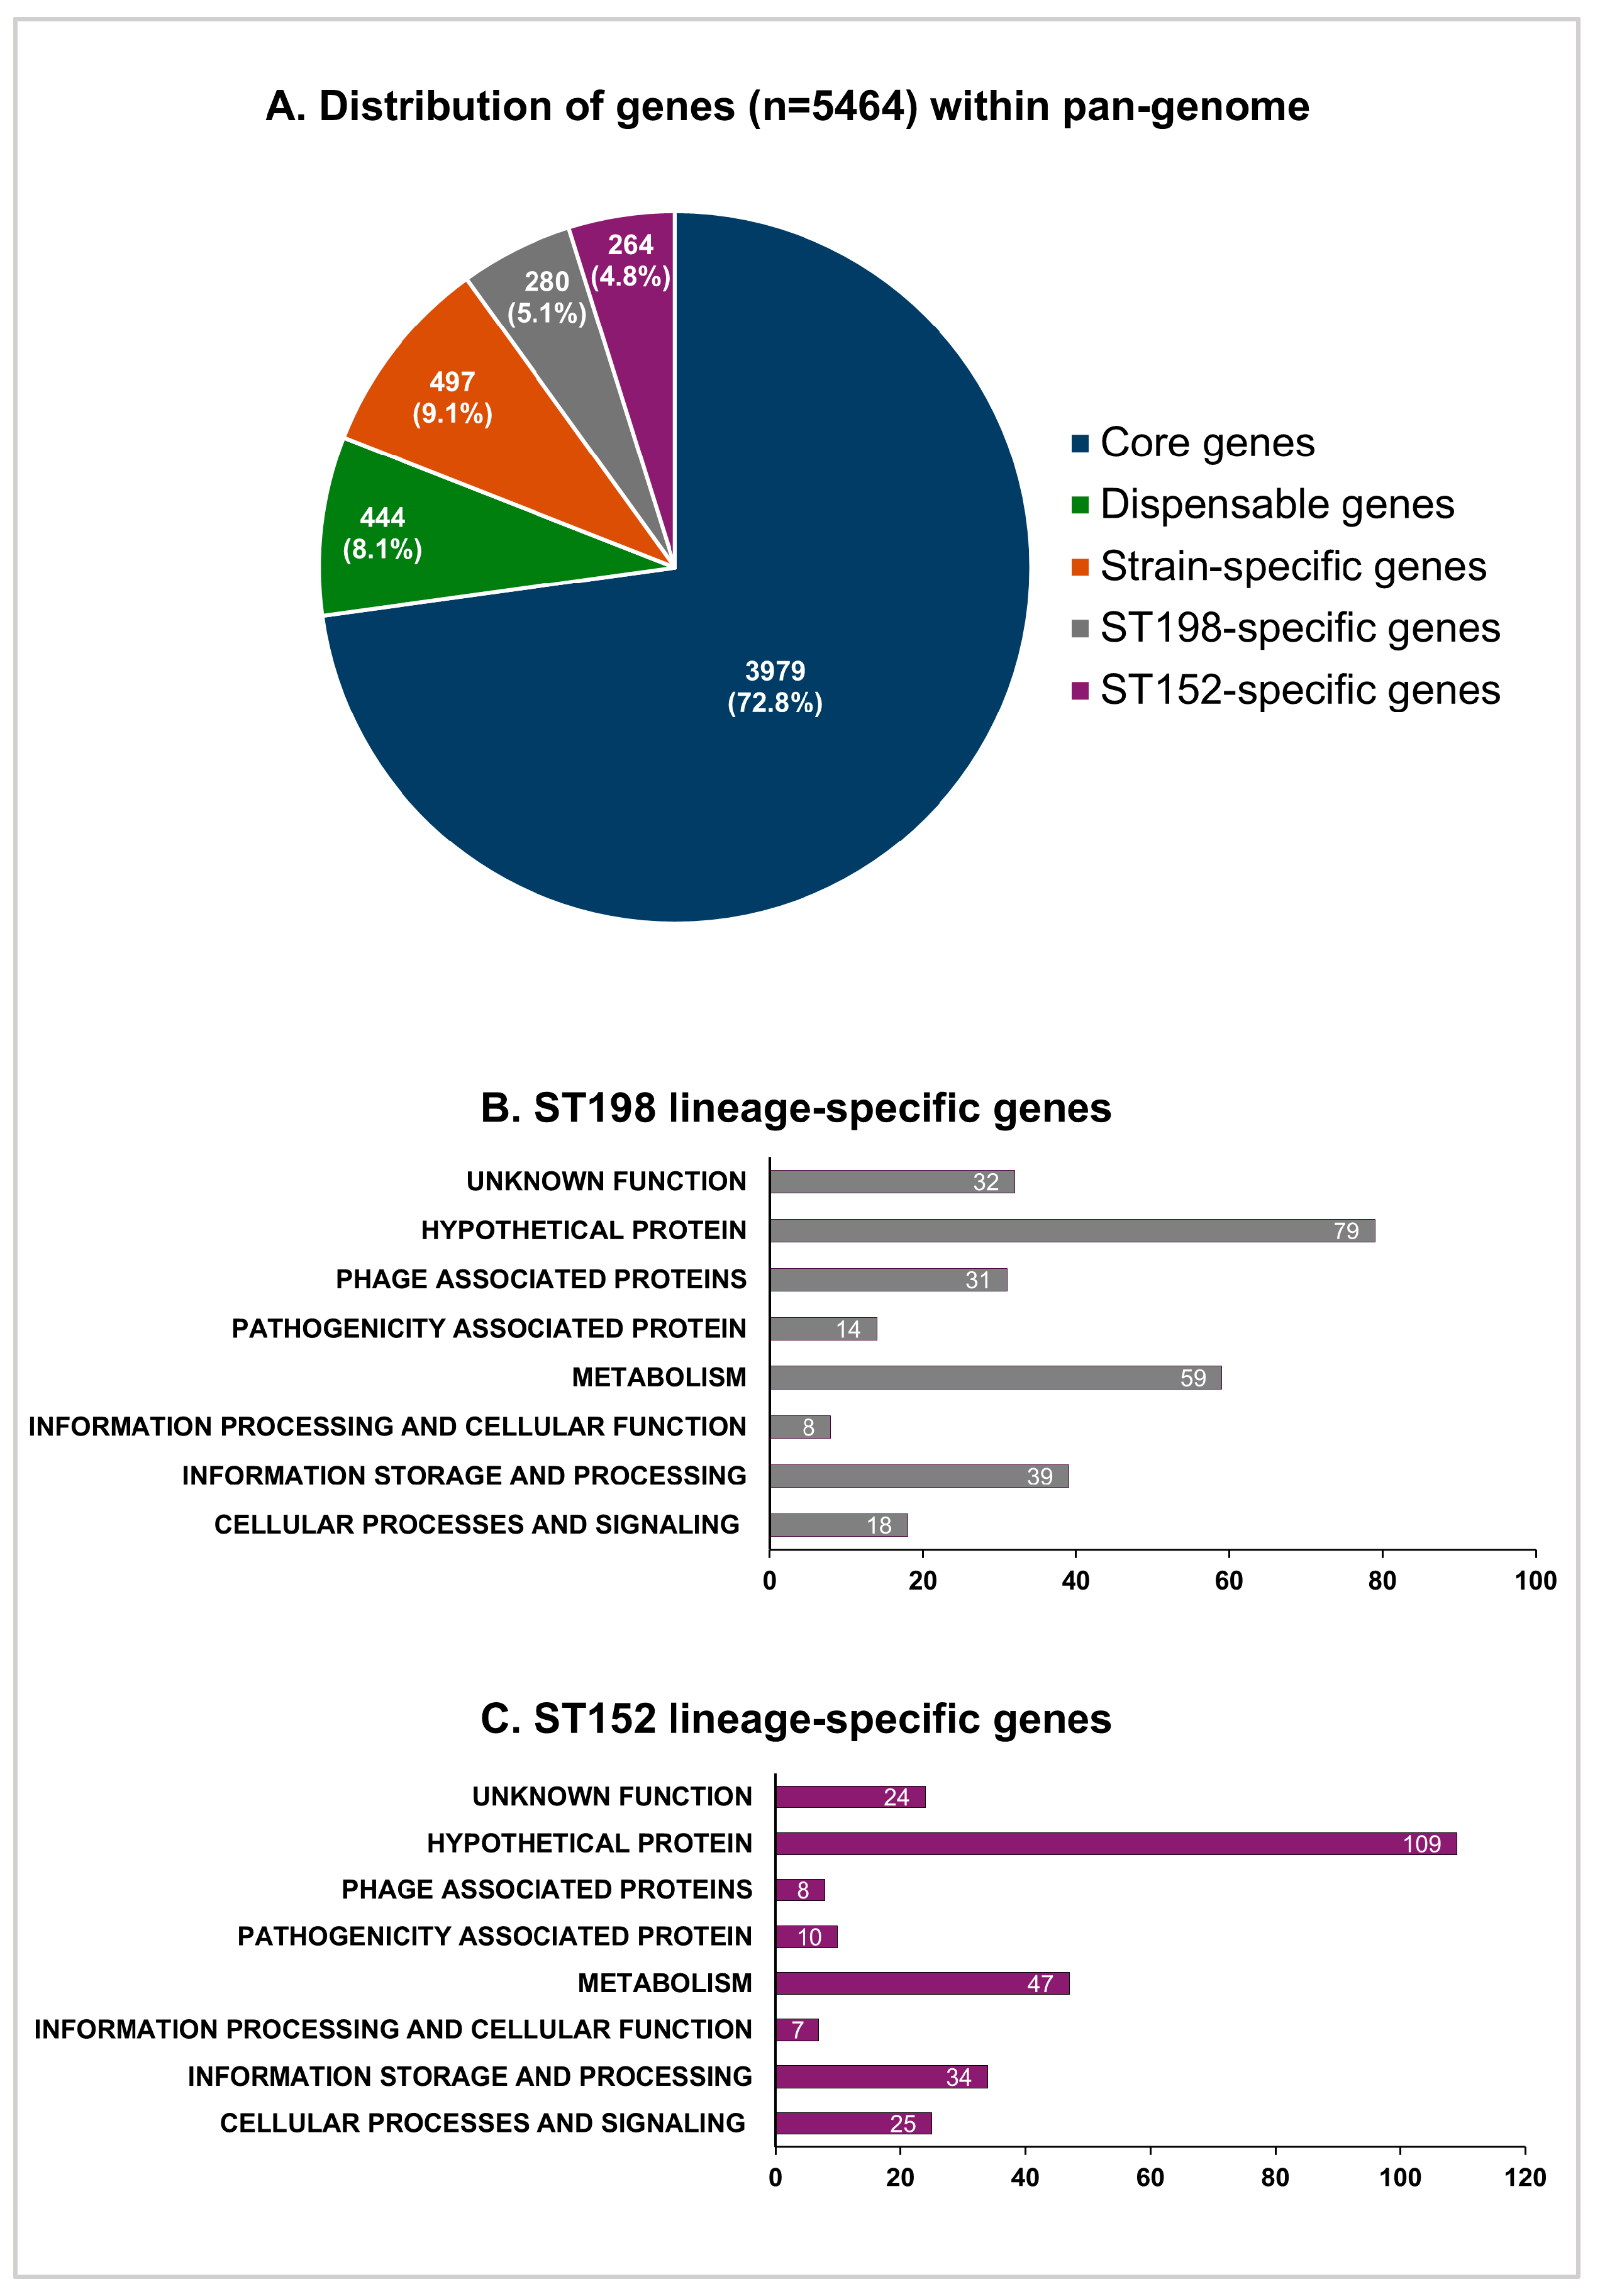
The comparative genomic analysis of four strains of the ST152 lineage and three strains of the FluR ST198 lineage used in this study revealed a pan-genome consisting of 5464 genes (Figure 5A). A total of 280 (5.1%) genes were identified as ST198-lineage specific, whereas 264 (4.8%) genes were identified as ST152-lineage specific (Figure 5A). The functional distribution of ST152 and FluR ST198 lineage-specific genes revealed that each lineage carried a unique repertoire of genes, with the majority of genes encoding bacterial metabolism, hypothetical proteins, and proteins of unknown functions (Figure 5B,C). The differential carriage of the broad repertoire of genes involved in metabolic functions corroborates the differences in the metabolic phenotypes of these two lineages observed in this study. The results of the pan-genome analysis suggest that lineage-specific mutation and genome degradation may directly impact the metabolic adaptation of the sequence types in different niches, including the host and the environment. Our follow-up investigations focused on determining the linkage between genotype and phenotype for the differential ability of ST152 and FluR ST198 strains to utilize myo-inositol and lactulose as sole carbon sources.

3.4.1. Phenotype-to-Genotype Association for Myo-Inositol Metabolism in S. Kentucky ST198 and ST152 Lineages and Across NTS

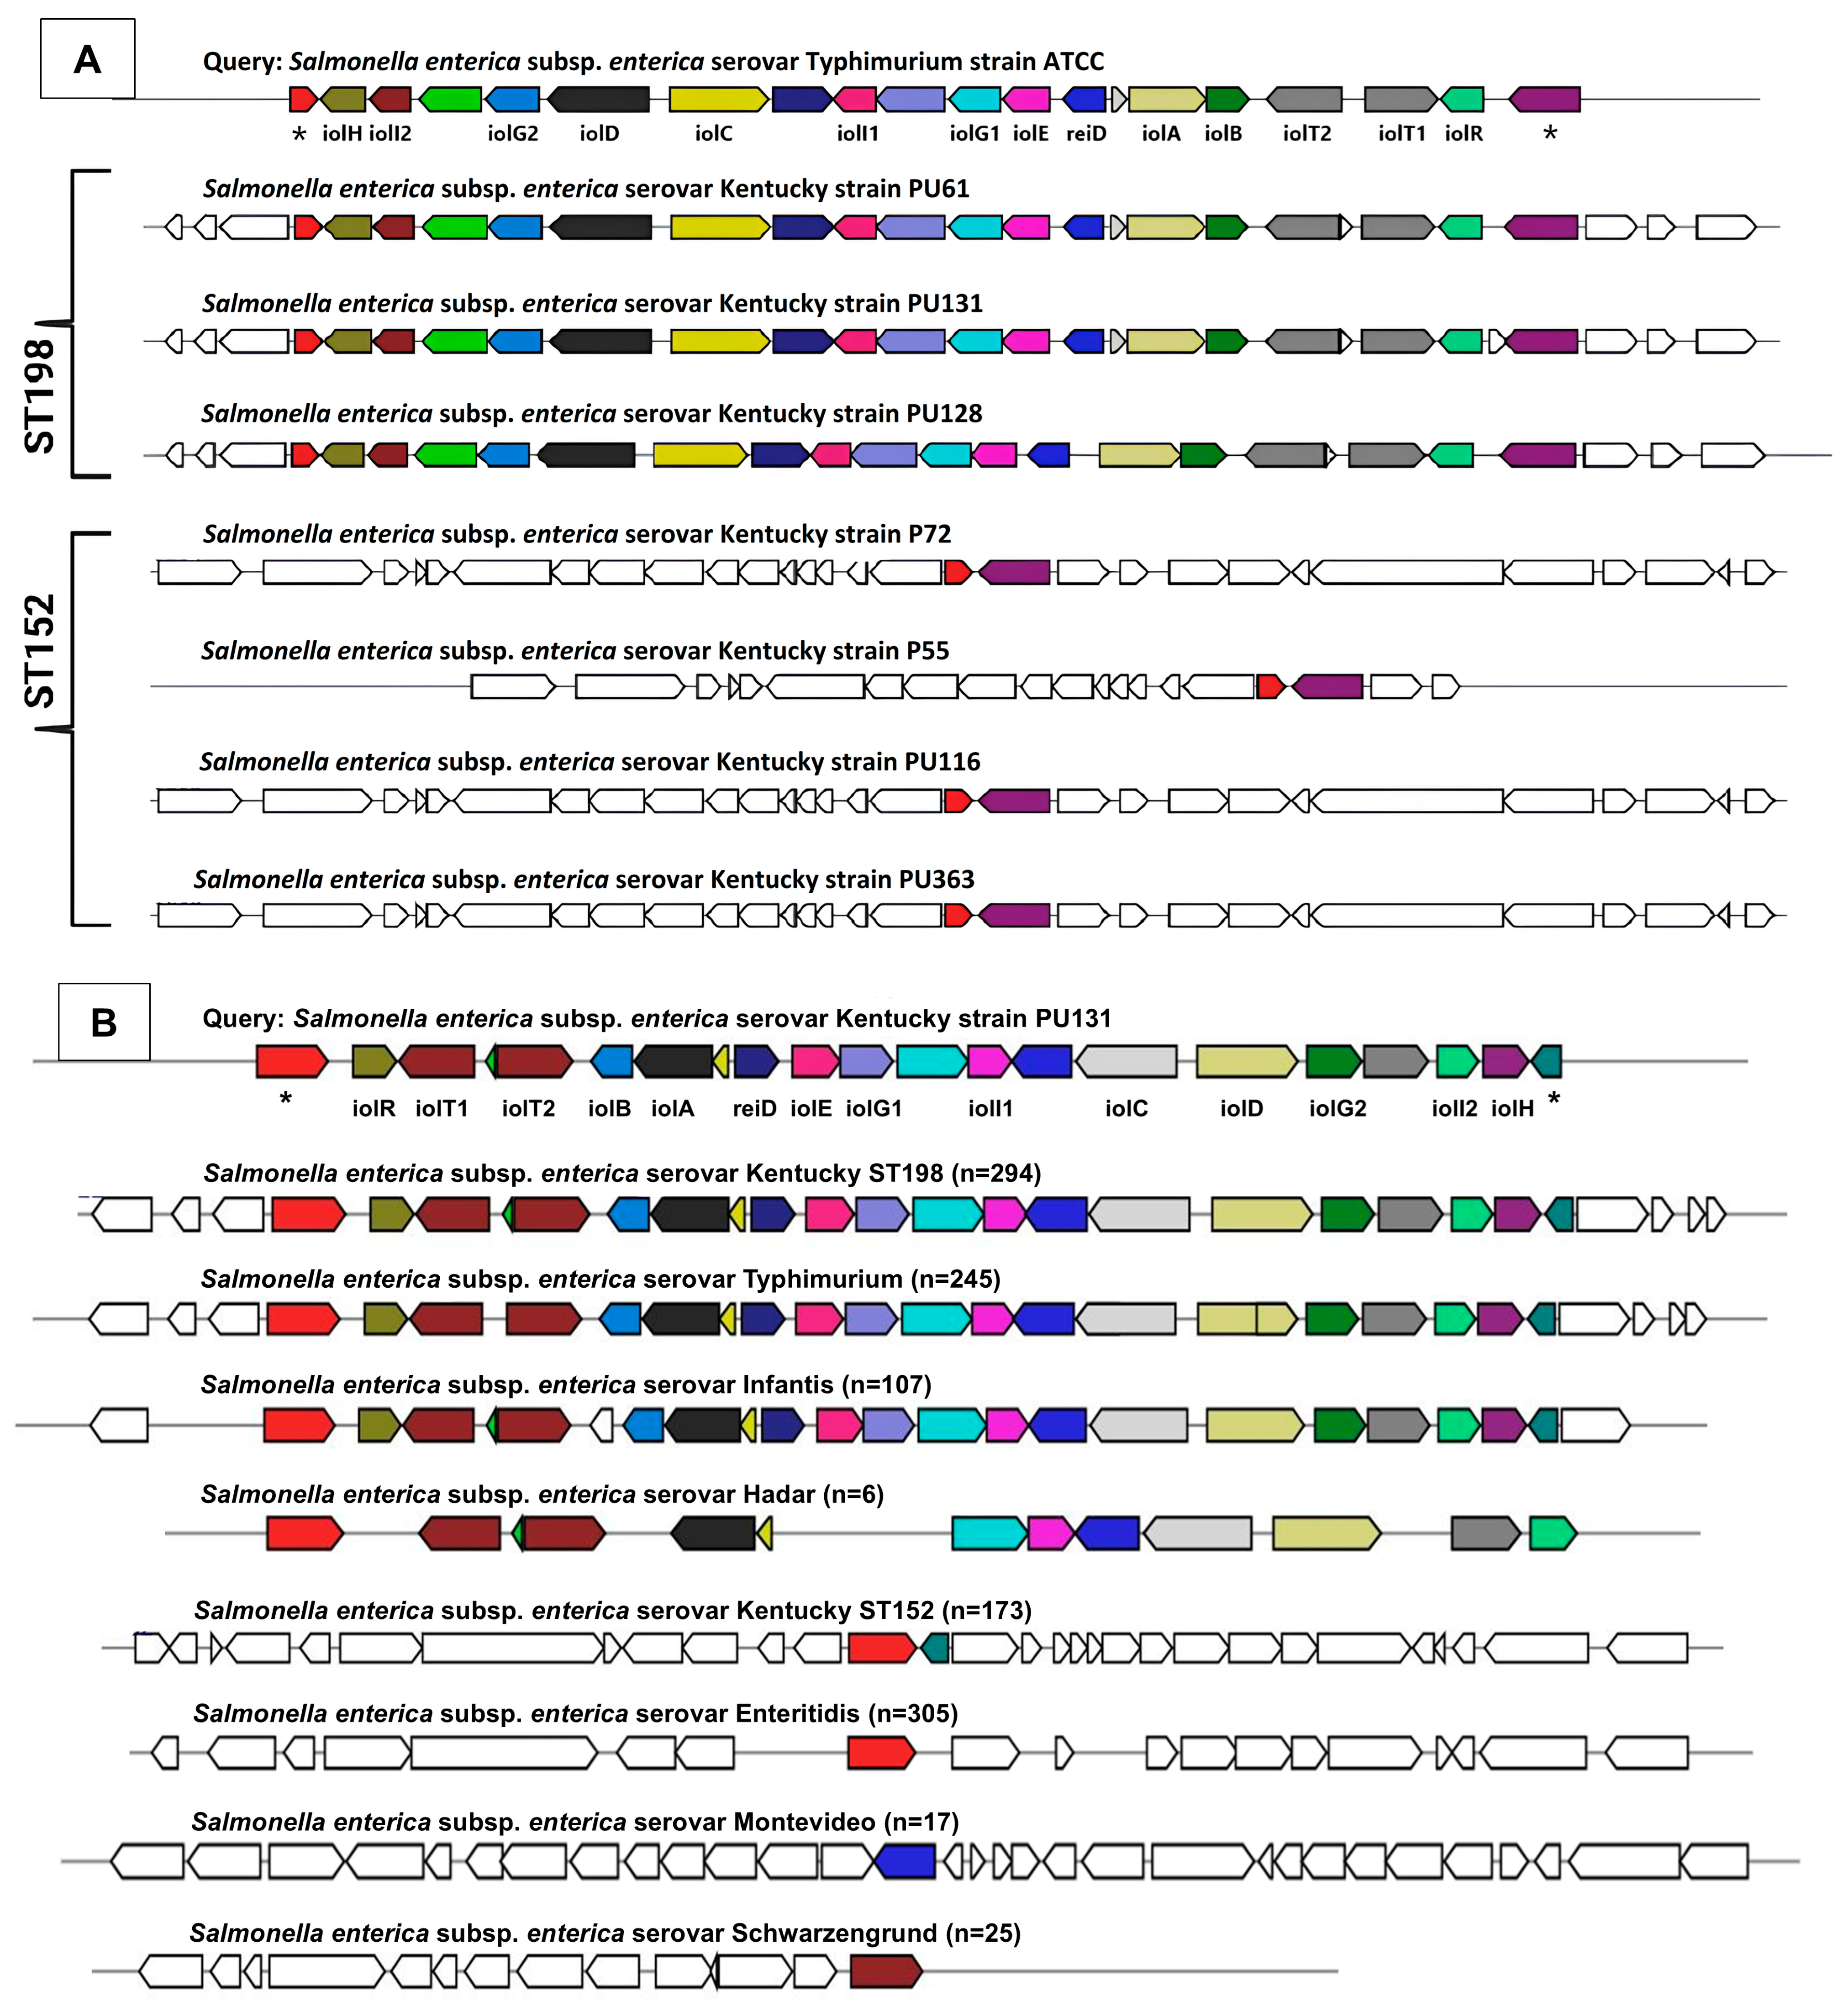
A recent large-scale genomic survey encompassing 193,753 genomes from 24,812 commensal and pathogenic bacterial species, including Salmonella spp., found that myo-inositol utilization is widespread. This is largely attributed to the presence of a conserved iol gene cluster, which mediates myo-inositol metabolism [27,39]. Previous studies have confirmed that S. Typhimurium can utilize myo-inositol as a sole carbon source due to this canonical iol cluster [26,27]. In our study, strains belonging to the S. Kentucky ST152 lineage exhibited significantly impaired growth in myo-inositol minimal media compared to FluR ST198 strains, suggesting differences in the presence or functionality of the iol gene cluster. To investigate this genotype–phenotype association, we screened the genomes of both ST152 and FluR ST198 strains for the canonical iol gene cluster. All FluR ST198 genomes analyzed carried the complete canonical iol gene cluster (Figure 6A), consistent with their robust growth in myo-inositol (Figure 3). In contrast, none of the ST152 strains carried the cluster, correlating with their impaired growth (Figure 3).
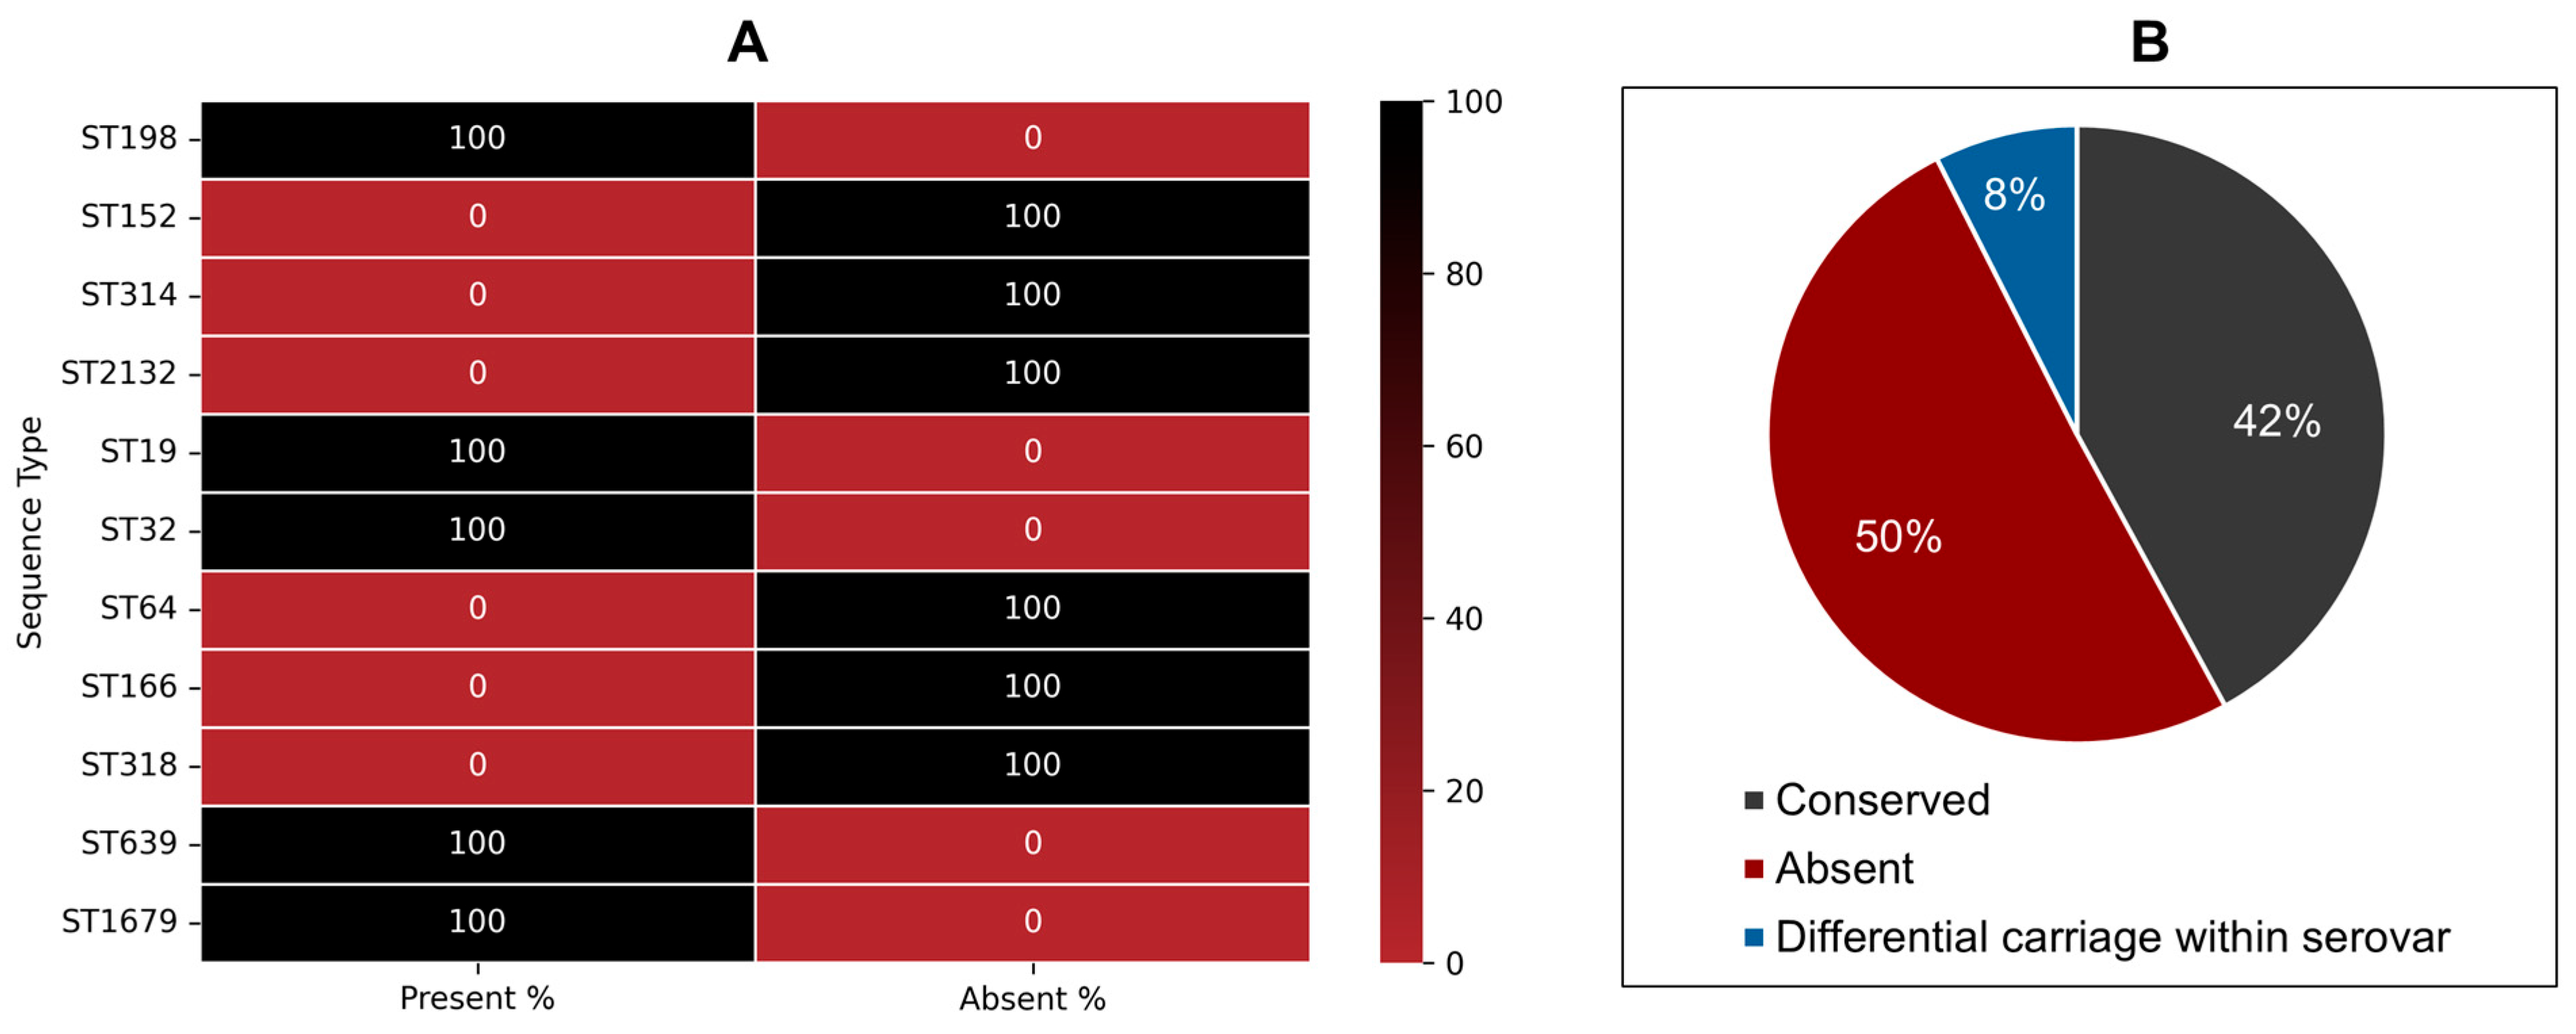
We extended this analysis to 294 ST198 and 173 ST152 genomes to assess lineage-wide conservation. The canonical iol gene cluster was conserved in all ST198 genomes but absent from all ST152 genomes (Figure 7A). Other S. Kentucky sequence types (ST314, ST2132, ST64, ST166, and ST318) also lacked this cluster, whereas it was present in ST198, ST19, ST32, ST639, and ST1679 strains (Figure 7A). To further support this functional link, we examined the expression of two key myo-inositol-responsive genes [40,41], iolT1 (transport) and reiD (regulatory), in the presence of myo-inositol. Both genes were upregulated compared to glucose conditions (Figure 8), aligning with their location in the iol cluster of the FluR ST198 genome (PU61) and the observed growth phenotype (Figure 3). These findings demonstrate that the canonical iol gene cluster is differentially distributed among S. Kentucky lineages and that its presence strongly correlates with the ability to utilize myo-inositol as a sole energy source.
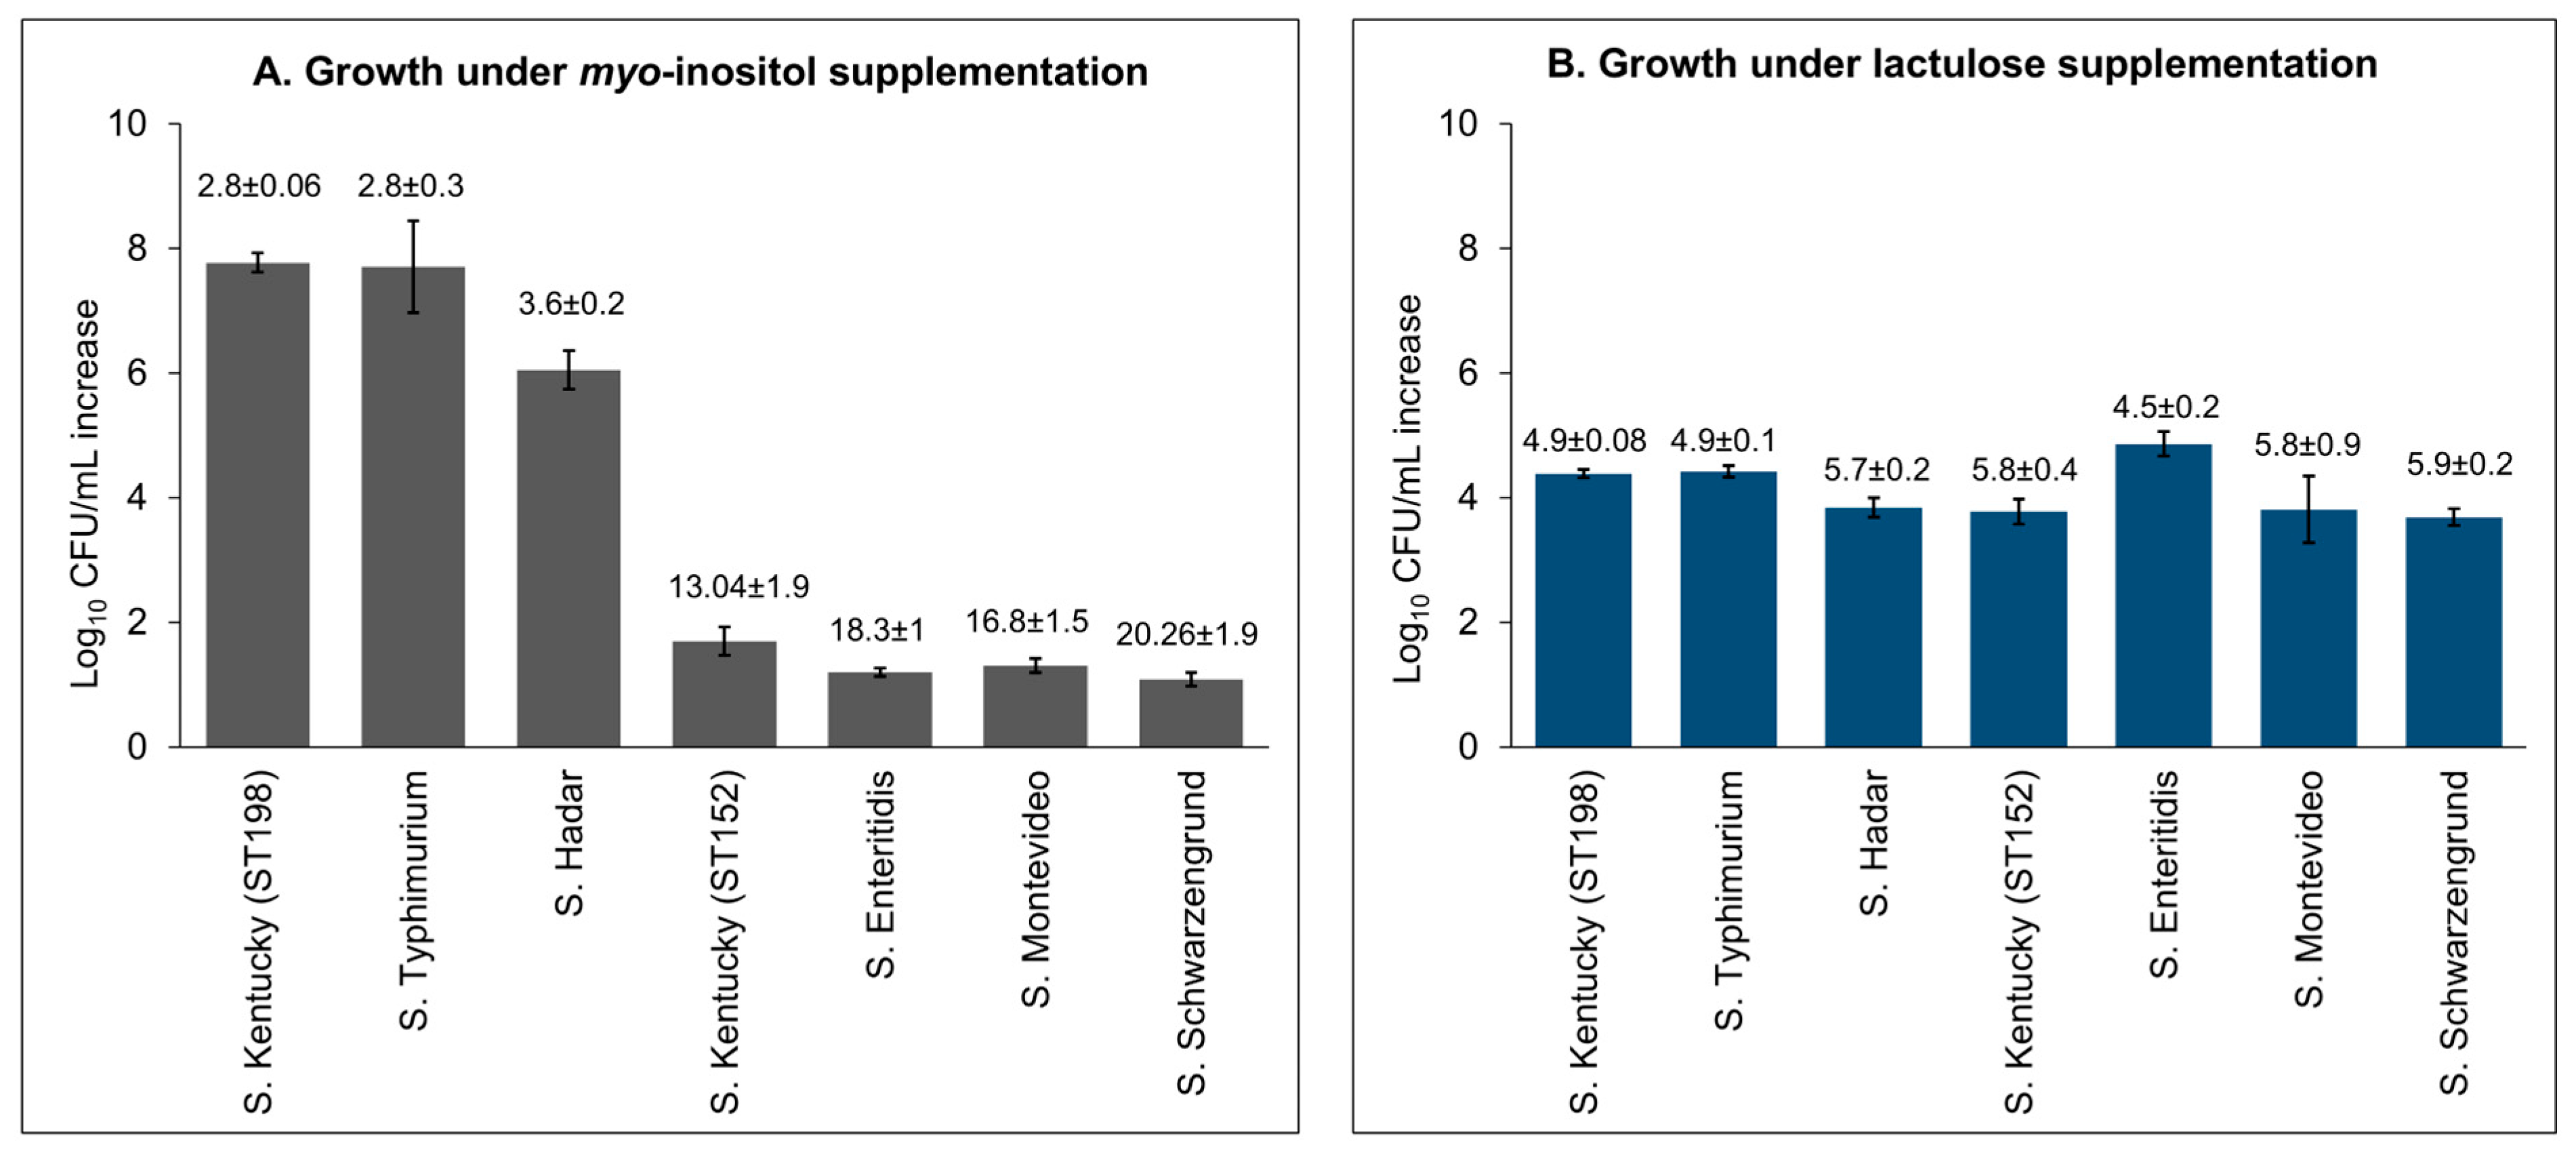
To evaluate the broader relevance of this observation across NTS serovars, we analyzed 1792 genomes from 107 NTS serovars (Table S2). The canonical iol gene cluster was conserved in 45 (42%) serovars, absent in 54 (50%)—including S. Enteritidis, a clinically significant serovar, and variably present within 8 (8%) other serovars (Figure 7B). To validate these genomic predictions, representative strains were tested for growth in myo-inositol media. Serovars carrying the iol cluster, including S. Kentucky ST198 (7.8 ± 0.16 logs), S. Typhimurium (7.7 ± 0.73 logs), and S. Hadar (6.04 ± 0.31 logs), showed significantly higher growth than those lacking the cluster: S. Kentucky ST152 (1.7 ± 0.23 logs), S. Enteritidis (1.2 ± 0.07 logs), S. Montevideo (1.30 ± 0.11 logs), and S. Schwarzengrund (1.08 ± 0.11 logs) (Figure 9A). These findings affirm that myo-inositol metabolism in NTS is primarily dependent on the presence of the canonical iol gene cluster. Interestingly, strains lacking the cluster still demonstrated residual growth, albeit inefficiently, suggesting the potential presence of non-canonical or alternative metabolic routes for myo-inositol utilization. However, the molecular basis of these alternative pathways remains to be elucidated.
Myo-inositol, a polyol found in various foods, plays vital roles in cellular processes, including signaling, motility, membrane trafficking, and phagocytosis [27,42]. Myo-inositol is commonly used as a dietary supplement and for the treatment and management of several clinical conditions [43,44], and its intake ranges from 0.3 to 2.6 g/day in Western diets and up to 4.5 g/day globally [45,46], with therapeutic doses reaching 4–18 g/day [47,48]. Although typically associated with beneficial gut microbiota, recent evidence shows that several pathogenic bacterial genomes, including NTS, harbor the iol cluster [39]. Interestingly, S. Dublin has been shown to secrete a myo-inositol polyphosphate 4-phosphatase that disrupts host inositol phosphate signaling, contributing to diarrhea within 30 min of infection [49,50]. Our findings, showing widespread iol cluster carriage and associated metabolic capacity, suggest that myo-inositol utilization may confer a niche-specific metabolic fitness advantage to ST198 and other NTS serovars that harbor the iol gene cluster. Future in vivo studies are warranted to assess the contribution of this pathway to enteric colonization and pathogenesis.

3.4.2. Phenotype-to-Genotype Association for Lactulose Metabolism in S. Kentucky ST198 and ST152 Lineages and Across NTS

While lactulose metabolism by NTS has not been previously described, our data demonstrate that NTS, including S. Kentucky, can utilize lactulose as a sole carbon and energy source to support growth, despite lineage-specific variation in growth efficiency (Figure 4 and Figure 9B). Growth assays confirmed that this capacity is not restricted to a single serovar; all five NTS serovars tested exhibited robust growth in media containing lactulose as the only carbon source (Figure 9B). These findings suggest that S. Kentucky and other NTS serovars possess a functional, yet uncharacterized, metabolic pathway for lactulose utilization.
The specific genes responsible for lactulose metabolism in NTS remain unidentified; however, glycoside hydrolase (GH) enzymes, which cleave disaccharides like lactulose into fermentable monosaccharides such as fructose and galactose, are widespread in gut microbes [51]. To identify candidate genes potentially involved in lactulose hydrolysis, we interrogated the genome of S. Kentucky strain PU131, a well-characterized FluR ST198 reference strain [33]. We identified six genes encoding putative GH family proteins (Table S3) and screened for their potential functions within the CAZy database. Notably, one gene (AUW48348.1) encoding a GH1 family protein with putative β-galactosidase activity was identified with the potential to hydrolyze β-1,4 linkages within disaccharides [30,31,34]. Additionally, we identified a gene (AUW48392.1) encoding a glycoside-pentoside-hexuronide (GPH) family transporter, a membrane protein family known to mediate disaccharide uptake.
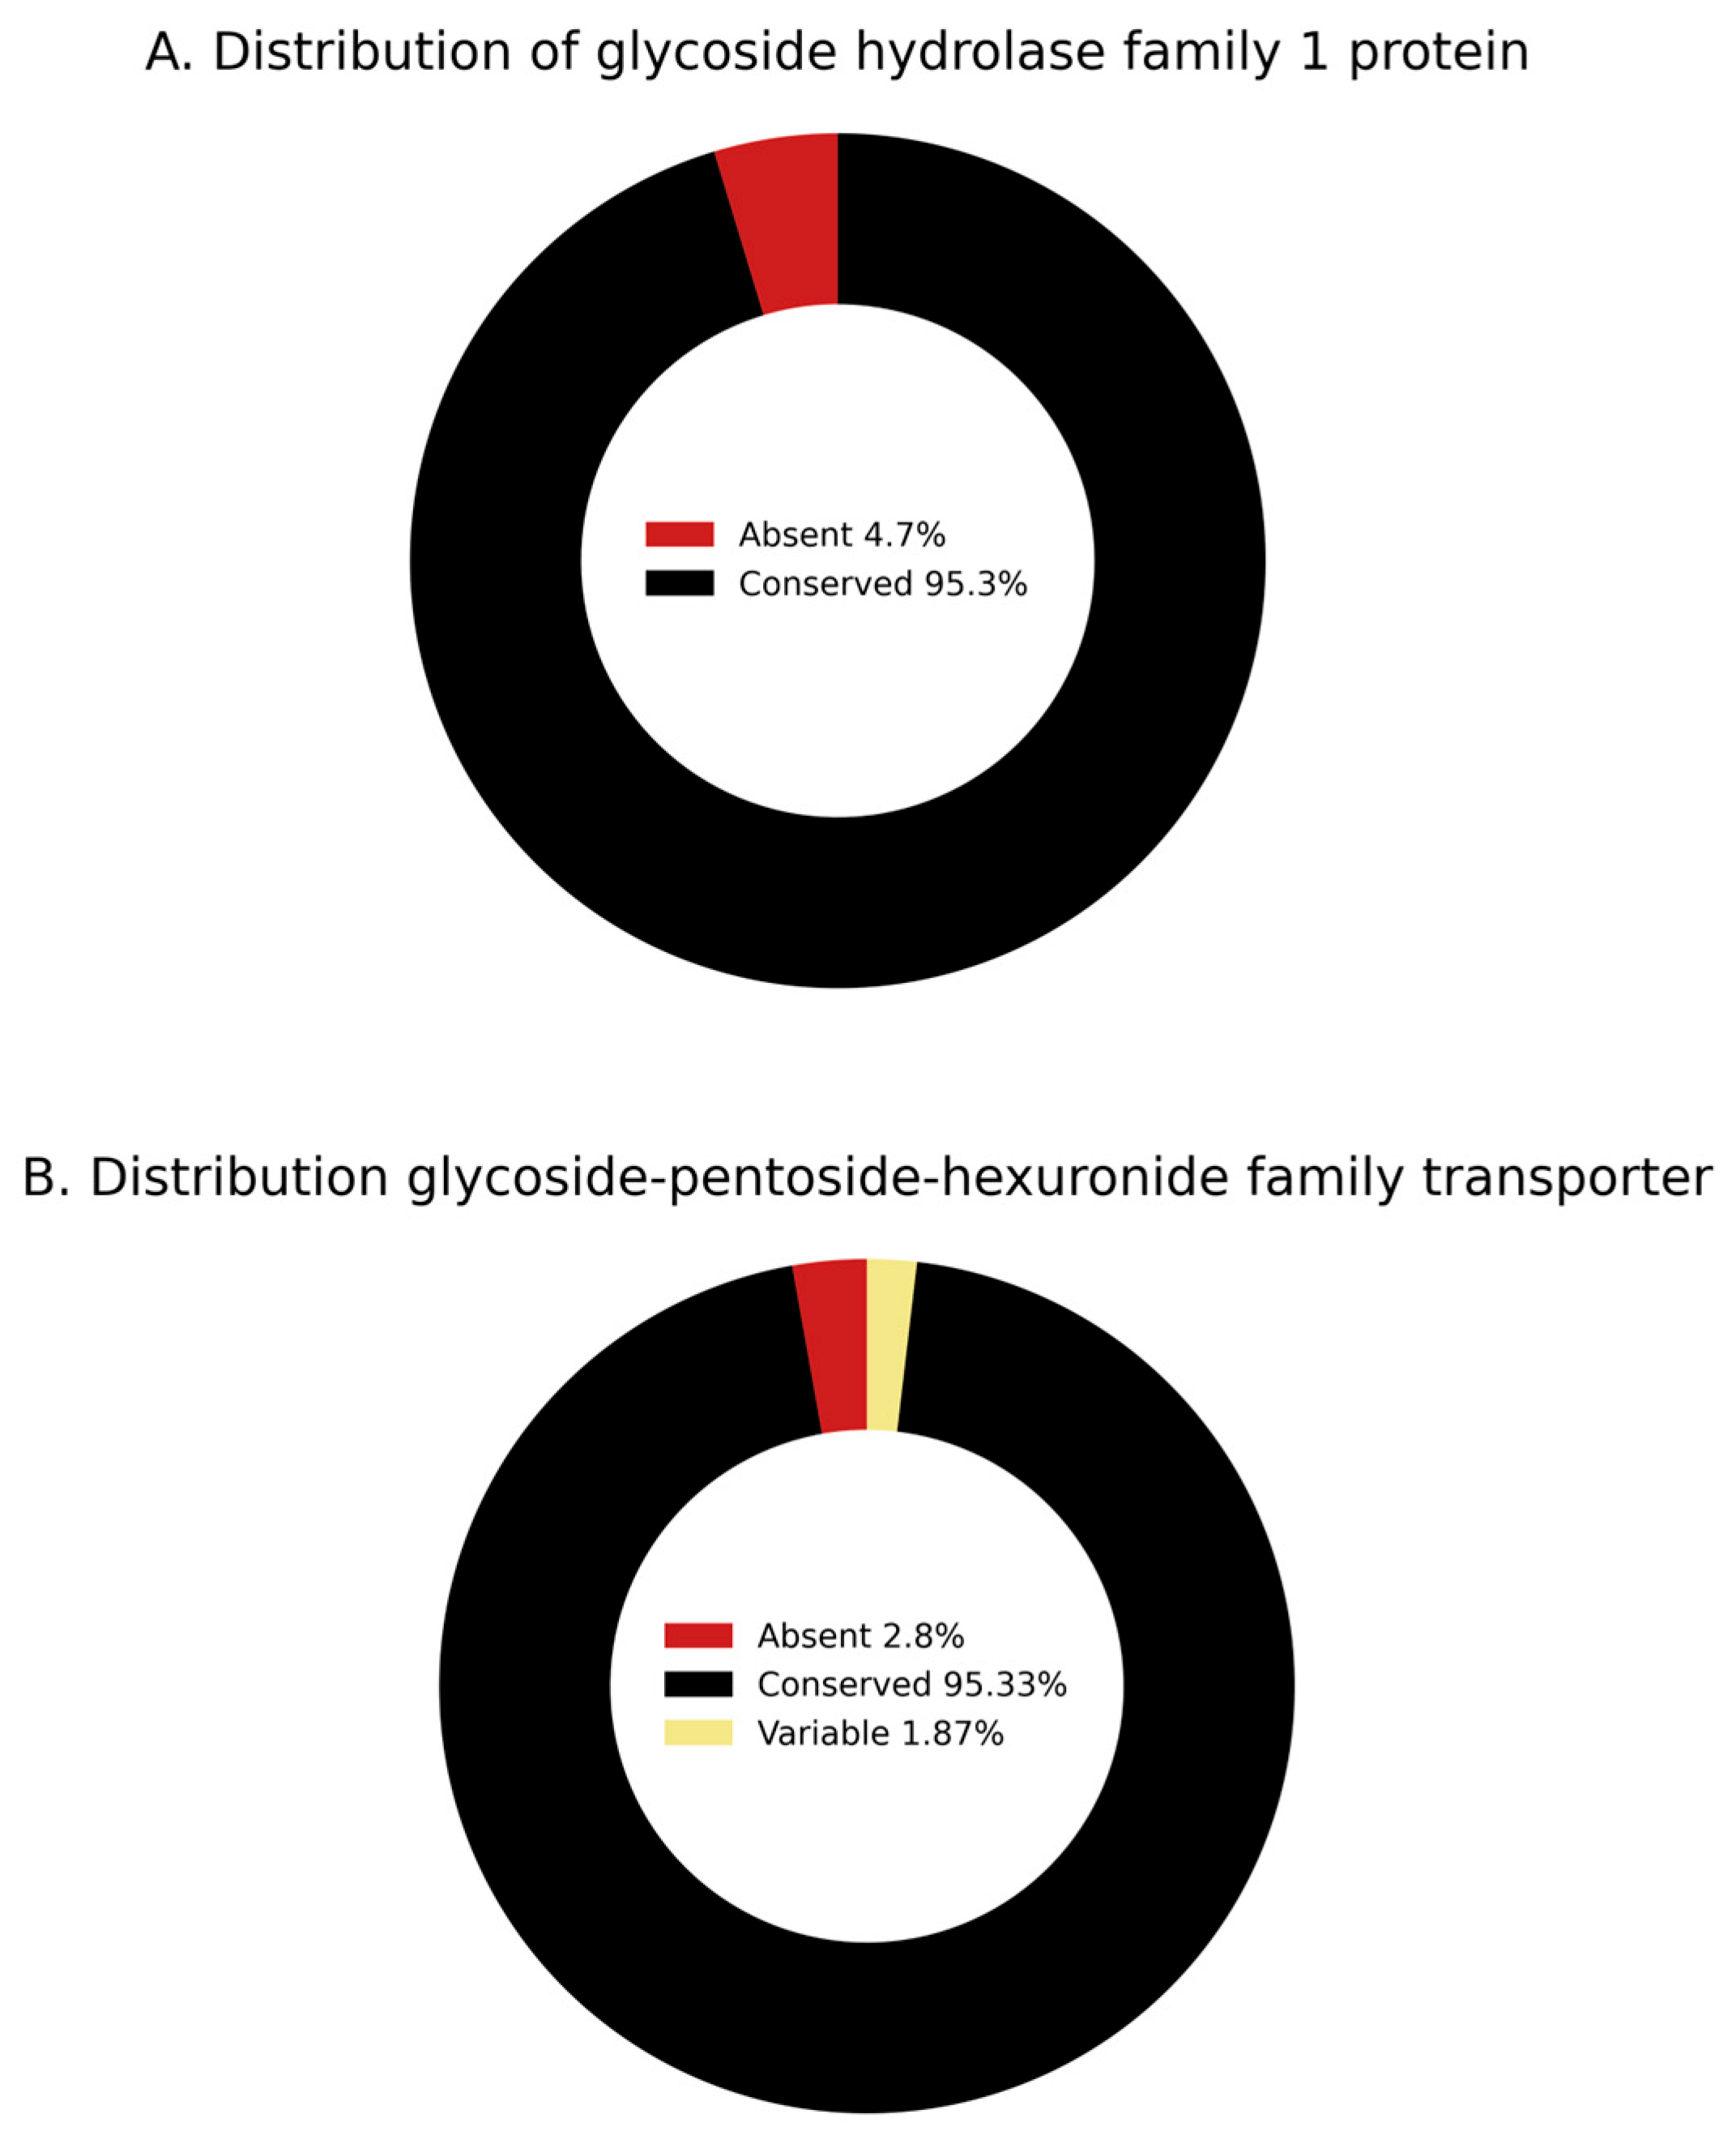
Comparative genomics revealed that genes encoding the GH1 enzyme and the GPH transporter are widely conserved among S. Kentucky isolates, including ST198 (n = 294), ST152 (n = 173), and other sequence types such as ST314 (n = 14) and various minor STs (n = 11) (Table S3). To assess broader conservation across NTS, we screened 1792 genomes representing 107 NTS serovars. The GH1 gene was present in 102 (95.3%) serovars and absent in 5 (4.7%), while the GPH transporter was also conserved in 102 (95.3%) serovars, absent in 3 (2.8%), and variably present in 2 (1.9%) (Figure 10). These results indicate that genes encoding both GH1 and GPH are broadly conserved across NTS.
The roles of these proteins in lactulose hydrolysis or uptake remain unknown. These genes are likely transcriptionally responsive to lactulose or their activity may be regulated through post-transcriptional or post-translational mechanisms [52,53]. Additionally, the CAZy database highlights that GH enzymes display high substrate specificity and are not universally present across all microbes [51,54]. Thus, it is also likely that other glycoside hydroxylase enzymes may also contribute to lactulose hydrolysis in NTS. Collectively, these data support the hypothesis that NTS may rely on a distinct and currently uncharacterized lactulose metabolic pathway. Elucidating the genetic basis of lactulose metabolism in NTS will provide key insights into the metabolic adaptability of NTS.
Lactulose is a synthetic disaccharide frequently used in clinical settings to manage hepatic encephalopathy and constipation. It is also present in heat-treated dairy products and commonly consumed as a dietary supplement at doses ranging from 10 to 60 g per day [55]. Historically, lactulose has been regarded as a prebiotic that is selectively fermented by beneficial gut bacteria, such as Lactobacillus and Bifidobacterium. However, several opportunistic pathogens, including Escherichia, Enterococcus, Klebsiella, Pseudomonas, Streptococcus, and Cronobacter species, have also been reported to metabolize lactulose [32]. Recent studies demonstrate that lactulose can enhance Escherichia coli (E. coli) colonization in both murine models and human subjects, raising concerns about a potential increased risk of systemic infection [56]. Similarly, lactulose supplementation has been shown to promote intestinal translocation of Salmonella enterica serovar Typhimurium [57]. In contrast, some human studies reported no significant effect of lactulose ingestion on E. coli abundance in stool samples of healthy volunteers [58], while others observed a reduction in potentially pathogenic Clostridium spp. following lactulose supplementation [59,60]. In animal models, lactulose reduced intestinal colonization by Salmonella and E. coli in chickens [61], but had no significant effect on Salmonella colonization in pigs [62]. Taken together, these findings suggest that the impact of lactulose on the metabolic fitness and colonization potential of enteric pathogens could be host-dependent and remains inconsistent across studies.
Our findings demonstrate that S. Kentucky and other NTS serovars can metabolize lactulose (Figure 4 and Figure 9B). Given the widespread use of lactulose as a prebiotic in human and veterinary contexts, these results raise important questions regarding the potential for lactulose to modulate the metabolic fitness and colonization potential of pathogenic NTS in vivo. Further studies are warranted to identify genetic determinants of lactulose metabolism in NTS and assess the mechanisms underlying lactulose-mediated modulation of NTS metabolome and its impact on NTS colonization and pathogenesis in vivo.

4. Conclusions

S. Kentucky lineages ST152 and FluR ST198 have diverged both genotypically and phenotypically, following distinct evolutionary and epidemiological trajectories. This study provides the first direct evidence of lineage-specific metabolic specialization, revealing that ST198 exhibits broader physiological plasticity, greater metabolic versatility, and enhanced stress resilience compared to ST152. These traits are evident in their efficient utilization of substrates such as myo-inositol and lactulose at both avian and mammalian physiological temperatures.
Our data show that ST152 lacks the canonical iol gene cluster responsible for myo-inositol catabolism in enteric bacteria, as do several other NTS serovars. Nonetheless, ST152 exhibits weak but detectable growth on myo-inositol, suggesting the existence of a non-canonical or alternative metabolic pathway for inositol utilization in these strains. This finding challenges the current understanding of inositol metabolism in Salmonella and opens new avenues for discovering novel metabolic genes or regulatory networks.
We also report for the first time that multiple NTS serovars, including S. Kentucky, can metabolize lactulose, a synthetic disaccharide traditionally considered fermentable only by beneficial gut microbes. The conservation of genes encoding GH1 and GPH transporter in most NTS serovars points to the potential existence of mechanisms underlying lactulose metabolism in Salmonella.
Together, these findings underscore the metabolic adaptability of ST198 and reveal previously unrecognized metabolic capacity in NTS. Understanding how nutrient utilization pathways contribute to ecological fitness, host adaptation, and antimicrobial resistance in NTS, and, in particular, emerging lineages like FluR ST198, is critical for developing targeted, nutrition-based interventions. Such approaches could serve as alternatives to antibiotics for controlling MDR NTS and other enteric pathogens across human and animal health interfaces.

Supplementary Materials

The following supporting information can be downloaded at: https://www.mdpi.com/article/10.3390/genes16091051/s1, Figure S1. Hierarchical clustering showing distinct metabolic profiles of ST152 and FluR ST198 strains based on the differences in respiratory activity (RA) in different conditions. Table S1. Phenotype Microarray data. Table S2. Distribution of iolCatGC in 107 Salmonella genomes. Table S3. Distribution of GH1 and GPH in 107 Salmonella genomes. Table S4. Primers.

Author Contributions

Conceptualization, J.A. and D.H.S.; Methodology, J.A., R.C.S. and J.G.; Formal analysis, J.A., S.S. and D.H.S.; Investigation, J.A., R.C.S., J.G. and D.H.S.; Resources, D.H.S.; Data curation, J.A., S.S., J.G. and D.H.S.; Writing—original draft, J.A. and D.H.S.; Writing—review & editing, J.A., R.C.S., S.S., J.G., B.J.H. and D.H.S.; Visualization, J.A. and D.H.S.; Supervision, S.S. and D.H.S.; Project administration, D.H.S.; Funding acquisition, J.G. and D.H.S. All authors have read and agreed to the published version of the manuscript.

Funding

This study was funded in part by the Texas Tech University School of Veterinary Medicine (TTU-SVM) and the U.S. National Poultry Research Center, Agriculture Research Service (Research Agreement 6040-32000-011-05J), U.S. Department of Agriculture. Juned Ahmed was supported by the Distinguished Graduate Student Assistantship from Texas Tech University.

Data Availability Statement

All data are included in the manuscript or as Supplementary Files.

Acknowledgments

We thank Samuel Ajulo, Asmita Shrestha, and Vishakha Kulkarni for technical assistance and discussion, and Jonathan Thompson and Fernanda Rosa for technical discussions.

Conflicts of Interest

The authors declare no conflict of interest.

References

  1. Majowicz, S.E.; Musto, J.; Scallan, E.; Angulo, F.J.; Kirk, M.; O’Brien, S.J.; Jones, T.F.; Fazil, A.; Hoekstra, R.M.; for the International Collaboration on Enteric Disease “Burden of Illness” Studies. The Global Burden of Nontyphoidal Salmonella Gastroenteritis. Clin. Infect. Dis. 2010, 50, 882–889. [Google Scholar] [CrossRef]
  2. Haley, B.J.; Kim, S.W.; Haendiges, J.; Keller, E.; Torpey, D.; Kim, A.; Crocker, K.; Myers, R.A.; Van Kessel, J.A.S. Salmonella Enterica Serovar Kentucky Recovered from Human Clinical Cases in Maryland, USA (2011–2015). Zoonoses Public Health 2019, 66, 382–392. [Google Scholar] [CrossRef]
  3. Richards, A.K.; Kue, S.; Norris, C.G.; Shariat, N.W. Genomic and Phenotypic Characterization of Salmonella Enterica Serovar Kentucky. Microb. Genom. 2023, 9, 001089. [Google Scholar] [CrossRef]
  4. Tate, H.; Hsu, C.-H.; Chen, J.C.; Han, J.; Foley, S.L.; Folster, J.P.; Francois Watkins, L.K.; Reynolds, J.; Tillman, G.E.; Nyirabahizi, E.; et al. Genomic Diversity, Antimicrobial Resistance, and Virulence Gene Profiles of Salmonella Serovar Kentucky Isolated from Humans, Food, and Animal Ceca Content Sources in the United States. Foodborne Pathog. Dis. 2022, 19, 509–521. [Google Scholar] [CrossRef] [PubMed]
  5. Biggel, M.; Horlbog, J.; Nüesch-Inderbinen, M.; Chattaway, M.A.; Stephan, R. Epidemiological Links and Antimicrobial Resistance of Clinical Salmonella Enterica ST198 Isolates: A Nationwide Microbial Population Genomic Study in Switzerland. Microb. Genom. 2022, 8, 000877. [Google Scholar] [CrossRef]
  6. Hello, S.L.; Harrois, D.; Bouchrif, B.; Sontag, L.; Elhani, D.; Guibert, V.; Zerouali, K.; Weill, F.-X. Highly Drug-Resistant Salmonella Enterica Serotype Kentucky ST198-X1: A Microbiological Study. Lancet Infect. Dis. 2013, 13, 672–679. [Google Scholar] [CrossRef]
  7. Mashe, T.; Thilliez, G.; Chaibva, B.V.; Leekitcharoenphon, P.; Bawn, M.; Nyanzunda, M.; Robertson, V.; Tarupiwa, A.; Al-Khanaq, H.; Baker, D.; et al. Highly Drug Resistant Clone of Salmonella Kentucky ST198 in Clinical Infections and Poultry in Zimbabwe. Npj Antimicrob. Resist. 2023, 1, 6. [Google Scholar] [CrossRef]
  8. Slowey, R.; Kim, S.W.; Prendergast, D.; Madigan, G.; Van Kessel, J.A.S.; Haley, B.J. Genomic Diversity and Resistome Profiles of Salmonella Enterica Subsp. Enterica Serovar Kentucky Isolated from Food and Animal Sources in Ireland. Zoonoses Public Health 2022, 69, 1–12. [Google Scholar] [CrossRef] [PubMed]
  9. Soltys, R.C.; Sakomoto, C.K.; Oltean, H.N.; Guard, J.; Haley, B.J.; Shah, D.H. High-Resolution Comparative Genomics of Salmonella Kentucky Aids Source Tracing and Detection of ST198 and ST152 Lineage-Specific Mutations. Front. Sustain. Food Syst. 2021, 5, 695368. [Google Scholar] [CrossRef]
  10. Haley, B.J.; Kim, S.W.; Pettengill, J.; Luo, Y.; Karns, J.S.; Kessel, J.A.S.V. Genomic and Evolutionary Analysis of Two Salmonella Enterica Serovar Kentucky Sequence Types Isolated from Bovine and Poultry Sources in North America. PLoS ONE 2016, 11, e0161225. [Google Scholar] [CrossRef]
  11. Wang, Z.; Jiang, Y.; Xu, H.; Jiao, X.; Wang, J.; Li, Q. Poultry Production as the Main Reservoir of Ciprofloxacin- and Tigecycline-Resistant Extended-Spectrum β-Lactamase (ESBL)-Producing Salmonella Enterica Serovar Kentucky ST198.2-2 Causing Human Infections in China. Appl. Environ. Microbiol. 2023, 89, e00944-23. [Google Scholar] [CrossRef]
  12. Chen, H.; Song, J.; Zeng, X.; Chen, D.; Chen, R.; Qiu, C.; Zhou, K. National Prevalence of Salmonella Enterica Serotype Kentucky ST198 with High-Level Resistance to Ciprofloxacin and Extended-Spectrum Cephalosporins in China, 2013 to 2017. mSystems 2021, 6, e00935-20. [Google Scholar] [CrossRef]
  13. Vázquez, X.; Fernández, J.; Bances, M.; Lumbreras, P.; Alkorta, M.; Hernáez, S.; Prieto, E.; de la Iglesia, P.; de Toro, M.; Rodicio, M.R.; et al. Genomic Analysis of Ciprofloxacin-Resistant Salmonella Enterica Serovar Kentucky ST198 From Spanish Hospitals. Front. Microbiol. 2021, 12, 720449. [Google Scholar] [CrossRef]
  14. Wołkowicz, T.; Zacharczuk, K.; Gierczyński, R.; Nowakowska, M.; Piekarska, K. Antimicrobial Resistance and Whole-Genome Characterisation of High-Level Ciprofloxacin-Resistant Salmonella Enterica Serovar Kentucky ST 198 Strains Isolated from Human in Poland. Int. J. Mol. Sci. 2021, 22, 9381. [Google Scholar] [CrossRef] [PubMed]
  15. Shah, D.H.; Paul, N.C.; Guard, J. Complete Genome Sequence of a Ciprofloxacin-Resistant Salmonella Enterica Subsp. Enterica Serovar Kentucky Sequence Type 198 Strain, PU131, Isolated from a Human Patient in Washington State. Genome Announc. 2018, 6, e00125-18. [Google Scholar] [CrossRef]
  16. Cummings, K.J.; Siler, J.D.; Goodman, L.B.; Childs-Sanford, S.E. Ciprofloxacin-Resistant ST198 Salmonella Kentucky in a Hospitalized American Black Bear (Ursus americanus), with Evidence of Subsequent Nosocomial Transmission. Zoonoses Public Health 2023, 70, 657–664. [Google Scholar] [CrossRef]
  17. Okoro, C.K.; Barquist, L.; Connor, T.R.; Harris, S.R.; Clare, S.; Stevens, M.P.; Arends, M.J.; Hale, C.; Kane, L.; Pickard, D.J.; et al. Signatures of Adaptation in Human Invasive Salmonella Typhimurium ST313 Populations from Sub-Saharan Africa. PLoS Negl. Trop. Dis. 2015, 9, e0003611. [Google Scholar] [CrossRef]
  18. Serrano-Fujarte, I.; Calva, E.; García-Domínguez, J.; Ortiz-Jiménez, S.; Puente, J.L. Population Structure and Ongoing Microevolution of the Emerging Multidrug-Resistant Salmonella Typhimurium ST213. Npj Antimicrob. Resist. 2024, 2, 10. [Google Scholar] [CrossRef]
  19. Tanner, J.R.; Kingsley, R.A. Evolution of Salmonella within Hosts. Trends Microbiol. 2018, 26, 986–998. [Google Scholar] [CrossRef] [PubMed]
  20. Burin, R.; Shah, D.H. Phenelzine and Amoxapine Inhibit Tyramine and D-Glucuronic Acid Catabolism in Clinically Significant Salmonella in A Serotype-Independent Manner. Pathogens 2021, 10, 469. [Google Scholar] [CrossRef]
  21. Chiok, K.L.; Addwebi, T.; Guard, J.; Shah, D.H. Dimethyl Adenosine Transferase (KsgA) Deficiency in Salmonella Enterica Serovar Enteritidis Confers Susceptibility to High Osmolarity and Virulence Attenuation in Chickens. Appl. Environ. Microbiol. 2013, 79, 7857–7866. [Google Scholar] [CrossRef] [PubMed]
  22. Elder, J.R.; Paul, N.C.; Burin, R.; Guard, J.; Shah, D.H. Genomic Organization and Role of SPI-13 in Nutritional Fitness of Salmonella. Int. J. Med. Microbiol. IJMM 2018, 308, 1043–1052. [Google Scholar] [CrossRef] [PubMed]
  23. Guard-Bouldin, J.; Morales, C.A.; Frye, J.G.; Gast, R.K.; Musgrove, M. Detection of Salmonella Enterica Subpopulations by Phenotype Microarray Antibiotic Resistance Patterns. Appl. Environ. Microbiol. 2007, 73, 7753–7756. [Google Scholar] [CrossRef]
  24. Kolde, R. Pheatmap: Pretty Heatmaps. R Package, version 1.0.12. 2019. Available online: https://CRAN.R-project.org/package=pheatmap (accessed on 26 August 2025).
  25. Dereeper, A.; Summo, M.; Meyer, D.F. PanExplorer: A Web-Based Tool for Exploratory Analysis and Visualization of Bacterial Pan-Genomes. Bioinformatics 2022, 38, 4412–4414. [Google Scholar] [CrossRef]
  26. Kröger, C.; Rothhardt, J.E.; Brokatzky, D.; Felsl, A.; Kary, S.C.; Heermann, R.; Fuchs, T.M. The Small RNA RssR Regulates Myo-Inositol Degradation by Salmonella Enterica. Sci. Rep. 2018, 8, 17739. [Google Scholar] [CrossRef]
  27. Weber, M.; Fuchs, T.M. Metabolism in the Niche: A Large-Scale Genome-Based Survey Reveals Inositol Utilization To Be Widespread among Soil, Commensal, and Pathogenic Bacteria. Microbiol. Spectr. 2022, 10, e02013-22. [Google Scholar] [CrossRef] [PubMed]
  28. Medema, M.H.; Takano, E.; Breitling, R. Detecting Sequence Homology at the Gene Cluster Level with MultiGeneBlast. Mol. Biol. Evol. 2013, 30, 1218–1223. [Google Scholar] [CrossRef]
  29. Olson, R.D.; Assaf, R.; Brettin, T.; Conrad, N.; Cucinell, C.; Davis, J.J.; Dempsey, D.M.; Dickerman, A.; Dietrich, E.M.; Kenyon, R.W.; et al. Introducing the Bacterial and Viral Bioinformatics Resource Center (BV-BRC): A Resource Combining PATRIC, IRD and ViPR. Nucleic Acids Res. 2023, 51, D678–D689. [Google Scholar] [CrossRef]
  30. Baramee, S.; Siriatcharanon, A.-K.; Waeonukul, R.; Pason, P.; Tachaapaikoon, C.; Ratanakhanokchai, K. A Novel β-Galactosidase from Anaerobic Thermophilic Caldicellulosiruptor Saccharolyticus DSM 8903 with High Potential for Lactulose Production. J. Sci. Food Agric. 2025, 105, 6781–6789. [Google Scholar] [CrossRef]
  31. Kumari, S.; Panesar, P.S.; Panwar, D.; Singla, G. Lactulose. In Probiotics, Prebiotics and Synbiotics; John Wiley & Sons, Ltd.: Hoboken, NJ, USA, 2022; pp. 338–360. ISBN 978-1-119-70216-0. [Google Scholar]
  32. Mao, B.; Li, D.; Zhao, J.; Liu, X.; Gu, Z.; Chen, Y.Q.; Zhang, H.; Chen, W. In Vitro Fermentation of Lactulose by Human Gut Bacteria. J. Agric. Food Chem. 2014, 62, 10970–10977. [Google Scholar] [CrossRef]
  33. Sahota, S.S.; Bramley, P.M.; Menzies, I.S. The Fermentation of Lactulose by Colonic Bacteria. Microbiology 1982, 128, 319–325. [Google Scholar] [CrossRef]
  34. Vičič, V.; Pandel Mikuš, R.; Ferjančič, B. Review of History and Mechanisms of Action of Lactulose (4-O-β-D-Galactopyranosyl-β-D-Fructofuranose): Present and Future Applications in Food. J. Food Sci. Technol. 2024, 61, 2036–2045. [Google Scholar] [CrossRef]
  35. Aung, K.T.; Khor, W.C.; Ong, K.H.; Tan, W.L.; Wong, Z.N.; Oh, J.Q.; Wong, W.K.; Tan, B.Z.Y.; Maiwald, M.; Tee, N.W.S.; et al. Characterisation of Salmonella Enteritidis ST11 and ST1925 Associated with Human Intestinal and Extra-Intestinal Infections in Singapore. Int. J. Environ. Res. Public Health 2022, 19, 5671. [Google Scholar] [CrossRef]
  36. Pulford, C.V.; Perez-Sepulveda, B.M.; Canals, R.; Bevington, J.A.; Bengtsson, R.J.; Wenner, N.; Rodwell, E.V.; Kumwenda, B.; Zhu, X.; Bennett, R.J.; et al. Stepwise Evolution of Salmonella Typhimurium ST313 Causing Bloodstream Infection in Africa. Nat. Microbiol. 2021, 6, 327–338. [Google Scholar] [CrossRef] [PubMed]
  37. Boas Lichty, K.E.; Loughran, R.M.; Ushijima, B.; Richards, G.P.; Boyd, E.F. Osmotic Stress Response of the Coral and Oyster Pathogen Vibrio Coralliilyticus: Acquisition of Catabolism Gene Clusters for the Compatible Solute and Signaling Molecule Myo-Inositol. Appl. Environ. Microbiol. 2024, 90, e00920-24. [Google Scholar] [CrossRef]
  38. Manske, C.; Schell, U.; Hilbi, H. Metabolism of Myo-Inositol by Legionella Pneumophila Promotes Infection of Amoebae and Macrophages. Appl. Environ. Microbiol. 2016, 82, 5000–5014. [Google Scholar] [CrossRef]
  39. Felsl, A.; Brokatzky, D.; Kröger, C.; Heermann, R.; Fuchs, T.M. Hierarchic Regulation of a Metabolic Pathway: H-NS, CRP, and SsrB Control Myo-Inositol Utilization by Salmonella Enterica. Microbiol. Spectr. 2023, 12, e02724-23. [Google Scholar] [CrossRef]
  40. Rothhardt, J.E.; Kröger, C.; Broadley, S.P.; Fuchs, T.M. The Orphan Regulator ReiD of Salmonella Enterica Is Essential for Myo-Inositol Utilization. Mol. Microbiol. 2014, 94, 700–712. [Google Scholar] [CrossRef] [PubMed]
  41. Kröger, C.; Stolz, J.; Fuchs, T.M. Myo-Inositol Transport by Salmonella Enterica Serovar Typhimurium. Microbiology 2010, 156, 128–138. [Google Scholar] [CrossRef] [PubMed]
  42. Chhetri, D.R. Myo-Inositol and Its Derivatives: Their Emerging Role in the Treatment of Human Diseases. Front. Pharmacol. 2019, 10, 1172. [Google Scholar] [CrossRef]
  43. Croze, M.L.; Soulage, C.O. Potential Role and Therapeutic Interests of Myo-Inositol in Metabolic Diseases. Biochimie 2013, 95, 1811–1827. [Google Scholar] [CrossRef]
  44. Vitale, S.G.; Corrado, F.; Caruso, S.; Di Benedetto, A.; Giunta, L.; Cianci, A.; D’Anna, R. Myo-Inositol Supplementation to Prevent Gestational Diabetes in Overweight Non-Obese Women: Bioelectrical Impedance Analysis, Metabolic Aspects, Obstetric and Neonatal Outcomes—A Randomized and Open-Label, Placebo-Controlled Clinical Trial. Int. J. Food Sci. Nutr. 2021, 72, 670–679. [Google Scholar] [CrossRef]
  45. Food Phytates, 1st ed.; Reddy, N.R., Sathe, S.K., Eds.; CRC Press: Boca Raton, FL, USA, 2001. [Google Scholar] [CrossRef]
  46. Schlemmer, U.; Frølich, W.; Prieto, R.M.; Grases, F. Phytate in Foods and Significance for Humans: Food Sources, Intake, Processing, Bioavailability, Protective Role and Analysis. Mol. Nutr. Food Res. 2009, 53, S330–S375. [Google Scholar] [CrossRef] [PubMed]
  47. Lam, S.; McWilliams, A.; LeRiche, J.; MacAulay, C.; Wattenberg, L.; Szabo, E. A Phase I Study of Myo-Inositol for Lung Cancer Chemoprevention. Cancer Epidemiol. Biomark. Prev. 2006, 15, 1526–1531. [Google Scholar] [CrossRef]
  48. Regidor, P.-A.; Schindler, A.E. Myoinositol as a Safe and Alternative Approach in the Treatment of Infertile PCOS Women: A German Observational Study. Int. J. Endocrinol. 2016, 2016, 9537632. [Google Scholar] [CrossRef] [PubMed]
  49. Norris, F.A.; Wilson, M.P.; Wallis, T.S.; Galyov, E.E.; Majerus, P.W. SopB, a Protein Required for Virulence of Salmonella Dublin, Is an Inositol Phosphate Phosphatase. Proc. Natl. Acad. Sci. USA 1998, 95, 14057–14059. [Google Scholar] [CrossRef]
  50. Zhou, D.; Chen, L.M.; Hernandez, L.; Shears, S.B.; Galán, J.E. A Salmonella Inositol Polyphosphatase Acts in Conjunction with Other Bacterial Effectors to Promote Host Cell Actin Cytoskeleton Rearrangements and Bacterial Internalization. Mol. Microbiol. 2001, 39, 248–259. [Google Scholar] [CrossRef]
  51. Berlemont, R.; Martiny, A.C. Glycoside Hydrolases across Environmental Microbial Communities. PLoS Comput. Biol. 2016, 12, e1005300. [Google Scholar] [CrossRef]
  52. El Mouali, Y.; Gaviria-Cantin, T.; Sánchez-Romero, M.A.; Gibert, M.; Westermann, A.J.; Vogel, J.; Balsalobre, C. CRP-cAMP Mediates Silencing of Salmonella Virulence at the Post-Transcriptional Level. PLoS Genet. 2018, 14, e1007401. [Google Scholar] [CrossRef] [PubMed]
  53. Hung, C.-C.; Garner, C.D.; Slauch, J.M.; Dwyer, Z.W.; Lawhon, S.D.; Frye, J.G.; McClelland, M.; Ahmer, B.M.M.; Altier, C. The Intestinal Fatty Acid Propionate Inhibits Salmonella Invasion through the Post-Translational Control of HilD. Mol. Microbiol. 2013, 87, 1045–1060. [Google Scholar] [CrossRef]
  54. Lombard, V.; Golaconda Ramulu, H.; Drula, E.; Coutinho, P.M.; Henrissat, B. The Carbohydrate-Active Enzymes Database (CAZy) in 2013. Nucleic Acids Res. 2014, 42, D490–D495. [Google Scholar] [CrossRef] [PubMed]
  55. Karakan, T.; Tuohy, K.M.; Janssen-van Solingen, G. Low-Dose Lactulose as a Prebiotic for Improved Gut Health and Enhanced Mineral Absorption. Front. Nutr. 2021, 8, 672925. [Google Scholar] [CrossRef] [PubMed]
  56. Hecht, A.L.; Mahmud, N.; Chaudhry, S.; Cao, J.Y.; Branigan, G.P.; Lee, J.; Theiller, E.; Roggiani, M.; Friedman, E.S.; Herman, L.; et al. Carbohydrate Consumption Drives Adaptive Mutations in Escherichia Coli Associated with Increased Risk for Systemic Infection. BioRxiv 2025. [Google Scholar] [CrossRef]
  57. Bovee-Oudenhoven, I.M.J.; ten Bruggencate, S.J.M.; Lettink-Wissink, M.L.G.; Meer, R. van der Dietary Fructo-Oligosaccharides and Lactulose Inhibit Intestinal Colonisation but Stimulate Translocation of Salmonella in Rats. Gut 2003, 52, 1572–1578. [Google Scholar] [CrossRef]
  58. Wotzka, S.Y.; Kreuzer, M.; Maier, L.; Zünd, M.; Schlumberger, M.; Nguyen, B.; Fox, M.; Pohl, D.; Heinrich, H.; Rogler, G.; et al. Microbiota Stability in Healthy Individuals after Single-Dose Lactulose Challenge—A Randomized Controlled Study. PLoS ONE 2018, 13, e0206214. [Google Scholar] [CrossRef]
  59. Terada, A.; Hara, H.; Kataoka, M.; Mitsuoka, T. Effect of Lactulose on the Composition and Metabolic Activity of the Human Faecal Flora. Microb. Ecol. Health Dis. 1992, 5, 43–50. [Google Scholar] [CrossRef]
  60. Tuohy, K.M.; Ziemer, C.J.; Klinder, A.; Knöbel, Y.; Pool-Zobel, B.L.; Gibson, G.R. A Human Volunteer Study to Determine the Prebiotic Effects of Lactulose Powder on Human Colonic Microbiota. Microb. Ecol. Health Dis. 2002, 14, 165–173. [Google Scholar] [CrossRef]
  61. Mohammadi Gheisar, M.; Nyachoti, C.M.; Hancock, J.D.; Kim, I.H. Effects of Lactulose on Growth, Carcass Characteristics, Faecal Microbiota, and Blood Constituents in Broilers. Veterinární Medicína 2016, 61, 90–96. [Google Scholar] [CrossRef]
  62. Martín-Peláez, S.; Costabile, A.; Hoyles, L.; Rastall, R.A.; Gibson, G.R.; La Ragione, R.M.; Woodward, M.J.; Mateu, E.; Martín-Orúe, S.M. Evaluation of the Inclusion of a Mixture of Organic Acids or Lactulose into the Feed of Pigs Experimentally Challenged with Salmonella Typhimurium. Vet. Microbiol. 2010, 142, 337–345. [Google Scholar] [CrossRef] [PubMed]
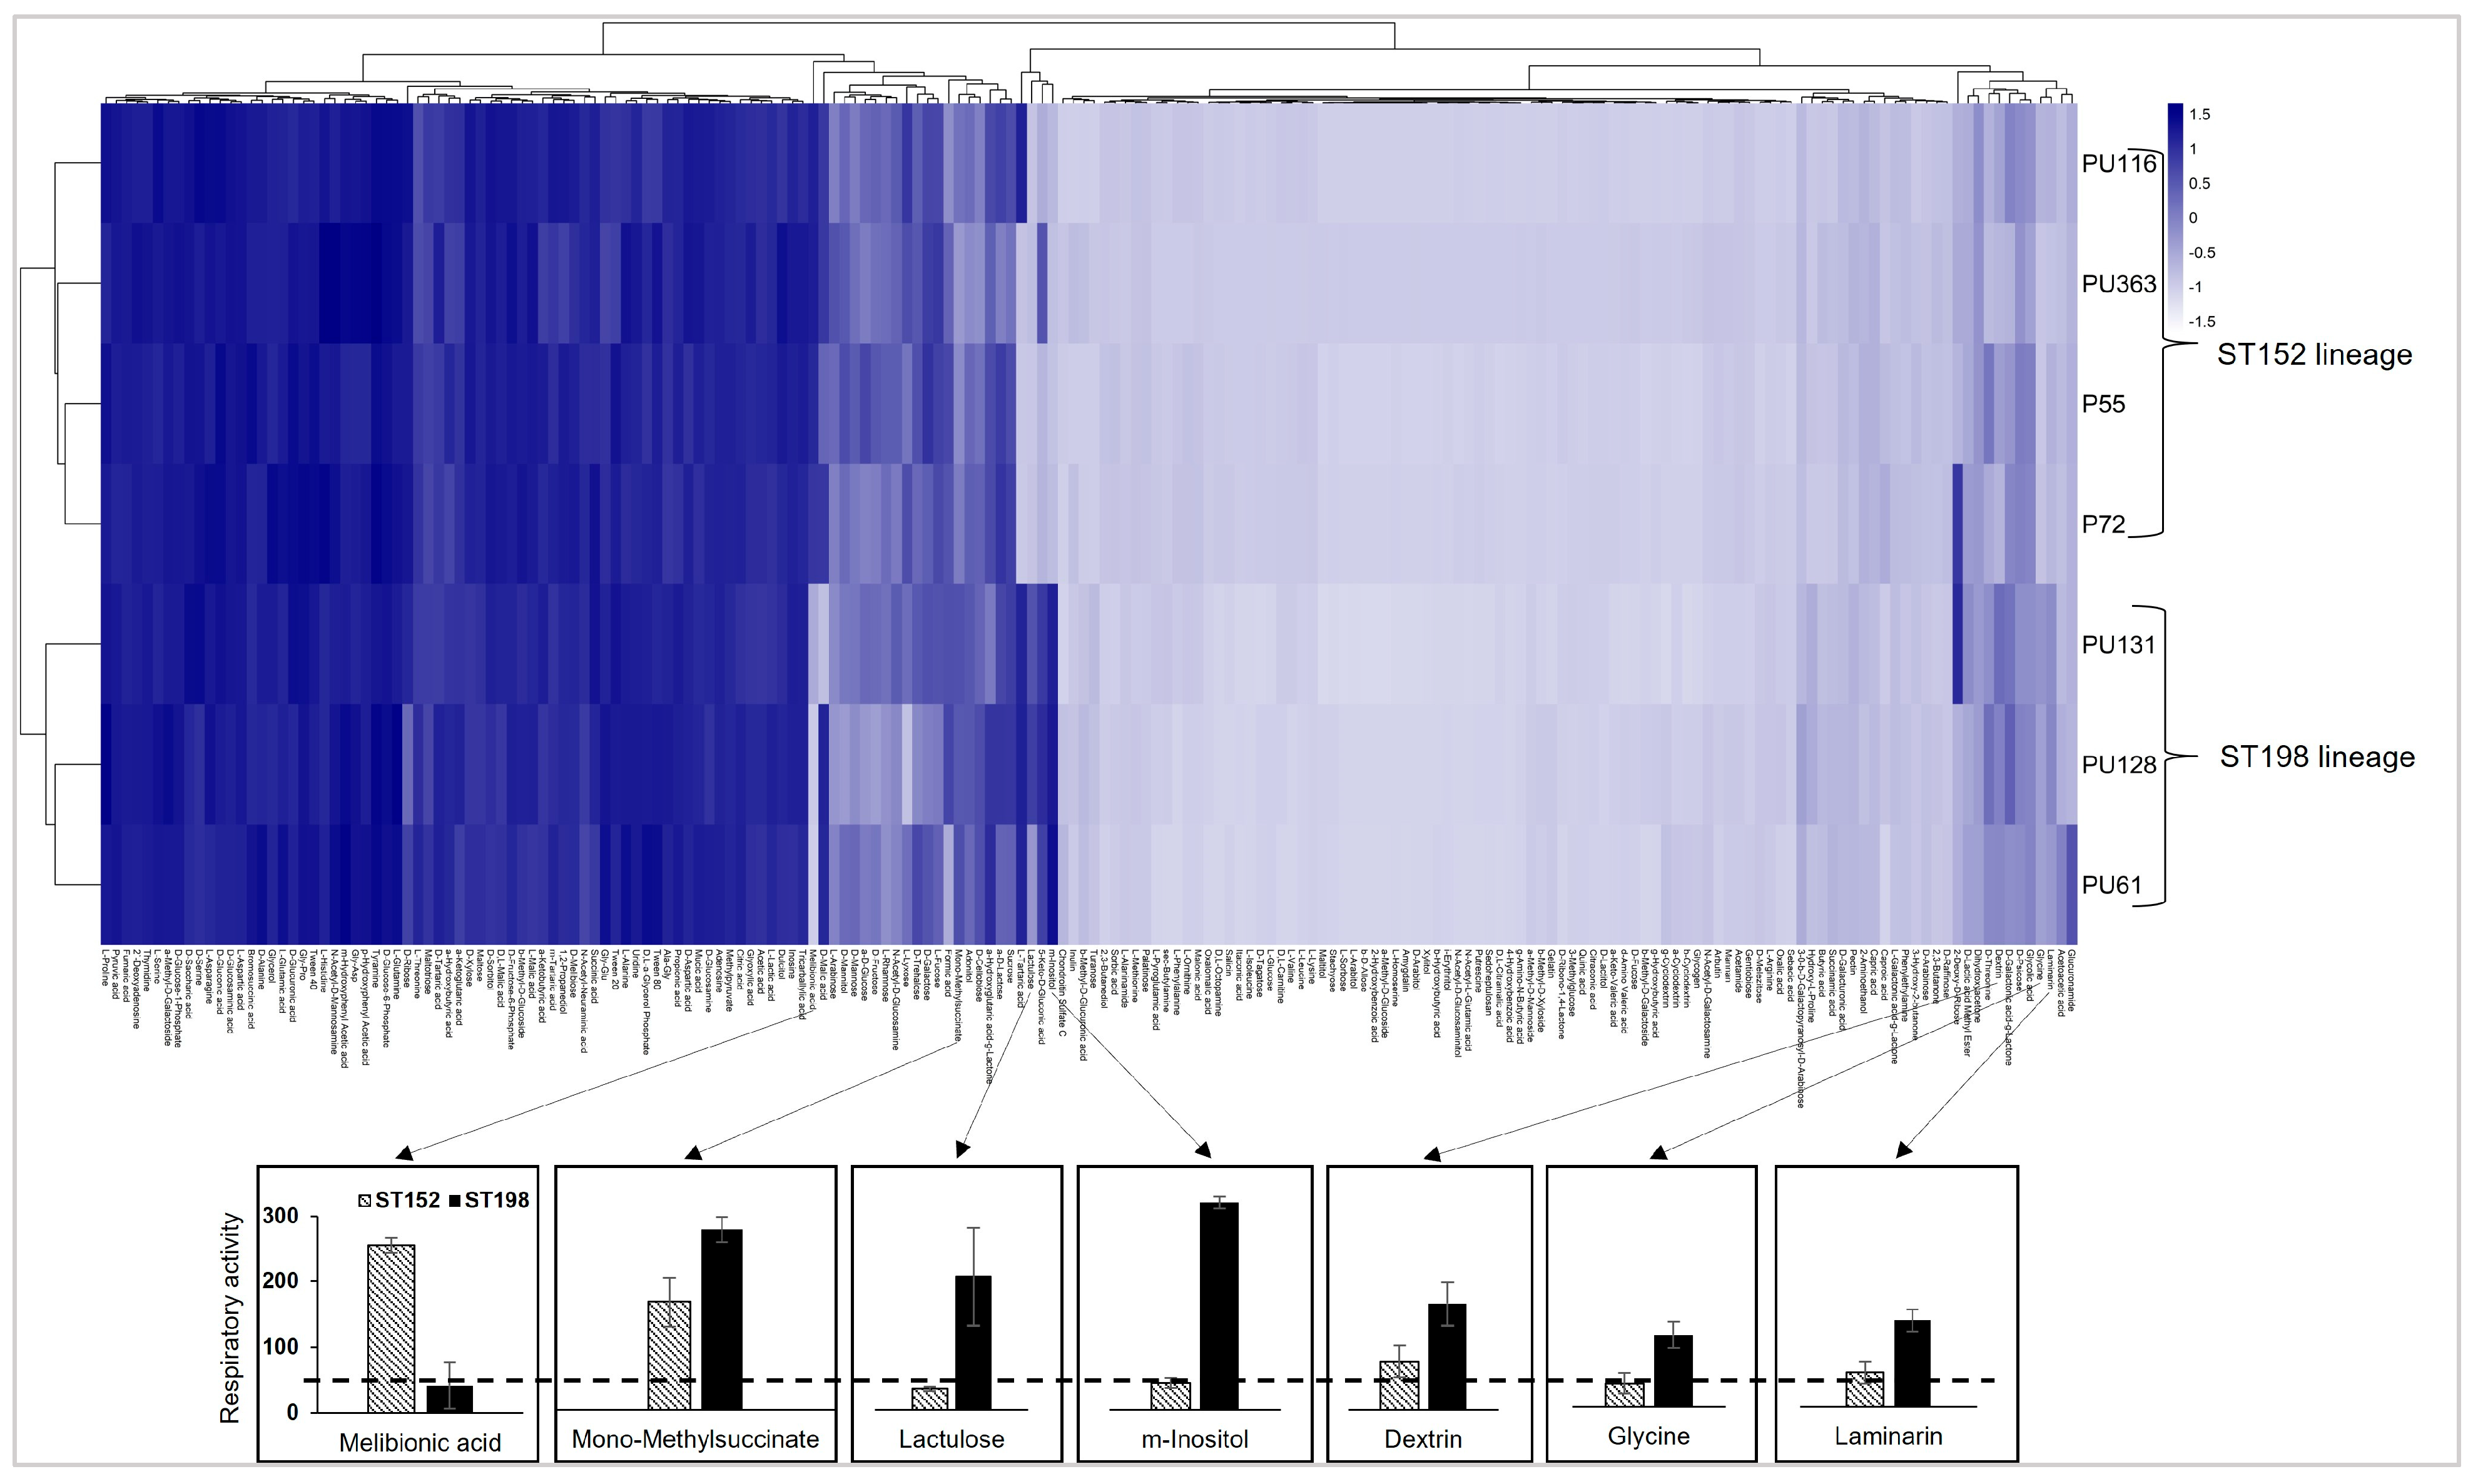
Figure 1. Hierarchical clustering showing distinct metabolic profiles of ST152 and FluR ST198 strains based on the differences in respiratory activity (RA) in the presence of 190 different carbon compounds as sole energy sources. The X-axis shows the clusters of carbon sources. The Y-axis shows the clusters formed by strains within each lineage tested in this study. The dark blue indicates higher RA, and the light blue to white color indicates lower RA, with the bar graphs below showing seven carbon sources that are significantly differentially utilized by ST152 and FluR ST198 strains with an RA difference of >50 at a p-value of ≤0.01. The Y-axis in each bar graph shows RA activity in the presence of each carbon source, and the dotted line represents the RA value cutoff of 50.
Genes 16 01051 g001
Figure 2. Difference in the respiratory activity (RA) between ST152 and FluR ST198 strains. ST152 and FluR ST198 strains showed significant differences (p < 0.01) in RA for six different nitrogen/sulfur compounds as sole energy source (A) and in response to six stressors (B). The dotted lines indicate the RA value cutoff of 50.
Genes 16 01051 g002
Figure 3. The log10 difference in growth of FluR ST198 (black bars) strains was significantly higher than ST152 (hatched bar) using myo-inositol as the sole energy source at three different concentrations at 42 °C (A) and using a 20 mM concentration at 37 °C (B). The doubling time of FluR ST198 was also significantly lower (p < 0.05) than ST152 at both 42 °C and 37 °C (C). * Indicates significant difference between FluR ST198 and ST152 under same nutrient and temperature (p < 0.05).
Genes 16 01051 g003
Figure 4. The log10 CFU/mL differences in growth of FluR ST198 (black bars) strains were significantly higher than ST152 (hatched bar) under lactulose as the sole energy source at 10 mM and 20 mM concentrations at 42 °C (A) and at 20 mM concentration at 37 °C incubation temperature (B). The doubling time of FluR ST198 was also significantly lower (p < 0.05) than ST152 at both 42 °C and 37 °C (C). * Indicates significant difference between FluR ST198 and ST152 under same nutrient and temperature (p < 0.05).
Genes 16 01051 g004
Figure 5. Distribution of genes (n = 5464) (A) within the pan-genome of epidemiologically distinct FluR ST198 (n = 3) (B) and ST152 (n = 4) strains (C).
Genes 16 01051 g005
Figure 6. Distribution of iolCatGC involved in myo-inositol catabolism in S. Kentucky FluR ST198 (n = 3) and ST152 (n = 4) strains (A). Differential carriage of iolCatGC in different Salmonella serovars (B). * Flanking genes. Identical color shows identical genes.
Genes 16 01051 g006
Figure 7. Differential carriage of inositol catabolic gene cluster iolCatGC across S. Kentucky ST198 (n = 294), ST152 (n = 173), ST314 (n = 14), ST2132 (n = 3), ST19 (n = 2), ST32, ST64, ST166, ST318, ST639, ST1679 (n = 1 each) (A), and 107 different NTS serovars including S. Kentucky (B).
Genes 16 01051 g007
Figure 8. The expression of inositol catabolic genes (iolT1 and reiD) was upregulated in response to myo-inositol when compared to glucose as a control condition.
Genes 16 01051 g008
Figure 9. S. Kentucky ST198, S. Typhimurium, and S. Hadar exhibited significantly higher growth with lower Td under myo-inositol (20 mM) supplementation, whereas S. Kentucky ST152, S. Enteritidis, S. Montevideo, and S. Schwarzengrund had impaired growth, exhibited by lower log10 change with higher Td under the same conditions (A). All of these strains demonstrated serovar-independent growth when lactulose (20 mM) was supplemented as the sole energy source (B). The value above each column represents doubling time in hours at 72 h post-incubation.
Genes 16 01051 g009
Figure 10. Differential carriage of Glycoside Hydrolase Family 1 (GH1) Protein (A) and Glycoside-pentoside-hexuronide (GPH) Family Transporter (B) across 107 different Salmonella serovars.
Genes 16 01051 g010
Table 1. Wild-type S. Kentucky and other NTS strains used in this study.
SerovarST TypeStrain IDSourceResistance Isolation YearTravel HistoryReference
S. KentuckyST198PU61HumanFluR2004Egypt, the Middle East, India, Tanzania, Ethiopia, Ivory Coast, or MoroccoSoltys et al., 2021 [9]
S. KentuckyST198PU128HumanFluR2013
S. KentuckyST198PU131HumanFluR2013
S. KentuckyST152P55PoultryFluS2012Not available
S. KentuckyST152P72PoultryFluS2012Not available
S. KentuckyST152PU116HumanFluS2012No travel outside North America
S. KentuckyST152PU363PoultryFluS2005Not available
S. TyphimuriumUnknown21611UnknownNot testedUnknownNot availableBurin and Shah, 2021 [20]
S. HadarUnknown27032HumanNot tested2014Not available
S. EnteritidisUnknownMD15HumanNot tested2010Not available
S. MontevideoUnknownDHS-R6UnknownNot testedUnknownNot available
S. SchwarzengrundUnknown26682HumanNot tested2014Not available
Disclaimer/Publisher’s Note: The statements, opinions and data contained in all publications are solely those of the individual author(s) and contributor(s) and not of MDPI and/or the editor(s). MDPI and/or the editor(s) disclaim responsibility for any injury to people or property resulting from any ideas, methods, instructions or products referred to in the content.