Article

Mitochondrial Genome of Scutiger ningshanensis (Anura, Megophryidae, Scutiger): Insights into the Characteristics of the Mitogenome and the Phylogenetic Relationships of Megophryidae Species

Key Laboratory for Molecular Biology and Biopharmaceutics, School of Biological and Pharmaceutical Sciences, Mianyang Teachers’ College, Mianyang 621000, China
*
Author to whom correspondence should be addressed.
These authors contributed equally to this work.
Genes 2025, 16(8), 879; https://doi.org/10.3390/genes16080879
Submission received: 30 June 2025 / Revised: 23 July 2025 / Accepted: 25 July 2025 / Published: 26 July 2025
(This article belongs to the Section Cytogenomics)

Abstract

Background/Objectives: Scutiger ningshanensis (Fang, 1985) is an endemic Chinese amphibian species within the genus Scutiger (Megophryidae). Despite its ecological significance, its mitochondrial genome architecture and evolutionary relationships remain poorly understood. Given the high structural variability in Megophryidae mitogenomes and unresolved phylogenetic patterns in Scutiger, this study aims to (1) characterize the complete mitogenome of S. ningshanensis, (2) analyze its molecular evolution, and (3) clarify its phylogenetic position and divergence history within Megophryidae. Methods: The complete mitochondrial genome was sequenced and annotated, followed by analyses of nucleotide composition, codon usage bias, and selection pressures (Ka/Ks ratios). Secondary structures of rRNAs and tRNAs were predicted, and phylogenetic relationships were reconstructed using maximum likelihood and Bayesian methods. Divergence times were estimated using molecular clock analysis. Results: The mitogenome of S. ningshanensis is 17,282 bp long, encoding 13 protein-coding genes (PCGs), 22 tRNAs, 2 rRNAs, and a control region, with a notable AT bias (61.05%) with nucleotide compositions of T (32.51%), C (24.64%), G (14.3%), and A (28.54%). All tRNAs exhibited cloverleaf structures except trnS1, which lacked a DHU stem. Phylogenetic analysis confirmed the monophyly of Scutiger, forming a sister clade to Oreolalax and Leptobrachium, and that S. ningshanensis and S. liubanensis are sister species with a close evolutionary relationship. Positive selection was detected in Atp8 (Ka/Ks > 1), suggesting adaptation to plateau environments, while other PCGs underwent purifying selection (Ka/Ks < 1). Divergence time estimation placed the origin of Megophryidae at~47.97 MYA (Eocene), with S. ningshanensis diverging~32.67 MYA (Oligocene). Conclusions: This study provides the first comprehensive mitogenomic characterization of S. ningshanensis, revealing its evolutionary adaptations and phylogenetic placement. The findings enhance our understanding of Megophryidae’s diversification and offer a genomic foundation for future taxonomic and conservation studies.

1. Introduction

The systematic classification and evolutionary relationships of anurans (Anura), one of the most diverse and widely distributed amphibian groups, remain a key focus in evolutionary biology [1]. Among these, the Megophryidae family (Bonaparte, 1850) represents an endemic Asian taxon predominantly distributed across the Himalayas and adjacent regions, including northern Myanmar, Nepal, and southwestern China [2]. Molecular phylogenetic studies have consistently supported the validity and monophyly of Megophryidae [3,4], with Scutiger (Theobald, 1868) recognized as a distinct lineage sister to Oreolalax within this family [5].
S. ningshanensis is a rare amphibian endemic to China, classified as a national second-grade protected species. It primarily inhabits high-elevation mountain streams in Shaanxi, Henan, and surrounding regions [6]. Molecular barcoding studies initially identified populations in the East Qinling Mountains as a cryptic species within the S. ningshanensis group [7], a conclusion later confirmed through phylogenetic and morphological analyses.
Recent advances in next-generation sequencing have spurred increased research into the evolutionary history and interspecific relationships of Scutiger species [8]. While mitochondrial gene fragments (e.g., 12S rRNA, 16S rRNA, Cytb) and nuclear markers (e.g., RAG1, c-myc2, ccn-B3, b-fib7) have been employed to reconstruct phylogenies, these studies have revealed complex patterns, including hybridization among species such as S. boulengeri, S. glandulatus, S. tuberculatus, and S. mammatus [9,10]. Further analyses incorporating additional taxa (S. liupanensis, S. sikimmensis, S. occidentalis, S. nepalensis) suggest a Paleo-Tibetan origin for the genus, with evidence of cryptic diversity [11].
Despite these advances, the lack of complete mitochondrial genome data for Scutiger limits comprehensive assessments of genetic diversity and phylogenetic resolution. Mitochondrial genomes, due to their maternal inheritance, moderate evolutionary rate, and structural conservation, are invaluable for population genetics, phylogenetics, and divergence time estimation [12,13,14]. Their higher mutation rate compared to nuclear DNA makes them particularly useful for resolving recent speciation events and population structures [15,16,17,18,19].
This study aims to sequence and analyze the mitochondrial genome of S. ningshanensis, examining its gene composition, base content, codon usage, and selection pressure to infer phylogenetic relationships and divergence times. The findings will enhance our understanding of Megophryidae evolution and provide a foundation for future taxonomic, phylogenetic, and conservation studies within this family.

2. Materials and Methods

2.1. Specimen Collection and DNA Extraction

This experiment was conducted using S. ningshanensis specimens from Pingheliang Mountains, Ningshan County, Shaanxi Province (N 39°33′37.18″, E 94°53′14.57″, 2157 m above sea level). In this study, we used a combination of morphology and molecular biology for species identification. First, preliminary identification was made through the information of the collection site and the morphological characteristics of the specimen (body length of 46 mm, body color of bright brown, and flat, narrow, and long body shape, etc.). Subsequently, based on the identifying characteristics of S. ningshanensis in FRPS, we focused on the body shape, skin structure (some small warts on the whole dorsal surface between the skin folds or large warts, etc.), morphology of the fingers and toes (the webbing of the toes is undeveloped, etc.), as well as the secondary sexual characteristics (black thorns on the two sides of the head, including the labial margins, the eyelids, the temporal folds, etc.), and determined that this specimen was S. ningshanensis.
All procedures involving S. ningshanensis specimens were conducted in strict compliance with the Wildlife Protection Law of the People’s Republic of China. For genetic sampling, we employed a non-lethal protocol: the interdigital webbing was first sterilized with alcohol, approximately 30 mg of tissue was carefully excised, and the area was disinfected again before releasing the animal back into its natural habitat. Immediately following collection, specimens were preserved under aseptic conditions in anhydrous ethanol to maintain tissue integrity. For DNA extraction, we followed the manufacturer’s protocol of a commercial DNA extraction kit, using muscle tissue from the flippers as the source material. The quality of extracted DNA was initially verified through 0.8% agarose gel electrophoresis. Subsequently, DNA concentration and purity were precisely quantified using spectrophotometric analysis. All processed DNA samples were aliquoted and stored at −20 °C to ensure long-term stability for future molecular analyses. Amplify COI gene and compare it in NCBI database to further confirm that the collected sample was S. ningshanensis.

2.2. Primer Design and PCR Amplification

Using primer design software, specific primers covering the entire mitochondrial genome were created based on known mitochondrial genome sequences from the same genus and related species. To amplify the target mitochondrial DNA regions, PCR primers were designed using a dual approach: (1) alignment-based selection targeting conserved genomic regions, and (2) adaptation of published primers from Kurabayashi and Sumida [20]. A total of 12 primer pairs (Table 1) were subsequently employed for PCR amplification under optimized reaction conditions. Polymerase chain reaction (PCR) technology was used to amplify the target regions. Each 50 μL PCR reaction contained 5× PrimeSTAR GXL Buffer, dNTP mixture, PrimeSTAR GXL DNA Polymerase (TaKaRa), 1 μM forward and reverse primers, and an appropriate amount of template DNA. The PCR cycle conditions were as follows: 3 min of pre-denaturation at 95 °C, 30 s of denaturation at 94 °C, 30 s of annealing at 52–62 °C, 30 cycles of extension at 72 °C for 90 s, 10 min of final extension at 72 °C, and storage at 4 °C. All purified amplification products were subjected to direct automated DNA sequencing using the Sanger method after identification by agarose gel electrophoresis to confirm their size.

2.3. Sequence Assembly, Analysis, and Annotation

The purified PCR amplicons were subjected to bidirectional sequencing employing the Sanger method (3730xl Genetic Analyzer, Applied Biosystems, Waltham, MA, USA). Subsequent sequence assembly was performed using DNA Baser software (version 5.20; http://www.DNABaser.com, accessed on 20 May 2025.), utilizing 200–350 bp overlapping regions between contigs to reconstruct the complete mitochondrial genome with high fidelity. Using MEGA11.0 [21] software, the relative synonymous codon usage (RSCU values), genetic differences between species, individual base composition occupancies, and A + T content were calculated to translate all 13 PCGs into their corresponding amino acid sequences. The online tool called MITOS was used to annotate the mitochondrial genome [22]. Mitochondrial genome mapping was constructed using OGDRAW and default parameters [23]. We used tRNAscan-SE and the Mitos Web server [24] in default search mode to analyze tRNA secondary structures using vertebrate mitochondrial genetic code sources. R2DT is an online tool used to predict the tRNA structure. The formulas for AT-bias = (A −T)/(A + T) and GC-bias = (G − C)/(G + C) [25] were used to calculate nucleotide composition bias, and manual calculations were performed to determine gene overlap and intergenic spacer regions. Comparing homologous sequences of related species allowed for the identification of the conserved start regions of light chain duplication (OL) and the control region (D-loop, CR).

2.4. Phylogenetic Analyses

To investigate the systematic position of S. ningshanensis within its family, we constructed a phylogenetic tree using 28 representative species of 5 families (Megophryidae, Pelobatidae, Pelodytidae, Leiopelmatidae, and Bombinatoridae), along with 2 species from different families as outgroups. Phylogenetic analysis of tandem sequences of 13 PCGs from the entire mitotic genome was performed using PhyloSuite_v1.2.3 [26], and before constructing the phylogenetic tree, all the sequences were aligned using MAFFT (version 7) [27]. Then the sequences were cut using the Gblocks tool, and the most suitable data model was determined according to the AIC (Akaike Information Criterion) [28] criteria, and finally the phylogenetic tree was constructed using Maximum Likelihood (ML) and Bayesian Inference [29] (BI). Inferred phylogenies were inferred using MrBayes 3.2.6 inferred Bayesian phylogenies under a partitioned model (2,000,000 generations with a sampling frequency of 1000) in which the initial 25% of the sampled data were discarded as aged data. The maximum likelihood phylogeny was inferred using IQ-TREE [30]. Branch support values for Bayesian posterior probabilities and maximum likelihood Bootstrap support values were displayed on the tree. Ultimately, the evolutionary relationship between S. ningshanensis and the family Megophryidae was resolved by assessing support for different tree forms.

2.5. Divergence Time Estimates

The BEAST program was utilized to estimate divergence times based on the 13 protein-coding genes (PCGs) from each species [31]. Divergence times were estimated using rigorous molecular clocks and GTR evolutionary models. Tree priorities were determined through Yule processes. We calibrated the divergence times using fossil records from the TimeTree website. The following divergence times were established as fossil calibration points: 18.5–48.7 million years ago (MYA) for the genera Scutiger and Oreolalax, 20.0–57.5 MYA for the genus Leptobrachium, and 33.3–66.3 MYA for the genus Leptobrachella. After 20 billion generations, the first 10% of the MCMC (Markov Chain Monte Carlo) chain was discarded to account for aging effects. Effective sample size (ESS) values were confirmed using Tracer [32], and parameters were recorded every 2000 generations, with all ESS values exceeding 200. The maximum clade credibility (MCC) tree was visualized and edited using FigTree version 1.4.5, while TreeAnnotator version 1.8.4 was employed to generate the tree.

2.6. Ka and Ks Analysis

Selection pressure acting on S. ningshanensis was assessed using the Ka/Ks ratio. This metric compares the rate of non-synonymous substitutions per non-synonymous site (Ka) to the rate of synonymous substitutions per synonymous site (Ks). Ka/Ks values were calculated between 13 protein-coding genes using KaKs_Calculator 2.0 (YN model). CDS sequences were filtered for low-quality sites by MAFFT [27] comparison and Pal2Nal codon comparison. Positively selected genes were required to fulfill the following criteria: (1) Ka/Ks > 1 (p < 0.05), (2) Bonferroni correction was significant. A Ka/Ks value greater than 1 indicates positive selection, while a value equal to 1 suggests neutral selection. If the Ka/Ks value is less than 1, it indicates the presence of purifying selection. This method allows for a more in-depth examination of evolutionary trends and highlights the different selective forces that influence the genetic makeup of various species [33].

3. Results

3.1. Characterization of the Mitogenome Structure

The complete mitochondrial genome (mitogenome) of S. ningshanensis (GenBank: PV083741) is a circular molecule of 17,282 bp, containing 13 protein-coding genes (PCGs), 2 rRNAs (12S rRNA and 16S rRNA), 22 tRNAs, and a control region (D-loop) (Figure 1, Table 2). Most genes (12 PCGs, 14 tRNAs, and both rRNAs) are encoded on the heavy strand (H-strand), while only ND6 and 8 tRNAs reside on the light strand (L-strand). Five gene overlaps were identified, with the longest (10 bp) occurring between ATP6 and ATP8. The mitogenome displays a strong AT bias (61.05%), with individual nucleotide frequencies of A = 28.54%, T = 32.51%, G = 14.30%, and C = 24.64% (Table 3). Negative AT and GC skew values indicate strand-specific compositional asymmetry. Additionally, the D-loop region—enriched with tandem repeats and indel polymorphisms—contributes significantly to interspecies length variation, likely due to replication-associated insertions/deletions, reflecting the evolutionary plasticity of mitochondrial genomes.

3.2. Protein-Coding Genes and Codon Usage

Comparative analysis of the 13 protein-coding genes (PCGs) revealed conserved nucleotide composition patterns across Megophryidae species. In S. ningshanensis, the AT content of PCGs ranged from 57.25% to 68.33%, consistent with the strong AT bias characteristic of the family (Table 3). This genomic signature was particularly evident in the D-loop region, which exhibited the highest AT content, followed by PCGs, rRNAs, and tRNAs. Gene length variation was observed among PCGs, with ND5 (1821 bp) being the longest and ATP8 (180 bp) the shortest. Codon usage analysis showed GTG start codons in COX1 and ATP8, while the remaining PCGs initiated with ATG. Three types of stop codons were identified: complete TAA (ND1, ND2, ATP8, ND4L), complete TAG (ND5), and AGG (ND6), with the remaining genes possessing incomplete T-stop codons. Strand composition analysis revealed negative AT skew in PCGs and D-loop, contrasting with positive AT skew in tRNAs and rRNAs. The GC skew was strongly C-biased in the complete mitogenome (−0.265) and D-loop (−0.349), while tRNAs showed positive GC skew and other elements displayed negative skew (Table 3). These compositional biases, particularly in AT-rich regions, likely contribute to mitogenome length variation and evolutionary dynamics in this lineage [34].
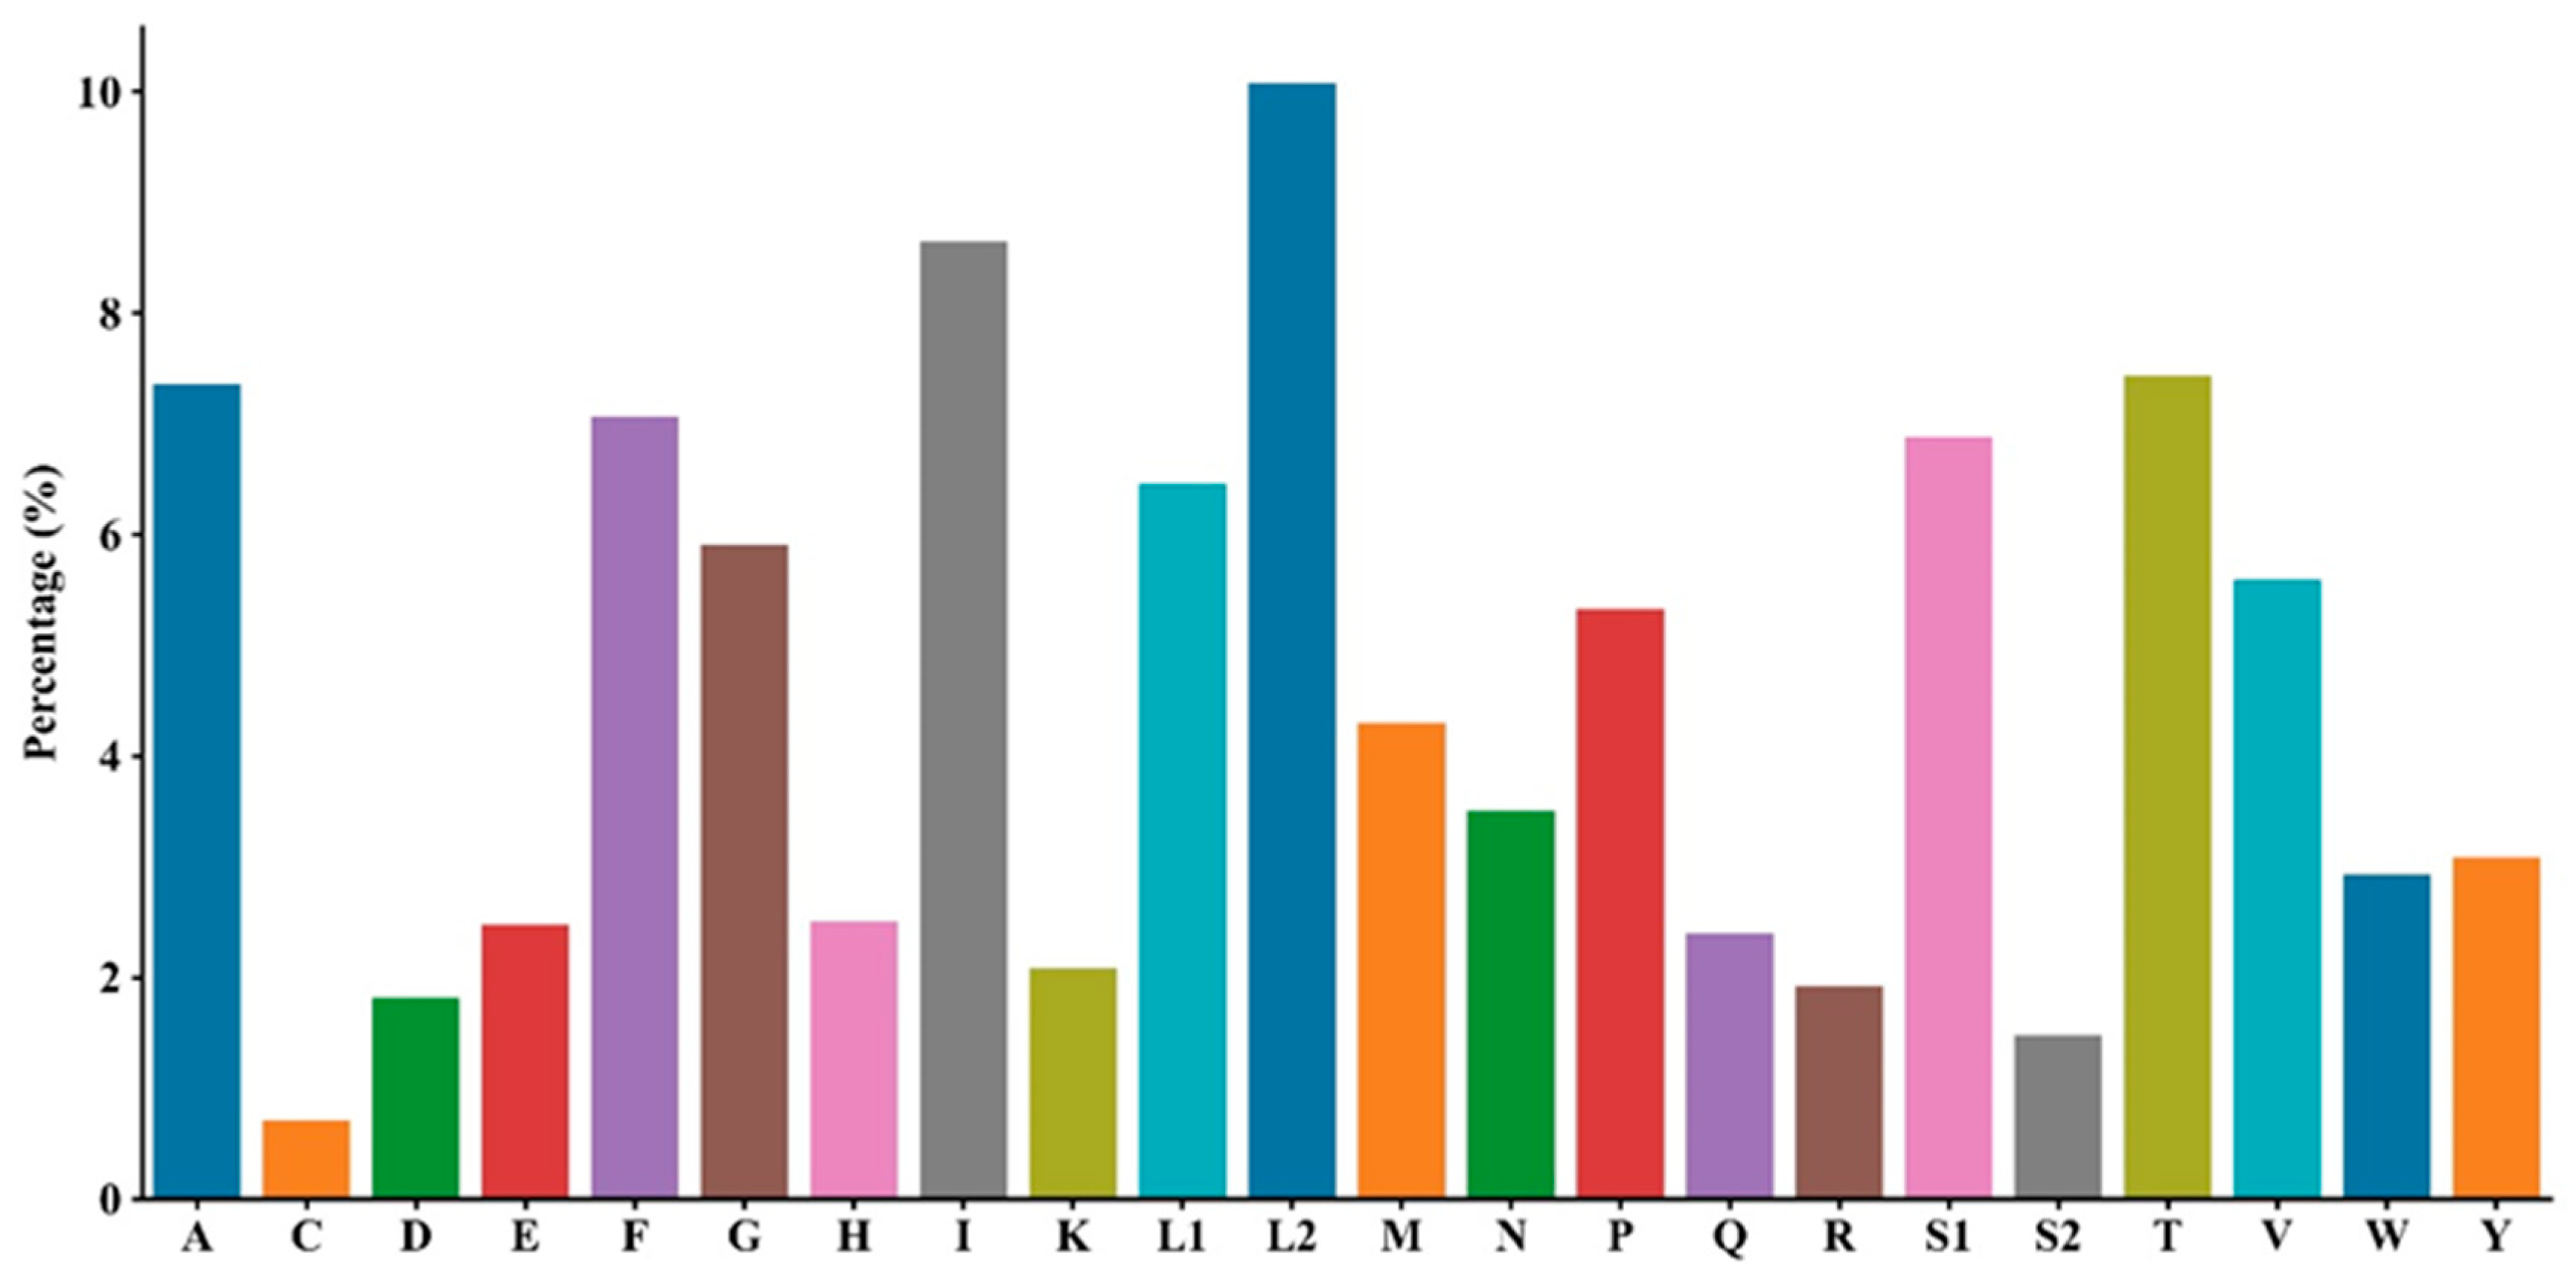
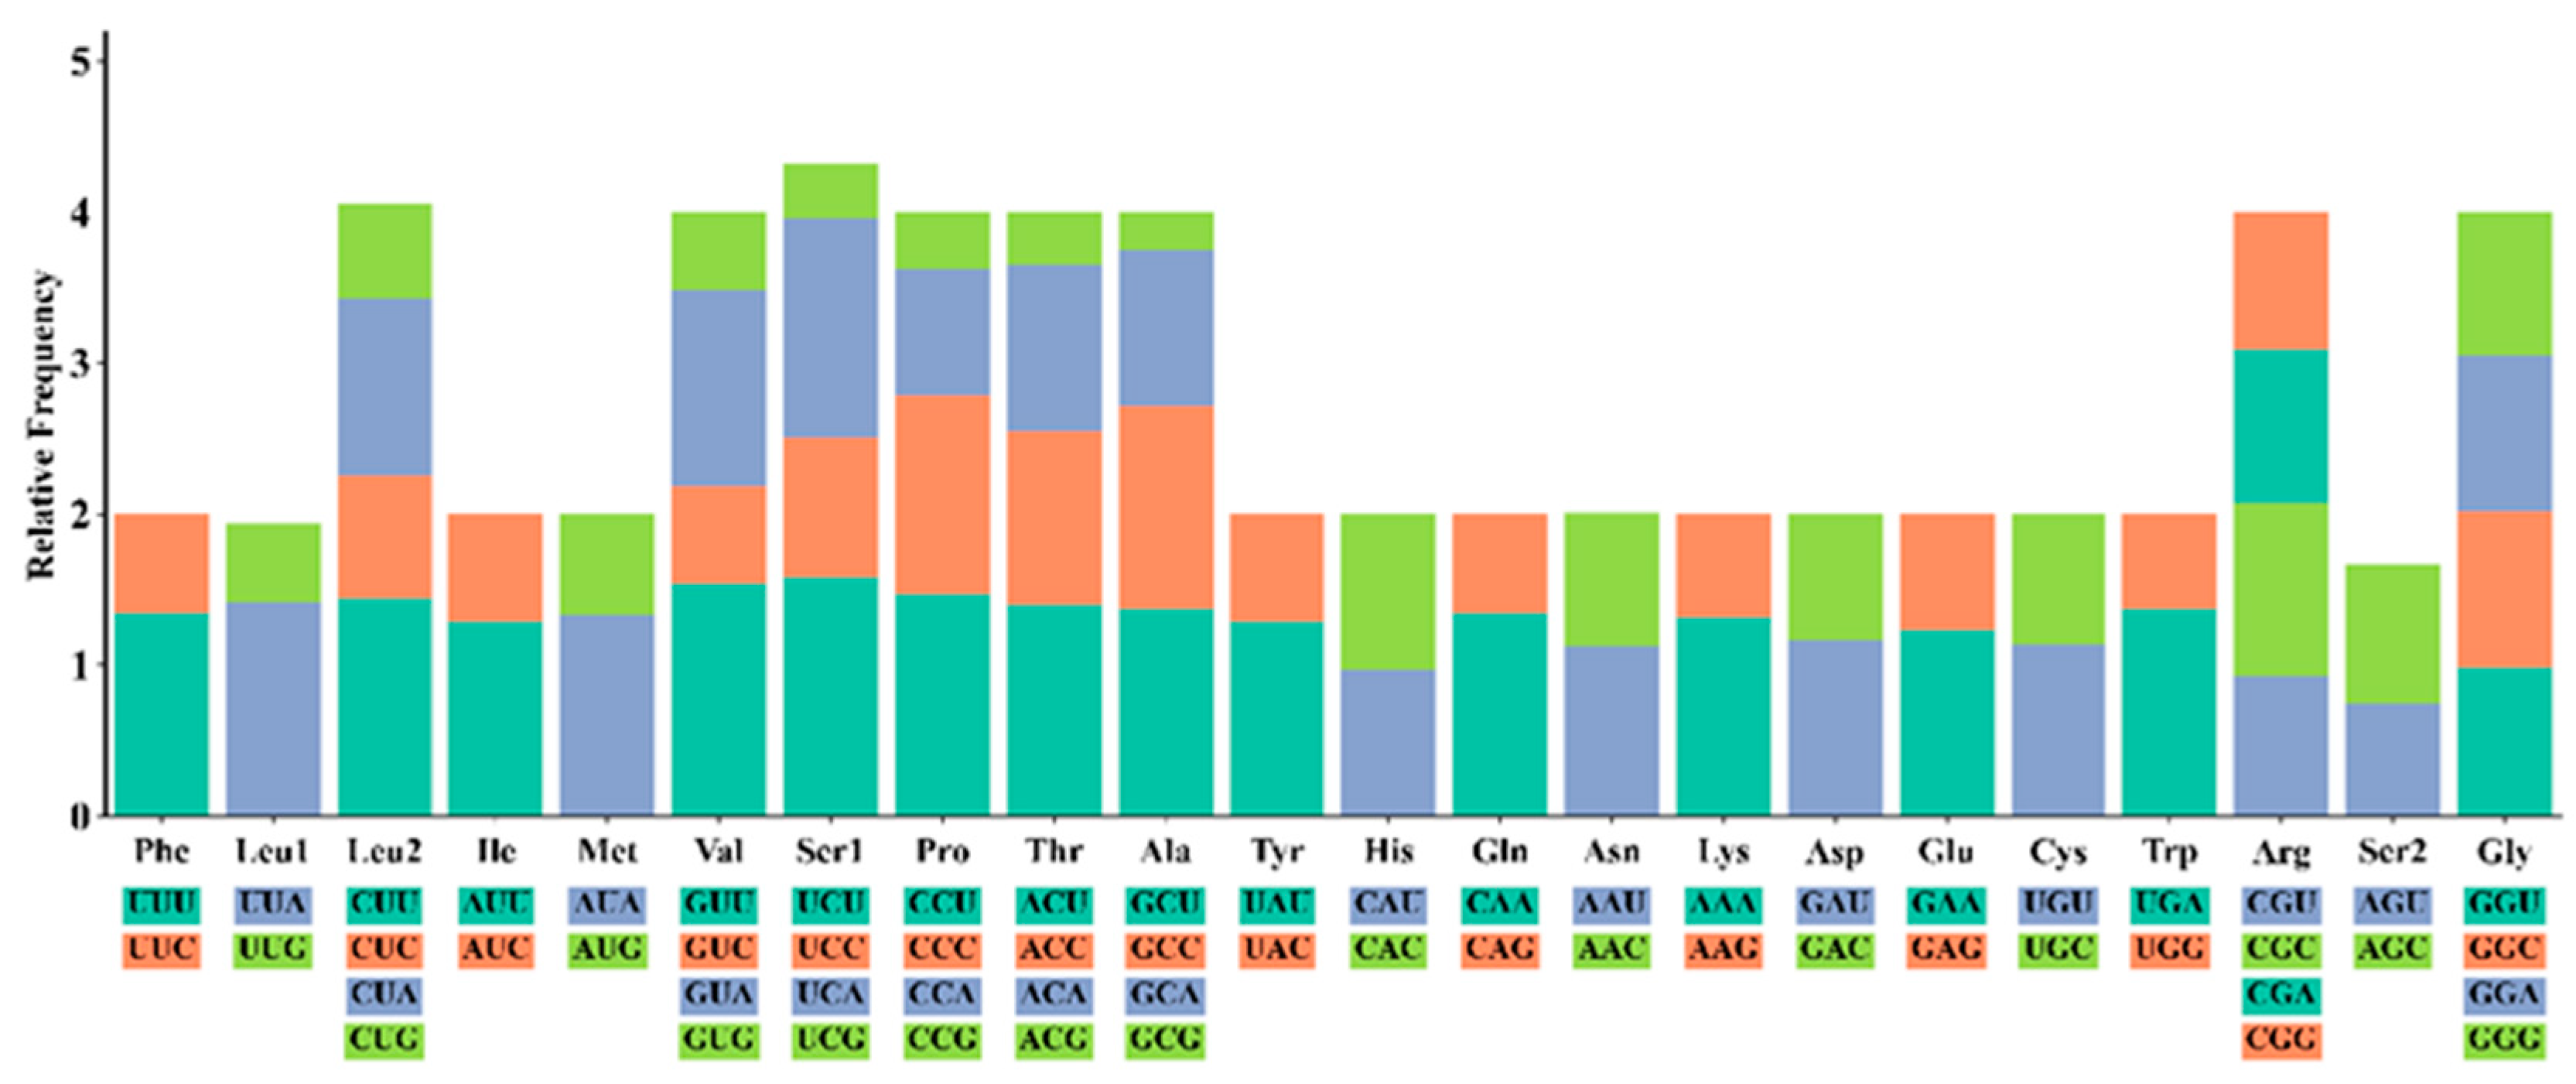
Analysis of the 13 protein-coding genes in S. ningshanensis identified 5760 codons with distinct usage patterns. Leucine (Leu, 16.5%) was the most abundant amino acid, followed by isoleucine (Ile, 8.7%) and serine (Ser, 8.4%), while aspartic acid (Asp, 1.8%) and cysteine (Cys, 0.7%) were least frequent (Figure 2). Relative synonymous codon usage (RSCU) analysis revealed UCU (Ser), GUU (Val), and CCU (Pro) as the most frequent codons, whereas GCG (Ala), ACG (Thr), and UCG (Ser) were the rarest (Figure 3). Notable codon preferences were observed, including a predominance of CUU in Leu2 and UUC in Phe codons. Comparative analysis with Oreolalax and Leptobrachium species revealed subtle but significant interspecific differences in synonymous codon usage patterns. Furthermore, examination of the ATP6 gene identified unique amino acid variations that may represent species-specific genetic signatures. These findings collectively demonstrate substantial codon usage bias in the S. ningshanensis mitochondrial genome, reflecting potential evolutionary adaptations.

3.3. Transfer RNA and Ribosomal RNA Genes and Control Region

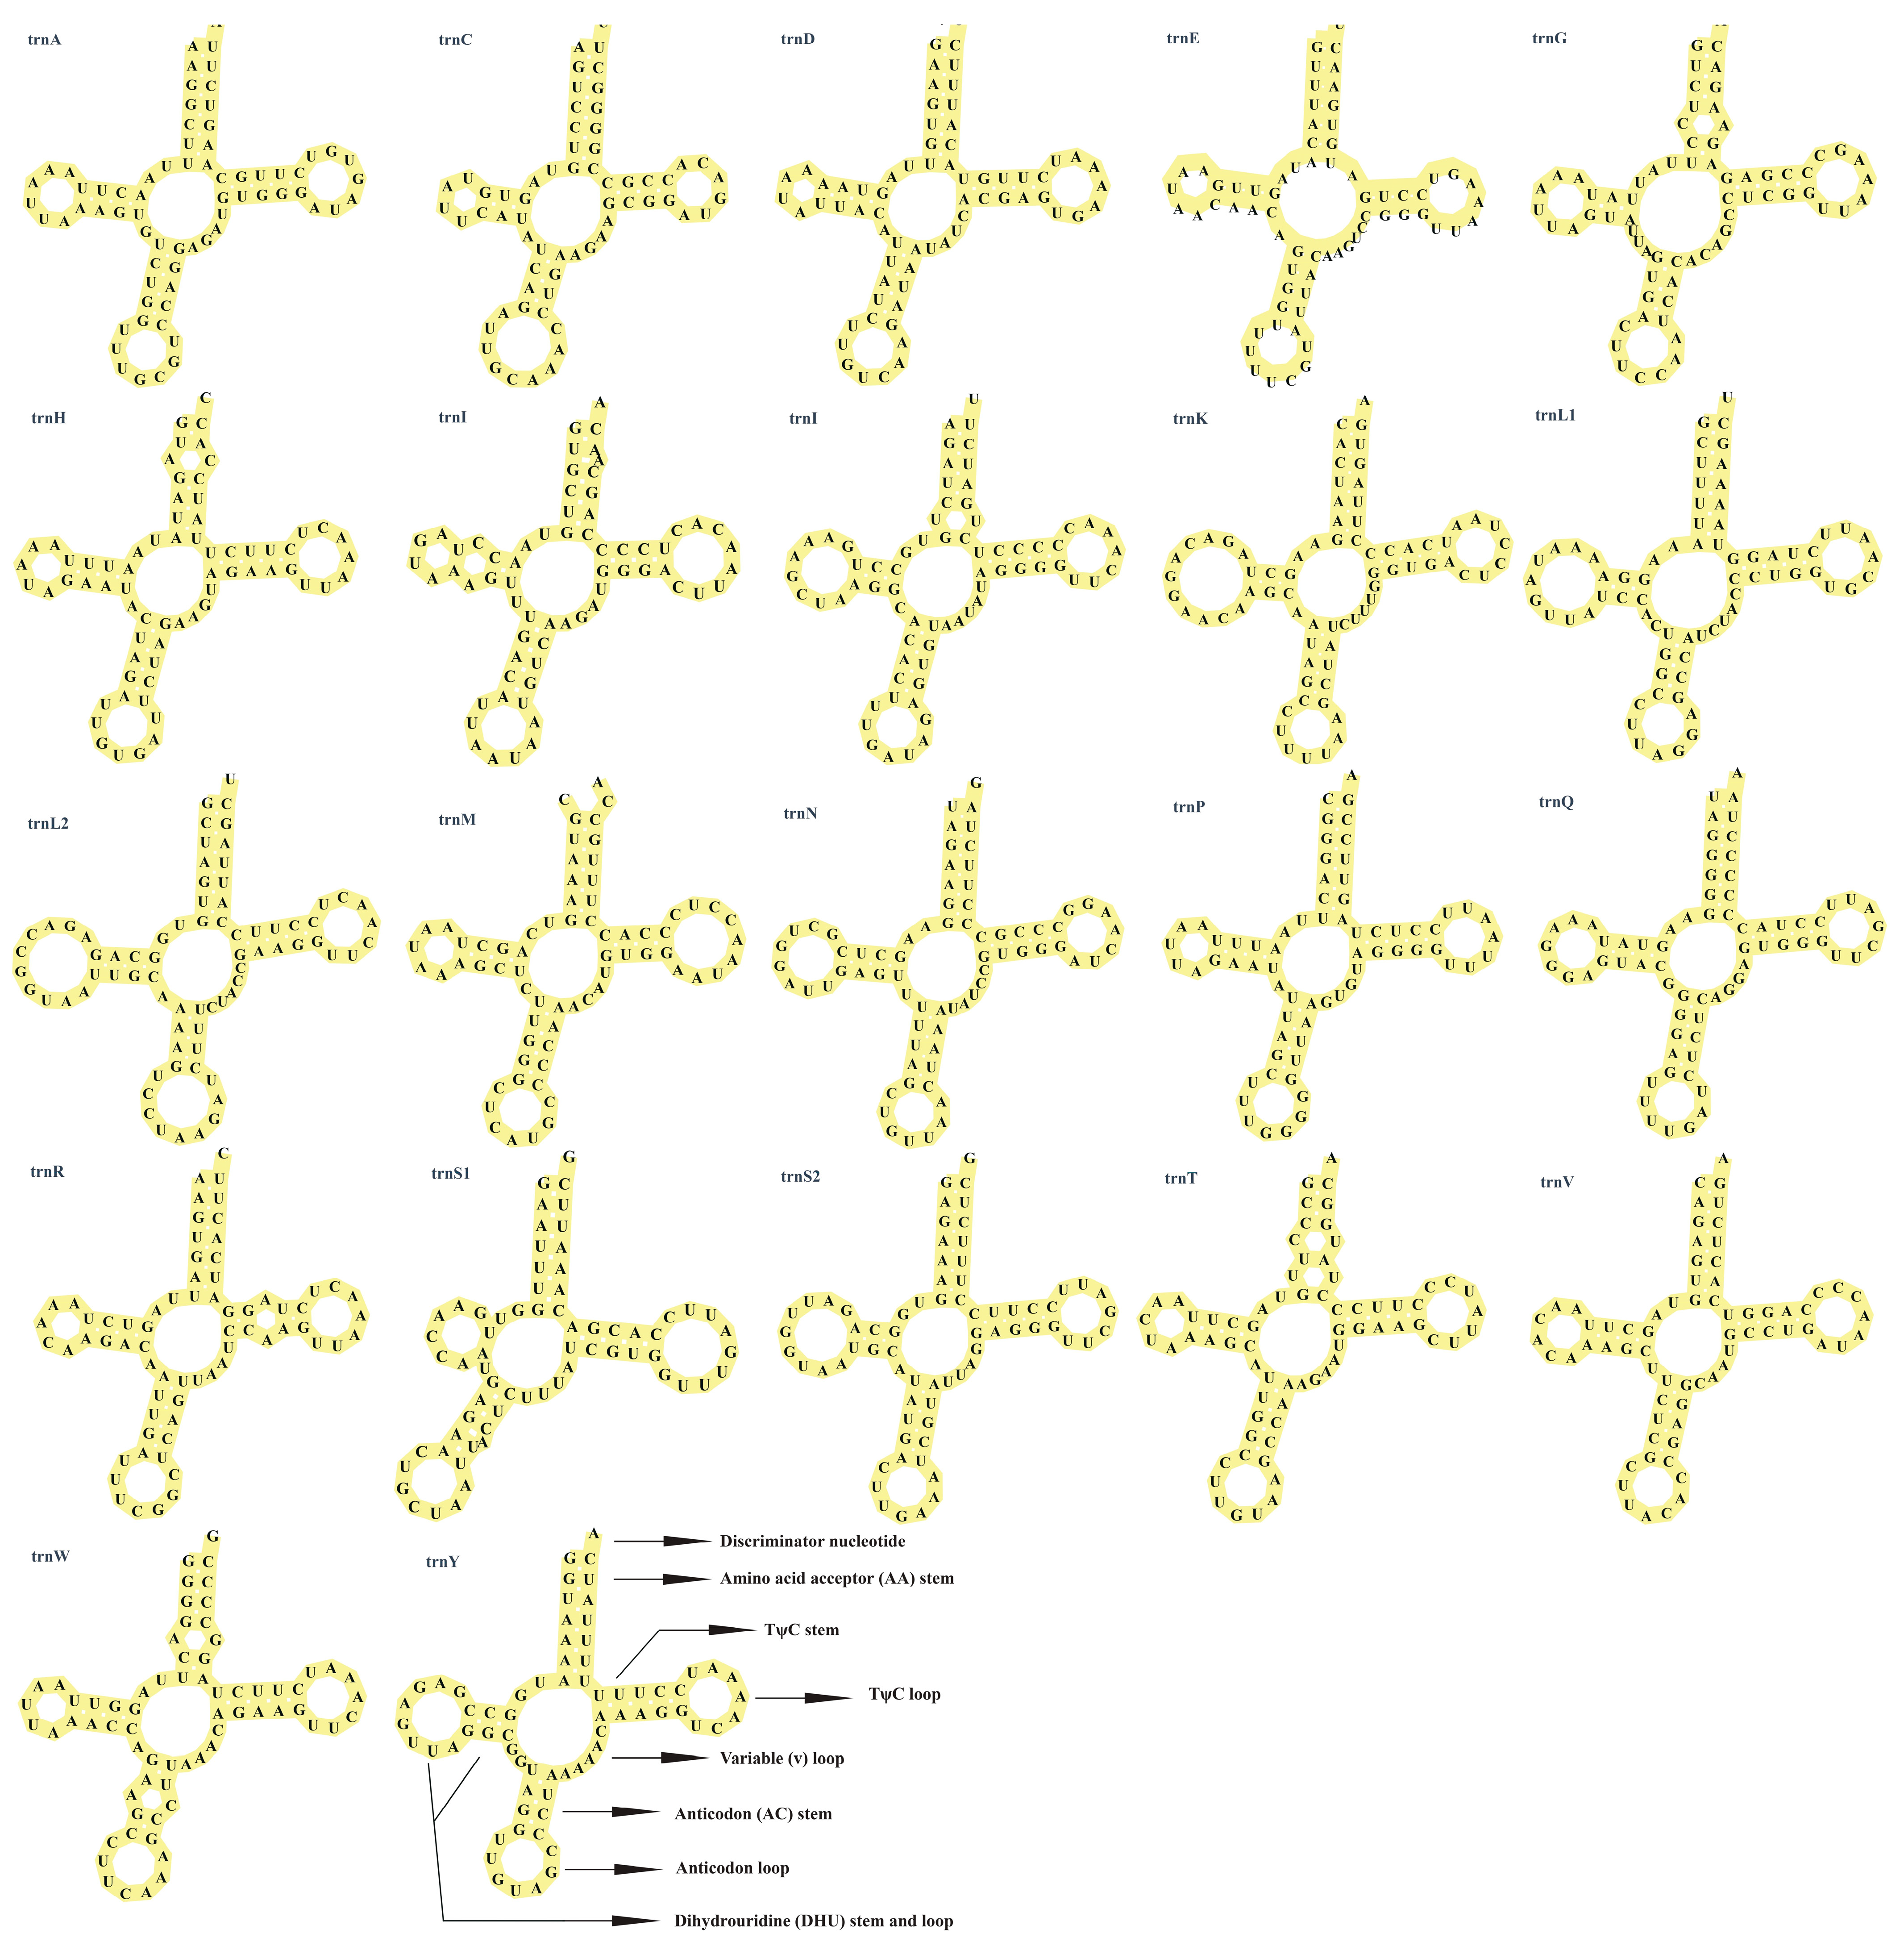
The mitochondrial genome of S. ningshanensis harbors 22 transfer RNA (tRNA) genes, collectively spanning 1504 bp, accounting for 8.7% of the entire mitochondrial genome (Table 2). All tRNAs exhibited lengths ranging from 63 bp (tRNA-Cys) to 75 bp (tRNA-Leu), consistent with typical metazoan mitochondrial tRNA sizes [35], with no intergenic overlaps observed. Secondary structure predictions using tRNAscan-SE revealed that 21 tRNAs adopt the canonical cloverleaf structure (Figure 4). The exception was trnS1, which lacked the dihydrouracil (DHU) stem, a structural modification commonly observed in mitochondrial genomes. The tRNA secondary structure analysis in S. ningshanensis revealed the presence of both standard Watson–Crick base pairs (AU and CG) and several non-canonical pairings (GU, AG, UU, AA, AC, CU, and CC) distributed throughout the stem regions. Notably, while the DHU and TΨC loops exhibited structural variability, the anticodon loop maintained high conservation (Figure 4). Quantitative assessment showed distinct mismatch frequencies with 29 GU, 2 UU, 1 CU, 4 AC, 1 AG, 1 CC, and 1 AA pairings, suggesting these non-standard pairings may represent species-specific structural adaptations that contribute to tRNA functionality and evolutionary diversification.
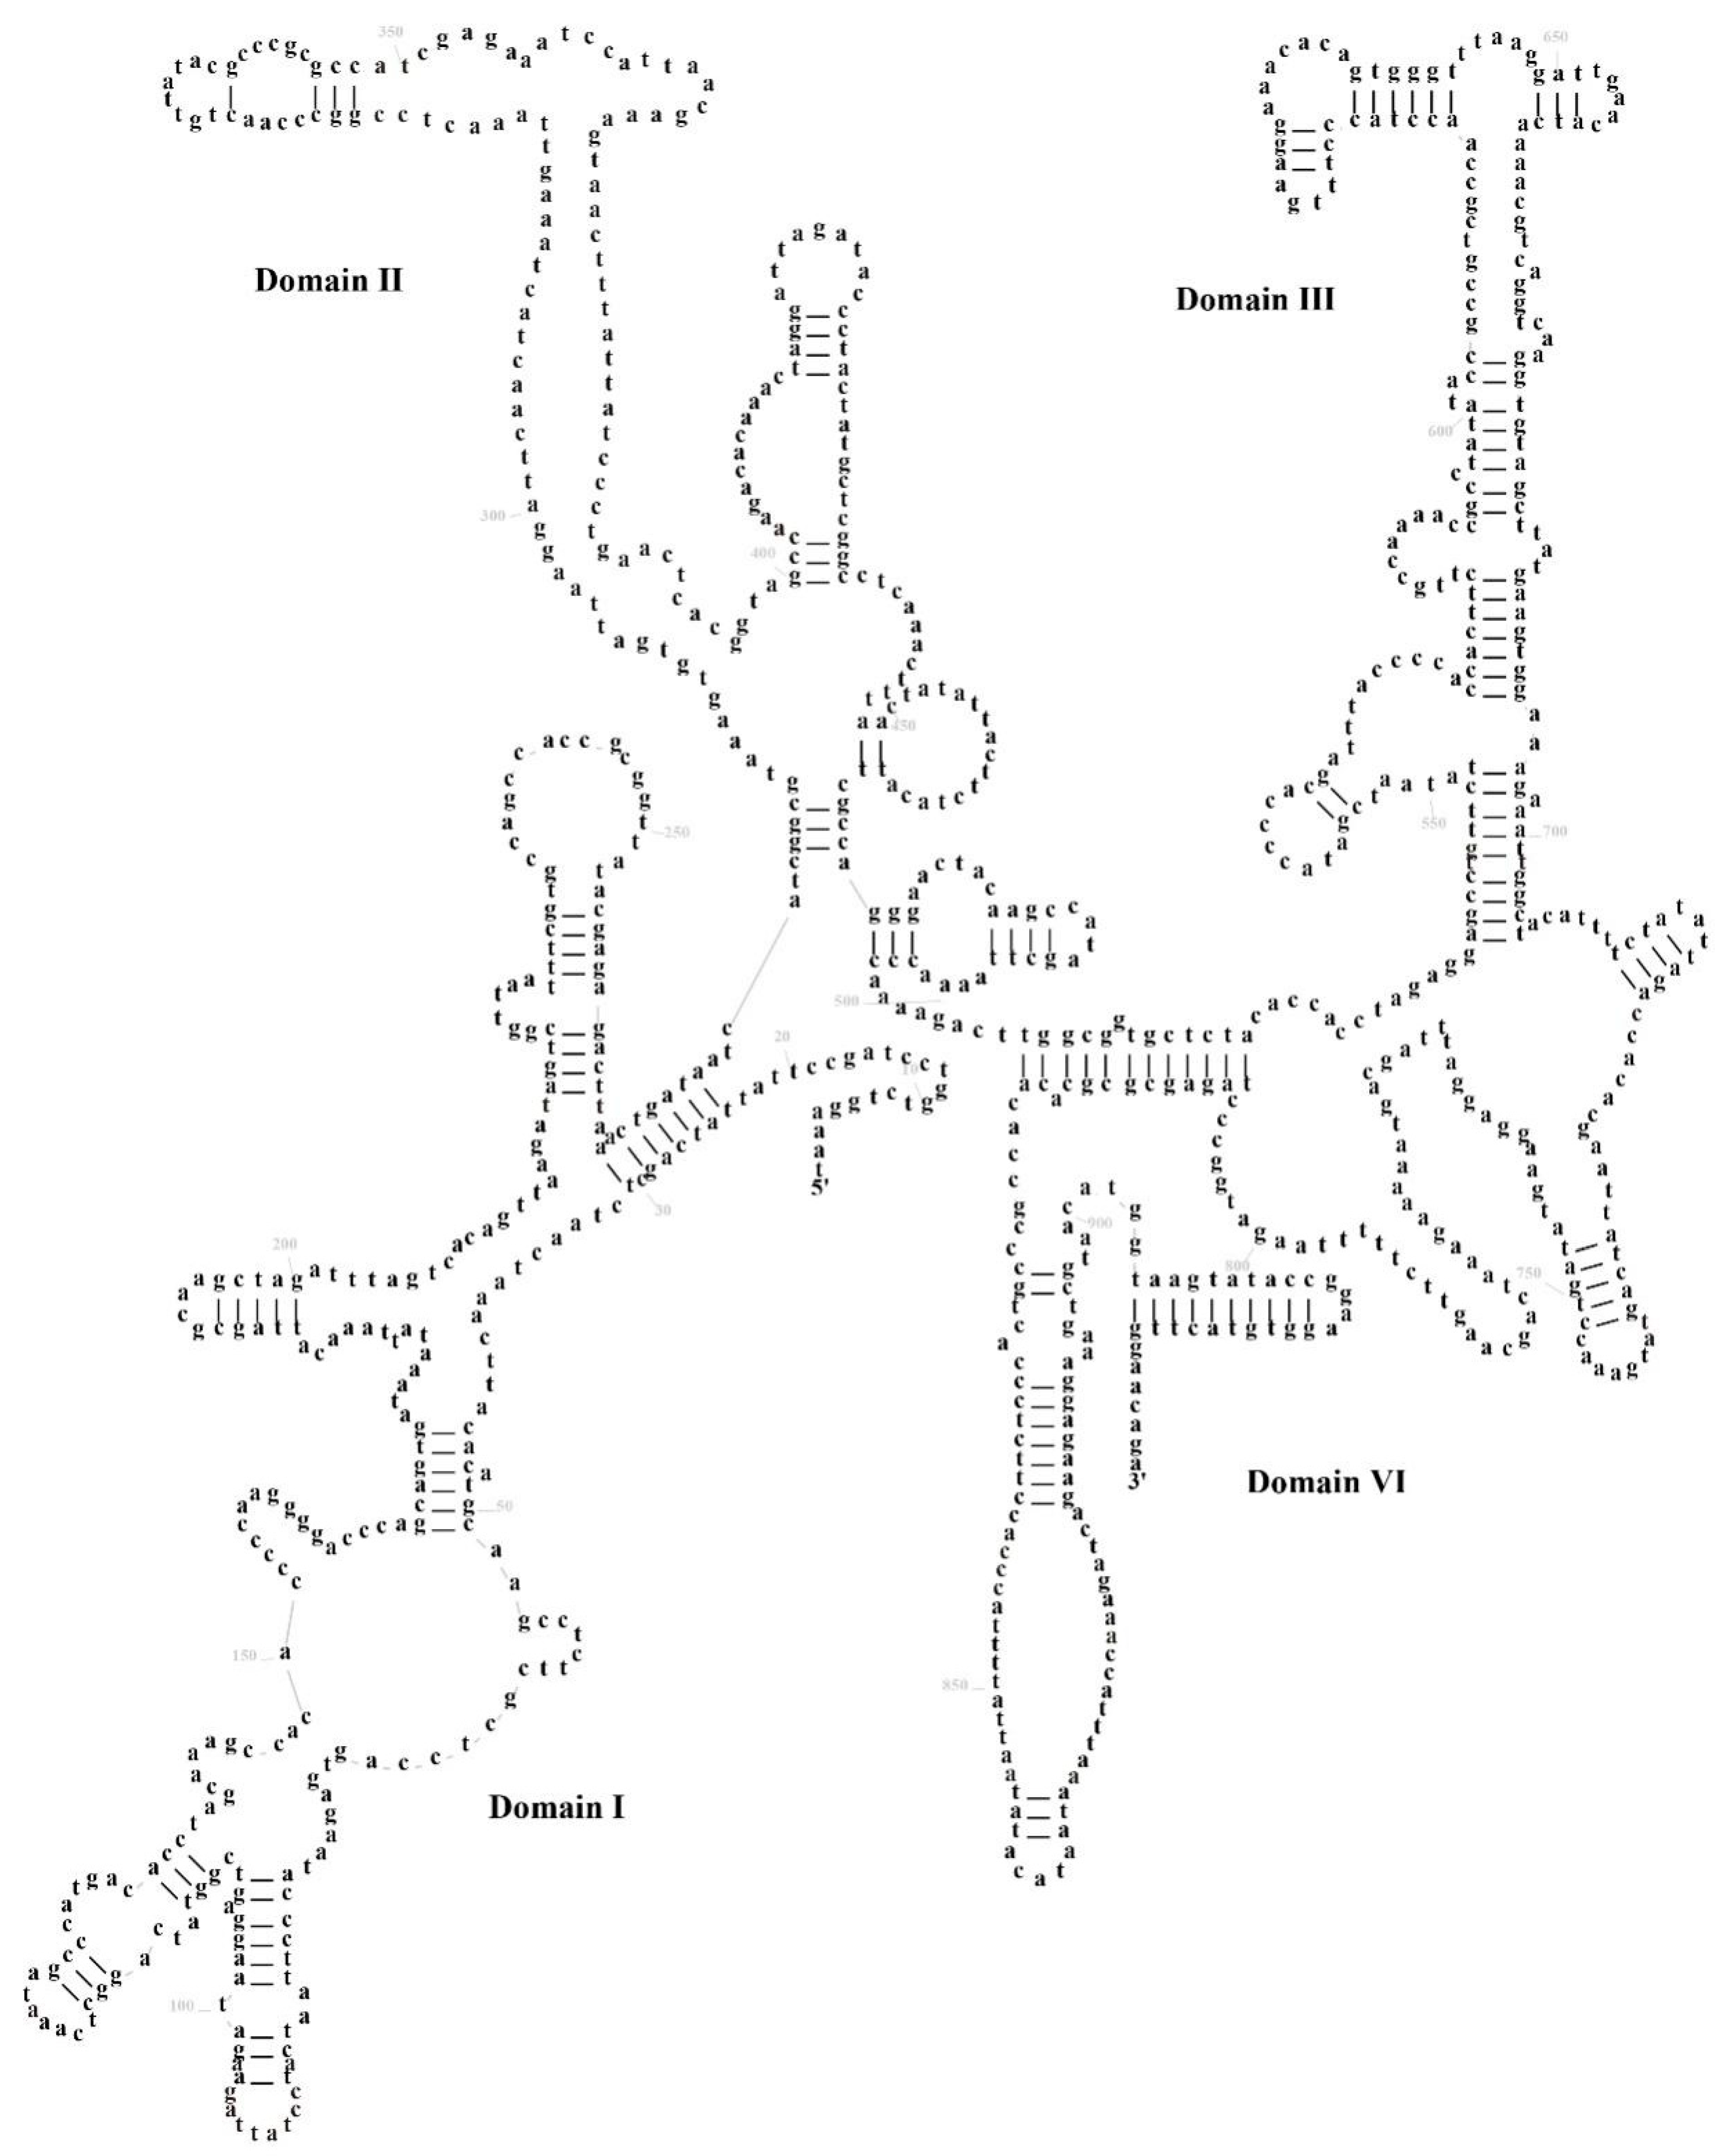
The mitochondrial genome of S. ningshanensis encodes two ribosomal RNA genes: 12S rRNA (935 bp) and 16S rRNA (1610 bp), located between tRNAPhe-tRNAVal and tRNAVal-tRNALeu, respectively. Secondary structure prediction revealed that 12S rRNA comprises 4 structural domains with 43 stem-loop structures, where domains I and II represent variable regions, while III and IV are conserved (Figure 5). In contrast, 16S rRNA exhibits a more complex architecture, consisting of 6 structural domains with 55 stem-loop structures, where domains I–IV are variable, and IV–V are conserved (Figure 6). Comparative analysis demonstrated that stem regions are evolutionarily more conserved than loop regions, and 16S rRNA displays greater structural complexity than 12S rRNA, consistent with functional constraints in mitochondrial ribosome assembly and protein synthesis. We found that its conserved region aligns with those of typical frog species, but there are several unique base variants in the variable region (e.g., A→G transitions at specific sites). These variants could influence the stability of rRNA or relate to mitochondrial translation efficiency. Due to limited rRNA secondary structure data for Scutiger, the findings of this study may serve as a valuable reference for molecular evolutionary research on the genus. The taxonomic or adaptive significance of these structural features can be better understood in the future by increasing sample size and conducting comparative analyses of closely related species.
In the mitochondrial genome of S. ningshanensis, our analysis revealed a 1480 bp non-coding control region (D-loop), the largest intergenic spacer positioned between tRNA-Pro and tRNA-Phe (Table 1). This conserved element, crucial for mitochondrial DNA replication and transcription initiation, displayed distinct nucleotide characteristics: elevated A + T content (68.45%) coupled with negative GC-skew (−0.349) and AT-skew (−0.058) values. Comparative analysis within Megophryidae species showed conserved region lengths but significant intraspecific variation attributable to differential repeat unit organization. The predominance of dimeric over trimeric repetitive elements, with varying copy numbers, explains the length polymorphisms observed in this functionally essential domain.
The mitochondrial genome of S. ningshanensis contains a 1480 bp D-loop control region located between tRNA-Pro and tRNA-Phe, characterized by high A + T content (68.45%) and distinct compositional skews (GC-skew: −0.349; AT-skew: −0.058). Comparative genomic analysis across Megophryidae species (Scutiger, Oreolalax, and Leptobrachium) revealed that while this region maintains conserved functional domains essential for replication and transcription initiation, it exhibits substantial length polymorphism attributable to variations in repetitive element organization, including differences in unit length and copy number. Although conserved regulatory motifs have been proposed to reside within these variable regions [36], their exact molecular architecture and functional mechanisms require further investigation to fully understand their role in mitogenome evolution and regulation.

3.4. Phylogenetic Analysis

Our phylogenetic reconstruction, based on mitochondrial genomes from 30 species of the Megophryidae with those of four other families (Pelobatidae, Pelodytidae, Leiopelmatidae, and Bombinatoridae), in which two species were considered outgroups, yielded concordant topologies using both ML and BI methods (Figure 7). The analysis robustly supported (bootstrap/posterior probability > 0.95) the monophyly of six Megophryidae genera, with Oreolalax and Leptobrachium forming a distinct clade that established a sister-group relationship with Scutiger. Phylogenetic analysis showed that S. ningshanensis and S. liubanensis are sister species with a close evolutionary relationship. Together with O. schmidti, O. omeimontis, O. major, O. xiangchengensis, O. lichuanensis, L. liui, L. boringii, and L. leishanense, they form a well-supported clade. Notably, S. ningshanensis and S. liubanensis occupies a basal position within this clade, suggesting it represents a relatively ancestral lineage among these species. The genera Atympanophrys and Boulenophrys (including B. baishanzuensis, B. kuatunensis, and B. boettgeri) were recovered as sister taxa within a well-supported branch. External relationships showed Pelobatidae and Pelodytidae as distinct lineages, while Bombinatoridae formed a monophyletic cluster with Bombina lichuanensis and B. microdeladigitora as sister species. These results provide definitive molecular evidence for: (1) the monophyletic status of major Megophryidae genera, (2) previously unresolved sister-group relationships, and (3) the family’s distinctiveness from related anuran lineages.

3.5. Divergence Time of the Megophryidae Species

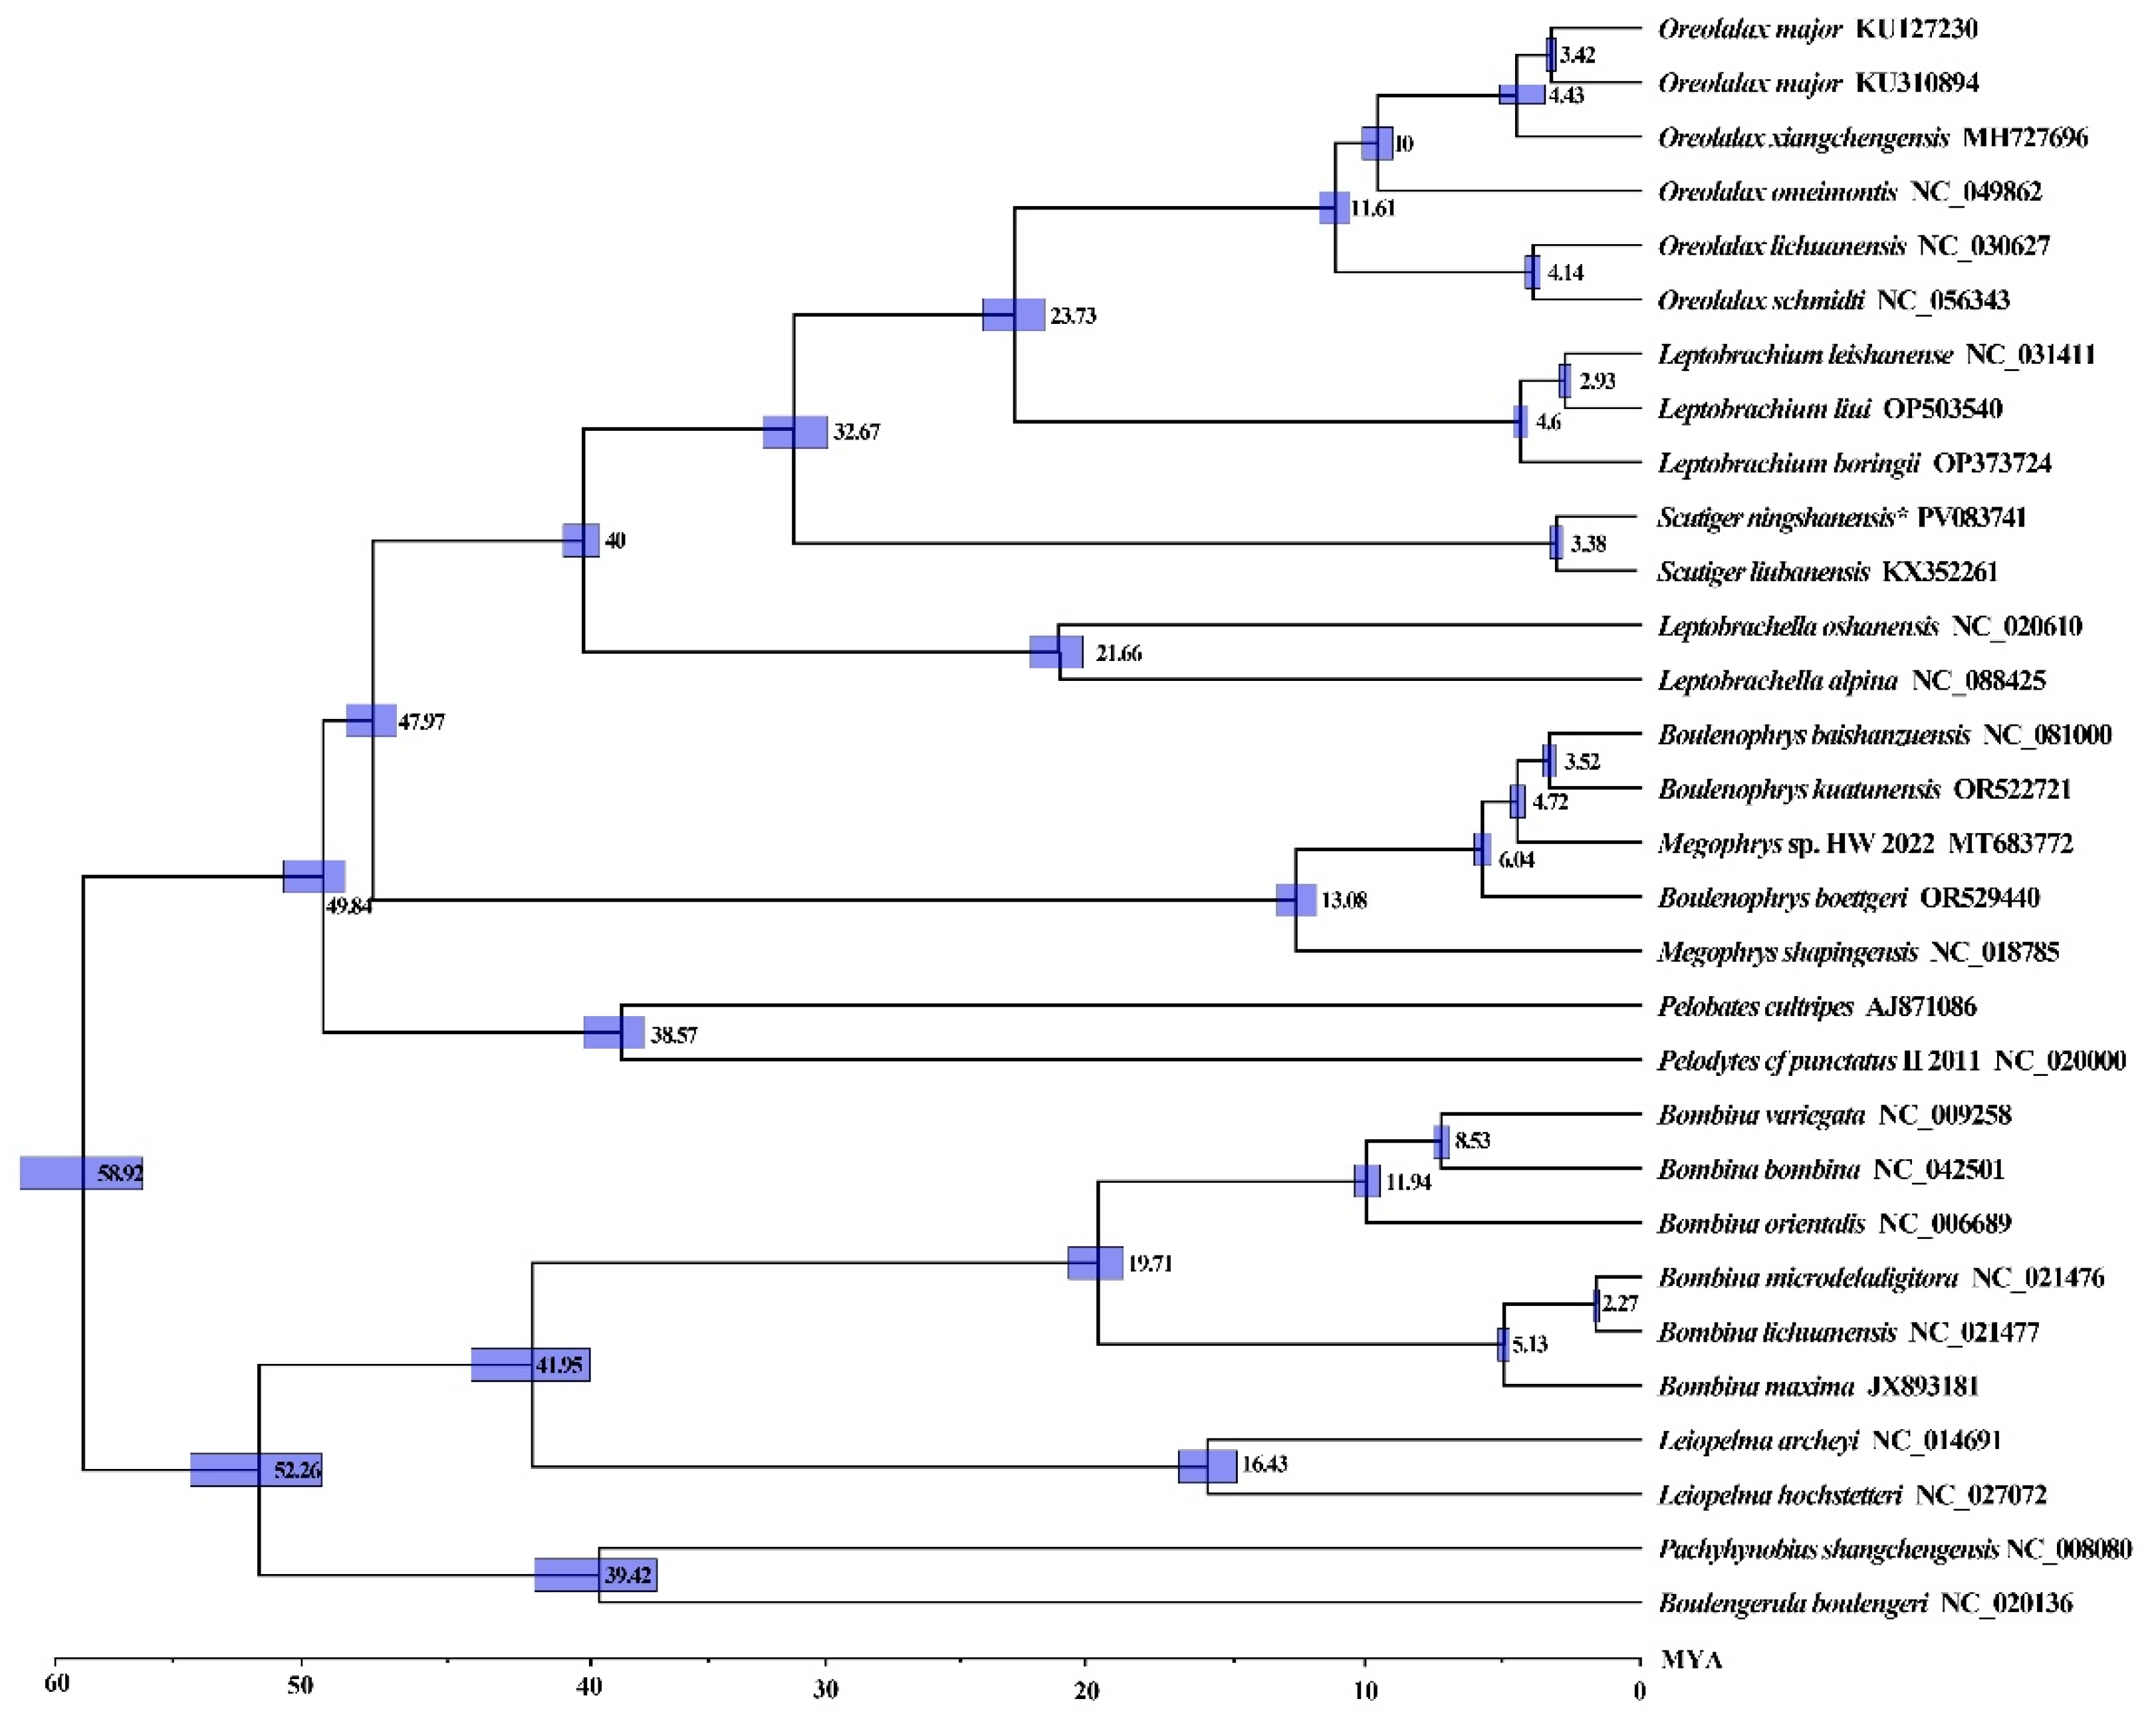
Phylogenetic analyses of Megophryidae using ML and BI methods yielded congruent topologies, consistent with previous studies. Molecular dating estimates place the family’s most recent common ancestor at~47.97 MYA, with subsequent diversification of 16 extant lineages occurring between 3.38–21.66 MYA during the early Miocene (Figure 8). The genera Leptobrachella, Scutiger, Leptobrachium, and Oreolalax diverged~40.00 MYA (95% HPD: 39.12–41.35 MYA) in the mid-Oligocene, while S. ningshanensis speciated from its closest relatives ~32.67 MYA (95% HPD: 20.74–33.53 MYA) during the late Oligocene. Subsequent radiations occurred in the late Miocene, with Oreolalax diversifying 4.14–11.61 MYA and L. boringii diverging ~4.60 MYA (95% HPD: 4.52–4.82 MYA). S. ningshanensis and S. liubanensis separated in 3.38 MYA (95% HPD: 2.91–3.62 MYA). These results indicate that major cladogenic events in Megophryidae occurred primarily during the Oligocene to Miocene transition, with some lineages persisting into the Paleogene.

3.6. Selective Pressure Analysis

The Ka/Ks ratio (ω) was employed to evaluate selective pressures acting on mitochondrial protein-coding genes (PCGs), with ω > 1 indicating positive selection, ω = 1 representing neutral evolution, and 0 < ω < 1 signifying purifying selection [37]. Our analysis of all 13 PCGs in S. ningshanensis revealed ω-values significantly below 1 (Figure 9), demonstrating that purifying selection has dominated their evolutionary trajectory. This evolutionary conservatism supports the utility of these genes for phylogenetic reconstruction within the species. Notably, selective pressure intensity varied substantially among genes: ATP8 exhibited the highest evolutionary rate (ω = 0.78), while COX1 showed exceptional conservation with the lowest ω-value (ω = 0.01). These findings indicate that COX1 undergoes the strongest purifying selection in the S. ningshanensis mitogenome, whereas ATP8 experiences relatively relaxed selective constraints compared to other mitochondrial genes.

4. Discussion

Our analysis of the S. ningshanensis mitochondrial genome reveals several evolutionarily significant features that warrant discussion. The observed genomic architecture, while conforming to the typical vertebrate mitochondrial blueprint [38,39], presents intriguing characteristics when examined in the broader context of Megophryidae evolution. The conserved gene arrangement, particularly the stable~ATP8-ATP6 overlap region [40,41], suggests strong functional constraints maintaining this organization across the family. The pronounced AT-rich composition and consistent AT skew align with patterns reported in related amphibian lineages [16], potentially reflecting shared evolutionary pressures on mitochondrial DNA structure and function.
Of particular interest is the presence of non-canonical initiation codons in several PCGs, a phenomenon previously noted in other anuran species [42,43]. While such variations might initially appear as random mutations, their persistence across multiple lineages implies potential adaptive significance or relaxed selection pressures in mitochondrial translation initiation. These codon usage patterns, combined with the overall structural conservation, suggest that while the fundamental mitochondrial architecture remains stable in Megophryidae, certain elements may evolve under different selective regimes, possibly reflecting lineage-specific adaptations or neutral evolutionary processes. This study contributes to our understanding of mitochondrial evolution in amphibians by demonstrating how both conservation and variation coexist in the mitogenomic architecture of S. ningshanensis. The findings underscore the importance of considering both structural conservation and subtle sequence-level variations when interpreting mitochondrial evolution in phylogenetic contexts.
The evolutionary dynamics of mitochondrial protein-coding genes (PCGs) in S. ningshanensis reveal fascinating patterns of molecular adaptation within the Megophryidae family. Our Ka/Ks analysis, a powerful metric for detecting selective pressures [44,45], demonstrates that purifying selection overwhelmingly dominates mitochondrial evolution in these amphibians, as evidenced by consistently low ratios across all PCGs (Figure 9). This pattern strongly suggests that most mitochondrial functions are under stringent evolutionary constraints, likely due to their fundamental role in cellular energy production.
However, the observed variation in evolutionary rates among genes presents a more nuanced evolutionary story. While COX1 and Cytb exhibit extraordinary conservation (Ka/Ks < 0.04)—consistent with their central role in electron transport—the relatively elevated substitution rates in ATP8, ATP6, and ND2 (Ka/Ks = 0.10−0.77) may reflect either relaxed structural constraints or positive selection for specific functional adaptations. This differential evolutionary tempo across the mitochondrial genome potentially represents an evolutionary compromise: while core respiratory machinery remains tightly conserved to maintain essential bioenergetic functions, certain components may possess greater evolutionary flexibility to accommodate ecological specialization. These findings carry important implications for understanding high-elevation adaptation in amphibians. The maintenance of strong purifying selection across all PCGs, despite the family’s diversification across varied montane habitats, underscores the remarkable evolutionary stability of mitochondrial energy metabolism systems. This conservation may represent a fundamental constraint on evolutionary innovation in mitochondrial genomes, even in lineages facing challenging environmental conditions.
Our phylogenetic reconstruction, based on comprehensive mitochondrial genome analysis (13 PCGs) of 30 species, provides crucial resolution to longstanding uncertainties surrounding S. ningshanensis systematics. The robust congruence between BI and ML topologies (supported by high nodal values) offers compelling evidence for the species’ placement within a well-defined clade containing Oreolalax, Leptobrachium, and Leptobrachella. These findings carry significant implications for understanding Megophryidae evolution, particularly regarding the proposed division of subfamily Megophryinae into 10 genera [45,46].
The observed phylogenetic patterns reveal both consistencies and complexities in Megophryidae systematics. While confirming the monophyly of several genera, our results highlight persistent challenges in delineating evolutionary relationships, particularly within traditionally recognized groups like the Megophrys complex. The polyphyletic nature of these assemblages reinforces the growing consensus that molecular systematics must be integrated with morphological data to achieve robust taxonomic classifications [47,48]. This is especially pertinent given the family’s apparent rapid radiation pattern, a phenomenon increasingly recognized as characteristic of Asian amphibian diversification.
Notably, our study identifies several areas requiring further investigation. The unresolved relationships between certain genera (e.g., Pelodytes vs. Pelobates) and the need for broader taxonomic sampling suggest that current systematic frameworks may not fully capture the family’s evolutionary complexity. Future research directions should prioritize: (1) expanded taxonomic representation, particularly of understudied lineages, (2) incorporation of genomic-scale datasets to complement mitochondrial evidence, and (3) development of integrative approaches that reconcile molecular and morphological data. Such efforts will be essential for constructing a comprehensive evolutionary history of Megophryidae and resolving remaining systematic inconsistencies.
Our phylogenomic reconstruction, incorporating 28 complete mitogenomes, provides compelling evidence for the deep evolutionary history of Scutiger and its divergence from Oreolalax during the Paleogene (~32.76 MYA). This temporal framework reveals striking correlations between major cladogenic events and Cenozoic climate transitions. The initial Oligocene divergence coincides precisely with global cooling and Antarctic glaciation events, while subsequent radiations during the Neogene mirror the dramatic temperature fluctuations of the Miocene Climatic Optimum and subsequent Pliocene cooling.
The temporal concordance between Megophryidae diversification and global climate reorganization strongly supports climate-mediated speciation mechanisms [49]. Particularly noteworthy is the accelerated lineage splitting during periods of extreme thermal variability, suggesting that these amphibians may be particularly sensitive to temperature-driven selection pressures. This pattern holds important implications for understanding current responses to anthropogenic climate change.
From a conservation perspective, our results establish S. ningshanensis as an evolutionarily distinct lineage that persisted through multiple climate regimes. This long-term evolutionary persistence, coupled with its montane-endemic distribution, underscores its significance as a conservation priority. The mitochondrial genomic framework developed here not only clarifies phylogenetic relationships but also establishes an essential baseline for future studies of amphibian adaptation to environmental change and the development of targeted conservation strategies for ancient high-elevation lineages.

5. Conclusions

This study presents the complete mitochondrial genome (17,282 bp) of S. ningshanensis, revealing conserved vertebrate architecture with characteristic AT-rich codon bias and purifying selection across all PCGs. Structural analysis identified typical cloverleaf tRNAs, except for the DHU-deficient trnS1. Phylogenetic reconstruction robustly supports the monophyly of Oreolalax, Leptobrachium, and Leptobrachella, with Oreolalax-Leptobrachium forming a sister clade to Scutiger. The topology confirms current taxonomy, showing Boulenophys and Atympanophys as sister genera, while revealing complex genus-level diversification within Megophryidae. Molecular dating suggests S. ningshanensis originated ~32.76 MYA during accelerated Paleogene diversification. Strong purifying selection (Ka/Ks < 1) was observed, particularly in respiratory genes (COX1-3, ND1/4L/6), indicating functional constraints during high-elevation adaptation. These results provide: (1) a genomic foundation for Megophryidae systematics, (2) evidence for selective pressures shaping mitochondrial evolution, and (3) a temporal framework for understanding the family’s radiation in Asia.

Author Contributions

S.S.: Conceptualization, Formal analysis, Data curation, Writing—original draft, Writing—review and editing; S.C.: Methodology, Software, Validation, Formal analysis, Visualization, Writing—original draft, Writing—review and editing; C.L.: Formal analysis, Sample collection, Data curation; L.P. Investigation, Methodology, Writing—original draft, Data curation; D.Z.: Investigation, Resources, Data curation; Y.L.: Formal analysis, Data curation, Methodology; P.L.: Methodology, Investigation, Writing—original draft, Writing—review and editing, Visualization; L.J.: Conceptualization, Supervision, Software, Data curation, Writing—original draft, Writing—review and editing, Project administration, Funding acquisition. All authors have read and agreed to the published version of the manuscript.

Funding

This research was funded by the Natural Science Foundation Project of Science and Technology Department of Sichuan Province (grant number: 2023NSFSC0206) and the Research Project of Ecological Security and Protection Key Laboratory of Sichuan Province (grant number: ESP2003).

Institutional Review Board Statement

Not applicable.

Informed Consent Statement

Not applicable.

Data Availability Statement

Mitochondrial genome sequence data supporting the findings of this study are openly available from GenBank of the National Center for Biotechnology Information (NCBI) at https://www.ncbi.nlm.nih.gov (accession number: PV083741), accessed on 30 July 2025.

Acknowledgments

We appreciate the people who assisted with the DNA preparation.

Conflicts of Interest

The authors declare no conflicts of interest.

References

  1. Cataldo, C.S. The gastropod family Aporrhaidae in the Lower Cretaceous of the Neuquén Basin, west-central Argentina. J. Paleontol. 2014, 88, 1222–1239. [Google Scholar] [CrossRef]
  2. Munir, M.; Nishikawa, K.; Hamidy, A.; Smith, E.N. Two new species of Megophrys Kuhl and Van Hasselt (Amphibia: Megophryidae) from Sumatra, Indonesia. Zootaxa 2021, 5057, 503–529. [Google Scholar] [CrossRef]
  3. Frost, D.R.; Grant, T.; Faivovich, J.; Bain, R.H.; Haas, A.; Haddad, C.F.B.; Desa, R.O.; Channing, A.; Wilkinson, M.; Donnellan, S.C.; et al. The amphibian tree of life. Bull. Am. Mus. Nat. Hist. 2006, 297, 1–291. [Google Scholar] [CrossRef]
  4. Pyron, R.A.; Wiens, J.J. A large-scale phylogeny of Amphibia including over 2800 species, and a revised classification of extant frogs, salamanders, and caecilians. Mol. Phylogenet. Evol. 2011, 61, 543–583. [Google Scholar] [CrossRef]
  5. Jiang, K.; Wang, K.; Zou, D.H.; Yan, F.; Li, P.P.; Che, J. A new species of the genus Scutiger (Anura: Megophryidae) from Medog of southeastern Tibet, China. Zool. Res. 2016, 37, 21–30. [Google Scholar] [CrossRef]
  6. Song, J.; Tian, Y.; Guan, D.L. Characterization of the complete mitochondrial genome of an endangered alpine toad, Scutiger ningshanensis (Amphibia: Anura: Megophryidae). Conserv. Genet. Resour. 2017, 9, 35–38. [Google Scholar] [CrossRef]
  7. Dufresnes, C.; Litvinchuk, S.N. Diversity, distribution and molecular species delimitation in frogs and toads from the Eastern Palaearctic. Zool. J. Linn. Soc. 2022, 195, 695–760. [Google Scholar] [CrossRef]
  8. Primmer, C.R. From conservation genetics to conservation genomics. Ann. N. Y. Acad. Sci. 2009, 1162, 357–368. [Google Scholar] [CrossRef]
  9. Fu, J.; Weadick, C.J.; Bi, K. A phylogeny of the high-elevation Tibetan megophryid frogs and evidence for the multiple origins of reversed sexual size dimorphism. J. Zool. 2007, 273, 315–325. [Google Scholar] [CrossRef]
  10. Chen, W.; Bi, K.; Fu, J. Frequent mitochondrial gene introgression among high elevation Tibetan megophryid frogs revealed by conflicting gene genealogies. Mol. Ecol. 2010, 18, 2856–2876. [Google Scholar] [CrossRef]
  11. Hofmann, S.; Stöck, M.; Zheng, Y.; Ficetola, F.G.; Li, J.T.; Scheidt, U.; Schmidt, J. Molecular phylogenies indicate a Paleo-Tibetan origin of Himalayan Lazy Toads (Scutiger). Sci. Rep. 2017, 7, 3308. [Google Scholar] [CrossRef]
  12. Barr, C.M.; Neiman, M.; Taylor, D. Inheritance and recombination of mitochondrial genomes in plants, fungi and animals. New Phytol. 2005, 168, 39–50. [Google Scholar] [CrossRef]
  13. Guo, X.; Bao, P.J.; Pei, J.; Ding, X.Z.; Liang, C.N.; Yan, P.; Lu, D.X. Complete mitochondrial genome of Qingyang donkey (Equus asinus). Conserv. Genet. Resour. 2017, 9, 269–271. [Google Scholar] [CrossRef]
  14. Moritz, C.; Dowling, T.E.; Brown, W.M. Evolution of animal mitochondrial DNA: Relevance for population biology and systematics. Annu. Rev. Ecol. Syst. 1987, 18, 269–292. [Google Scholar] [CrossRef]
  15. Xiang, Z.Y.; Zhang, C.Y.; Zheng, W.C.; Yu, S.S.; Zhang, L.; Ding, G.H. Characterization of the complete mitochondrial genome of the Chong’an Moustache Toad, Leptobrachium liui (Pope, 1947) with a phylogenetic analysis of Megophryidae. Mitochondrial DNA Part B 2021, 6, 1061–1063. [Google Scholar] [CrossRef]
  16. Qiu, Z.Y.; Chang, H.H.; Yuan, H.; Huang, Y.; Lu, H.M.; Li, X.; Gou, X.C. Comparative mitochondrial genomes of four species of Sinopodisma and phylogenetic implications (Orthoptera, Melanoplinae). ZooKeys 2020, 969, 23–42. [Google Scholar] [CrossRef]
  17. Bao, X.L.; Cui, L.; Li, D.Y.; Fan, X.L.; Yang, M.Y.; Yang, D.Y.; Ni, Q.Y.; Yao, Y.F.; Xu, H.L.; Zeng, B.; et al. The near complete mitochondrial genome of Oreolalax schmidti (Anura: Megophryidae). Mitochondrial DNA Part B 2020, 5, 3536–3537. [Google Scholar] [CrossRef]
  18. Shu, G.C.; Yu, M.; He, Z.P.; Xie, F.; Liang, X.X. Complete mitochondrial genome of the Alpine Metacarpal-tubercled Toad Leptobrachella alpina (Amphibia, Anura, Megophryidae). Mitochondrial DNA Part B 2021, 6, 3242–3243. [Google Scholar] [CrossRef]
  19. Zhang, J.F.; Miao, G.P.; Hu, S.J.; Sun, Q.; Ding, H.W.; Ji, Z.C.; Guo, P.; Yan, S.B.; Wang, C.R.; Kan, X.Z.; et al. Quantification and evolution of mitochondrial genome rearrangement in Amphibians. BMC Ecol. Evol. 2021, 21, 19. [Google Scholar] [CrossRef]
  20. Kurabayashi, A.; Sumida, M. PCR primers for the Neobatrachian mitochondrial genome. Curr. Herpetol. 2009, 28, 1–11. [Google Scholar] [CrossRef]
  21. Tamura, K.; Stecher, G.; Kumar, S. MEGA11: Molecular Evolutionary Genetics Analysis version 11. Mol. Biol. Evol. 2021, 38, 3022–3027. [Google Scholar] [CrossRef]
  22. Bernt, M.; Donath, A.; Jühling, F.; Externbrink, F.; Florentz, C.; Fritzsch, G.; Pütz, J.; Middendorf, M.; Stadler, P.F. MITOS: Improved de novo metazoan mitochondrial genome annotation. Mol. Phylogenet. Evol. 2013, 69, 313–319. [Google Scholar] [CrossRef]
  23. Lohse, M.; Drechsel, O.; Kahlau, S.; Bock, R. Organellar Genome DRAW—A Suite of Tools for Generating Physical Maps of Plastid and Mitochondrial Genomes and Visualizing Expression Data Sets. Nucleic Acids Res. 2013, 41, W575–W581. [Google Scholar] [CrossRef]
  24. Chan, P.P.; Lin, B.Y.; Mak, A.J.; Lowe, T.M. tRNAscan-SE 2.0: Improved Detection and Functional Classification of Transfer RNAo Genes. Nucleic Acids Res. 2021, 49, 9077–9096. [Google Scholar] [CrossRef]
  25. Perna, N.T.; Kocher, T.D. Patterns of nucleotide composition at fourfold degenerate sites of animal mitochondrial genomes. J. Mol. Evol. 1995, 41, 353–358. [Google Scholar] [CrossRef]
  26. Zhang, D.; Gao, F.; Li, W.X.; Jakovli’c, I.; Zou, H.; Zhang, J.; Wang, G.T. PhyloSuite: An integrated and scalable desktop platform for streamlined molecular sequence data management and evolutionary phylogenetics studies. Mol. Ecol. Resour. 2020, 20, 348–355. [Google Scholar] [CrossRef]
  27. Katoh, K.; Standley, D.M. MAFFT multiple sequence alignment software version 7: Improvements in performance and usability. Mol. Biol. Evol. 2013, 30, 772–780. [Google Scholar] [CrossRef]
  28. Darriba, D.; Taboada, G.L.; Doallo, R.; Posada, D. jModelTest 2: More models, new heuristics and parallel computing. Nat. Methods 2012, 9, 772. [Google Scholar] [CrossRef]
  29. Ronquist, F.; Teslenko, M.; Van Der Mark, P.; Ayres, D.L.; Darling, A.; Höhna, S.; Larget, B.; Liu, L.; Suchard, M.A.; Huelsenbeck, J.P. MrBayes 3.2: Efficient Bayesian phylogenetic inference and model choice across a large model space. Syst. Biol. 2012, 61, 539–542. [Google Scholar] [CrossRef]
  30. Nguyen, L.T.; Schmidt, H.A.; von Haeseler, A.; Minh, B.Q. IQ-TREE: A fast and effective stochastic algorithm for estimating maximum-likelihood phylogenies. Mol. Biol. Evol. 2015, 32, 268–274. [Google Scholar] [CrossRef]
  31. Bouckaert, R.; Vaughan, T.G.; Barido-Sottani, J.; Duchêne, S.; Fourment, M.; Gavryushkina, A.; Heled, J.; Jones, G.; Kühnert, D.; De Maio, N.; et al. BEAST 2.5: An Advanced Software Platform for Bayesian Evolutionary Analysis. PLoS Comput. Biol. 2019, 15, e1006650. [Google Scholar] [CrossRef]
  32. Rambaut, A.; Drummond, A.J.; Xie, D.; Baele, G.; Suchard, M.A. Posterior Summarization in Bayesian Phylogenetics Using Tracer1.7. Syst. Biol. 2018, 67, 901–904. [Google Scholar] [CrossRef]
  33. Zhang, Z. KaKs_Calculator 3.0: Calculating Selective Pressure on Coding and Non-Coding Sequences. Genom. Proteom. Bioinform. 2022, 20, 536–540. [Google Scholar] [CrossRef]
  34. Zhang, D.-X.; Hewitt, G.M. Insect Mitochondrial Control Region: A Review of Its Structure, Evolution and Usefulness in Evolutionary Studies. Biochem. Syst. Ecol. 1997, 25, 99–120. [Google Scholar] [CrossRef]
  35. Ingman, M.; Kaessmann, H.; Pääbo, S.; Gyllensten, U. Mitochondrial Genome Variation and the Origin of Modern Humans. Nature 2000, 408, 708–713. [Google Scholar] [CrossRef]
  36. Taanman, J.W. The mitochondrial genome: Structure, transcription, translation and replication. Biochim. Biophys. Acta Bioenerg. 1999, 1410, 103–123. [Google Scholar] [CrossRef]
  37. Meiklejohn, C.D.; Montooth, K.L.; Rand, D.M. Positive and negative selection on the mitochondrial genome. Trends Genet. 2007, 23, 259–263. [Google Scholar] [CrossRef]
  38. Montaña-Lozano, P.; Moreno-Carmona, M.; Ochoa-Capera, M.; Medina, N.S.; Boore, J.L.; Prada, C.F. Comparative genomic analysis of vertebrate mitochondrial reveals a differential of rearrangements rate between taxonomic class. Sci. Rep. 2022, 12, 5479. [Google Scholar] [CrossRef]
  39. Zhou, Q.; Xiang, H.M.; Zhang, M.Y.; Liu, Y.; Gu, Z.R.; Lan, X.Y.; Wang, J.X.; Jiang, W.S. Two Complete Mitochondrial Genomes of Leptobrachium (Anura: Megophryidae: Leptobrachiinae): Characteristics, Population Divergences, and Phylogenetic Implications. Genes 2023, 14, 768. [Google Scholar] [CrossRef]
  40. Zhang, J.Y.; Zhang, L.P.; Yu, D.N.; Storey, K.B.; Zheng, R.Q. Complete mitochondrial genomes of Nanorana taihangnica and N. yunnanensis (Anura: Dicroglossidae) with novel gene arrangements and phylogenetic relationship of Dicroglossidae. BMC Evol. Biol. 2018, 18, 26. [Google Scholar] [CrossRef]
  41. Zhang, P.; Liang, D.; Mao, R.; Hillis, D.M.; Wake, D.B.; Cannatella, D.C. Efficient sequencing of Anuran mtDNAs and a mitogenomic exploration of the phylogeny and evolution of frogs. Mol. Biol. Evol. 2013, 30, 1899–1915. [Google Scholar] [CrossRef]
  42. Yu, X.; Du, Y.; Fang, M.; Li, H.; Lin, L. The mitochondrial genome of Pseudocalotes microlepis (Squamata: Agamidae) and its Phylogenetic position in agamids. Asian Herpetol. Res. 2018, 9, 24–34. [Google Scholar]
  43. Yuan, S.; Xia, Y.; Zheng, Y.; Zeng, X. Next-generation sequencing of mixed genomic DNA allows efficient assembly of rearranged mitochondrial genomes in Amolops chunganensis and Quasipaa boulengeri. PeerJ 2016, 4, e2786. [Google Scholar] [CrossRef][Green Version]
  44. Bloom, J.D.; Labthavikul, S.T.; Otey, C.R.; Arnold, F.H. Protein stability promotes evolvability. Proc. Natl. Acad. Sci. USA 2006, 103, 5869–5874. [Google Scholar] [CrossRef]
  45. Yang, Z.H.; Nielsen, R. Estimating synonymous and nonsynonymous substitution rates under realistic evolutionary models. Mol. Biol. Evol. 2000, 17, 32–43. [Google Scholar] [CrossRef]
  46. Zhang, L.N.; Ma, P.F.; Zhang, Y.X.; Zeng, C.X.; Zhao, L. Using nuclear loci and allelic variation to disentangle the phylogeny of Phyllostachys (Poaceae, Bambusoideae). Mol. Phylogenet. Evol. 2019, 137, 222–235. [Google Scholar] [CrossRef]
  47. Lyu, Z.T.; Qi, S.; Wang, J.; Zhang, S.Z.; Zhao, J.; Zeng, Z.C.; Wan, H.; Yang, J.H.; Mo, Y.M.; Wang, Y.Y. Generic classification of Asian horned toads (Anura: Megophryidae: Megophryinae) and monograph of Chinese species. Zool. Res. 2023, 44, 380–450. [Google Scholar] [CrossRef]
  48. Shi, S.C.; Zhang, M.H.; Xie, F.; Jiang, J.P.; Liu, W.L.; Ding, L.; Li, L.; Wang, B. Multiple data revealed two new species of the Asian horned toad Megophrys Kuhl & Van Hasselt, 1822 (Anura, Megophryidae) from the eastern corner of the Himalayas. ZooKeys 2020, 977, 101–161. [Google Scholar] [CrossRef]
  49. Zhang, C.; Zhang, S.; Tian, Z.; Wang, Y.; Xu, S.; Wang, D. Comprehensive analysis of phylogenetic relationship and optimal codons in mitochondrial genomes of the genus Pseudogastromyzon. Animals 2024, 14, 495. [Google Scholar] [CrossRef]
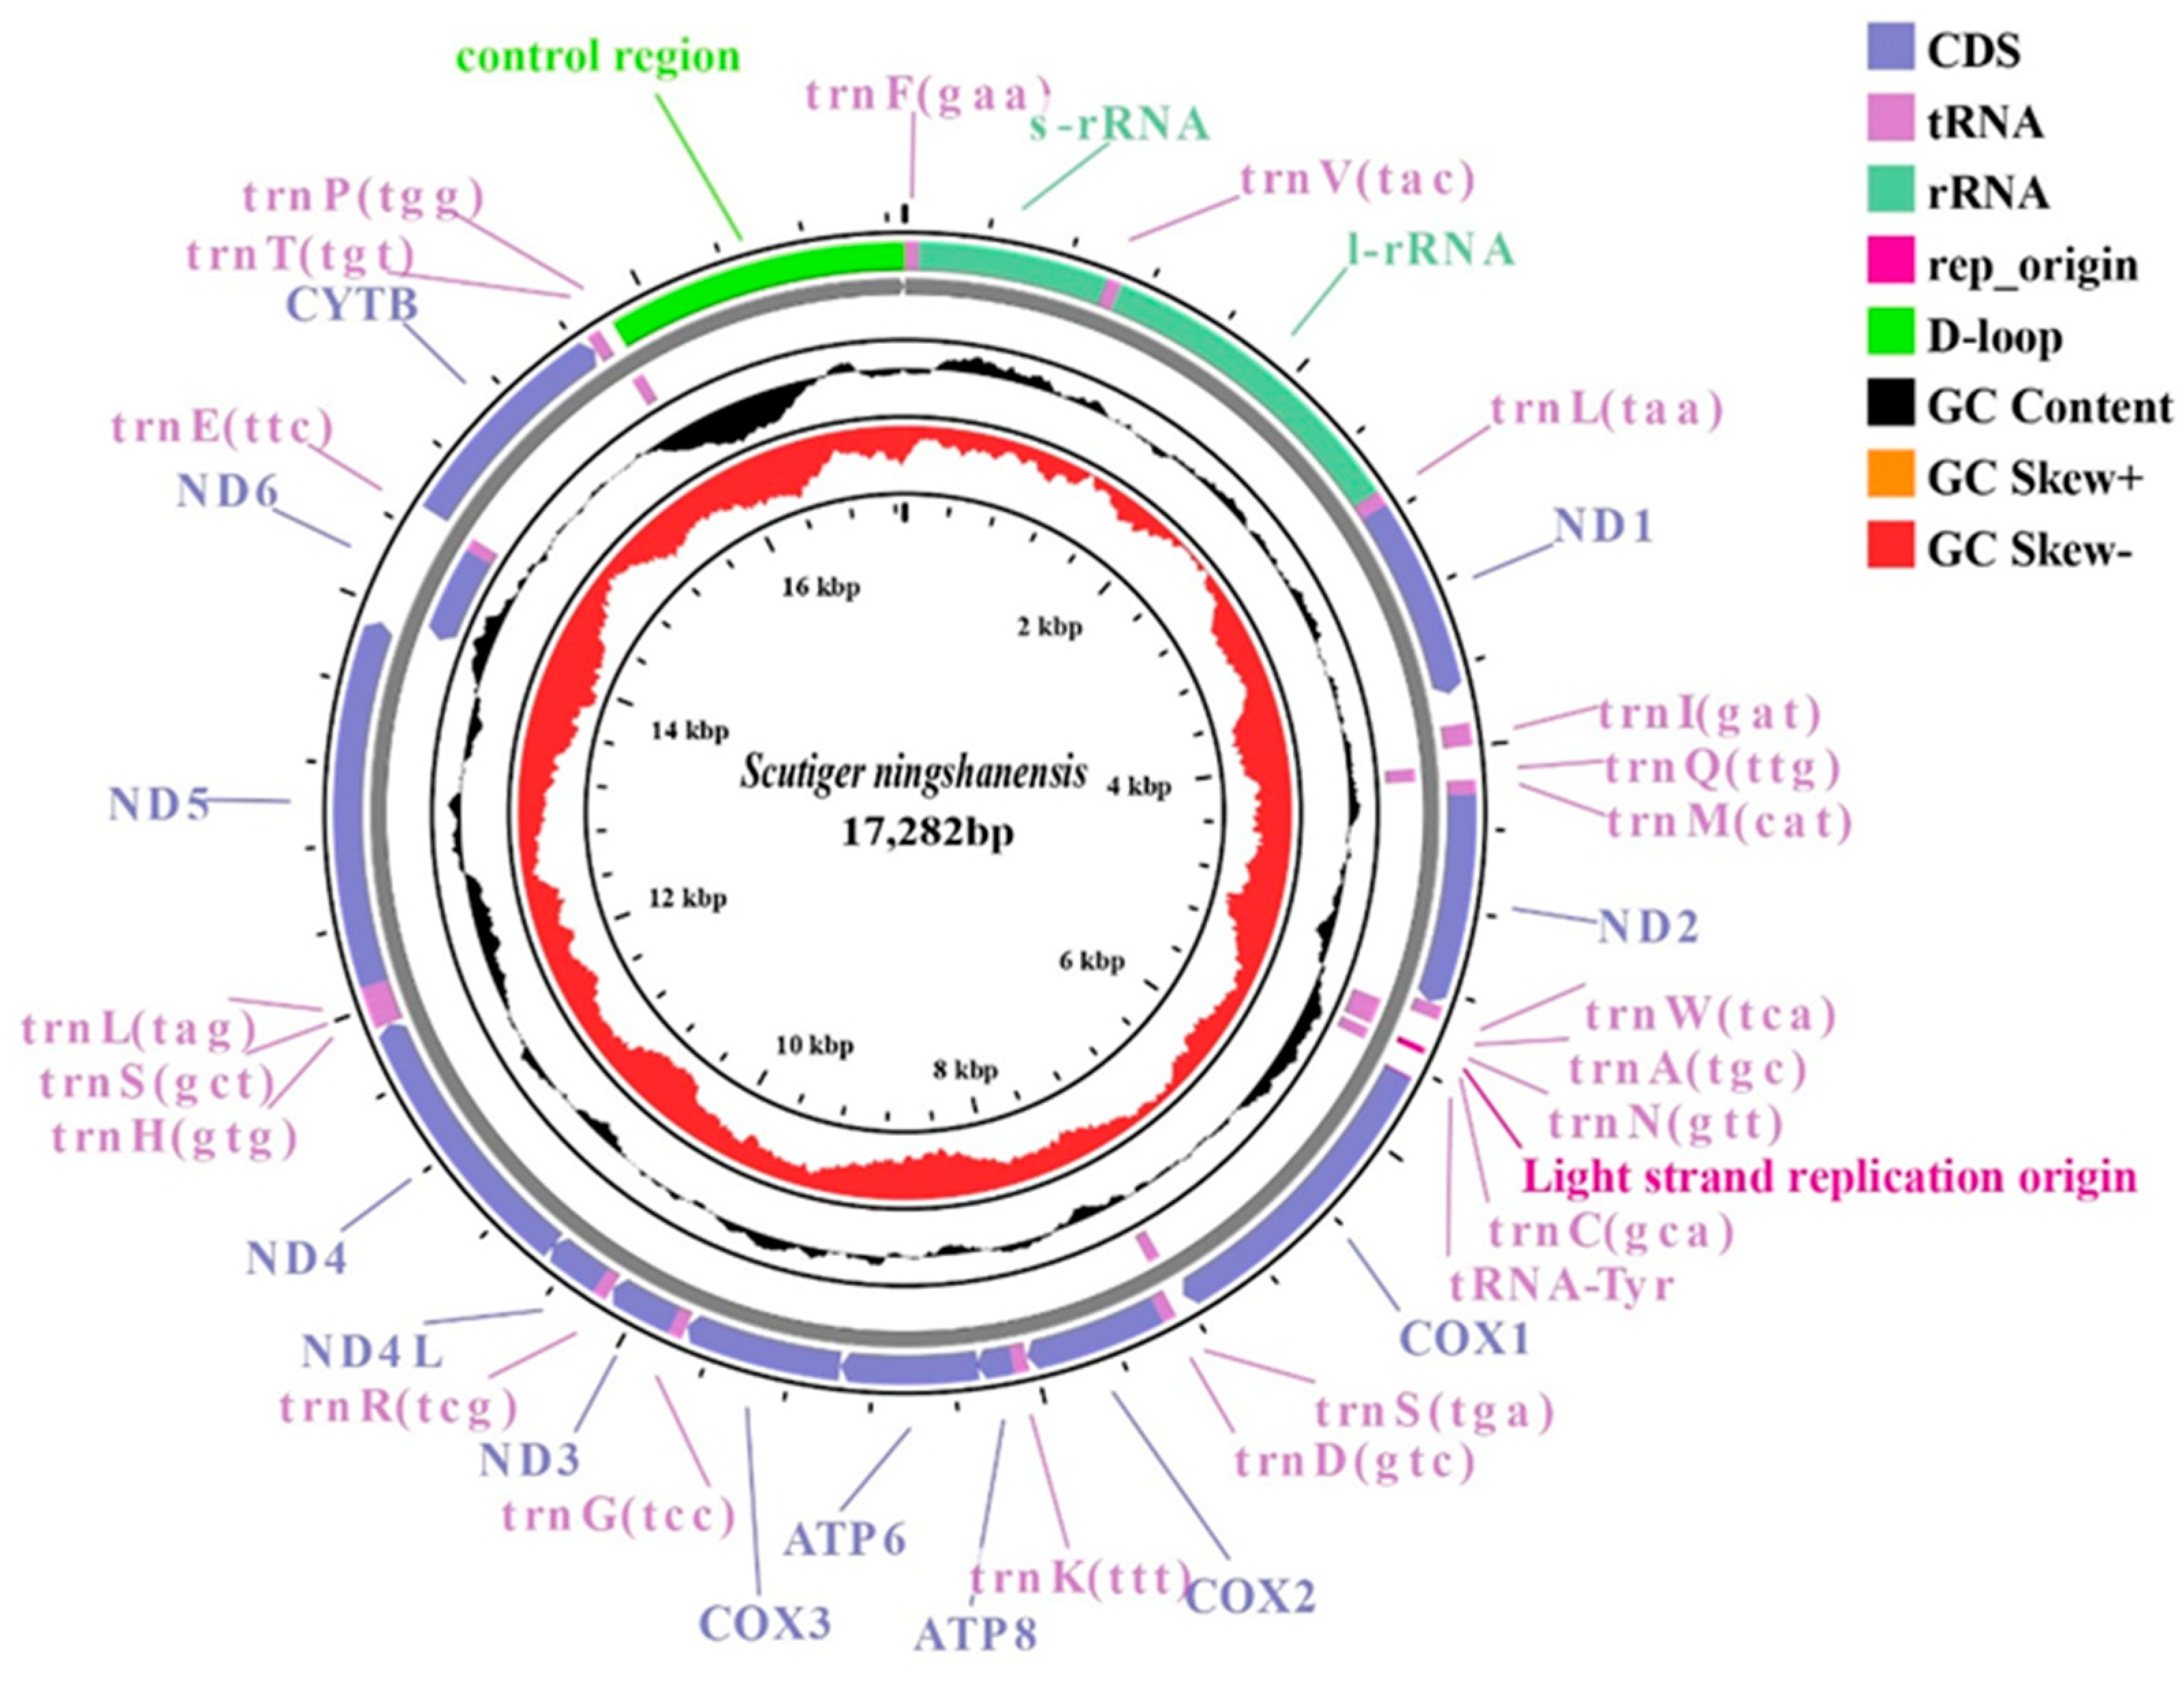
Figure 1. Complete mitogenome circles map of S. ningshanensis. Purple represents tRNA, green represents rRNA, black areas represent GC content; in addition, the map also shows the GC-skew value.
Genes 16 00879 g001
Figure 2. Amino acid content of PCGs in S. ningshanensis.
Genes 16 00879 g002
Figure 3. Relative synonymous codon usage (RSCU) in the mitogenome of S. ningshanensis. (The codon is represented by the X-axis, and the RSCU value is represented by the Y-axis).
Genes 16 00879 g003
Figure 4. Putative secondary structure of transfer RNA (tRNA) genes of mitogenome of S. ningshanensis.
Genes 16 00879 g004
Figure 5. The prognostic map of 12S rRNA secondary structures in S. ningshanensis.
Genes 16 00879 g005
Figure 6. The prognostic map of 16S rRNA secondary structures in S. ningshanensis.
Genes 16 00879 g006
Figure 7. Phylogenetic relationships within Megophryidae derived from ML method based on 13 PCGs; the numbers on the nodes represent the support values of these nodes, the first number represents the bootstrap value of the ML tree, and the second number represents the posterior probability from the BI tree. Species grouped under the same color on the right side of the tree belong to the same taxonomic unit. The species S. ningshanensis used in this study is indicated by the Latin name with an asterisk.
Genes 16 00879 g007
Figure 8. The divergence time of Megophryidae with 95% highest posterior probability density. Numbers nearby nodes refer to divergence times. The “*” represents the current study.
Genes 16 00879 g008
Figure 9. The Ka/Ks values among the S. ningshanensis species. Note: PV083741, KU127230, NC_030627, NC_088425, and NC_056343 represent S. ningshanensis (this study), O. major, O. lichuanensis, L. alpina, and O. schmidti, respectively.
Genes 16 00879 g009
Table 1. PCR primers for the S. ningshanensis mitochondrial genome.
No.Primer NameSequence 5′-3′Primer Length (bp)References
1CTF1ATTAAGATAAAGCCCTTCTAGAA23This study
CTR1AATACCATTGGTGTCCCACG20
2CTF2CAAGAYGCRRYHTCHCCNATYATAGAAGA29[20]
CTR2CCTTCWCGRAYNAYRTCTCGYCAYCAYTG 29
3CTF3GCMCACCAAGCWCAYGCHTWYCAYATRGT29[20]
CTR3GADCCDGCRATDGGDGCYTCDACRTG26
4CTF4CACTACGCAGCAGACACCTC20This study
CTR4CAAGGGAAGGTCCTATCAAGT21
5CTF5ATGGTGGTATAATAGTATGGTGT23This study
CTR5GTTGTTGGGAATAAGGGTGT20
6CTF6ACCTCATACGCAAACTCAGC20This study
CTR6TACCATCATTTTAATAGGTGGA22
7CTF7CCCACATGTATAATTAACAGATT23This study
CTR7GGAGTAATCTTTCGTTTTGTAT22
8CTF8TTCGCAAAGCAAATACCCACA21This study
CTR8CGCCGACTAATATCAATTTG20
9CTF9CCACACCYHCAAGGGHAYTCAGCAGT26[20]
CTR9CTTYGCACGGTYAGRRTACCGCGGCCGT28
10CTF10CCCGCCTGTTTACCAAAAACAT22[20]
CTR10ACRTTRAANCCNGANACHAGTTCWGAYTC29
11CTF11CGRGCHGTHGCHCAAACNATYTCHTAYGA29[20]
CTR11AAGCTCKCTGGAWWGAGYGTTTAGCTGTTAA31
12CTF12GTCGCCCAAACAATCTCATATGA23[20]
CTR12AGGAGGGCTTTATCTTAAT19
Table 2. Annotation of the mitochondrial genome of S. ningshanensis.
Gene Direction PositionSize (bp) IGS (bp)Codon
FromToStartStop
tRNA-PheH266650
12S rRNAH671001935−4
tRNA-ValH9981067681
16S rRNAH106926801610−3
tRNA-LeuH26782752750
ND1H27533730978154ATGTAA
tRNA-IleH388539957187
tRNA-GlnL40834153717
tRNA-MetH41614229680
ND2H4230527310440ATGTAA
tRNA-TrpH52745342694
tRNA-AlaL53475416700
tRNA-AsnL5417548973−1
rep_originH5489552032−3
tRNA-CysL55185580630
tRNA-TyrL55815650701
COX1H5652720315521GTGT−−
tRNA-SerL72057275714
tRNA-AspH72807347681
COX2H734980366880ATGT−−
tRNA-LysH80378110740
ATP8H81118290180−10GTGTAA
ATP6H828189626820ATGT−−
COX3H896397467840ATGT−−
tRNA-GlyH97479816700
ND3H981710,1593430ATGT−−
tRNA-ArgH10,16010,228690
ND4LH10,22910,525297−7ATGTAA
ND4H10,51911,89613780ATGT−−
tRNA-HisH11,89711,965690
tRNA-SerH11,96612,032670
tRNA-LeuH12,03312,103710
ND5H12,10413,924182115ATGTAG
ND6L13,94014,4495100ATGAGG
tRNA-GluL14,45014,518692
CYTBH14,52115,66111410ATGT−−
tRNA-ThrH15,66215,731702
tRNA-ProL15,73415,802690
D-loopH15,80317,28214800
Table 3. Nucleotide composition and skewness values of S. ningshanensis mitogenome.
GensSize(bp)A%T%G%C%A + T%G + C%AT-SkewGC-Skew
Mitogenome17,28228.5432.5114.324.6461.0538.94−0.065−0.265
PCGs11,3982634.8714.6724.4660.8739.13−0.145−0.250
PCGs(1st)379727.4427.2323.1222.254.6745.330.00390.0203
PCGs(2nd)379717.9942.0912.9626.9760.0739.93−0.4011−0.3509
PCGs(3rd)379732.635.197.9524.2667.7932.21−0.0381−0.5061
tRNAs150429.7929.2620.8820.0859.0540.960.0090.0195
rRNAs254732.0827.2117.7123.0159.2940.710.082−0.13
D-loop148032.2336.2210.2721.2868.4531.55−0.058−0.349
ND197826.0733.3326.2814.3159.440.59−0.122−0.294
ND2104425.9637.3625.4811.2163.3236.69−0.18−0.389
COX1155225.9733.3123.7117.0159.2840.72−0.123−0.164
COX268829.3631.124.8514.6860.4639.53−0.028−0.257
ATP818029.4438.8923.338.3368.3331.67−0.138−0.473
ATP668225.5136.3626.3911.7361.8738.12−0.175−0.384
COX378423.7233.4225.8916.9662.142.86−0.169−0.208
ND334323.3238.7823.6214.2962.137.9−0.248−0.246
ND4L29724.923328.9613.1357.9242.09−0.139−0.376
ND4137827.0734.8325.3312.7761.938.1−0.125−0.329
ND5182127.435.1524.6612.862.5537.45−0.123−0.316
ND651018.8238.4311.1831.5757.2542.75−0.3420.477
CYTB114126.0335.1424.4514.3761.1738.83−0.149−0.259
Disclaimer/Publisher’s Note: The statements, opinions and data contained in all publications are solely those of the individual author(s) and contributor(s) and not of MDPI and/or the editor(s). MDPI and/or the editor(s) disclaim responsibility for any injury to people or property resulting from any ideas, methods, instructions or products referred to in the content.