
Customized Chromosomal Microarrays for Neurodevelopmental Disorders

 ,
, 
 , ,
, ,
Abstract
1. Introduction
2. Materials and Methods
2.1. Gene Selection and CMA Design Strategy
2.2. Experimental Procedure
2.3. Sample Selection
2.4. Data Analysis
- Separation of the altered regions into CNV losses and gains. The intervals from the two datasets were merged using bedtools MergeBED Galaxy Version 2.30.0. The merging was performed independently for loss and gain intervals [16].
- Overlapping intervals of loss and gain were subtracted using bedtools SubtractBed Galaxy Version 2.30.0. This resulted in intervals that were detected as both CNV loss and CNV gain in the tested samples [16].
- To detect unique CNV losses and gains, the bedtools Intersect intervals Galaxy Version 2.30.0 tool was used. This resulted in intervals that were detected in the tested samples only as copy number loss and copy number gain [16]. A complete list of CNV regions can be found in Supplementary Table S1.
- The genomic coordinates of the unique CNV loss and gain regions were used to retrieve genes from RefSeq Select+MANE and RefSeq Curated hg38, UCSC Table Browser. A custom CMA gene list was created from the RefSeq Select+MANE genes—MANE custom CMA gene list (Supplementary Table S2).
- The genomic coordinates of the unique CNV loss and gain regions were used in the web-based tool Ensembl BioMart to retrieve long non-coding RNAs. The search was restricted to “Gene type: lncRNA.” A complete list of all lncRNAs can be found in Supplementary Table S3.
2.5. Custom CMA Interactome
2.6. Custom CMA NDD Interactome and Extending CMA Candidate Gene List
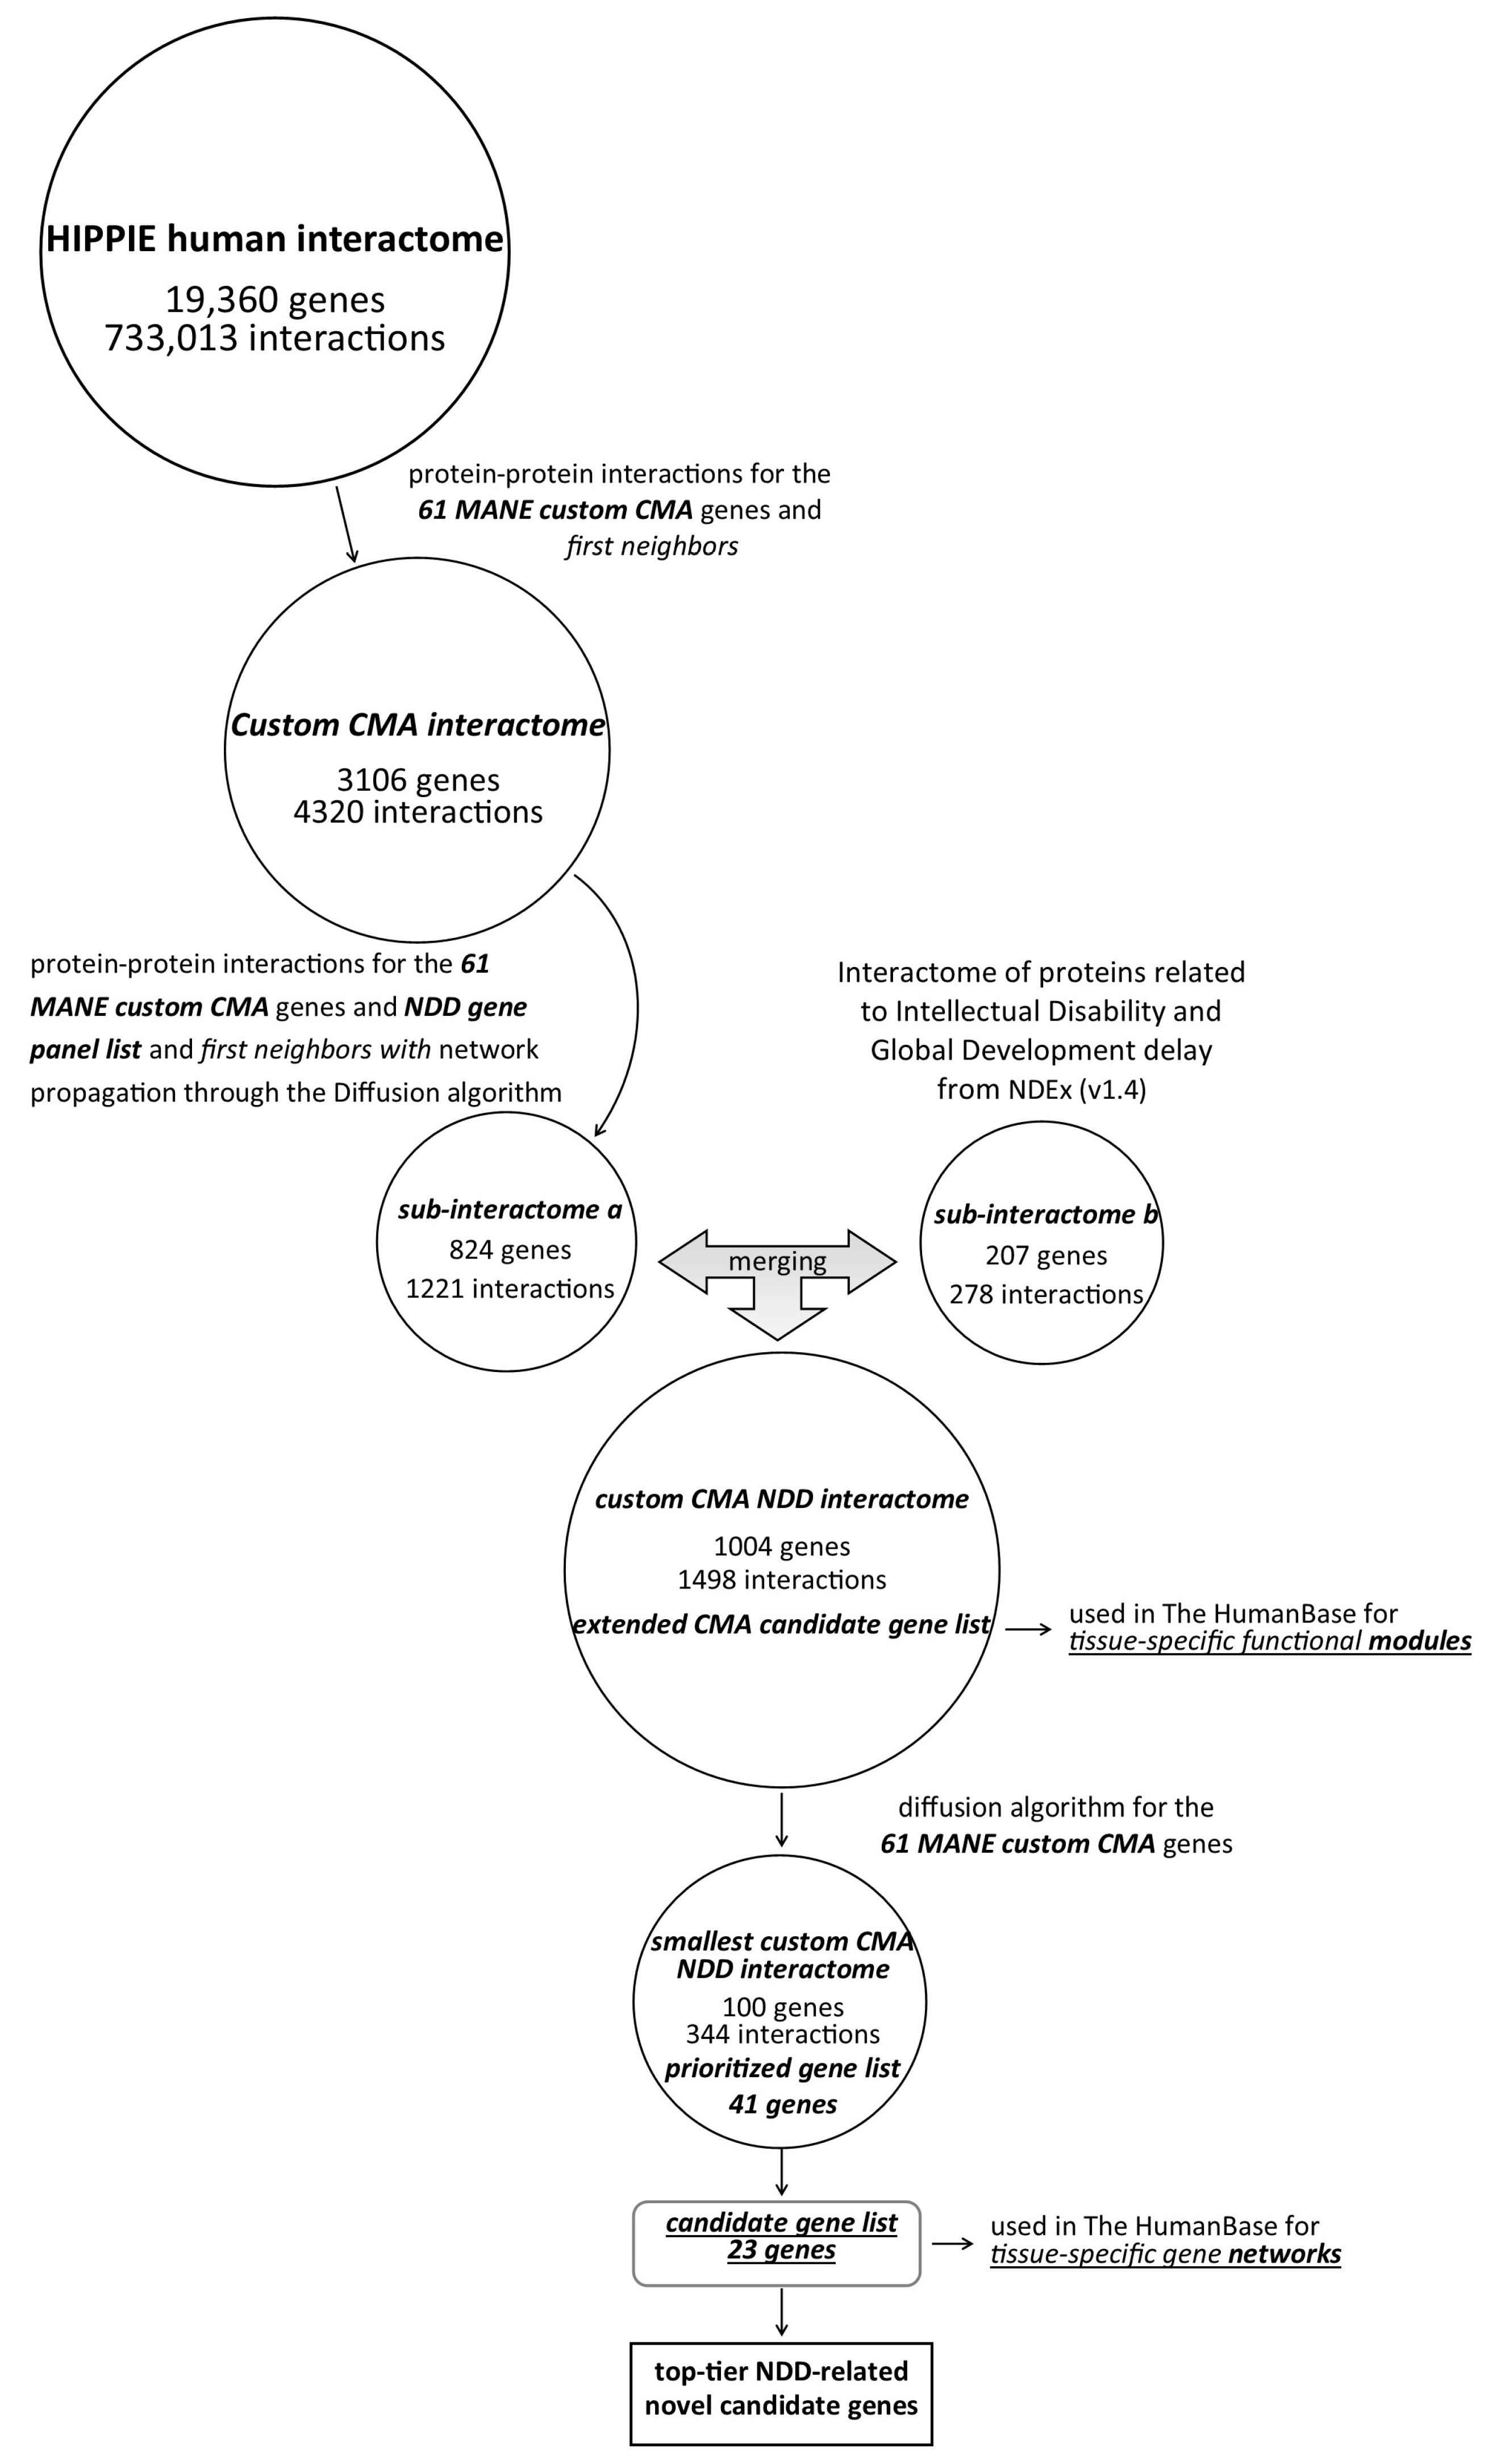
- A list of “NDD genes” was compiled to prioritize protein–protein interactions associated with NDDs. The “NDD gene panel” consists of genes selected from multiple web server sources, including SFARI Genes (Score 1, Score 2, and syndromic genes were included); the human brain proteome (detected in single genes: detected only in the brain); Synaptic Gene Ontologies genes; OMIM (search term “neurodevelopmental”); ENTREZ; gene2phenotype (search term “cognition,” confidence category: definite and strong); SysNDD database (category: definite). The integrative “NDD gene panel” can be found in Supplementary Table S5. Next, an integrative “NDD gene panel” list was used together with MANE’s custom CMA gene list to expand the selection of nodes (query nodes) using network propagation by the diffusion algorithm (v.1.6.1). Network propagation estimates network proximity (strength association between genes located in network proximity) and finds subnetworks in which the nodes are closely connected. Network diffusion aims to understand how changes in one part of the network can affect the entire network. The diffusion output value was set to 310. A resulting network with 824 nodes and 1221 edges is available in the Supplementary Table S6.
- Next, MANE’s custom CMA gene list was used as input for the interactome “Interaction network of proteins associated with intellectual disability and global developmental delay” in NDEx (v1.4) to extract significant associations between custom CMA genes and evolutionarily conserved and brain-expressed new putative candidates based on the MCL algorithm. Each node corresponds to a protein, and each line represents an interaction with high sustainability (STRING version 11.0; combined score > 0.9) [19]. A 1-step neighbor query yielded an output network with 207 nodes and 278 edges (Supplementary Table S7).
2.7. Tissue-Specific Functional Modules
2.8. Novel NDD Candidate Gene Prioritization
2.9. Novel NDD Candidate Gene Selection
- The probability predicted by pLI, LOEUF, sHet, pHaplo, and pTriplo was retrieved from Decipher.
- The Mouse Genome Informatics (MGI) database was searched for matching mouse models.
- Gene expression data were retrieved from the Human Brain Transcriptome database. In addition, protein, RNA, and single-cell expression data from the Human Protein Atlas were evaluated.
- The Database of Genomic Variants (Gold Standard) was searched for data on genomic variations in the general population.
- The PubMed databases were searched for comparable literature data.
3. Results
3.1. Custom CMA Validation and Pathogenic and Likely Pathogenic CNVs Detected by Custom CMA
3.2. Interactomes—From the Whole Human Interactome to the Smallest Custom CMA NDDi
3.3. Extended Custom CMA List Within Tissue-Specific Network-Based Functional Modules
3.4. NDD Candidate CNVs
3.5. Tissue-Specific Gene Networks for Protein-Coding Genes from Candidate CNVs
3.6. Top-Tier NDD-Related Novel Candidate CNVs in Patient Context
4. Discussion
4.1. Custom CMA Validation and Diagnostic Yield
4.2. Interactome Analysis
4.3. Extended Custom CMA List Within Tissue-Specific Network-Based Functional Modules
4.4. NDD Candidate CNVs
4.5. Tissue-Specific Gene Networks for NDD Candidate Genes
4.6. Top-Ranking NDD Candidate CNVs in Patient Context
5. Conclusions
5.1. Limitations of the Study
5.2. Conclusion and Further Remarks
Supplementary Materials
Author Contributions
Funding
Institutional Review Board Statement
Informed Consent Statement
Data Availability Statement
Acknowledgments
Conflicts of Interest
Abbreviations
| CMA | Chromosomal Microarray |
| NDD | Neurodevelopmental Disorders |
| CNV | Copy Number Variation |
| ASD | Autism Spectrum Disorder |
| GO | Gene Ontology |
| MGI | Mouse Genome Informatics |
| pLI | Probability of being Loss-of-function-Intolerant |
| LOEUF | Loss-of-function Observed/Expected Upper bound Fraction |
| sHet | Selection coefficient against heterozygous loss-of-function variants |
| pHaplo | Probability of haploinsufficiency |
| pTriplo | Probability of triplosensitivity |
| HIPPIE | Human Integrated Protein–Protein Interaction rEference |
| NDEx | Network Data Exchange |
| SFARI | Simons Foundation Autism Research Initiative |
| OMIM | Online Mendelian Inheritance in Man |
| GTG | Giemsa (G-banding technique) |
| MLPA | Multiplex Ligation-dependent Probe Amplification |
| DGV | Database of Genomic Variants |
| SNV | Single Nucleotide Variant |
| indel | Insertion-deletion (variant) |
| CGH | Comparative Genomic Hybridization |
| MANE | Matched Annotation from NCBI and EMBL-EBI |
| UCSC | University of California, Santa Cruz (Genome Browser) |
| GRCh38 | Genome Reference Consortium Human Build 38 |
| RNA | Ribonucleic Acid |
| TF | Transcription Factor |
| lncRNA | Long Non-Coding RNA |
| STRING | Search Tool for the Retrieval of Interacting Genes/Proteins |
| MCL | Markov Cluster Algorithm |
References
- Francés, L.; Quintero, J.; Fernández, A.; Ruiz, A.; Caules, J.; Fillon, G.; Hervás, A.; Soler, C.V. Current State of Knowledge on the Prevalence of Neurodevelopmental Disorders in Childhood According to the DSM-5: A Systematic Review in Accordance with the PRISMA Criteria. Child Adolesc. Psychiatry Ment. Health 2022, 16, 27. [Google Scholar] [CrossRef] [PubMed]
- Satterstrom, F.K.; Kosmicki, J.A.; Wang, J.; Breen, M.S.; De Rubeis, S.; An, J.-Y.; Peng, M.; Collins, R.; Grove, J.; Klei, L.; et al. Large-Scale Exome Sequencing Study Implicates Both Developmental and Functional Changes in the Neurobiology of Autism. Cell 2020, 180, 568–584.e23. [Google Scholar] [CrossRef] [PubMed]
- Coe, B.P.; Stessman, H.A.F.; Sulovari, A.; Geisheker, M.R.; Bakken, T.E.; Lake, A.M.; Dougherty, J.D.; Lein, E.S.; Hormozdiari, F.; Bernier, R.A.; et al. Neurodevelopmental Disease Genes Implicated by de Novo Mutation and Copy Number Variation Morbidity. Nat. Genet. 2019, 51, 106–116. [Google Scholar] [CrossRef] [PubMed]
- Carroll, L.; Braeutigam, S.; Dawes, J.; Krsnik, Z.; Kostovic, I.; Coutinho, E.; Dewing, J.; Horton, C.; Gomez-Nicola, D.; Menassa, D. Autism Spectrum Disorders: Multiple Routes to, and Multiple Consequences of, Abnormal Synaptic Function and Connectivity. Neurosci. 2020, 27, 10–29. [Google Scholar] [CrossRef] [PubMed]
- Iakoucheva, L.M.; Muotri, A.R.; Sebat, J. Getting to the Cores of Autism. Cell 2019, 178, 1287–1298. [Google Scholar] [CrossRef] [PubMed]
- Yamasaki, M.; Makino, T.; Khor, S.-S.; Toyoda, H.; Miyagawa, T.; Liu, X.; Kuwabara, H.; Kano, Y.; Shimada, T.; Sugiyama, T.; et al. Sensitivity to Gene Dosage and Gene Expression Affects Genes with Copy Number Variants Observed among Neuropsychiatric Diseases. BMC Med. Genom. 2020, 13, 55. [Google Scholar] [CrossRef] [PubMed]
- Maya, I.; Basel-Salmon, L.; Singer, A.; Sagi-Dain, L. High-Frequency Low-Penetrance Copy-Number Variant Classification: Should We Revise the Existing Guidelines? Genet. Med. 2020, 22, 1276–1277. [Google Scholar] [CrossRef] [PubMed]
- Riggs, E.R.; Nelson, T.; Merz, A.; Ackley, T.; Bunke, B.; Collins, C.D.; Collinson, M.N.; Fan, Y.-S.; Goodenberger, M.L.; Golden, D.M.; et al. Copy Number Variant Discrepancy Resolution Using the ClinGen Dosage Sensitivity Map Results in Updated Clinical Interpretations in ClinVar. Hum. Mutat. 2018, 39, 1650–1659. [Google Scholar] [CrossRef] [PubMed]
- Schoch, K.; Tan, Q.K.-G.; Stong, N.; Deak, K.L.; McConkie-Rosell, A.; McDonald, M.T.; Undiagnosed Diseases Network; Goldstein, D.B.; Jiang, Y.-H.; Shashi, V. Alternative Transcripts in Variant Interpretation: The Potential for Missed Diagnoses and Misdiagnoses. Genet. Med. 2020, 22, 1269–1275. [Google Scholar] [CrossRef] [PubMed]
- Weise, A.; Mrasek, K.; Klein, E.; Mulatinho, M.; Llerena, J.C.; Hardekopf, D.; Pekova, S.; Bhatt, S.; Kosyakova, N.; Liehr, T. Microdeletion and Microduplication Syndromes. J. Histochem. Cytochem. 2012, 60, 346–358. [Google Scholar] [CrossRef] [PubMed]
- Goldenberg, P. An Update on Common Chromosome Microdeletion and Microduplication Syndromes. Pediatr. Ann. 2018, 47, e198–e203. [Google Scholar] [CrossRef] [PubMed]
- Nevado, J.; Mergener, R.; Palomares-Bralo, M.; Souza, K.R.; Vallespín, E.; Mena, R.; Martínez-Glez, V.; Mori, M.Á.; Santos, F.; García-Miñaur, S.; et al. New Microdeletion and Microduplication Syndromes: A Comprehensive Review. Genet. Mol. Biol. 2014, 37, 210–219. [Google Scholar] [CrossRef] [PubMed]
- Wetzel, A.S.; Darbro, B.W. A Comprehensive List of Human Microdeletion and Microduplication Syndromes. BMC Genom. Data 2022, 23, 82. [Google Scholar] [CrossRef] [PubMed]
- Borovečki, F.; Brecević, L.; Jerčić Gotovac, K.; Rinčić, M. Gene Chip Used for Diagnostics e.g., of Intellectual Disorder i.e., Developmental Intellectual Disorder or Autism Spectrum Disorder, Comprises Genetic Sequences Selected from One or More of Specified Number of Sequences. 2018. Available online: https://patents.google.com/patent/WO2017221040A2/en (accessed on 13 June 2025).
- Kearney, H.M.; South, S.T.; Wolff, D.J.; Lamb, A.; Hamosh, A.; Rao, K.W. American College of Medical Genetics Recommendations for the Design and Performance Expectations for Clinical Genomic Copy Number Microarrays Intended for Use in the Postnatal Setting for Detection of Constitutional Abnormalities. Genet. Med. 2011, 13, 676–679. [Google Scholar] [CrossRef] [PubMed]
- Grüning, B. Galaxy Tool Wrappers 2022. Available online: https://academic.oup.com/bioinformatics/article/26/6/841/244688?login=false (accessed on 13 May 2024).
- Alanis-Lobato, G.; Andrade-Navarro, M.A.; Schaefer, M.H. HIPPIE v2.0: Enhancing Meaningfulness and Reliability of Protein-Protein Interaction Networks. Nucleic Acids Res. 2017, 45, D408–D414. [Google Scholar] [CrossRef] [PubMed]
- Shannon, P.; Markiel, A.; Ozier, O.; Baliga, N.S.; Wang, J.T.; Ramage, D.; Amin, N.; Schwikowski, B.; Ideker, T. Cytoscape: A Software Environment for Integrated Models of Biomolecular Interaction Networks. Genome Res. 2003, 13, 2498–2504. [Google Scholar] [CrossRef] [PubMed]
- Piergiorge, R.M.; de Vasconcelos, A.T.R.; Gonçalves Pimentel, M.M.; Santos-Rebouças, C.B. Strict Network Analysis of Evolutionary Conserved and Brain-Expressed Genes Reveals New Putative Candidates Implicated in Intellectual Disability and in Global Development Delay. World J. Biol. Psychiatry 2021, 22, 435–445. [Google Scholar] [CrossRef] [PubMed]
- Greene, C.S.; Krishnan, A.; Wong, A.K.; Ricciotti, E.; Zelaya, R.A.; Himmelstein, D.S.; Zhang, R.; Hartmann, B.M.; Zaslavsky, E.; Sealfon, S.C.; et al. Understanding Multicellular Function and Disease with Human Tissue-Specific Networks. Nat. Genet. 2015, 47, 569–576. [Google Scholar] [CrossRef] [PubMed]
- Krishnan, A.; Zhang, R.; Yao, V.; Theesfeld, C.L.; Wong, A.K.; Tadych, A.; Volfovsky, N.; Packer, A.; Lash, A.; Troyanskaya, O.G. Genome-Wide Prediction and Functional Characterization of the Genetic Basis of Autism Spectrum Disorder. Nat. Neurosci. 2016, 19, 1454–1462. [Google Scholar] [CrossRef] [PubMed]
- Zhou, J.; Troyanskaya, O.G. Predicting Effects of Noncoding Variants with Deep Learning–Based Sequence Model. Nat. Methods 2015, 12, 931–934. [Google Scholar] [CrossRef] [PubMed]
- Zhou, J.; Theesfeld, C.L.; Yao, K.; Chen, K.M.; Wong, A.K.; Troyanskaya, O.G. Deep Learning Sequence-Based Ab Initio Prediction of Variant Effects on Expression and Disease Risk. Nat. Genet. 2018, 50, 1171–1179. [Google Scholar] [CrossRef] [PubMed]
- Chen, K.M.; Wong, A.K.; Troyanskaya, O.G.; Zhou, J. A Sequence-Based Global Map of Regulatory Activity for Deciphering Human Genetics. Nat. Genet. 2022, 54, 940–949. [Google Scholar] [CrossRef] [PubMed]
- Doncheva, N.T.; Morris, J.H.; Gorodkin, J.; Jensen, L.J. Cytoscape StringApp: Network Analysis and Visualization of Proteomics Data. J. Proteome Res. 2019, 18, 623–632. [Google Scholar] [CrossRef] [PubMed]
- Transcriptomic Diversity of Cell Types Across the Adult Human Brain|Science. Available online: https://www.science.org/doi/10.1126/science.add7046 (accessed on 13 June 2025).
- Clarke, T.; Fernandez, F.E.; Dawson, P.A. Sulfation Pathways During Neurodevelopment. Front. Mol. Biosci. 2022, 9, 866196. [Google Scholar] [CrossRef] [PubMed]
- Pfau, A.; López-Cayuqueo, K.I.; Scherer, N.; Wuttke, M.; Wernstedt, A.; González Fassrainer, D.; Smith, D.E.; van de Kamp, J.M.; Ziegeler, K.; Eckardt, K.-U.; et al. SLC26A1 Is a Major Determinant of Sulfate Homeostasis in Humans. J. Clin. Investig. 2023, 133, e161849. [Google Scholar] [CrossRef] [PubMed]
- Yoshida, Y.; Inubushi, T.; Yokoyama, M.; Nag, P.; Sasaki, J.; Oka, A.; Murotani, T.; Kani, R.; Shiraishi, Y.; Kurosaka, H.; et al. Slc26a2-Mediated Sulfate Metabolism Is Important in Tooth Development. Dis. Model. Mech. 2024, 17, dmm052107. [Google Scholar] [CrossRef] [PubMed]
- Le Tallec, B.; Barrault, M.-B.; Courbeyrette, R.; Guérois, R.; Marsolier-Kergoat, M.-C.; Peyroche, A. 20S Proteasome Assembly Is Orchestrated by Two Distinct Pairs of Chaperones in Yeast and in Mammals. Mol. Cell 2007, 27, 660–674. [Google Scholar] [CrossRef] [PubMed]
- Hirano, Y.; Hendil, K.B.; Yashiroda, H.; Iemura, S.; Nagane, R.; Hioki, Y.; Natsume, T.; Tanaka, K.; Murata, S. A Heterodimeric Complex That Promotes the Assembly of Mammalian 20S Proteasomes. Nature 2005, 437, 1381–1385. [Google Scholar] [CrossRef] [PubMed]
- Schnell, H.M.; Walsh, R.M.; Rawson, S.; Hanna, J. Chaperone-Mediated Assembly of the Proteasome Core Particle—Recent Developments and Structural Insights. J. Cell Sci. 2022, 135, jcs259622. [Google Scholar] [CrossRef] [PubMed]
- Lee, H.; Kim, S.; Lee, D. The Versatility of the Proteasome in Gene Expression and Silencing: Unraveling Proteolytic and Non-Proteolytic Functions. Biochim. Biophys. Acta (BBA)-Gene Regul. Mech. 2023, 1866, 194978. [Google Scholar] [CrossRef] [PubMed]
- Ebstein, F.; Küry, S.; Most, V.; Rosenfelt, C.; Scott-Boyer, M.-P.; van Woerden, G.M.; Besnard, T.; Papendorf, J.J.; Studencka-Turski, M.; Wang, T.; et al. PSMC3 Proteasome Subunit Variants Are Associated with Neurodevelopmental Delay and Type I Interferon Production. Sci. Transl. Med. 2023, 15, eabo3189. [Google Scholar] [CrossRef] [PubMed]
- Biallelic Variants in PSMB1 Encoding the Proteasome Subunit Β6 Cause Impairment of Proteasome Function, Microcephaly, Intellectual Disability, Developmental Delay and Short Stature|Human Molecular Genetics|Oxford Academic. Available online: https://academic.oup.com/hmg/article/29/7/1132/5775612 (accessed on 13 June 2025).
- Huang, H.; Rambaldi, I.; Daniels, E.; Featherstone, M. Expression of the Wdr9 Gene and Protein Products during Mouse Development. Dev. Dyn. 2003, 227, 608–614. [Google Scholar] [CrossRef] [PubMed]
- Rehman, A.U.; Morell, R.J.; Belyantseva, I.A.; Khan, S.Y.; Boger, E.T.; Shahzad, M.; Ahmed, Z.M.; Riazuddin, S.; Khan, S.N.; Riazuddin, S.; et al. Targeted Capture and Next-Generation Sequencing Identifies C9orf75, Encoding Taperin, as the Mutated Gene in Nonsyndromic Deafness DFNB79. Am. J. Hum. Genet. 2010, 86, 378–388. [Google Scholar] [CrossRef] [PubMed]
- Rouillard, A.D.; Gundersen, G.W.; Fernandez, N.F.; Wang, Z.; Monteiro, C.D.; McDermott, M.G.; Ma’ayan, A. The Harmonizome: A Collection of Processed Datasets Gathered to Serve and Mine Knowledge about Genes and Proteins. Database 2016, 2016, baw100. [Google Scholar] [CrossRef] [PubMed]
- Diamant, I.; Clarke, D.J.B.; Evangelista, J.E.; Lingam, N.; Ma’ayan, A. Harmonizome 3.0: Integrated Knowledge about Genes and Proteins from Diverse Multi-Omics Resources. Nucleic Acids Res. 2025, 53, D1016–D1028. [Google Scholar] [CrossRef] [PubMed]
- Schellenberg, M.J.; Lieberman, J.A.; Herrero-Ruiz, A.; Butler, L.R.; Williams, J.G.; Muñoz-Cabello, A.M.; Mueller, G.A.; London, R.E.; Cortés-Ledesma, F.; Williams, R.S. ZATT (ZNF451)-Mediated Resolution of Topoisomerase 2 DNA-Protein Cross-Links. Science 2017, 357, 1412–1416. [Google Scholar] [CrossRef] [PubMed]
- Cappadocia, L.; Pichler, A.; Lima, C.D. Structural Basis for Catalytic Activation by the Human ZNF451 SUMO E3 Ligase. Nat. Struct. Mol. Biol. 2015, 22, 968–975. [Google Scholar] [CrossRef] [PubMed]
- Karvonen, U.; Jääskeläinen, T.; Rytinki, M.; Kaikkonen, S.; Palvimo, J.J. ZNF451 Is a Novel PML Body- and SUMO-Associated Transcriptional Coregulator. J. Mol. Biol. 2008, 382, 585–600. [Google Scholar] [CrossRef] [PubMed]
- Zhang, Y.; Wang, W.; Min, J.; Liu, S.; Wang, Q.; Wang, Y.; Xiao, Y.; Li, X.; Zhou, Z.; Liu, S. ZNF451 Favors Triple-Negative Breast Cancer Progression by Enhancing SLUG-Mediated CCL5 Transcriptional Expression. Cell Rep. 2023, 42, 112654. [Google Scholar] [CrossRef] [PubMed]
- Gao, J.; Ao, Y.-Q.; Zhang, L.-X.; Deng, J.; Wang, S.; Wang, H.-K.; Jiang, J.-H.; Ding, J.-Y. Exosomal circZNF451 Restrains Anti-PD1 Treatment in Lung Adenocarcinoma via Polarizing Macrophages by Complexing with TRIM56 and FXR1. J. Exp. Clin. Cancer Res. 2022, 41, 295. [Google Scholar] [CrossRef] [PubMed]
- Zhang, Z.; Chen, H.; Lu, Y.; Feng, T.; Sun, W. LncRNA BC032020 Suppresses the Survival of Human Pancreatic Ductal Adenocarcinoma Cells by Targeting ZNF451. Int. J. Oncol. 2018, 52, 1224–1234. [Google Scholar] [CrossRef] [PubMed]
- Chen, Q.; Fang, J.; Shen, H.; Chen, L.; Shi, M.; Huang, X.; Miao, Z.; Gong, Y. Roles, Molecular Mechanisms, and Signaling Pathways of TMEMs in Neurological Diseases. Am. J. Transl. Res. 2021, 13, 13273–13297. [Google Scholar] [PubMed]
- Wang, Y.; Herzig, G.; Molano, C.; Liu, A. Differential Expression of the Tmem132 Family Genes in the Developing Mouse Nervous System. Gene Expr. Patterns 2022, 45, 119257. [Google Scholar] [CrossRef] [PubMed]
- Heinz, L.X.; Lee, J.; Kapoor, U.; Kartnig, F.; Sedlyarov, V.; Papakostas, K.; César-Razquin, A.; Essletzbichler, P.; Goldmann, U.; Stefanovic, A.; et al. TASL Is the SLC15A4-Associated Adaptor for IRF5 Activation by TLR7-9. Nature 2020, 581, 316–322. [Google Scholar] [CrossRef] [PubMed]
- Kobayashi, T.; Nguyen-Tien, D.; Ohshima, D.; Karyu, H.; Shimabukuro-Demoto, S.; Yoshida-Sugitani, R.; Toyama-Sorimachi, N. Human SLC15A4 Is Crucial for TLR-Mediated Type I Interferon Production and Mitochondrial Integrity. Int. Immunol. 2021, 33, 399–406. [Google Scholar] [CrossRef] [PubMed]
- Chen, X.; Xie, M.; Zhang, S.; Monguió-Tortajada, M.; Yin, J.; Liu, C.; Zhang, Y.; Delacrétaz, M.; Song, M.; Wang, Y.; et al. Structural Basis for Recruitment of TASL by SLC15A4 in Human Endolysosomal TLR Signaling. Nat. Commun. 2023, 14, 6627. [Google Scholar] [CrossRef] [PubMed]
- Takeuchi, F.; Ochiai, Y.; Serizawa, M.; Yanai, K.; Kuzuya, N.; Kajio, H.; Honjo, S.; Takeda, N.; Kaburagi, Y.; Yasuda, K.; et al. Search for Type 2 Diabetes Susceptibility Genes on Chromosomes 1q, 3q and 12q. J. Hum. Genet. 2008, 53, 314–324. [Google Scholar] [CrossRef] [PubMed]
- He, C.-F.; Liu, Y.-S.; Cheng, Y.-L.; Gao, J.-P.; Pan, T.-M.; Han, J.-W.; Quan, C.; Sun, L.-D.; Zheng, H.-F.; Zuo, X.-B.; et al. TNIP1, SLC15A4, ETS1, RasGRP3 and IKZF1 Are Associated with Clinical Features of Systemic Lupus Erythematosus in a Chinese Han Population. Lupus 2010, 19, 1181–1186. [Google Scholar] [CrossRef] [PubMed]
- Joo, Y.B.; Lim, J.; Tsao, B.P.; Nath, S.K.; Kim, K.; Bae, S.-C. Genetic Variants in Systemic Lupus Erythematosus Susceptibility Loci, XKR6 and GLT1D1 Are Associated with Childhood-Onset SLE in a Korean Cohort. Sci. Rep. 2018, 8, 9962. [Google Scholar] [CrossRef] [PubMed]
- Stockmann, L.; Kabbech, H.; Kremers, G.-J.; van Herk, B.; Dille, B.; van den Hout, M.; van IJcken, W.F.J.; Dekkers, D.H.W.; Demmers, J.A.A.; Smal, I.; et al. KIF2A Stabilizes Intercellular Bridge Microtubules to Maintain Mouse Embryonic Stem Cell Cytokinesis. J. Cell Biol. 2025, 224, e202409157. [Google Scholar] [CrossRef] [PubMed]
- Saji, T.; Endo, M.; Okada, Y.; Minami, Y.; Nishita, M. KIF1C Facilitates Retrograde Transport of Lysosomes through Hook3 and Dynein. Commun. Biol. 2024, 7, 1305. [Google Scholar] [CrossRef] [PubMed]
- Tian, R.; Kong, J.; Zang, H.; Li, S.; Liu, X.; Cheng, Y.; Ni, G.; Gong, L. Overexpression of KIF2C Amplifies Tamoxifen Resistance and Lung Metastasis of Breast Cancer through PLK1/C-Myc Pathway. Naunyn Schmiedebergs Arch. Pharmacol. 2025. [Google Scholar] [CrossRef] [PubMed]
- Yang, M.; Huang, H.; Zhang, Y.; Wang, Y.; Zhao, J.; Lee, P.; Ma, Y.; Qu, S. Identification and Validation of KIF20A for Predicting Prognosis and Treatment Outcomes in Patients with Breast Cancer. Sci. Rep. 2024, 14, 31543. [Google Scholar] [CrossRef] [PubMed]
- Yu, W.; Han, S.; Hu, S.; Ru, L.; Hua, C.; Xue, G.; Zhang, G.; Lv, K.; Ge, H.; Wang, M.; et al. KIF15 Promotes Human Glioblastoma Progression under the Synergistic Transactivation of REST and P300. Int. J. Biol. Sci. 2024, 20, 5127–5144. [Google Scholar] [CrossRef] [PubMed]
- Alliance of Genome Resources Consortium Updates to the Alliance of Genome Resources Central Infrastructure. Genetics 2024, 227, iyae049. [CrossRef] [PubMed]
- Do, C.; Lang, C.F.; Lin, J.; Darbary, H.; Krupska, I.; Gaba, A.; Petukhova, L.; Vonsattel, J.-P.; Gallagher, M.P.; Goland, R.S.; et al. Mechanisms and Disease Associations of Haplotype-Dependent Allele-Specific DNA Methylation. Am. J. Hum. Genet. 2016, 98, 934–955. [Google Scholar] [CrossRef] [PubMed]
- Ghanem, N.; Ip, C.K.M.; Tong, K.; Bakhtiari, M.; He, M.Y.; Schimmer, A.; Kridel, R. Drug Screens Identify New Therapeutic Targets That Synergize with EZH1/2 Inhibition in Adult T-Cell Leukemia/Lymphoma. Cancer Res. 2025, 85, 4498. [Google Scholar] [CrossRef]
- Sengupta, S.; Horowitz, P.M.; Karsten, S.L.; Jackson, G.R.; Geschwind, D.H.; Fu, Y.; Berry, R.W.; Binder, L.I. Degradation of Tau Protein by Puromycin-Sensitive Aminopeptidase in Vitro. Biochemistry 2006, 45, 15111–15119. [Google Scholar] [CrossRef] [PubMed]
- Kudo, L.C.; Parfenova, L.; Ren, G.; Vi, N.; Hui, M.; Ma, Z.; Lau, K.; Gray, M.; Bardag-Gorce, F.; Wiedau-Pazos, M.; et al. Puromycin-Sensitive Aminopeptidase (PSA/NPEPPS) Impedes Development of Neuropathology in hPSA/TAU(P301L) Double-Transgenic Mice. Hum. Mol. Genet. 2011, 20, 1820–1833. [Google Scholar] [CrossRef] [PubMed]
- García-Domínguez, M. Enkephalins and Pain Modulation: Mechanisms of Action and Therapeutic Perspectives. Biomolecules 2024, 14, 926. [Google Scholar] [CrossRef] [PubMed]


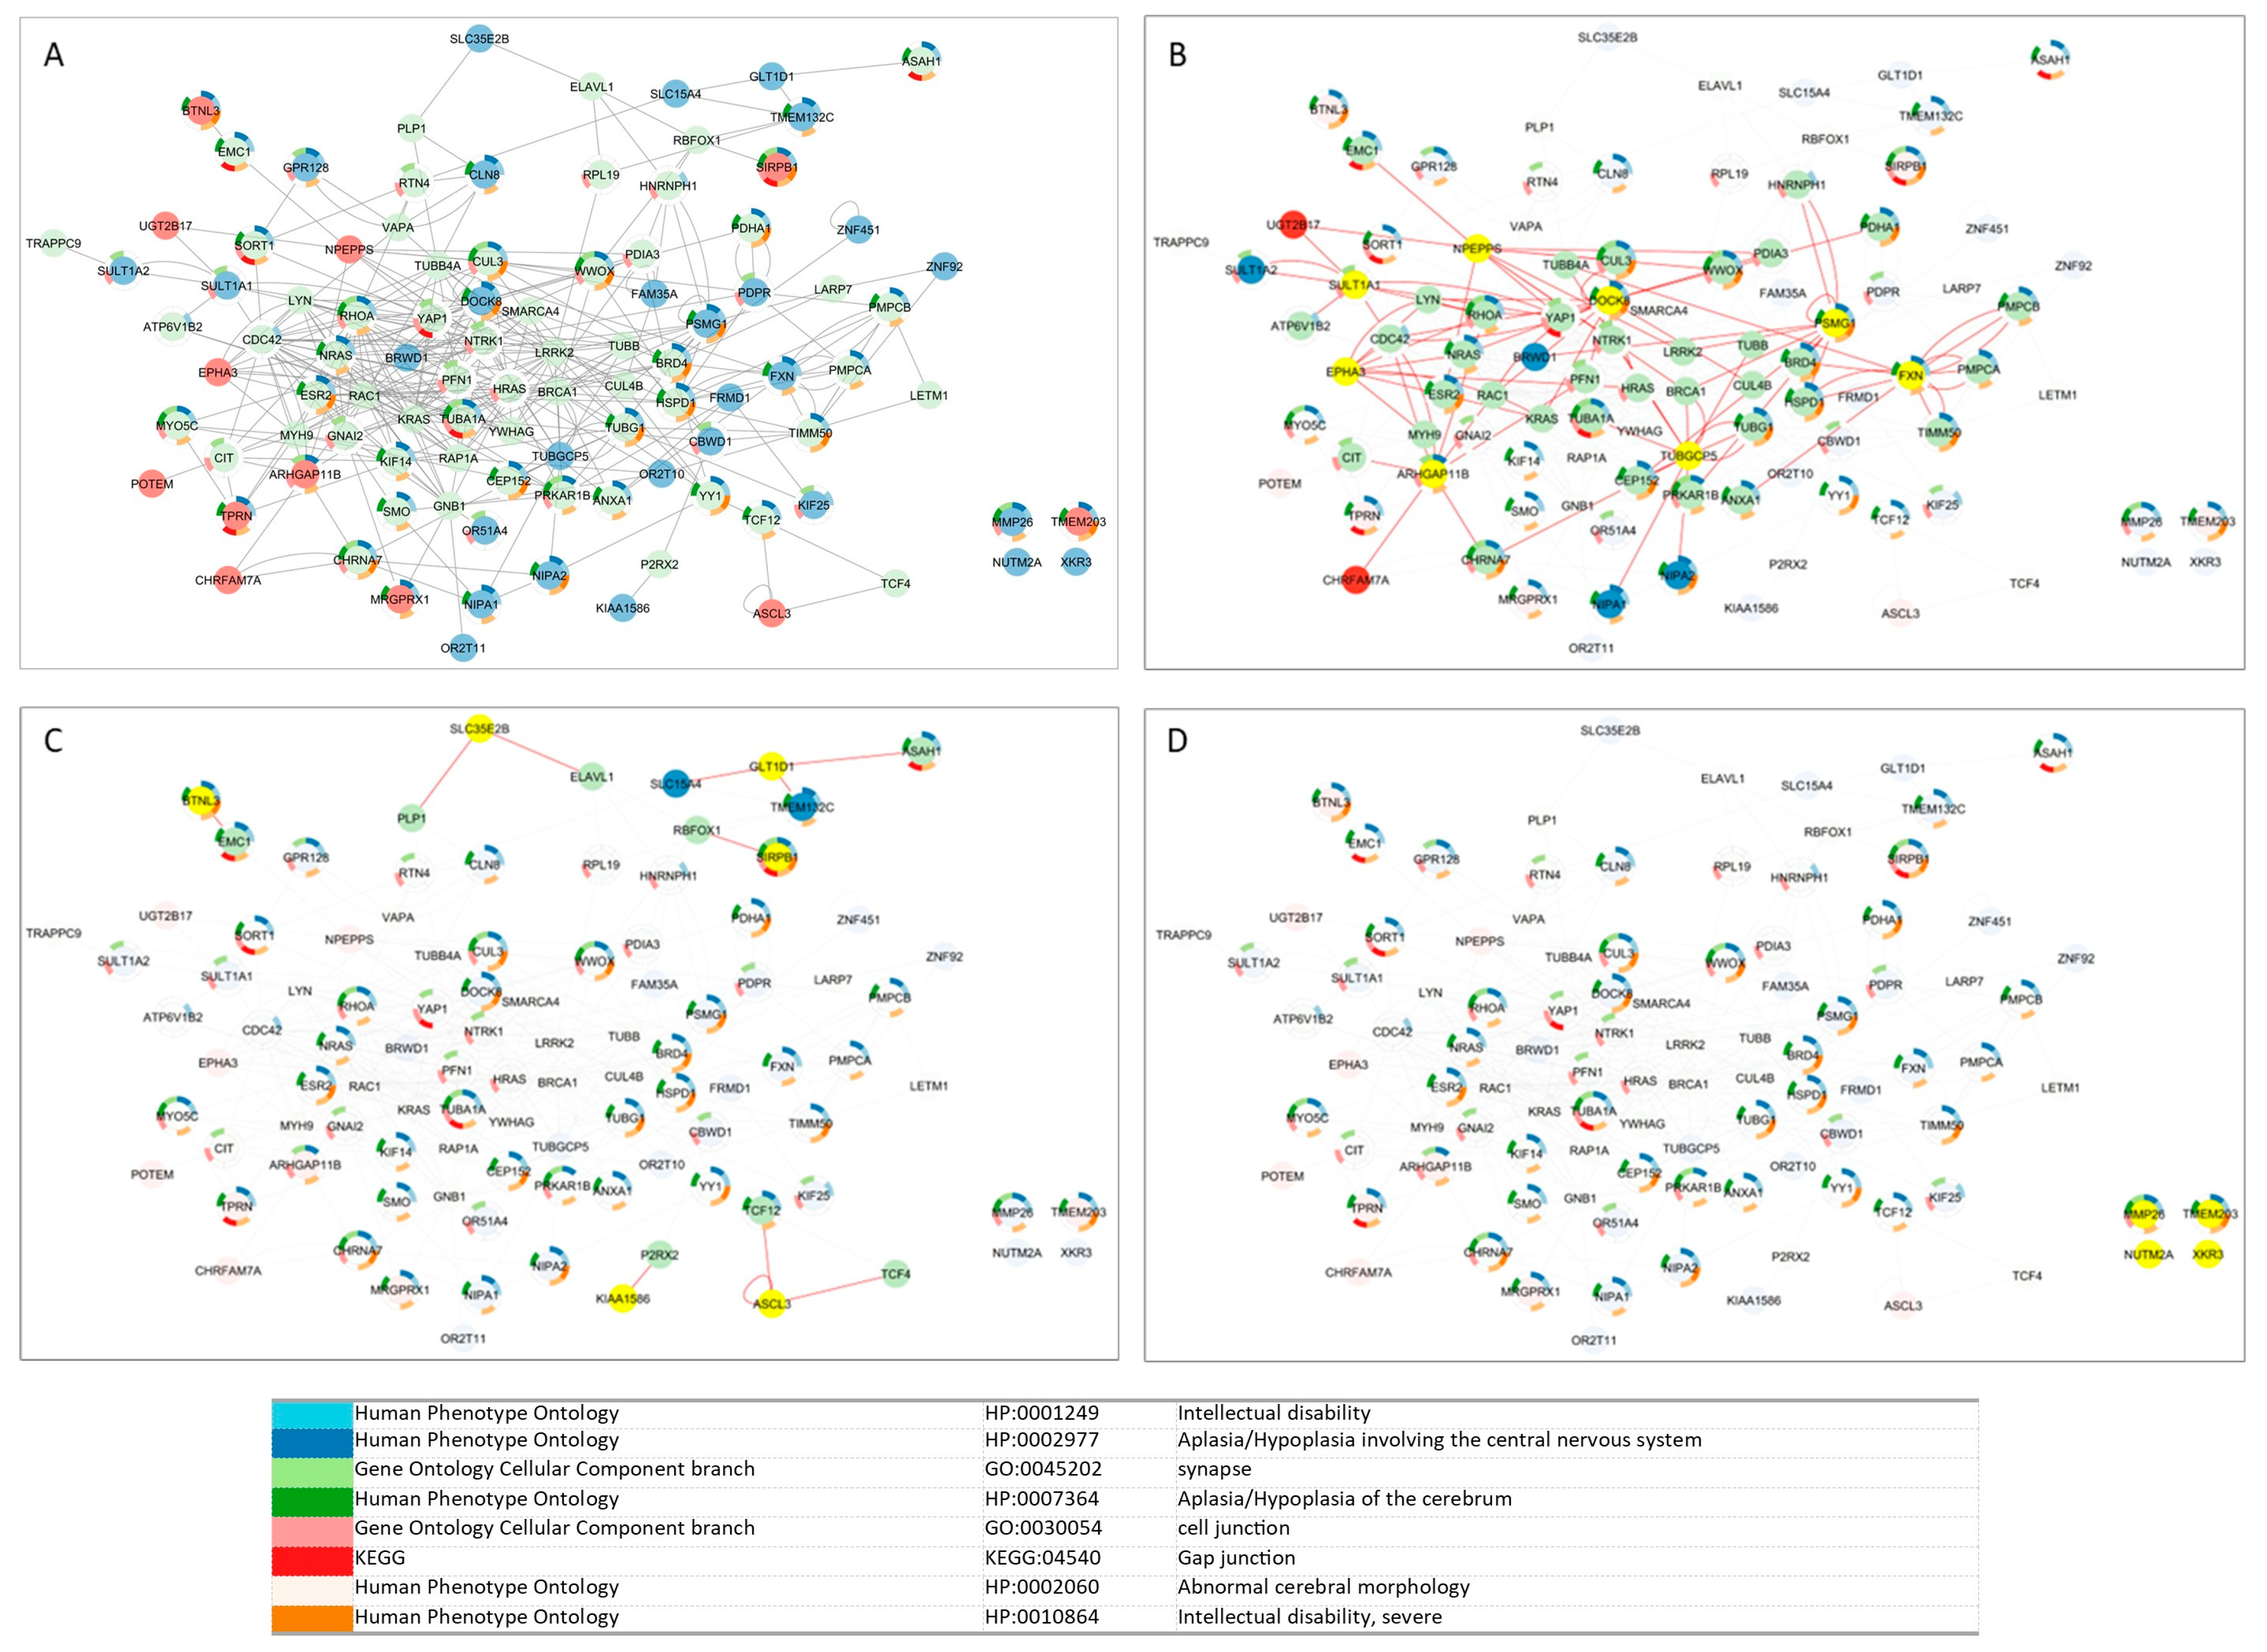
| Classification | Genes | Key Centrality Metrics | Functional Interpretation |
|---|---|---|---|
| High Proximity and Low Shortest Path (Highly Integrated) | NPEPPS, PSMG1, DOCK8, TUBGCP5, FXN, ARHGAP11B, SULT1A1, CBWD1, EPHA3 | ↑ Proximity, ↓ Shortest Path Length | Highly integrated; likely important in regulating complex cellular processes |
| Vulnerable/Less Integrated | KIAA1586, ASCL3, BTNL3, SIRPB1, GLT1D1 | ↓ Proximity, ↑ Shortest Path Length | Less connected, possibly more susceptible to dysfunction in NDD |
| Hubs | DOCK8, FXN, TUBGCP5, PSMG1, NPEPPS, ARHGAP11B, SULT1A1, CBWD1 | ↑ Degree, ↑ Betweenness | Central “hubs”; major regulators with broad impact if disrupted |
| Provincial Hubs | EPHA3, BRWD1, PDPR, CLN8, TPRN, SHLD2 | ↑ Degree, ↓ Betweenness | Locally interactive; may regulate tissue- or compartment-specific functions |
| Connector/Bottleneck Genes | SLC15A4, TMEM132C, GLT1D1, SULT1A2 (12q24.32q24.33—CNV gain in one patient) | ↓ Degree, ↑ Betweenness | Few connections, but essential for cross-network communication and signal integration |
| Category | Key Findings | Example |
|---|---|---|
| Gene Integration in Modules | 55 out of 56 genes integrated into at least one HumanBase functional module | — |
| Embryonic Modules (Largest Group) | Most genes found here (46) | NIPA1, SHANK3, OR2T10, OR2T11, OR51A4 |
| Astrocyte-Specific Modules | Fewer genes (33); despite this, highest number of unique GO terms (25) | GLUD1 (astrocyte-specific) |
| Module-Specific Localization | Some genes are enriched in only one module, indicating a highly specialized function | XKR3 (neuron-M2); OR2T10/11, OR51A4 (embryonic M5) |
| Prenatal Stage-Specificity | Overlap (40 genes) between fetal and embryonic modules, but also stage-exclusive genes | Embryonic-only: NIPA1, SHANK3 Fetal-only: GLT1D1, KIAA1586, TPRN |
| Postnatal Integration | Most genes present in multiple modules → broad roles; a few with unique module-specific localization → specialized functions | CDK11B, CLN8, DUSP22, CBWD1 (cortex); POTEM, ARHGAP11B (global) |
| Cell Type Specificity | 25 genes common across neuron, glia, and astrocyte modules → broad integration; others show distinct cell-type specificity | Neuron-specific: CDK11A, XKR3, SULT1A2 Glia: MRGPRX1, TFG, ARHGAP11B Astrocyte-only: GLUD1 |
| GO Term Enrichment (47 Modules) | 235 total GO terms, 123 unique terms | Neurogenesis (GO:0022008) in 8 modules |
| Most Unique GO Terms by Network | Astrocyte module (25 unique GO terms) > Neuron (10) > Embryo/Fetus/Global (8–9) > Glia, Cortex, CNS, Brain (few unique terms) | — |
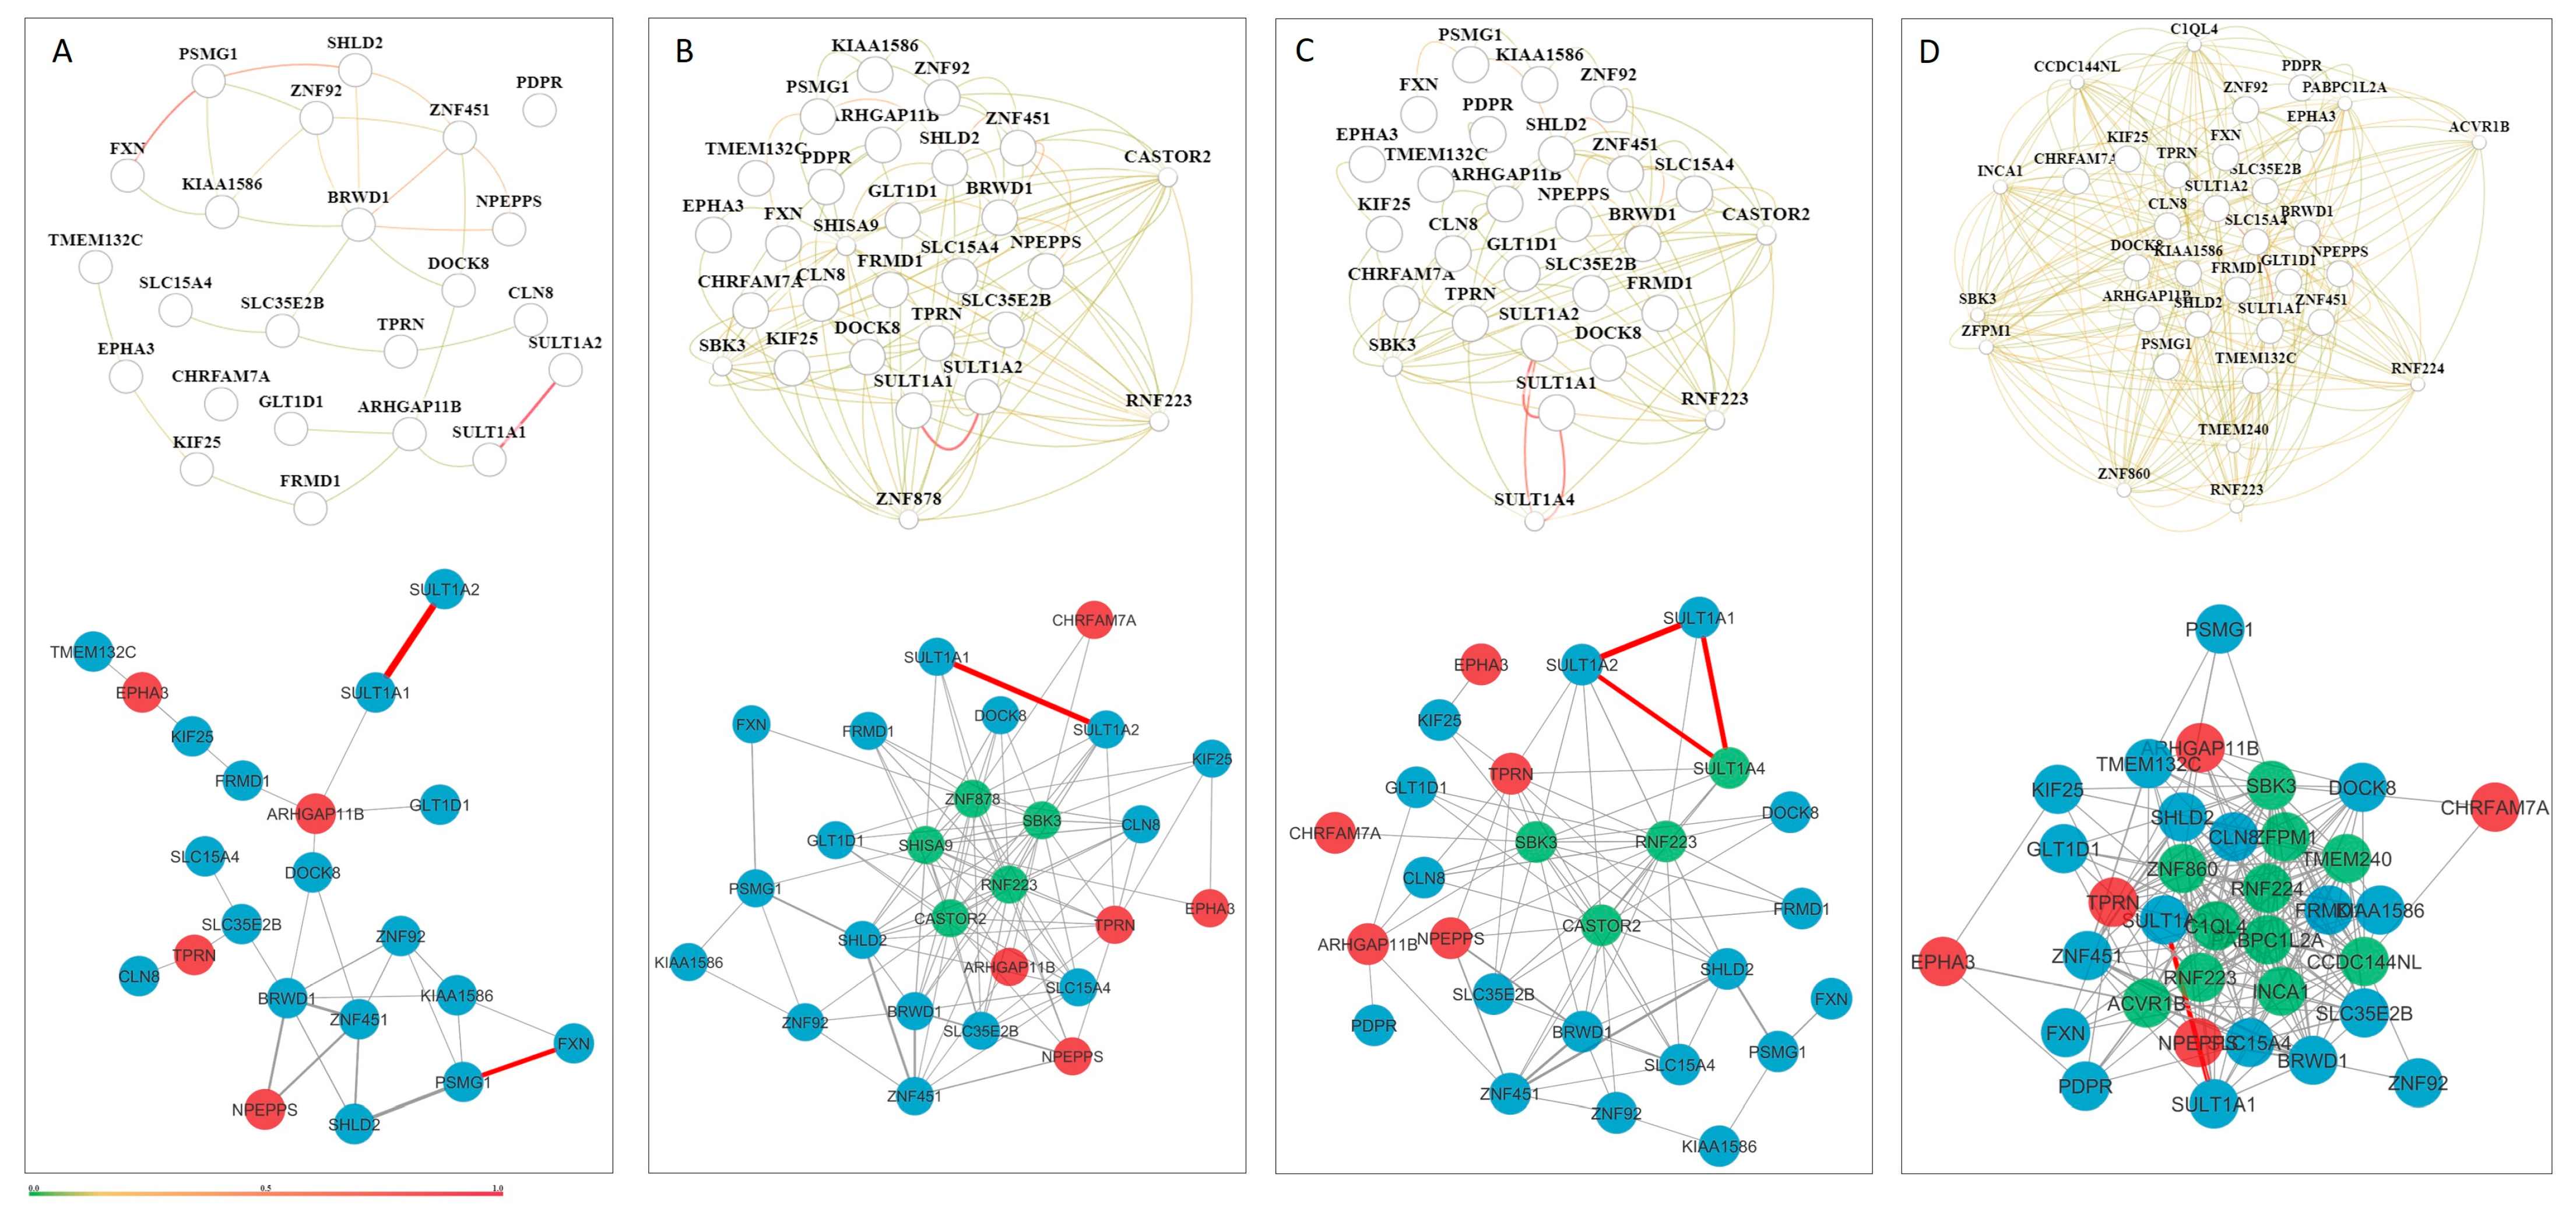
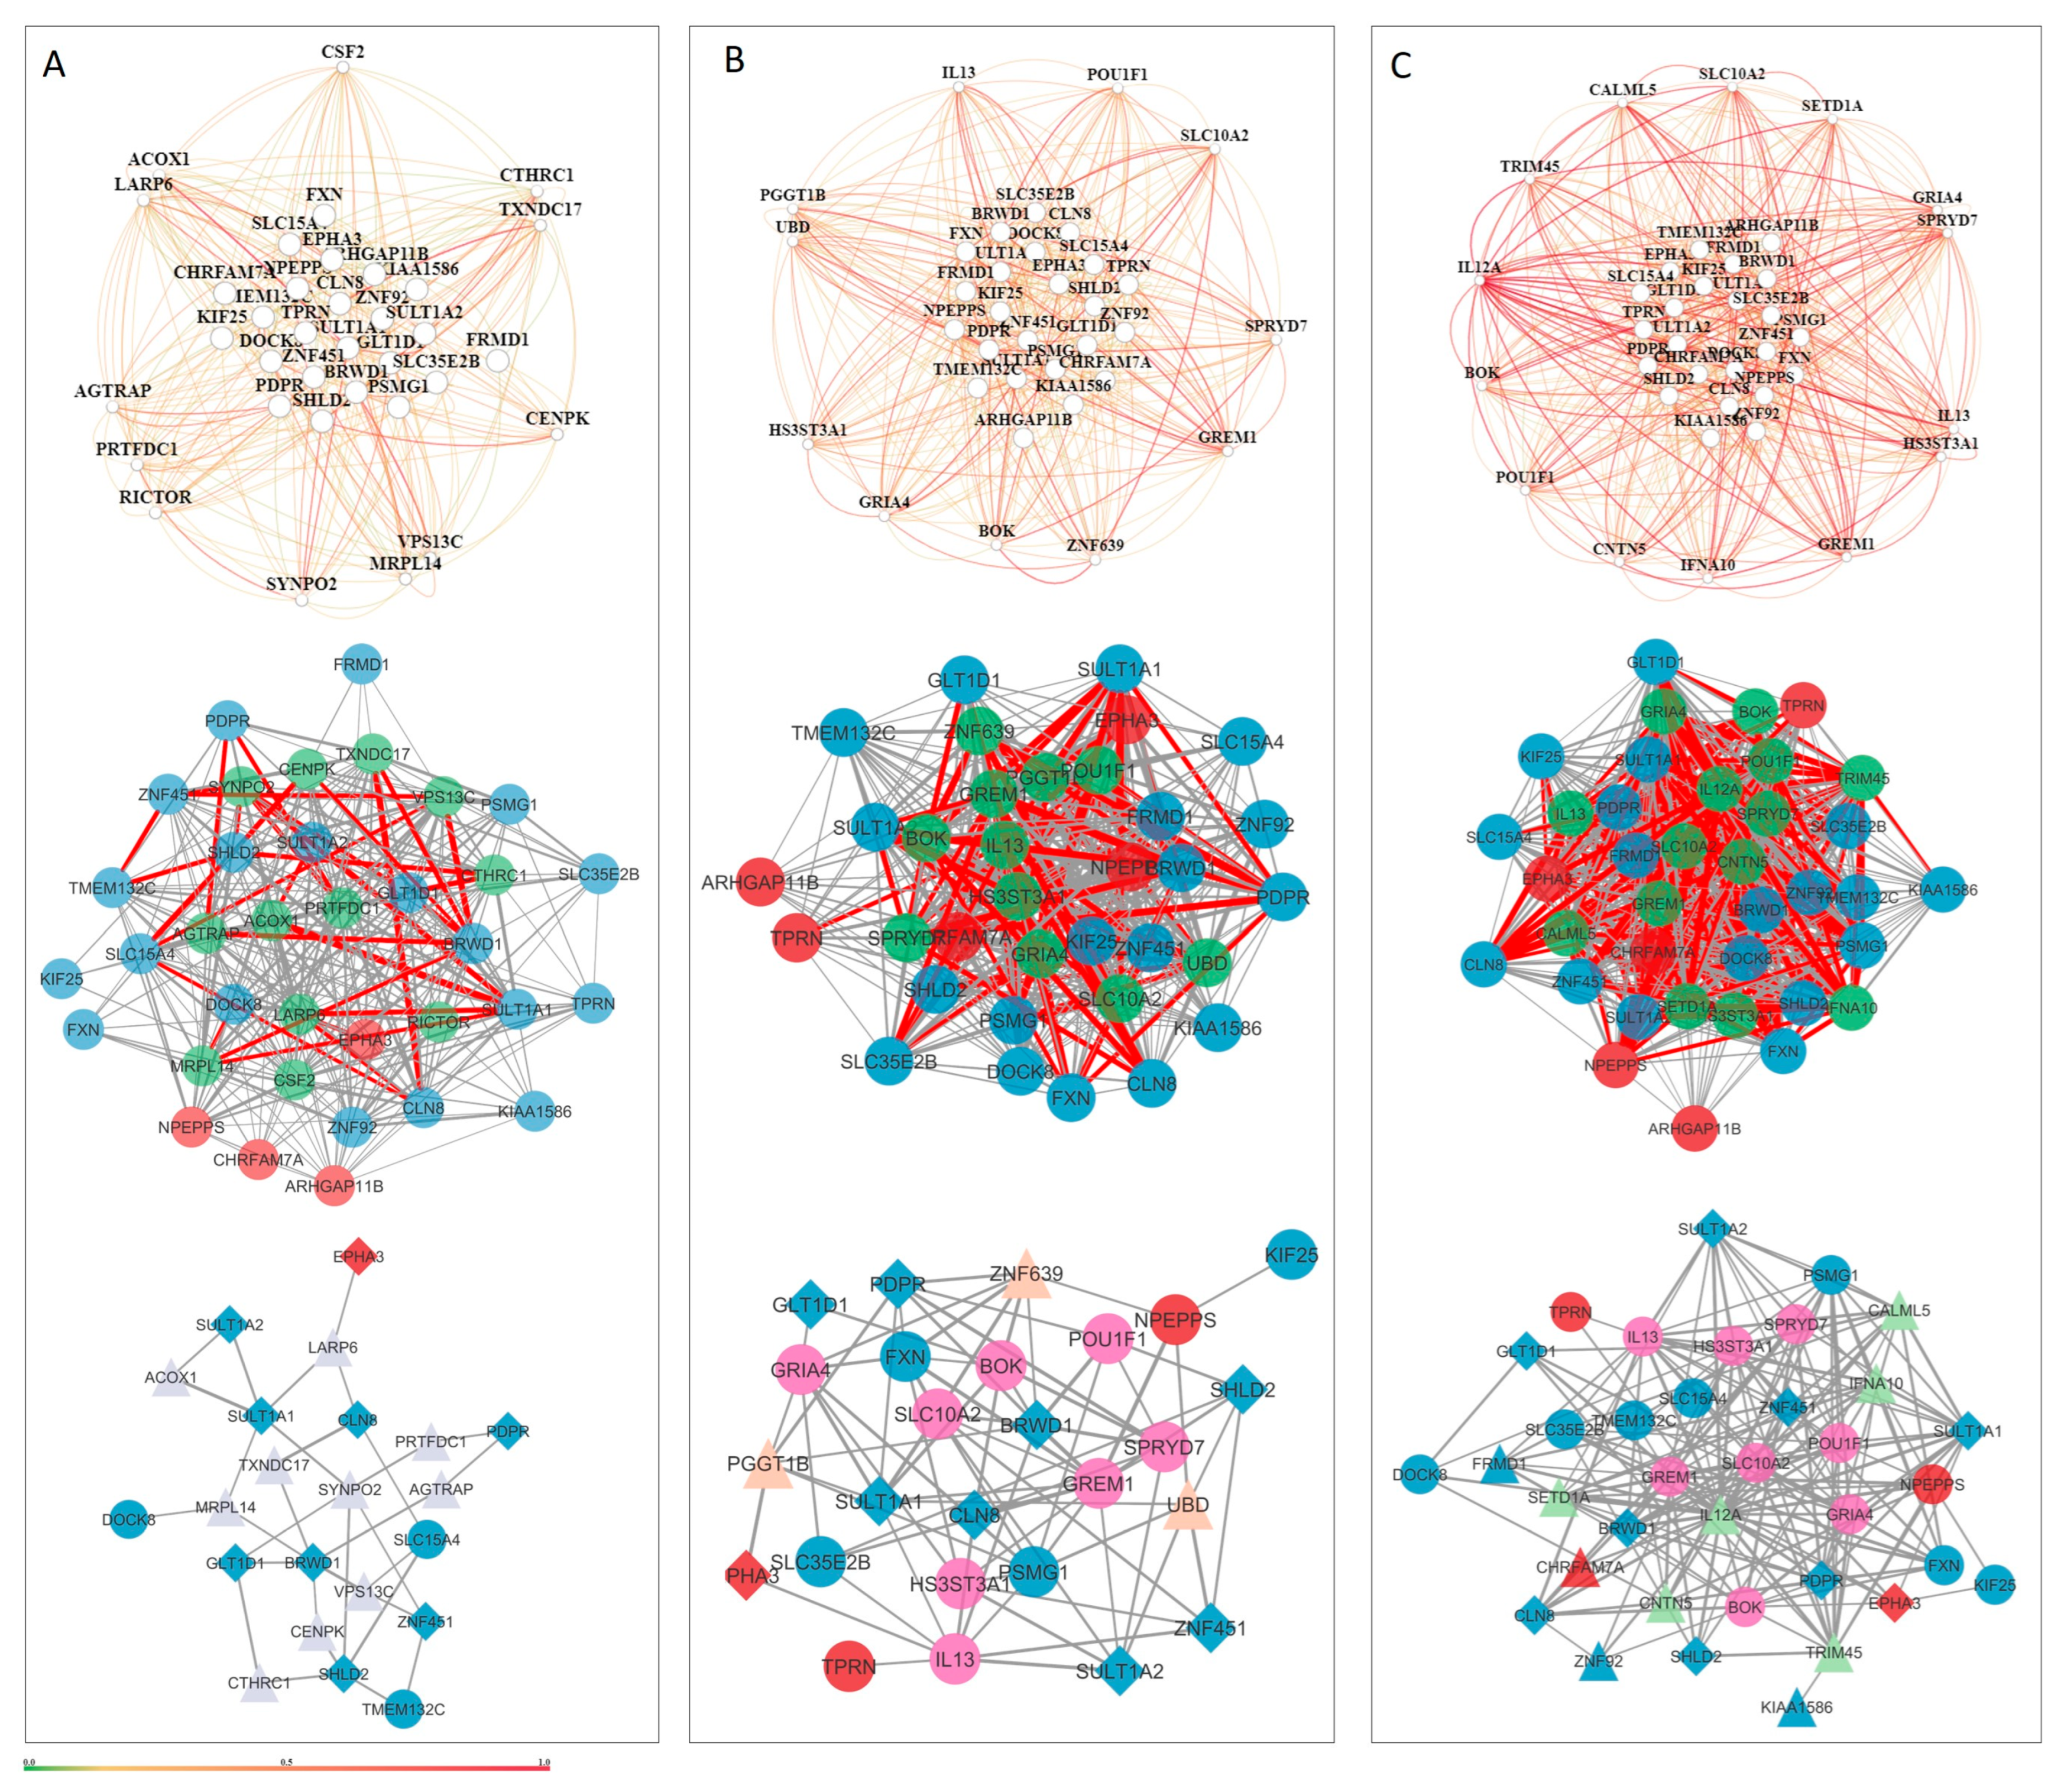
| Category | Key Findings | Example Genes |
|---|---|---|
| Prenatal Tissue Networks | Few stable interactions; co-functional gene relationships during early development may be transient/context-specific | SULT1A1, SULT1A2, SULT1A4 |
| Postnatal Tissue-Level Networks | Moderate and diffuse interactions across the cerebral cortex, CNS, and global brain | — |
| Neuronal Cell Network | 22 genes with 31 reliable interactions → moderate density | — |
| Glial Cell Network | Higher density: 26 genes, 77 interactions → underscores glial importance in NDDs | — |
| Astrocyte Cell Network | Most connected: 36 genes, 181 interactions; supports astrocyte role in synaptic pruning, inflammation, and homeostasis | GRIA4, BOK, ZNF92, FRMD1, KIAA1586, CHRFAM7A |
| Genes Present in All 3 Cell Networks | 9 genes shared across neuron, glia, and astrocyte networks → likely pleiotropic, with roles in circuit development and homeostasis | PDPR, CLN8, BRWD1, SHLD2, GLT1D1, SULT1A1, ZNF451, SULT1A2, EPHA3 |
| Candidate Gene | MANE Transcript | pHaplo | pTriplo | CNV Coordinates/hg38 | Total Genes (MANE) | Patient ID (Gender) | Neurodevelopmental Disorders | Comorbidity | Morphological Characteristics |
|---|---|---|---|---|---|---|---|---|---|
| PSMG1 | NM_003720.4 | 0.8 | 0.2 | chr21:39175476-39311721 | 2 | 10 (f) | epilepsy, undeveloped speech, intellectual disability, immobility, hypertonia, hypotrophy, cerebral atrophy | visual impairment (strabismus), malnutrition | microcephaly, low anterior hairline, facial characteristics (broad face, underdeveloped nasolabial fold), hypertelorism, ear characteristics (protruding underdeveloped ears, long low-set ears), nasal characteristics (short nose, high nasal bridge, short columnella, wide nasal base, concave nasal ridge), smooth philtrum, lip characteristics (absent Cupid’s Bow), high palate, dental disorder, short neck |
| BRWD1 | NM_033656.4 | 0.99 | 0.89 | ||||||
| TPRN | NM_001128228.3 | 0.46 | 0.94 | chr9:137198240-137204805 | 2 | 14 (m) | epilepsy, undeveloped speech, behavioral disorder (hyperactivity), intellectual disability | hydrocephalus, incontinence | brachycephaly, facial characteristics (long face), synophrys |
| ZNF92 | NM_152626.4 | 0.08 | 0.19 | chr7:65179912-65397799 | 1 | 18 (m) | epilepsy, intellectual disability | visual impairment (strabismus), scrotal hernia | facial characteristics (asymmetrical face), hypertelorism, ptosis, ear characteristics (protruding ears, underdeveloped antihelix, prominent antitragus, underdeveloped helix), anterior and posterior low hairline, short neck |
| FXN | NM_000144.5 | 0.2 | 0.19 | chr9:69049545-69251105 | 2 | 23 (f) | epilepsy, undeveloped speech, intellectual disability, cerebral atrophy | hirsutism, malnutrition | synophrys, underdeveloped ears, dental disorders, gingival hypertophy, microdontia |
| ZNF451 | NM_001031623.3 | 0.38 | 0.4 | chr6:57048100-57193732 | 4 | ||||
| TMEM132C | NM_001136103.3 | 0.99 | 0.13 | chr12:128677379-128877338 | 3 | 29 (m) | undeveloped speech, behavioral disorder (hyperactivity, auto agression, stereotypical movements), intellectual disability, hypotonia, hypotrophy | visual impairment, incontinence, cryptorchidism, malnutrition | prominent occiput, mycrocephaly, facial characteristics (cheekbone prominence, sunken cheeks, underdeveloped nasolabial fold), epicanthus, ptosis, nasal characteristics (convex and wide nasal ridge), lip characteristics (thin upper lip), posterior low hairline, alopecia areata |
| SLC15A4 | NM_145648.4 | 0.79 | 0.06 | ||||||
| GLT1D1 | NM_144669.3 | 0.82 | 0.03 | ||||||
| KIF25 | NM_030615.4 | 0.77 | 0.14 | chr6:167938073-168069661 | 3 | 30 (m) | behavioral disorder (stereotypical movements, hyperactivity), ASD | ||
| FRMD1 | NM_024919.6 | 0.79 | 0.91 | ||||||
| NPEPPS | NM_006310.4 | 0.86 | 0.85 | chr17:47581475-47597364 | 1 | 37 (m) | epilepsy, undeveloped speech, behavioral disorder (sleep disorder, stereotypical movements, hyperactivity), intellectual disability, immobility | incontinence, gastroesophageal reflux disease, hiatal hernia, phimosis, obstipation | facial characteristics (underdeveloped nasolabial folds), horizontal eyebrows |
| Case | Gene | CNV Type | Function | Brain Expression/Network Role | Disease Associations |
|---|---|---|---|---|---|
| 10 | PSMG1 | Gain | Proteasome assembly chaperone; forms heterodimer with PSMG2; interacts with PSMA5/PSMA7 [30,31,32]; regulates gene expression via proteasome [33] | Central hub in interactome; broadly expressed in brain with slight decline in fetal → mid stages | Not directly linked to NDDs, but related proteasome genes (PSMB1, PSMC3) linked to autism, delays, microcephaly [34,35] |
| BRWD1 | Transcription regulator; chromatin remodeling [36]; regulates morphology and cytoskeleton (BRWD1_HUMAN, Q9NSI6) | Provincial hub; expressed in neuronal, glial, astrocyte networks; synaptic expression profile | Increased brain expression; pTriplo = 0.89; no CNV in DGV | ||
| 14 | TPRN | Loss | Sensory epithelial protein; linked to non-syndromic deafness [37]; involved in CNS myelination [38] and axon sheathing [39] | Cell-type-specific to oligodendrocytes; fetal network; provincial hub | No CNV in DGV; functionally linked to oligodendrocyte-specific expression |
| 18 | ZNF92 | Gain | DNA-binding transcription factor; Pol II-specific; cis-regulatory binding (Alliance of Genome Resources, Jun 2025); nuclear localization (Mar 2025) | Astrocyte-specific expression; high prenatal expression sharply declines postnatally | No CNV in DGV; candidate for astrocyte-linked transcriptional regulation |
| 23 | ZNF451 | Gain | SUMO ligase; transcriptional co-repressor; involved in DNA repair via TDP2/TOP2 complex resolution [40,41]; transcriptional regulation via SUMOylation [42]; affects cancer therapy resistance [43,44,45] | Dynamically expressed across brain; enriched in late spermatids, oligodendrocytes | Linked to cancer progression; potential NDD relevance via expression and repair pathways |
| 29 | TMEM132C | Gain | Poorly characterized TMEM; linked to brain tumors, psychiatric disorders, lissencephaly, etc. [46]; expressed in early neural precursors [47] | Expressed in oligodendrocytes, precursors, inhibitory neurons, microglia; connector/bottleneck gene | Candidate for CNS development role; warrants further study |
| SLC15A4 | Endolysosomal proton-coupled transporter; histidine/dipeptide transport [48,49,50]; immune signaling [51]; linked to autoimmune disease [52] | Expressed in dendritic cells; high embryonic expression; connector/bottleneck gene | Linked to innate immunity | ||
| GLT1D1 | Putative glycosyltransferase; may aid in immune regulation/tumor evasion [53] | Enriched in neurons, dendritic cells, cone photoreceptors; low prenatal, increasing postnatally; connector gene | Expressed in bone marrow, choroid plexus, liver | ||
| 30 | KIF25 | Gain | Kinesin motor protein; centrosome cohesion; mitosis, lysosomal transport [54,55]; involved in non-apoptotic cell death; linked to cancer [56,57,58] | Neuronal-specific expression; enriched in brain and retina | Role in cell division and organization; candidate for ASD based on expression |
| FRMD1 | Regulates Hippo signaling [59]; allele-specific methylation in immune cells [60]; linked to T-cell leukemia [61] | Not brain-specific | Immune regulation role; pTriplo = 0.91 | ||
| 37 | NPEPPS | Loss | Encodes aminopeptidase; degrades enkephalins in brain [62,63]; involved in neurotransmission/pain modulation [64] | Highly expressed in brain throughout lifespan; well-connected in interactome | Strong CNV deletion candidate (pHaplo = 0.86); implicated in NDD with epilepsy |
Disclaimer/Publisher’s Note: The statements, opinions and data contained in all publications are solely those of the individual author(s) and contributor(s) and not of MDPI and/or the editor(s). MDPI and/or the editor(s) disclaim responsibility for any injury to people or property resulting from any ideas, methods, instructions or products referred to in the content. |
© 2025 by the authors. Licensee MDPI, Basel, Switzerland. This article is an open access article distributed under the terms and conditions of the Creative Commons Attribution (CC BY) license (https://creativecommons.org/licenses/by/4.0/).
Share and Cite
Rincic, M.; Brecevic, L.; Liehr, T.; Gotovac Jercic, K.; Doder, I.; Borovecki, F. Customized Chromosomal Microarrays for Neurodevelopmental Disorders. Genes 2025, 16, 868. https://doi.org/10.3390/genes16080868
Rincic M, Brecevic L, Liehr T, Gotovac Jercic K, Doder I, Borovecki F. Customized Chromosomal Microarrays for Neurodevelopmental Disorders. Genes. 2025; 16(8):868. https://doi.org/10.3390/genes16080868
Chicago/Turabian StyleRincic, Martina, Lukrecija Brecevic, Thomas Liehr, Kristina Gotovac Jercic, Ines Doder, and Fran Borovecki. 2025. "Customized Chromosomal Microarrays for Neurodevelopmental Disorders" Genes 16, no. 8: 868. https://doi.org/10.3390/genes16080868
APA StyleRincic, M., Brecevic, L., Liehr, T., Gotovac Jercic, K., Doder, I., & Borovecki, F. (2025). Customized Chromosomal Microarrays for Neurodevelopmental Disorders. Genes, 16(8), 868. https://doi.org/10.3390/genes16080868