Article

Transcriptomic Profiling Reveals Gene Expression Changes in Mouse Liver Tissue During Alveolar Echinococcosis

1
Department of Laboratory Medicine, School of Medicine, Jiangsu University, 301 Xuefu Road, Zhenjiang 212013, China
2
Qinghai Institute of Endemic Disease Prevention and Control, Xining 811602, China
*
Authors to whom correspondence should be addressed.
Genes 2025, 16(7), 839; https://doi.org/10.3390/genes16070839
Submission received: 10 June 2025 / Revised: 10 July 2025 / Accepted: 17 July 2025 / Published: 18 July 2025

Abstract

Background/Objectives: Alveolar echinococcosis (AE), caused by Echinococcus multilocularis larvae, poses a significant global health concern. Primarily affecting regions in the northern hemisphere, such as northwest China, which are vital for animal husbandry, it often results in severe hepatic impairment in the host. However, there remains a dearth of knowledge concerning changes in gene expression profiles during the progression of AE. In this study, we employed transcriptome sequencing (RNA sequencing, RNA-Seq) to detect alterations in gene expression profiles in the liver tissues of mice with AE. Our aims were to understand the transcriptome differences in the liver during E. multilocularis infection and to explore the molecular mechanisms underlying the early progression of this disease. Methods: We established a mouse model of AE by intraperitoneally injecting protoscoleces of E. multilocularis. All the inoculated mice were randomly divided into four groups. Liver tissues were collected at 6, 12, 19, and 25 weeks after inoculation. Paired non-infected mouse-derived liver tissues were used as controls, and transcriptome sequencing was carried out. Results: A total of 629 differentially expressed genes (DEGs) were identified. Among them, 370 genes were upregulated and 259 genes were downregulated. Moreover, Gene Ontology (GO) and Kyoto Encyclopedia of Genes and Genomes (KEGG) enrichment analyses indicated that these DEGs were significantly associated with immune system modulation, the cell cycle, and the fibrosis process during the pathological changes. Additionally, weighted gene co-expression network analysis (WGCNA) identified several genes, including CCNA2, BIRC5, KIF2C, OTC, TLR2, and NCKAP1L. These hub genes involved in immunoinflammatory processes may be related to E. multilocularis larvae infection. Conclusions: The findings of this research provide a theoretical foundation for a more in-depth understanding of the molecular mechanisms of AE. They offer valuable insights into the molecular mechanisms and potential key factors involved in the pathogenesis of this disease.

1. Introduction

Alveolar echinococcosis (AE), a parasitic disease instigated by the larvae of the tapeworm E. multilocularis, poses a substantial health risk, as it primarily affects the liver and lungs of both humans and animals [1]. The disease is characterized by a prolonged incubation period, typically spanning from 1 to 5 years, with the majority of cases occurring in individuals aged 20 to 40 years. Approximately 95% of primary lesions are situated in the liver, presenting with a proliferative growth pattern characterized by external budding and distant metastasis, closely resembling liver cancer and commonly referred to as “parasitic cancer” [2,3]. Given its long-standing and severe consequences, diagnosing AE often takes decades, and during this time, the prospects of survival or cure are quite slim [4]. E. multilocularis invades and proliferates aggressively within the hepatic tissues, perpetually generating new cysts and eroding adjacent structures [5]. As a result, liver damage and lesions frequently compromise hepatocyte function [6].
Transcriptomics, as a cutting-edge technology, has found wide-ranging applications in modern biological research. Currently, it is extensively employed in basic research on microorganisms and plants, clinical diagnostics, and drug development [7,8]. RNA sequencing (RNA-Seq) has been utilized in the biological analysis of AE infection in liver and peripheral blood. Mouse experimental models are highly relevant to the pathogenesis of AE in humans. This is because rodents are the natural intermediate hosts of E. multilocularis. Therefore, identifying the transcriptional responses associated with experimental AE can establish a crucial research basis for elucidating the pathogenesis of AE and proposing innovative intervention strategies.
In this study, we successfully developed a mouse model infected with AE to systematically examine the gene expression profiles in liver tissues. We employed RNA-Seq technology at specific time points to comprehensively capture the dynamic changes in gene expression. Following the RNA-Seq analysis, we carried out quantitative real-time polymerase chain reaction (qRT-PCR) as a rigorous validation step for the results from the RNA-Seq experiment. To gain profound insights into the biological functions of differentially expressed genes (DEGs) in the disease development process, we performed Gene Ontology (GO) and Kyoto Encyclopedia of Genes and Genomes (KEGG) enrichment analyses. These sophisticated bioinformatics tools allowed us to map the DEGs to specific biological processes, molecular functions, and signaling pathways, thus shedding light on the underlying biological mechanisms driving the progression of AE. Furthermore, we utilized weighted gene co-expression network analysis (WGCNA) to identify genes that potentially play crucial roles in the infection caused by E. multilocularis larvae and its temporal progression. By constructing gene co-expression networks, we aimed to uncover the complex interplay between genes and identify key regulatory nodes that drive the development of alveolar echinococcosis.

2. Materials and Methods

2.1. Parasites and Experimental Animals

The E. multilocularis larvae were obtained from long-clawed mole voles bred in our laboratory for research purposes. A total of 80 six-week-old specific pathogen-free (SPF)-grade female mice were purchased from Spiff (Beijing, China) Biotechnology Co., Ltd. To ensure ethical compliance, this study received approval from the Animal Ethics Committee of the Qinghai Institute for Endemic Disease Control and Prevention (Approval No.: QDB2021-0007). All animal experiments were conducted in strict accordance with the guidelines for animal welfare.

2.2. Establishment of Alveolar Echinococcosis Infected Mouse Model

Long-clawed mole voles exhibiting visibly enlarged abdomens due to E. multilocularis infection were euthanized via cervical dislocation. Multilocular cystic tissue, appearing transparent and clustered in the abdominal cavity, was extracted, minced, ground, filtered, washed, and centrifuged in PBS buffer. The obtained suspension was transferred into a sterile culture dish and carefully rinsed, and the protoscoleces were separated. Subsequently, the 0.1% methylene blue staining method was employed to assess their viability, ensuring that it exceeded 90%. The protoscoleces were further washed with PBS containing 800 U/mL penicillin–streptomycin and prepared as a suspension. A total of 80 clean-grade female Kunming mice, aged 6 weeks, were procured. These mice were allowed a one-week acclimation period in the experimental environment. After acclimation, they were randomly allocated into experimental and control groups. In the experimental group, each mouse was intraperitoneally injected with 0.3 mL of protoscolex suspension (approximately 1000 protoscoleces) using disposable sterile syringes. In contrast, control group mice received an equal volume of PBS buffer. The number of mice taken for analysis from each of the two groups at 4 time points was 32 (infected = 16, non-infected = 16). All mice were housed under standard conditions with free access to water and food.

2.3. Collection and HE Staining of Liver Tissue

At 6, 12, 19, and 25 weeks post-infection with protoscoleces, all experimental and control groups were euthanized via cervical dislocation and subsequently dissected. Liver tissue samples were collected from regions within 1–5 mm of macroscopically visible parasitic lesions, rinsed in a 10% EDTA solution, transferred into cryovials, flash-frozen in liquid nitrogen, and stored at −80 °C for downstream analyses.
In parallel, liver tissues were fixed in 4% formaldehyde solution, dehydrated, and embedded in paraffin for sectioning. Following hematoxylin-and-eosin (HE) staining, pathological changes in the liver tissues were assessed under light microscopy.

2.4. RNA-Seq

Liver samples (≈2 g) were collected from perilesional areas (1–5 mm from macroscopic lesions) and processed for RNA-Seq. The cDNA libraries were sequenced on the Illumina sequencing platform by Metware Biotechnology Co., Ltd. (Wuhan, China). Briefly, total RNA from the liver tissues was extracted using Trizol reagent. The quality of RNA was checked using an Agilent 2100 Bioanalyzer. RNA samples that passed the quality check were used to construct libraries using the NEBNext® UltraTM RNA Library Prep Kit from Illumina. mRNA with poly(A) tails was enriched using oligo(dT) magnetic beads, followed by RNA fragmentation using NEB Fragmentation Buffer. cDNA was synthesized, purified, and quantified using qRT-PCR (library effective concentration > 2 nM) before library inspection. After passing the library inspection, different libraries were pooled based on the desired target data volume. Sequencing was performed on the Illumina platform to generate 150 bp paired-end raw data. The control and experimental groups at each specified time point (6, 12, 19, and 25 weeks) comprised four biological replicates, designated as follows: control1-(1–4), Treat1-(1–4), control2-(1–4), Treat2-(1–4), control3-(1–4), Treat3-(1–4), control4-(1–4), and Treat4-(1–4).

2.5. Differentially Expressed Gene (DEG) Analysis

The DESeq2 software package [9,10,11] was employed to conduct differential expression analysis between the various sample groups, aiming to identify a subset of DEGs between the two biological conditions. The false discovery rate (FDR) was computed using the Benjamini–Hochberg method to adjust the p-values of the hypothesis tests. Criteria for selecting DEGs were set as |log2Fold Change| ≥ 1 and FDR < 0.05.

2.6. Gene Ontology (GO) Annotation and KEGG Pathway Enrichment Analysis

With a significance threshold set at q < 0.05, TBtoolsp [12,13] software was utilized to conduct GO annotation and KEGG pathway enrichment analysis on the DEGs.

2.7. Weighted Coexpression Network Analysis (WGCNA)

The gene co-expression network was constructed using the R version 4.2.2 software WGCNA 1.71 package [14]. The gene expression table was imported into the R language package and partitioned into distinct modules through clustering. Correlation coefficients with the sample or sample properties were calculated using modular eigenvalues. The in-module connectivity of each gene was computed, with genes displaying high connectivity likely representing core genes with potentially significant functions. Protein–protein interaction (PPI) network analysis was performed in the STRING database, and the data were imported into Cytoscape (v3.9.1) software. Key genes were obtained by applying the degree algorithm of the Cytohubba plugin.

2.8. qRT-PCR Analysis

Tissue RNA was isolated using a Total RNA Extraction kit (Beijing Solaibao Biotechnology Co., Ltd., Beijing, China) and transcribed into cDNA utilizing a cDNA reverse transcription kit (Shanghai Yisheng Biotechnology Co., Ltd., Shanghai, China) according to the manufacturers’ protocols. The resultant cDNA was subsequently amplified using a qPCR SYBR Green Kit (Shanghai Yisheng Biotechnology Co., Ltd.) in a thermocycler (Bio-Rad Laboratories, Inc., Hercules, CA, USA). GAPDH was used as the internal reference, and the relative gene expression level was evaluated by the 2−ΔΔCt method. The primer sequence information is shown in Table S1.

3. Results

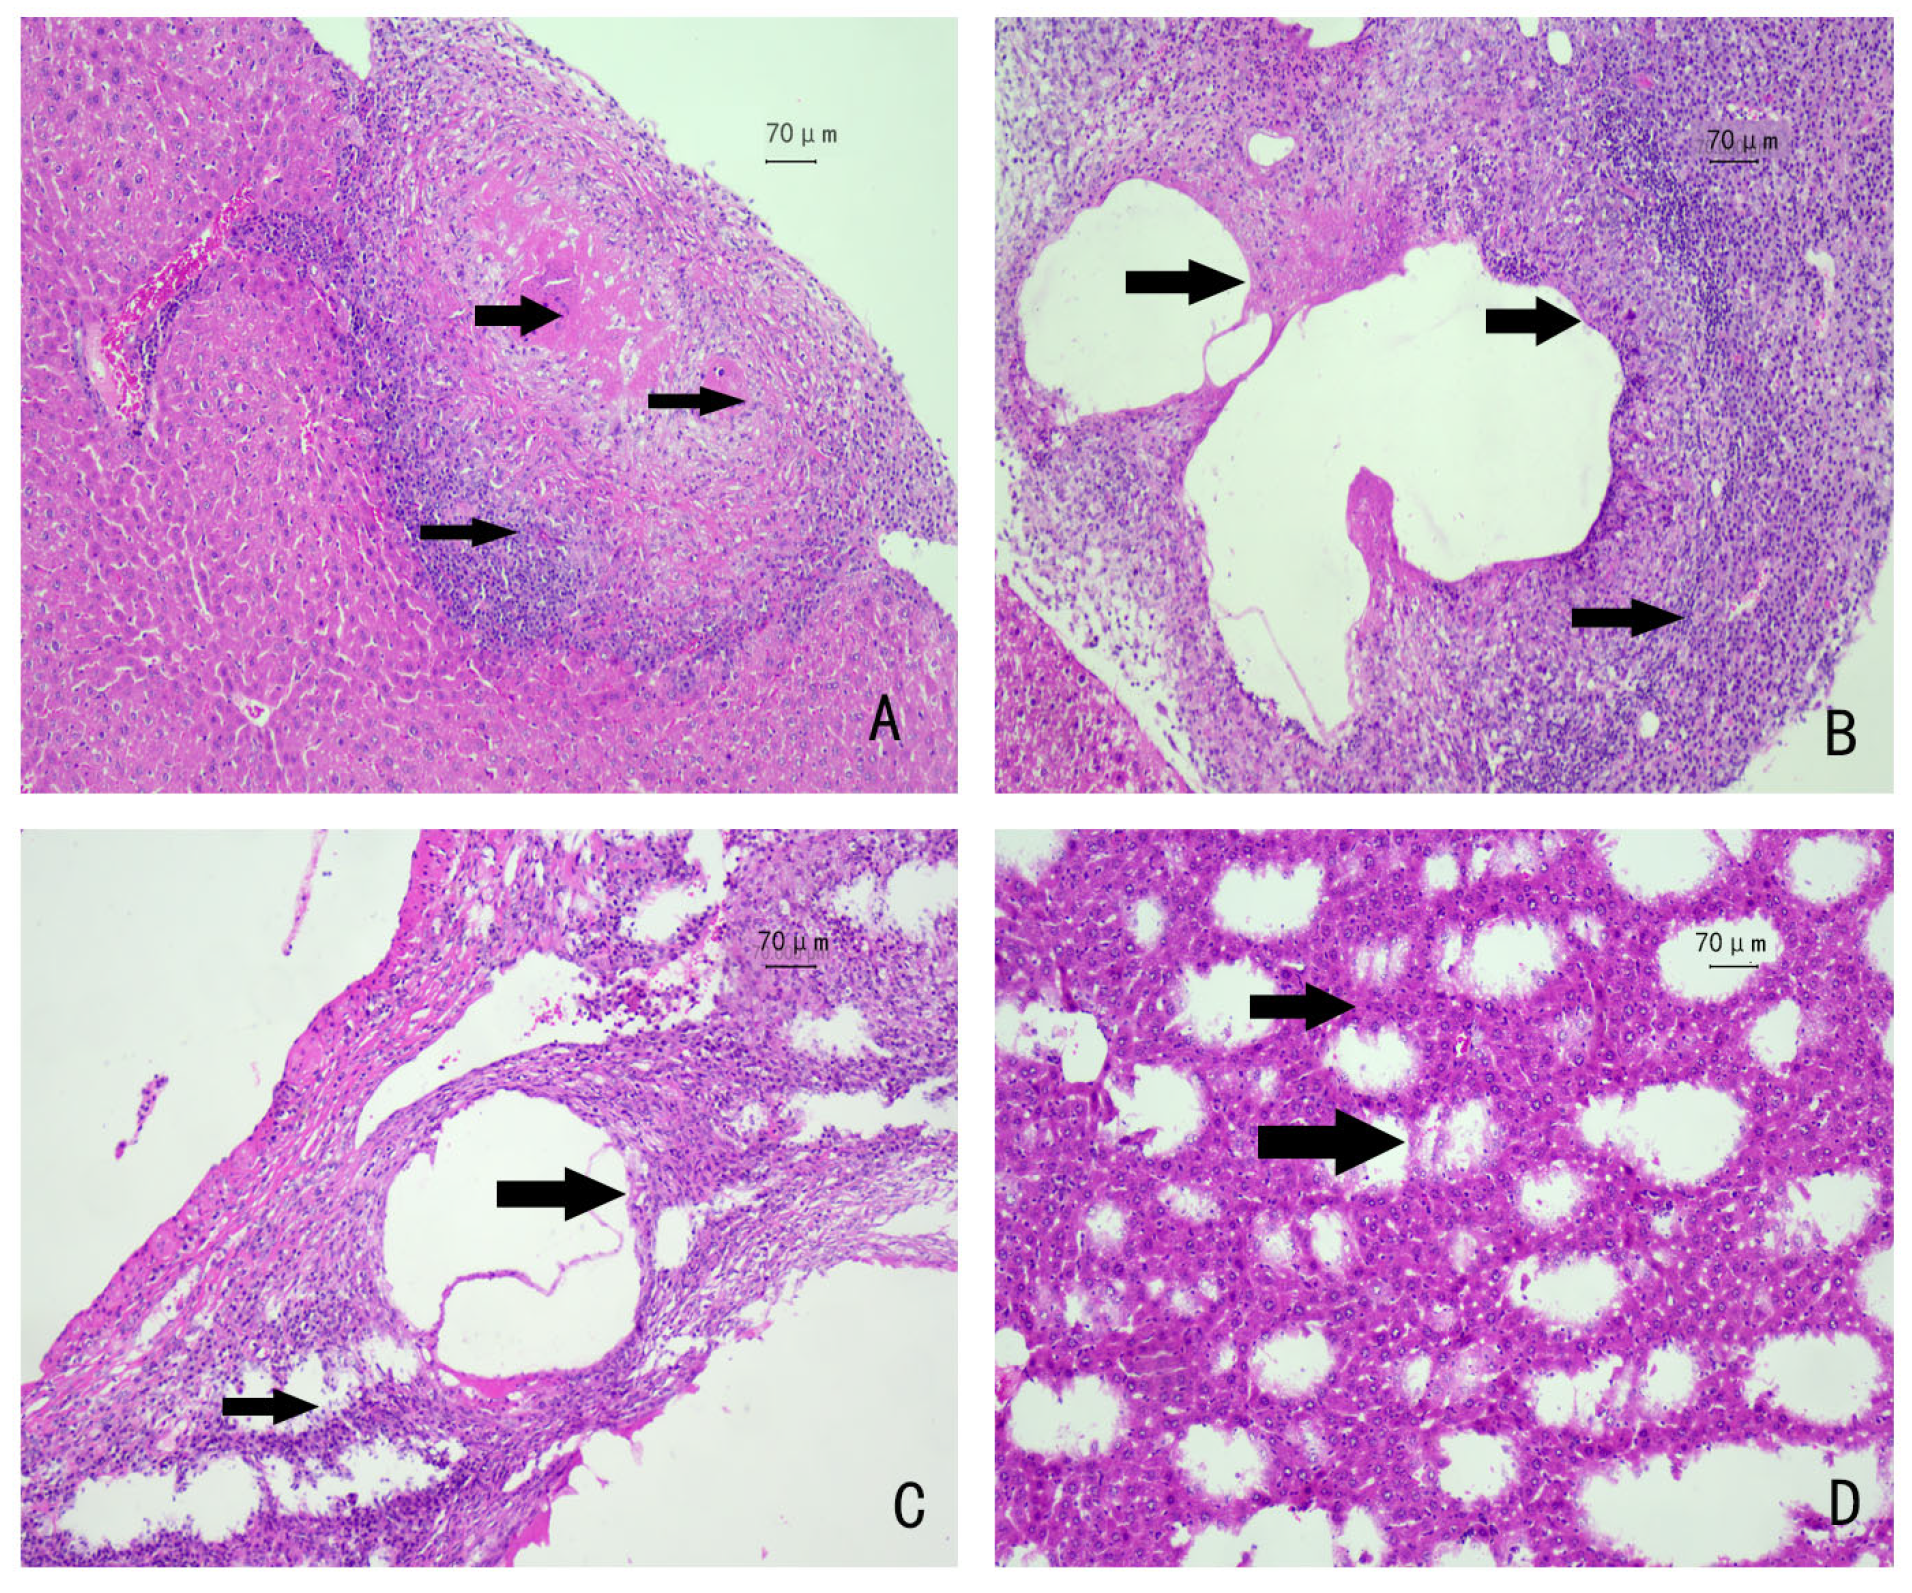
3.1. Autopsies of Mice and HE Staining of Liver Tissues

Upon conducting autopsies, it was determined that at 6, 12, 19, and 25 weeks post-inoculation with the original head segment, the majority of mice exhibited hepatic alveolar echinococcosis, with infection rates of 10/12, 12/12, 12/12, and 12/12, respectively. At six weeks post-infection, the lesions were confined to the vicinity of the hepatic portal vein. By the twelfth week, the individual lesions had spread, resulting in damage to the diaphragmatic peritoneum. By the twenty-fifth week, over half of the mice (7/12) had experienced diaphragmatic metastasis.
HE staining of tissue sections revealed that the liver tissue structure of mice in the blank control group was normal, with no obvious inflammatory cell infiltration observed in the portal area. Six weeks after E. multilocularis larvae infection in mice, hepatocyte edema and necrosis occurred around the lesion, and an inflammatory cell infiltration zone was visible, mainly consisting of macrophages and lymphocytes (Figure 1A). After 12 and 19 weeks of infection, fibrous cords formed, and a large number of inflammatory cells were seen in the lesion area. The inflammatory cells were densely and disorderedly arranged, gradually revealing hyperplastic fibrous connective tissue (Figure 1B,C). After 25 weeks of infection, honeycomb-like structures appeared in the livers of the mice, and the structure of liver lobules was severely damaged (Figure 1D).

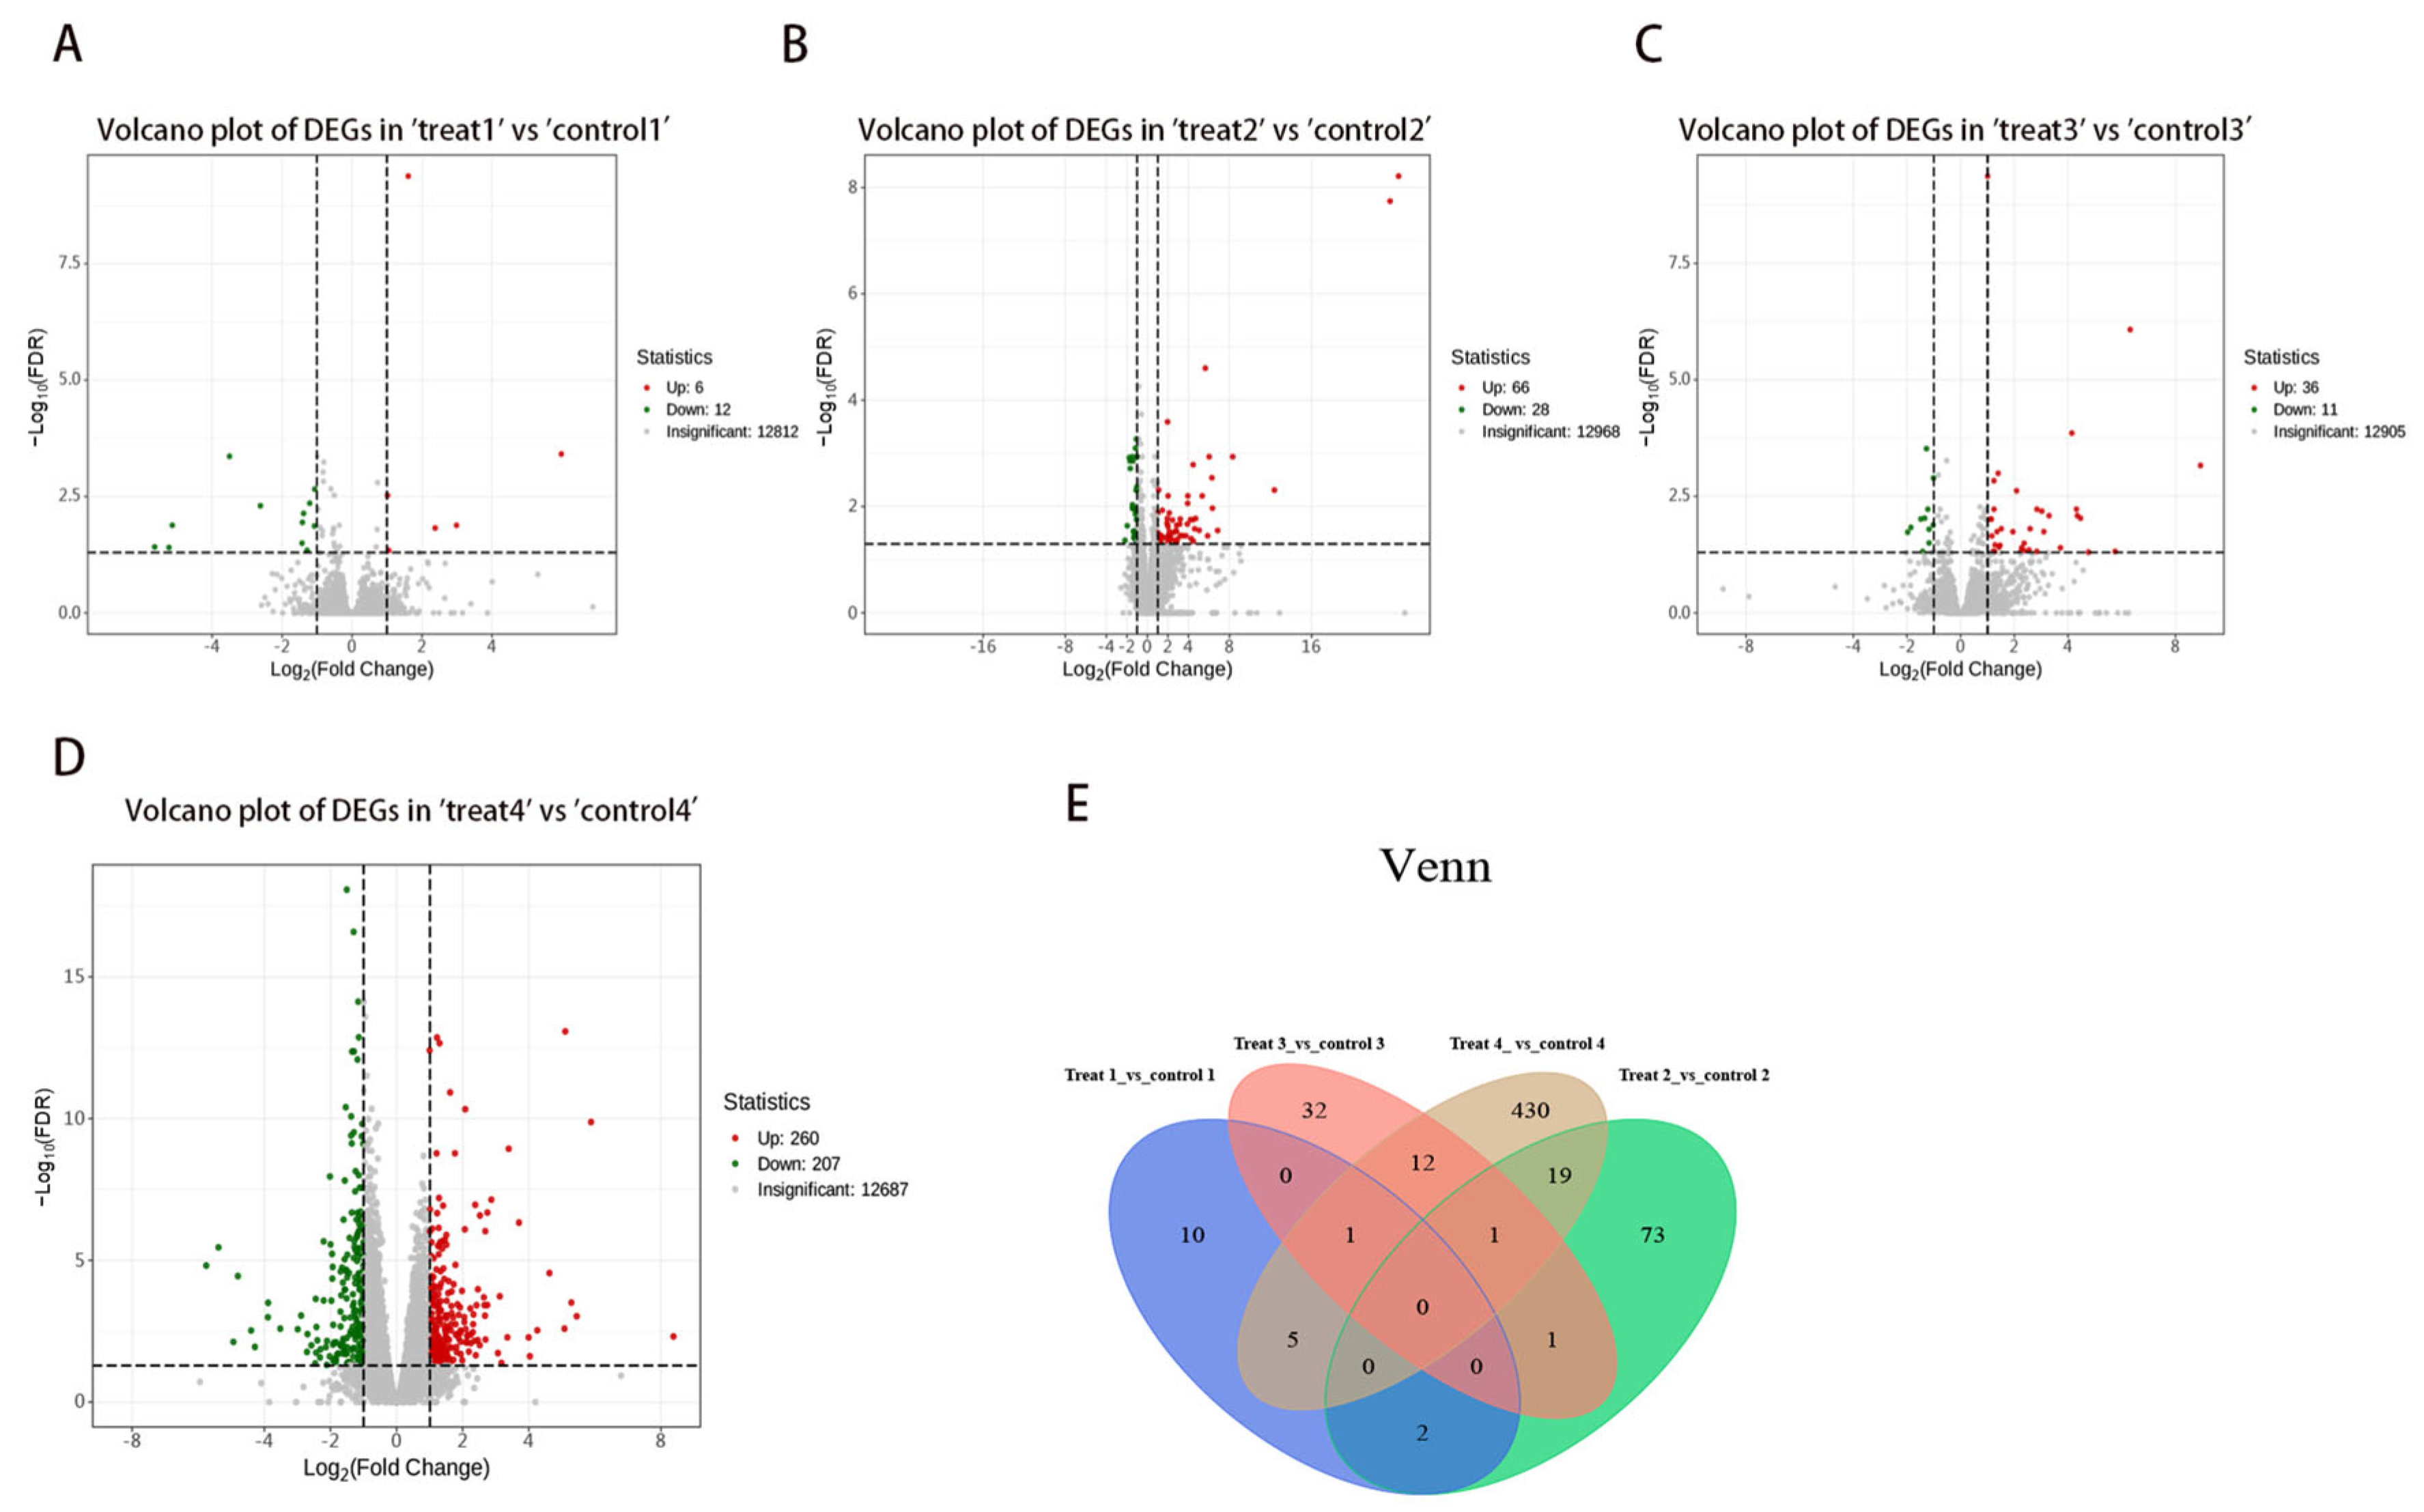
3.2. Identification of DEGs in Liver Tissues at Various Stages of Hepatic Alveolar Hydatid Disease Development

In the experimental group’s livers, proliferating hepatocytes near the parasitic lesions were observed (A). Certain areas of coagulative necrosis were also observed (B, C). The arrows in the figures indicate the parasitic lesions in the livers of the infected mice. These lesions are characterized by the typical germinal layer and laminated layer of Echinococcus multilocularis, surrounded by a periparasitic cellular infiltration composed of macrophages, fibroblasts/myofibroblasts, and lymphocytes, spreading gradually from the center outward. The hepatocytes are disorganized, presenting a reticular structure (D).
A total of 32 samples, 16 from the experimental group and 16 from the control group, with 4 mice per timepoint, were subjected to transcriptome sequencing analysis. A robust dataset of 215.28 Gb of clean data was obtained, with each sample producing an effective data volume of 6 Gb, maintaining Q30 bases at a percentage of 92% or higher, and exhibiting an average GC content of 49%. Notably, the number of matched reads across all libraries exceeded 94%, confirming the high quality of sequencing and gene annotation, such that the data were suitable for subsequent bioinformatic analysis (Table S2).
Differentially expressed genes (DEGs) were identified using stringent criteria, specifically |log2Fold Change| ≥ 1 and FDR < 0.05. Comparative transcriptomic analyses were conducted on liver tissues from mice at varying stages of E. multilocularis infection (Figure 2). A total of 629 differential genes were identified, with 370 showing upregulation, constituting 58.8% of the total differential genes, and 259 showing downregulation, accounting for 41.2% of the total differential genes. Notably, within the experimental group, 6 genes were upregulated and 12 genes were downregulated at 6 weeks post-inoculation (Figure 2A; Table S3); 68 genes were upregulated and 28 genes were downregulated at 12 weeks post-inoculation (Figure 2B; Table S4); 36 genes were upregulated and 11 genes were downregulated at 19 weeks post-inoculation (Figure 2C; Table S5); and 260 genes were upregulated, whereas 208 genes were downregulated at 25 weeks post-inoculation (Figure 2D; Table S6). Moreover, a Venn diagram depicting the differential expression profiles at the four timepoints reveals that 10, 73, 32, and 430 genes were specific to each timepoint, respectively (Figure 2E; Table S7).

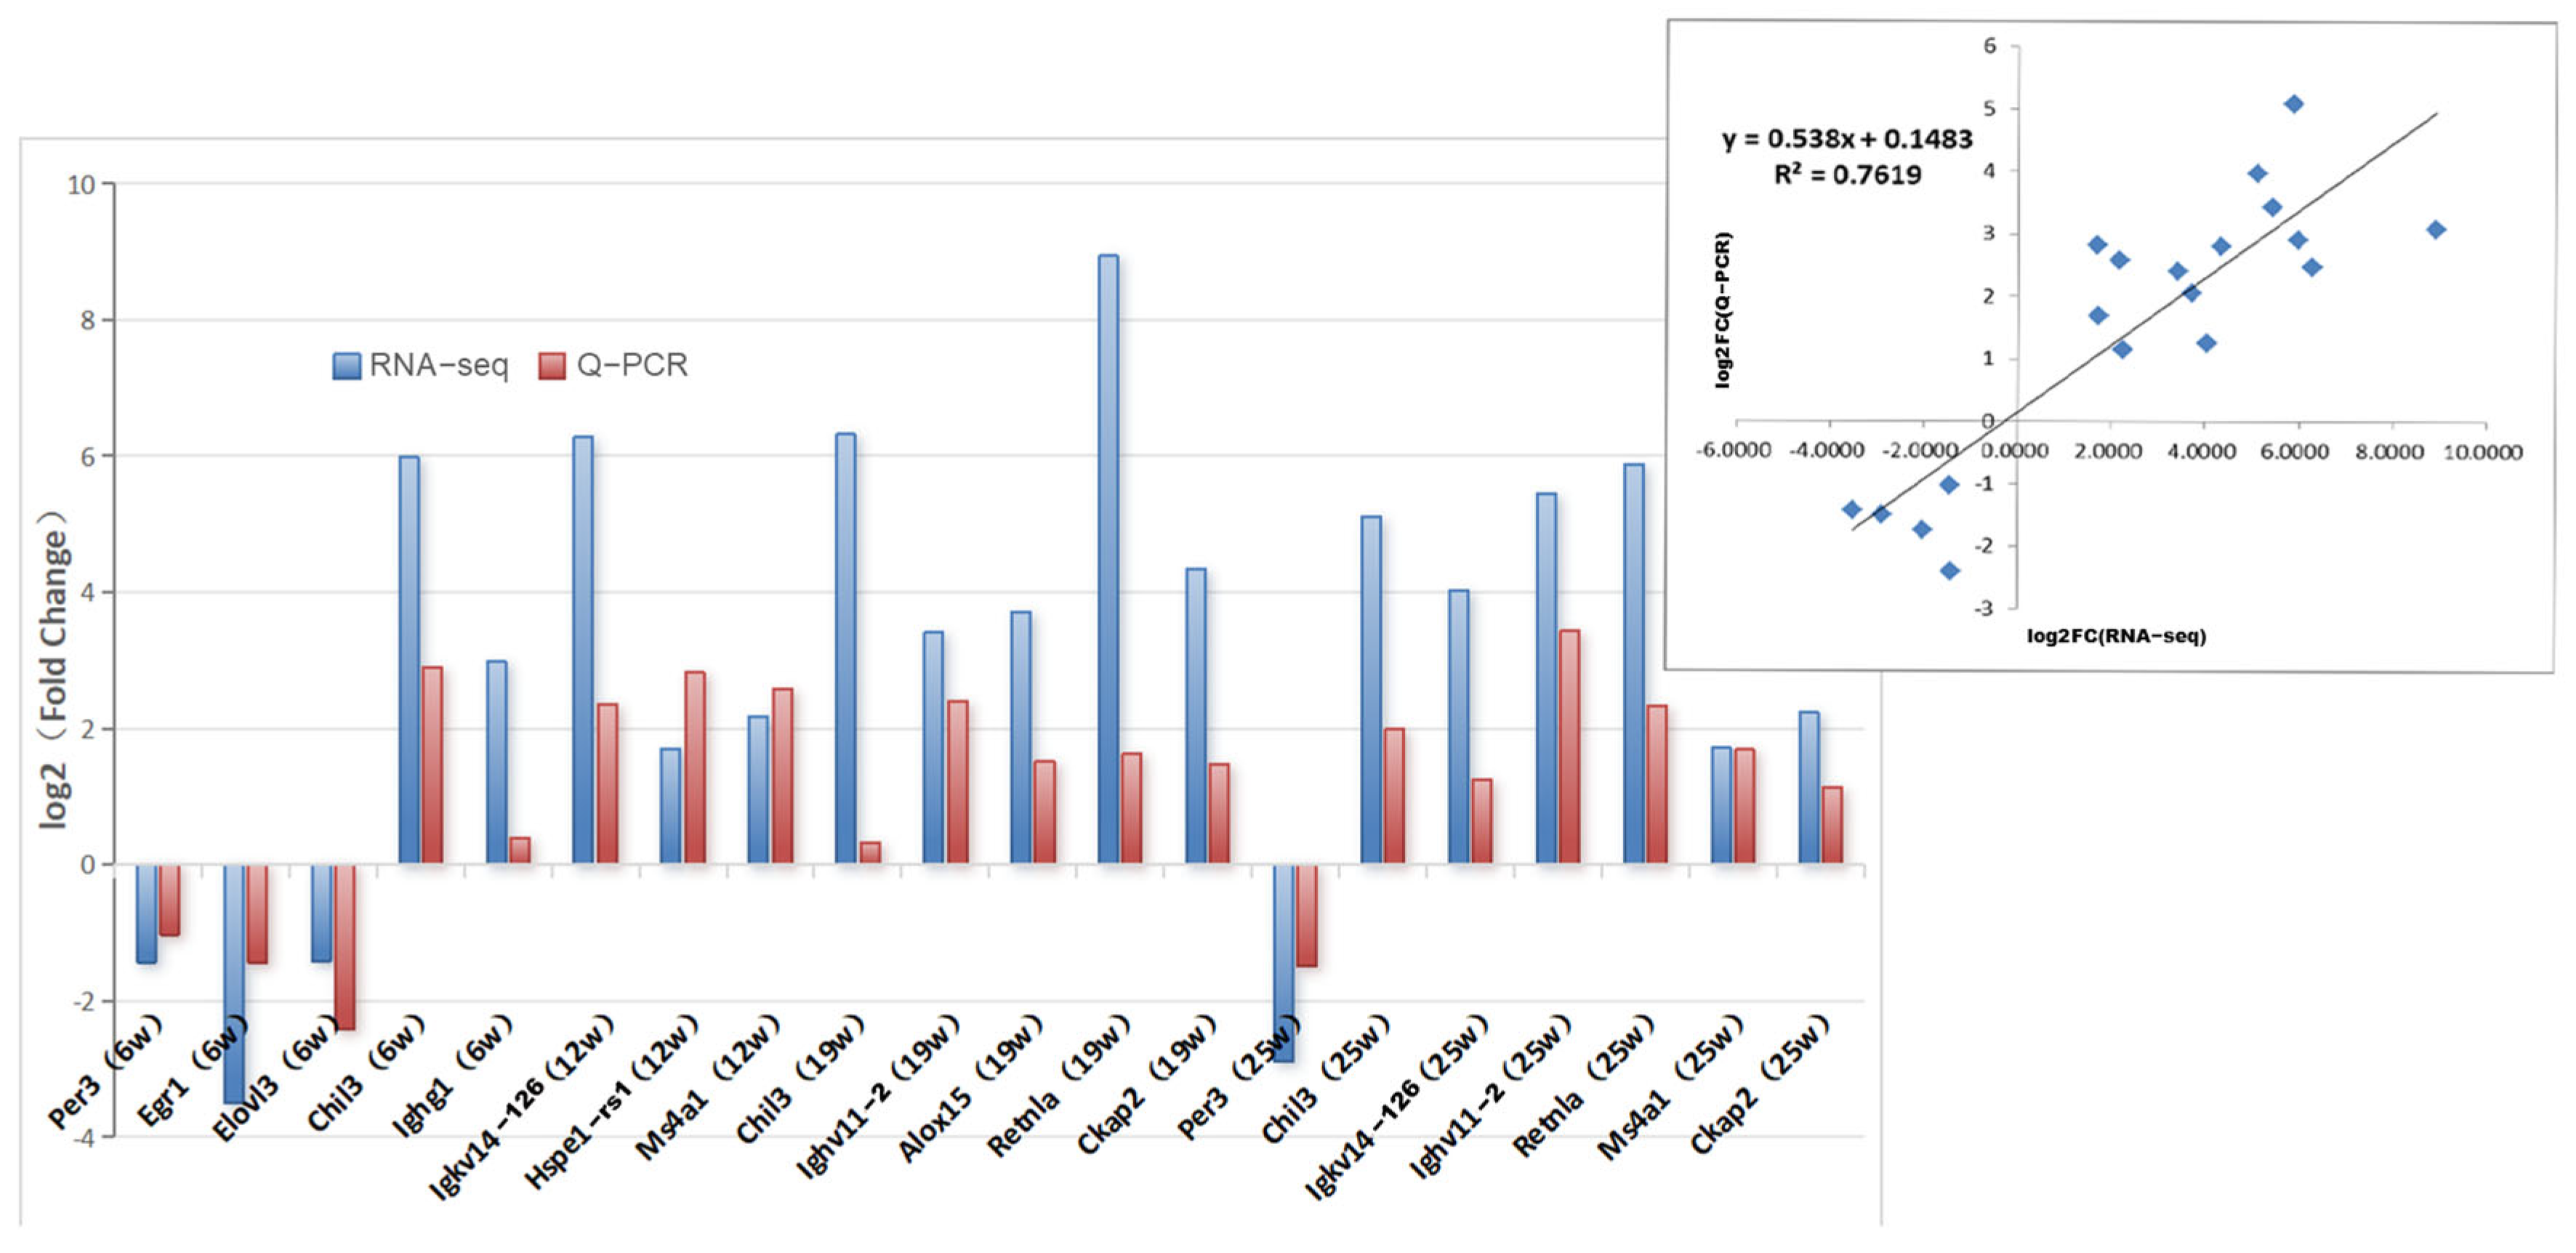
3.3. Validation of Differential Genes by qRT-PCR

Twelve genes which showed differential expression at a minimum of two of the four experimental timepoints were selected for confirmation using qRT-PCR. The research findings indicate that the expression trends of these selected genes are consistent with those obtained from the RNA-Seq analysis. However, the performance of some genes in the RNA-Seq and qRT-PCR was not entirely identical, for example, that of Ighg1 (at 6 weeks) and Chil3 (at 19 weeks). Overall, the correlation coefficient was R2 = 0.7619 (p < 0.05). These findings highlight the reliability of transcriptome sequencing, as confirmed by the qRT-PCR analysis (Figure 3).

3.4. Function and Pathway Outcomes of GO Enrichment

GO enrichment analysis was conducted to investigate the relevant biological processes, cellular components, and molecular functions at various stages of infection progression (Figures S1–S3; Tables S8–S11). At the early stage (6 weeks), DEGs did not show enrichment in any biological processes, cellular components, or molecular functions. However, by the intermediate stage (after 12 weeks), DEGs exhibited enrichment in biological processes associated with antigen receptor-mediated signaling (GO:0050851), immune response-activating cell surface receptor signaling (GO:0002429), immune response-regulating cell surface receptor signaling (GO:0002768), and B cell receptor signaling pathways (GO:0050853). By 19 weeks, DEGs were enriched only in biological processes such as regulation of attachment of spindle microtubules to kinetochores (GO:0051988), response to stilbenoids (GO:0035634), mitotic sister chromatid segregation (GO:0000070), and mitotic nuclear division (GO:0140014). In the late stage (25 weeks), DEGs were associated with biological processes such as fat cell differentiation (GO:0045444), leukocyte aggregation (GO:0070486), regulation of chemokine production (GO:0032642), and response to topologically incorrect protein (GO:0035966). Overall, in the infected mice, distinct patterns of enriched functions emerged at different timepoints. By the 12-week mark, the predominant enriched functions were mainly associated with a wide array of immune and inflammatory responses. As time progressed to the 19th week, the focus of these functions shifted to the cell cycle process to regulate the cell proliferation state. Finally, by 25 weeks, clear manifestations of enriched functions were observed in the positive regulation of inflammatory responses and chemokine functions, as well as the negative regulation of anti-inflammatory factors and hydrolase activities.

3.5. Function and Pathway Results of KEGG Analysis

KEGG enrichment analysis was conducted to discern enriched signaling pathways across different timepoints during the progression of infection (Figures S4–S6; Tables S12–S15). At the initial stage, six weeks after inoculation, no significant enrichment of signaling pathways was detected. However, by the mid-stage, twelve weeks post-inoculation, DEGs were prominently found in the pathways related to protein digestion and absorption, as well as the B-cell receptor signaling pathway. Additionally, other signaling pathways, such as the Wnt signaling pathway, the MAPK (Mitogen-Activated Protein Kinase) signaling pathway, and the PI3K-Akt signaling pathway, were also involved. Subsequently, at 19 weeks post-inoculation, significant changes were observed in the DEGs associated with arachidonic acid metabolism and circadian rhythm regulation. Among them, the AMPK (AMP-activated protein kinase) signaling pathway was implicated. Notably, at 25 weeks post-inoculation, DEGs showed elevated expression levels in the pathways related to prion disease, the PPAR (peroxisome proliferator-activated receptor) signaling pathway, and the biosynthesis of unsaturated fatty acids.

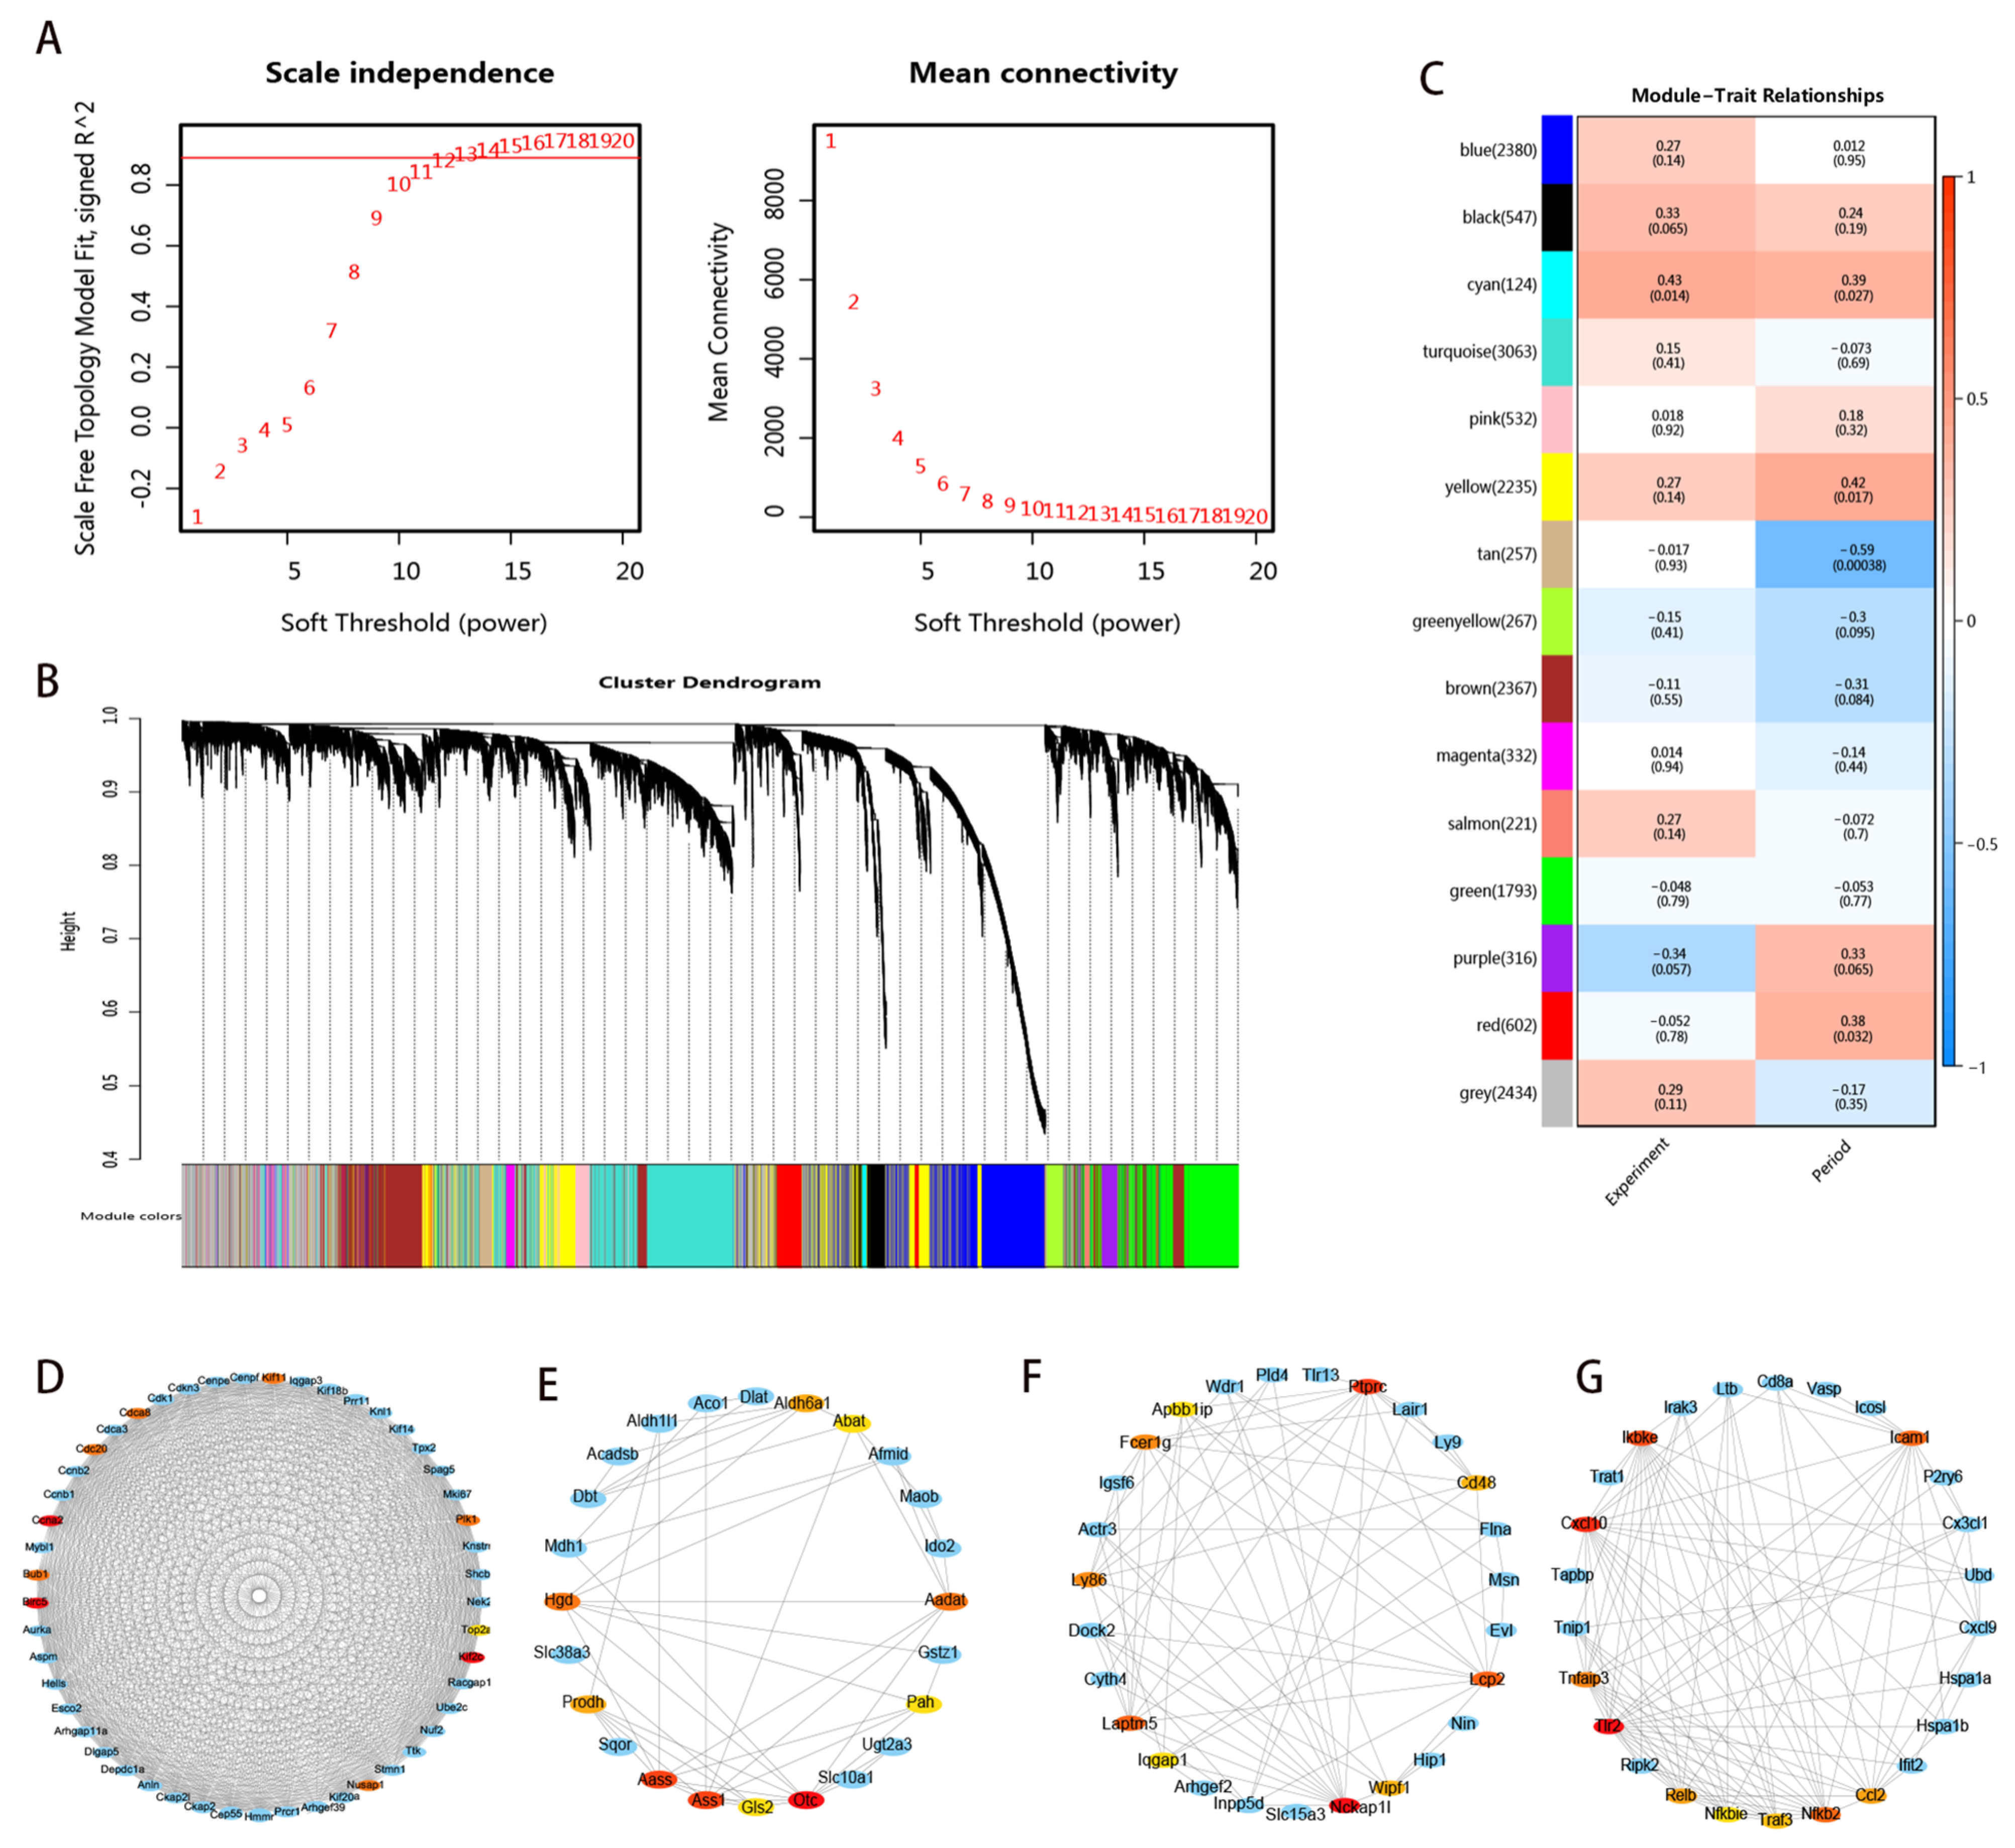
3.6. Coexpression Network-Related Modules and Hub Genes

WGCNA was conducted on the transcriptome data to identify genes potentially linked to echinococcus infection. A total of 25,117 genes measured in the transcriptome data were analyzed. The co-expression threshold calculated by the software was set at 12 (Figure 4A). Subsequently, genes with similar expression patterns were clustered according to fragments per kilobase million (FPKM) values. The gene clustering tree generated from this process was then divided into distinct modules using the Dynamic Tree Cut method (Figure 4B). In total, fifteen different modules were identified, and each was represented by a unique color. The turquoise module had the largest number of genes, while the salmon module had the fewest. Pearson correlation coefficients were used to illustrate the relationships between the characteristic values of these modules and the trait data (Figure 4C). Remarkably, the cyan module showed positive correlations with both the infection condition (r = 0.43) and the infection period (r = 0.39). The yellow and red modules, however, were only positively associated with the infection period. On the contrary, the tan module showed a negative correlation (r = −0.59) with the infection period. The findings strongly imply that the DEGs within these modules could play a crucial role in Echinococcus infection. To identify the key genes, we selected the top 50 genes with the highest connectivity from the cyan, tan, yellow, and red modules. Among them, the core genes CCNA2, BIRC5, and KIF2C were obtained by the cyan module screening (Figure 4D); the core gene OTC was obtained by the tan module screening (Figure 4E); the core gene TLR2 was obtained by the red module screening (Figure 4F); and the core gene NCKAP1L was obtained by the yellow module screening (Figure 4G).

4. Discussion

Currently, transcriptomic research on echinococcosis has advanced significantly, with extensive studies characterizing the hepatic transcriptional profiles and molecular regulatory networks involved in disease progression [15,16]. However, the intricate growth dynamics of AE and its underlying pathophysiological mechanisms remain incompletely elucidated. To concisely describe disease progression, we employed the staging criteria established by Zhang et al. [17], categorizing the infection timeline into early (before 60 days), intermediate (60 to 180 days), and late (after 180 days) stages. We elucidated the dynamic molecular alterations and associated signaling pathways that play critical roles in the early development of AE, providing novel insights into the pathogenesis and potential key factors of hepatic echinococcosis.
Microscopic examination of AE lesions demonstrates peripheral annular fibrous tissue hyperplasia, accompanied by infiltration of diverse immune cells—including lymphocytes, eosinophils, macrophages, and plasma cells—at the lesion margins. This immune-rich periphery constitutes an inflammatory microenvironment that shares histological similarities with hepatocellular carcinoma. AE lesions lack a complete fibrous capsule and instead exhibit invasive growth patterns, facilitated by a unique immune microenvironment that promotes parasite persistence and immune evasion [18]. Immune mechanisms play a decisive role in AE progression, governing whether the infection resolves spontaneously or establishes chronic persistence post-hepatic colonization, as observed in both human patients and animal models [19]. The long-term parasitic survival of larvae is primarily mediated by regulatory T cells (e.g., Th1 and Th2) and related cytokines (e.g., IL-10 and TGF-β) [20].
This study revealed that at 6 weeks post-infection, transcriptional profiling showed minimal differential gene expression and no significantly enriched pathways, suggesting an initial immune-tolerant phase. By 12 weeks, however, immune-related signaling pathways were markedly activated, with early Th1-mediated responses playing a protective role by suppressing parasite proliferation and mitigating granuloma-associated tissue damage [21,22]. As infection progressed to the middle-to-late stages, E. multilocularis larvae selectively stimulated the release of Th2-associated chemokines, suppressing pro-inflammatory cytokines [23]. This Th2 polarization promoted a humoral-dominant immune response, effectively dampening host protective immunity and facilitating parasite immune evasion and sustained pathogenicity [24]. Concurrently, leukocyte aggregation and chemokine production further recruited monocytes, lymphocytes, and other immune cells to the liver. On one hand, this promotes the proliferation, survival, and metastasis of E. multilocularis larvae. On the other hand, it leads to liver damage, chronic progression, and fibrosis [25].
KEGG enrichment analysis revealed that, after 12 weeks of E. multilocularis infection, multiple signaling pathways contribute to fibrosis progression, predominantly the Wnt, MAPK, PI3K-Akt, and AMPK signaling pathways. Previous studies [26,27] have established a critical role for the MAPK signaling pathway in mediating the inflammatory response and hepatic fibrosis following E. multilocularis infection. In both human AE and mouse models, MAPK pathway activation drives macrophage polarization toward an M2 phenotype [28], leading to the secretion of transforming growth factor-α (TGF-α) and TGF-β—key mediators that stimulate hepatic stellate cell (HSC) proliferation, transdifferentiation, and fibrogenesis [29]. Moreover, E. multilocularis protoscoleces modulate glycolysis via the PI3K/AKT/mTOR and AMPK pathways, further promoting M2 macrophage polarization and accelerating AE pathogenesis [30]. While local hepatic fibrosis initially serves a protective function—sequestering the parasite and limiting its intrahepatic dissemination—macrophage depletion impairs early larval clearance and suppresses fibrogenesis, paradoxically facilitating E. multilocularis proliferation [31].
Activation of the PPAR signaling pathway has been observed in advanced-stage disease. PPARs play crucial roles in adipocyte differentiation and lipid metabolism [32]. The PPAR family comprises three subtypes: PPARα, PPARγ, and PPARβ/δ, which exhibit divergent biological functions. PPARγ is known to exert anti-inflammatory effects [33], whereas PPARβ/δ promotes pro-inflammatory responses [34]. Interestingly, during tumorigenesis, PPARβ/δ may antagonize PPARγ’s activity [35]. Accumulating evidence suggests that PPARβ/δ exhibits strong tumor-promoting properties [36,37]. Moreover, studies indicate that downregulating PPAR pathway genes can mitigate inflammation by suppressing transcription factors and modulate the cell cycle during tumor progression by inducing apoptosis [38].
Through WGCNA, six core genes, namely, CCNA2 (cyclin A2), BIRC5 (baculoviral IAP repeat-containing 5), KIF2C (kinase family member 2C), OTC (ornithine transcarbamylase), TLR2 (toll-like receptor 2), and NCKAP1L (NCK-associated protein 1-like), were identified. These genes are potentially implicated in cell cycle regulation and B-cell signal transduction. There is a significant correlation between the expression level of CCNA2 and the infiltration of CD4+ T cells. It may play a role in regulating the remodeling of the immune microenvironment and the activation of macrophages [39], thereby increasing the degree of immune infiltration in AE. The expression of BIRC5 is related to the activation of HSCs, which may promote the occurrence of liver fibrosis. KIF2C, a member of the kinesin family, participates in multiple biological processes, including tumor invasion, metastasis, immune escape, and cell senescence [40]. NCKAP1L, also known as HEM1 (Hematopoietic protein 1), serves as a key regulator of the signal intensity of the B-cell receptor. It is essential for the development and maintenance of B-cell homeostasis [41]. TLR2 is well-known for its prominent biological function of promoting the synthesis and release of inflammatory factors. It can activate immune cells such as macrophages and dendritic cells. High expression of TLR2 may regulate antigen presentation, parasite growth, and granuloma formation [42]. An in vivo study demonstrated that in patients with HAE, the increased expression of mRNAs like TLR2 and the elevated levels of related cytokines (IFN-γ, IL-5, IL-23, and IL-10) can protect the parasites from the host’s immune system [43]. Additionally, some scholars have reported that inflammatory stimulation and high expression of TLR2 can effectively modulate the tissue-invasive growth of E. multilocularis larvae and its persistence within the host [44,45].
In summary, during the infection of the host by E. multilocularis larvae, a complex process unfolds. The establishment of the hepatic immune microenvironment and the activation of multiple signaling pathways drive the development of alveolar echinococcosis fibrosis. This sets the stage for a dynamic interplay between immune–inflammatory and fibrogenic pathways. It dictates how E. multilocularis larvae manage to evade the host’s immune surveillance, promotes their invasive proliferation within the hepatic tissue, and ultimately determines their long-term survival within the host. In essence, the balance and interaction between immune–inflammatory and fibrotic pathways are the key factors shaping the outcomes of alveolar echinococcosis.
Our current research has shed light on the dynamic changes in genes and their associated signaling pathways during the progression of infection by E. multilocularis larvae. Nevertheless, substantial gaps in our knowledge still exist, and reliable experimental validation is urgently needed.

Supplementary Materials

The following supporting information can be downloaded at https://www.mdpi.com/article/10.3390/genes16070839/s1, Table S1: qRT-PCR primer sequence information; Table S2: Summary of transcriptome sequencing data results; Tables S3–S6: DEG identification at four time points (weeks 6, 12, 19, and 25); Table S7: Venn diagram at four time points; Tables S8–S11: GO enrichment analysis at four time points (weeks 6, 12, 19, and 25); Tables S12–S15: KEGG pathway enrichment analysis at four time points (weeks 6, 12, 19, and 25); Figures S1–S3: Bubble chart for GO enrichment analysis; Figures S4–S6: Bubble chart for KEGG enrichment analysis.

Author Contributions

X.Z. was responsible for conceptualization and writing the original draft. Q.Z. and N.L. performed the experiments and data analysis. J.L. and H.C. were responsible for manuscript revision. C.Z., K.S., W.L., W.M., W.W. and S.G. were responsible for the investigation and resources. X.M. conceptualized the study, supervised the project, and secured funding. M.W. contributed to the methodology development and interpretation of the results. All authors have read and agreed to the published version of the manuscript.

Funding

This work was supported by the Guiding Program Project of the Qinghai Provincial Health and Health System, no. 2022wjzdx-35; the public health service capacity for the prevention and control of major infectious diseases in Qinghai Province has been enhanced: project number for 2023-QY-202.

Institutional Review Board Statement

This study was approved by the Animal Ethics Committee of the Qinghai Institute for Endemic Disease Control and Prevention (Approval No.: QDB2021-0007).

Informed Consent Statement

Not applicable.

Data Availability Statement

The original contributions presented in this study are included in the article. Further inquiries can be directed to the corresponding authors.

Conflicts of Interest

The authors declare no conflicts of interest.

Abbreviations

The following abbreviations are used in this manuscript:
AEAlveolar echinococcosis
AMPKAMP-activated protein kinase
BIRC5Baculoviral IAP repeat-containing 5
CCNA2Cyclin A2
DEGsDifferentially expressed genes
EDTAEthylene Diamine Tetraacetic Acid
FPKMFragments per kilobase million
GOGene Ontology
HEM1Hematopoietic protein 1
HSCsHepatic stellate cells
KEGGKyoto Encyclopedia of Genes and Genomes
KIF2CKinase family member 2C
M2Macrophages 2
MAPKMitogen-Activated Protein Kinase
NCKAP1LNCK-associated protein1-like
OTCOrnithine transcarbamylase
PPARPeroxisome proliferator-activated receptor
qRT-PCRQuantitative real-time polymerase chain reaction
RNA-SeqRNA sequencing
TGF-βTransforming growth factor-beta
TLR2Toll-like receptor 2
WGCNAWeighted gene co-expression network analysis

References

  1. Fu, M.H.; Wang, X.; Han, S.; Guan, Y.Y.; Bergquist, R.; Wu, W.P. Advances in research on echinococcoses epidemiology in China. Acta Trop. 2021, 219, 105921. [Google Scholar] [CrossRef] [PubMed]
  2. Aydin, Y.; Ogul, H.; Topdagi, O.; Ulas, A.B.; Sade, R.; Ozturk, G.; Korkut, E.; Aksungur, N.; Sener, E.; Can, F.K.; et al. Relevance of Pulmonary Alveolar Echinococcosis. Arch. Bronconeumol. 2020, 56, 779–783. [Google Scholar] [CrossRef] [PubMed]
  3. Wang, X.; Dai, G.; Li, M.; Jia, W.; Guo, Z.; Lu, J. Prevalence of human alveolar echinococcosis in China: A systematic review and meta-analysis. BMC Public Health 2020, 20, 1105. [Google Scholar] [CrossRef] [PubMed]
  4. Wen, H.; Vuitton, L.; Tuxun, T.; Li, J.; Vuitton, D.A.; Zhang, W.; McManus, D.P. Echinococcosis: Advances in the 21st Century. Clin. Microbiol. Rev. 2019, 32, e00075-18. [Google Scholar] [CrossRef] [PubMed]
  5. Bresson-Hadni, S.; Spahr, L.; Chappuis, F. Hepatic Alveolar Echinococcosis. Semin. Liver Dis. 2021, 41, 393–408. [Google Scholar] [CrossRef] [PubMed]
  6. Trefts, E.; Gannon, M.; Wasserman, D.H. The liver. Curr. Biol. 2017, 27, R1147–R1151. [Google Scholar] [CrossRef] [PubMed]
  7. Martyniuk, C.J. Perspectives on transcriptomics in animal physiology studies. Comp. Biochem. Physiol. B Biochem. Mol. Biol. 2020, 250, 110490. [Google Scholar] [CrossRef] [PubMed]
  8. Manzoni, C.; Kia, D.A.; Vandrovcova, J.; Hardy, J.; Wood, N.W.; Lewis, P.A.; Ferrari, R. Genome, transcriptome and proteome: The rise of omics data and their integration in biomedical sciences. Brief. Bioinform. 2018, 19, 286–302. [Google Scholar] [CrossRef] [PubMed]
  9. Love, M.I.; Huber, W.; Anders, S. Moderated estimation of fold change and dispersion for RNA-seq data with DESeq2. Genome Biol. 2014, 15, 550. [Google Scholar] [CrossRef] [PubMed]
  10. Varet, H.; Brillet-Guéguen, L.; Coppée, J.Y.; Dillies, M.A. SARTools: A DESeq2- and EdgeR-Based R Pipeline for Comprehensive Differential Analysis of RNA-Seq Data. PLoS ONE 2016, 11, e0157022. [Google Scholar] [CrossRef] [PubMed]
  11. Robinson, M.D.; McCarthy, D.J.; Smyth, G.K. edgeR: A Bioconductor package for differential expression analysis of digital gene expression data. Bioinformatics 2010, 26, 139–140. [Google Scholar] [CrossRef] [PubMed]
  12. Kanehisa, M.; Araki, M.; Goto, S.; Hattori, M.; Hirakawa, M.; Itoh, M.; Katayama, T.; Kawashima, S.; Okuda, S.; Tokimatsu, T.; et al. KEGG for linking genomes to life and the environment. Nucleic Acids Res. 2008, 36, D480–D484. [Google Scholar] [CrossRef] [PubMed]
  13. Ashburner, M.; Ball, C.A.; Blake, J.A.; Botstein, D.; Butler, H.; Cherry, J.M.; Davis, A.P.; Dolinski, K.; Dwight, S.S.; Eppig, J.T.; et al. Gene ontology: Tool for the unification of biology. The Gene Ontology Consortium. Nat. Genet. 2000, 25, 25–29. [Google Scholar] [CrossRef] [PubMed]
  14. Langfelder, P.; Horvath, S. WGCNA: An R package for weighted correlation network analysis. BMC Bioinform. 2008, 29, 559. [Google Scholar] [CrossRef] [PubMed]
  15. Nian, X.; Li, L.; Ma, X.; Li, X.; Li, W.; Zhang, N.; Ohiolei, J.A.; Li, L.; Dai, G.; Liu, Y.; et al. Understanding pathogen-host interplay by expression profiles of lncRNA and mRNA in the liver of Echinococcus multilocularis-infected mice. PLoS Negl. Trop. Dis. 2022, 16, e0010435. [Google Scholar] [CrossRef] [PubMed]
  16. Lin, R.; Lü, G.; Wang, J.; Zhang, C.; Xie, W.; Lu, X.; Mantion, G.; Martin, H.; Richert, L.; Vuitton, D.A.; et al. Time course of gene expression profiling in the liver of experimental mice infected with Echinococcus multilocularis. PLoS ONE 2011, 6, e14557. [Google Scholar] [CrossRef] [PubMed]
  17. Zhang, C.; Wang, J.; Lü, G.; Li, J.; Lu, X.; Mantion, G.; Vuitton, D.A.; Wen, H.; Lin, R. Hepatocyte proliferation/growth arrest balance in the liver of mice during E. multilocularis infection: A coordinated 3-stage course. PLoS ONE 2012, 7, e30127. [Google Scholar] [CrossRef] [PubMed]
  18. Yang, Y.; Wuren, T.; Wu, B.; Cheng, S.; Fan, H. The expression of CTLA-4 in hepatic alveolar echinococcosis patients and blocking CTLA-4 to reverse T cell exhaustion in Echinococcus multilocularis-infected mice. Front. Immunol. 2024, 15, 1358361. [Google Scholar] [CrossRef] [PubMed]
  19. Abulizi, A.; Tuergan, T.; Shalayiadang, P.; Zhang, C.; Zhang, R.; Jiang, T.; Guo, Q.; Wang, H.; Li, L.; Lin, R.; et al. Hepatic alveolar echinococcosis infection induces a decrease in NK cell function through high expression of NKG2A in patients. Front. Immunol. 2025, 16, 1563248. [Google Scholar] [CrossRef] [PubMed]
  20. Gao, H.; Huo, L.; Mo, X.; Jiang, B.; Luo, Y.; Xu, B.; Li, J.; Ma, X.; Jing, T.; Feng, Z.; et al. Suppressive effect of pseudolaric acid B on Echinococcus multilocularis involving regulation of TGF-β1 signaling in vitro and in vivo. Front. Microbiol. 2022, 13, 1008274. [Google Scholar] [CrossRef] [PubMed]
  21. Vuitton, D.A.; Gottstein, B. Echinococcus multilocularis and its intermediate host: A model of parasite-host interplay. J. Biomed. Biotechnol. 2010, 2010, 923193. [Google Scholar] [CrossRef] [PubMed]
  22. Gottstein, B.; Soboslay, P.; Ortona, E.; Wang, J.; Siracusano, A.; Vuitton, D.A. Immunology of Alveolar and Cystic Echinococcosis (AE and CE). Adv. Parasitol. 2017, 96, 1–54. [Google Scholar] [PubMed]
  23. Wu, B.; Yang, Y.; Cheng, S.; Wang, Z.; Fan, H. Activation of the Wnt signaling pathway and its role in epithelial-mesenchymal transition and hepatic fibrosis in alveolar echinococcosis. Front. Cell Infect. Microbiol. 2025, 15, 1583802. [Google Scholar] [CrossRef] [PubMed]
  24. Vuitton, D.A.; Zhang, S.L.; Yang, Y.; Godot, V.; Beurton, I.; Mantion, G.; Bresson-Hadni, S. Survival strategy of Echinococcus multilocularis in the human host. Parasitol. Int. 2006, 55, S51–S55. [Google Scholar] [CrossRef] [PubMed]
  25. Hübner, M.P.; Manfras, B.J.; Margos, M.C.; Eiffler, D.; Hoffmann, W.H.; Schulz-Key, H.; Kern, P.; Soboslay, P.T. Echinococcus multilocularis metacestodes modulate cellular cytokine and chemokine release by peripheral blood mononuclear cells in alveolar echinococcosis patients. Clin. Exp. Immunol. 2006, 145, 243–251. [Google Scholar] [CrossRef] [PubMed]
  26. Gui, W.F.; Xu, S.; Dang, Z.S.; Zhao, Y.M. In Vitro and in Vivo Effect of MAPK Signal Transduction Pathway Inhibitors on Echinococcus multilocularis. J. Parasitol. 2019, 105, 146–154. [Google Scholar] [CrossRef] [PubMed]
  27. Zhao, Y.; Gui, W.; Niu, F.; Chong, S. The MAPK Signaling Pathways as a Novel Way in Regulation and Treatment of Parasitic Diseases. Diseases 2019, 7, 9. [Google Scholar] [CrossRef] [PubMed]
  28. Chong, S.; Chen, G.; Dang, Z.; Niu, F.; Zhang, L.; Ma, H.; Zhao, Y. Echinococcus multilocularis drives the polarization of macrophages by regulating the RhoA-MAPK signaling pathway and thus affects liver fibrosis. Bioengineered 2022, 13, 8747–8758. [Google Scholar] [CrossRef] [PubMed]
  29. Moore, M.P.; Cunningham, R.P.; Davis, R.A.H.; Deemer, S.E.; Roberts, B.M.; Plaisance, E.P.; Rector, R.S. A dietary ketone ester mitigates histological outcomes of NAFLD and markers of fibrosis in high-fat diet fed mice. Am. J. Physiol. Gastrointest. Liver Physiol. 2021, 320, G564–G572. [Google Scholar] [CrossRef] [PubMed]
  30. Xu, M.-Z.; Ke, F.; Chai, J.-P.; A, J.-D.; Tan, Q.-L. Progress on the HIF-1α/VEGF/VEGFR2 signal pathway in hepatic alveolar echinococcosis. Front. Oncol. 2025, 15, 1553125. [Google Scholar] [CrossRef] [PubMed]
  31. Wang, H.; Zhang, C.-S.; Fang, B.-B.; Hou, J.; Li, W.-D.; Li, Z.-D.; Li, L.; Bi, X.-J.; Abulizi, A.; Shao, Y.-M.; et al. Dual Role of Hepatic Macrophages in the Establishment of the Echinococcus multilocularis Metacestode in Mice. Front. Immunol. 2021, 11, 600635. [Google Scholar] [CrossRef] [PubMed]
  32. Christofides, A.; Konstantinidou, E.; Jani, C.; Boussiotis, V.A. The role of peroxisome proliferator-activated receptors (PPAR) in immune responses. Metabolism 2021, 114, 154338. [Google Scholar] [CrossRef] [PubMed]
  33. Su, C.G.; Wen, X.; Bailey, S.T.; Jiang, W.; Rangwala, S.M.; Keilbaugh, S.A.; Flanigan, A.; Murthy, S.; Lazar, M.A.; Wu, G.D. A novel therapy for colitis utilizing PPAR-gamma ligands to inhibit the epithelial inflammatory response. J. Clin. Investig. 1999, 104, 383–389. [Google Scholar] [CrossRef] [PubMed]
  34. Tian, R.; Zuo, X.; Jaoude, J.; Mao, F.; Colby, J.; Shureiqi, I. ALOX15 as a suppressor of inflammation and cancer: Lost in the link. Prostaglandins Other Lipid Mediat. 2017, 132, 77–83. [Google Scholar] [CrossRef] [PubMed]
  35. Zuo, X.; Wu, Y.; Morris, J.S.; Stimmel, J.B.; Leesnitzer, L.M.; Fischer, S.M.; Lippman, S.M.; Shureiqi, I. Oxidative metabolism of linoleic acid modulates PPAR-beta/delta suppression of PPAR-gamma activity. Oncogene 2006, 25, 1225–1241. [Google Scholar] [CrossRef] [PubMed]
  36. Zuo, X.; Xu, M.; Yu, J.; Wu, Y.; Moussalli, M.J.; Manyam, G.C.; Lee, S.I.; Liang, S.; Gagea, M.; Morris, J.S.; et al. Potentiation of colon cancer susceptibility in mice by colonic epithelial PPAR-δ/β overexpression. J. Natl. Cancer Inst. 2014, 106, dju052. [Google Scholar] [CrossRef] [PubMed]
  37. Beyaz, S.; Mana, M.D.; Roper, J.; Kedrin, D.; Saadatpour, A.; Hong, S.-J.; Bauer-Rowe, K.E.; Xifaras, M.E.; Akkad, A.; Arias, E.; et al. High-fat diet enhances stemness and tumorigenicity of intestinal progenitors. Nature 2016, 531, 53–58. [Google Scholar] [CrossRef] [PubMed]
  38. Ballav, S.; Biswas, B.; Sahu, V.K.; Ranjan, A.; Basu, S. PPAR-γ Partial Agonists in Disease-Fate Decision with Special Reference to Cancer. Cells 2022, 11, 3215. [Google Scholar] [CrossRef] [PubMed]
  39. Lu, Y.; Su, F.; Yang, H.; Xiao, Y.; Zhang, X.; Su, H.; Zhang, T.; Bai, Y.; Ling, X. E2F1 transcriptionally regulates CCNA2 expression to promote triple negative breast cancer tumorigenicity. Cancer Biomark. 2022, 33, 57–70. [Google Scholar] [CrossRef] [PubMed]
  40. Kreis, N.N.; Moon, H.H.; Wordeman, L.; Louwen, F.; Solbach, C.; Yuan, J.; Ritter, A. KIF2C/MCAK a prognostic biomarker and its oncogenic potential in malignant progression, and prognosis of cancer patients: A systematic review and meta-analysis as biomarker. Crit. Rev. Clin. Lab. Sci. 2024, 61, 404–434. [Google Scholar] [CrossRef] [PubMed]
  41. Avalos, A.; Tietsort, J.T.; Suwankitwat, N.; Woods, J.D.; Jackson, S.W.; Christodoulou, A.; Morrill, C.; Liggitt, H.D.; Zhu, C.; Li, Q.-Z.; et al. Hem-1 regulates protective humoral immunity and limits autoantibody production in a B cell-specific manner. JCI Insight 2022, 7, e153597. [Google Scholar] [CrossRef] [PubMed]
  42. Tuxun, T.; Ma, H.Z.; Apaer, S.; Zhang, H.; Aierken, A.; Li, Y.P.; Lin, R.Y.; Zhao, J.M.; Zhang, J.H.; Wen, H. Expression of Toll-Like Receptors 2 and 4 and Related Cytokines in Patients with Hepatic Cystic and Alveolar Echinococcosis. Mediat. Inflamm. 2015, 2015, 632760. [Google Scholar] [CrossRef] [PubMed]
  43. Yu, L.; Wang, L.; Chen, S. Exogenous or endogenous Toll-like receptor ligands: Which is the MVP in tumorigenesis? Cell Mol. Life Sci. 2012, 69, 935–949. [Google Scholar] [CrossRef] [PubMed]
  44. Pan, W.; Xu, H.-W.; Hao, W.-T.; Sun, F.-F.; Qin, Y.-F.; Hao, S.-S.; Liu, H.; Cao, J.-P.; Shen, Y.-J.; Zheng, K.-Y. The excretory-secretory products of Echinococcus granulosus protoscoleces stimulated IL-10 production in B cells via TLR-2 signaling. BMC Immunol. 2018, 19, 29. [Google Scholar] [CrossRef] [PubMed]
  45. Bakhtiar, N.M.; Spotin, A.; Mahami-Oskouei, M.; Ahmadpour, E.; Rostami, A. Recent advances on innate immune pathways related to host-parasite cross-talk in cystic and alveolar echinococcosis. Parasites Vectors 2020, 13, 232. [Google Scholar] [CrossRef] [PubMed]
Figure 1. HE staining of mouse liver tissue: The arrows indicate the parasitic lesions in the livers of infected mice. (A) 6 weeks after infection with protoscolex; (B) 12 weeks after infection with protoscolex; (C) 19 weeks after infection with protoscolex; (D) 25 weeks after infection with protoscolex.
Genes 16 00839 g001
Figure 2. DEGs identification at different time points. (AD) Volcano plots: (A) 6 weeks; (B) 12 weeks; (C) 19 weeks; (D) 25 weeks; (E) Venn diagram. Red represents upregulation, and green represents downregulation. The Venn diagram depicts the DEGs within each group and highlights the shared DEGs among these groups.
Genes 16 00839 g002
Figure 3. Validation of transcriptome sequencing data by qRT-PCR.
Genes 16 00839 g003
Figure 4. WGCNA analysis. (A) Determination of soft threshold of gene co-expression network. (B) Gene co-expression module hierarchical clustering map. (C) The correlation heatmap for E. multilocularis larvae infection and infection period. (DG) Screening modules for gene co-expression networks and core genes: (D) cyan module; (E) tan module; (F) yellow module; (G) red module.
Genes 16 00839 g004
Disclaimer/Publisher’s Note: The statements, opinions and data contained in all publications are solely those of the individual author(s) and contributor(s) and not of MDPI and/or the editor(s). MDPI and/or the editor(s) disclaim responsibility for any injury to people or property resulting from any ideas, methods, instructions or products referred to in the content.

