Article

Cotton STARD Gene Family: Characterization, Evolution, and Expression Profiles During Salt Stress

1
College of Biology and Food Engineering, Anyang Institute of Technology, Anyang 455000, China
2
College of Plant Protection, Henan Agricultural University, Zhengzhou 450002, China
3
Anyang Institute of Technology/Research Base, State Key Laboratory of Cotton Bio-Breeding and Integrated Utilization, Institute of Cotton Research of Chinese Academy of Agricultural Sciences/National Center of Technology Innovation for Comprehensive Utilization of Saline-Alkali Land, Anyang 455000, China
*
Authors to whom correspondence should be addressed.
These authors contributed equally to this work.
Genes 2025, 16(7), 813; https://doi.org/10.3390/genes16070813
Submission received: 13 June 2025 / Revised: 30 June 2025 / Accepted: 7 July 2025 / Published: 11 July 2025

Abstract

Background: Cotton, a key global economic crop, suffers yield and quality losses due to salt stress. This study aims to analyze the cotton STARD gene family and its role in salt stress responses. Methods: We conducted a genome-wide analysis of the STARD gene family in four cotton species, using phylogenetic trees, chromosomal mapping, and collinearity analyses to explore their evolutionary relationships and expansion mechanisms. We also examined gene structures, conserved motifs, and promoter cis-elements. ResultsSTARD genes are evenly distributed across the four cotton species. Segmental duplication was found to be the main driver of gene expansion, with most pairs undergoing purifying selection. Distinct structural features and potential roles in plant growth and stress responses were identified. Notably, 11 GhSTARD genes showed significant expression changes under salt stress, especially GhSTARD45 in root tissues. Conclusions: This study provides new insights into the function and salt stress response mechanisms of the cotton STARD gene family, suggesting GhSTARD45 plays a key role in root-mediated salt tolerance and highlighting the potential of STARD genes in enhancing cotton’s salt tolerance.

1. Introduction

The STARD protein family members contain a conserved sequence of approximately 210 amino acids, with their core structure being the α/β helix-grip fold [1,2]. Initially discovered in mammals, their hydrophobic cavity can bind lipid ligands and small molecular modules (such as cholesterol, phospholipids, etc.) and mediate lipid transport and signal regulation through non-vesicular pathways [3,4]. This family can be classified into five categories based on domain combinations: HD-START, HD-START-MEKHLA, PH-START-DUF1336, START-DUF1336, and independent START domains [5]. Notably, transcription factors of the HD-Zip gene family (such as HD-Zip III and IV subgroups) are also categorized as STARD members. The HD-Zip III subgroup includes START, HD, and MEKHLA domains, while the HD-Zip IV subgroup contains only START and HD domains [6,7,8].
In plants, STARD family members are extensively involved in growth, development, and stress responses: the Arabidopsis HD-Zip IV subgroup member GL2 regulates trichome development through the HD-START domain, while HD-Zip III subgroup members ATHB-8 and REV participate in vascular bundle differentiation and leaf polarity establishment, respectively [7,8,9,10]. Furthermore, the heterologous expression of Arabidopsis HDG11 (HD-Zip IV) in rice significantly enhances drought tolerance and yield. Arabidopsis AtAPO1 and EDR2 regulate cytoskeletal organization and defense responses via PH-START domains, and AtAPOSTART1 affects seed germination [11,12]. In the plant pathogenic oomycete Phytophthora capsici, the ORP1 protein relies on PH and START domains for subcellular localization, and its deletion leads to pathogen death, suggesting these domains as potential fungicide targets [13,14]. The function of the DUF1336 domain at the carboxy terminus of PH-START proteins remains unclear, but in Phytophthora sojae, it is associated with pathogenicity and may participate in host interaction or lipid metabolism regulation [15].
Recent studies have revealed the dual potential of STARD proteins in plant stress resistance and pathogen control: maize ZmSTARD1 enhances drought tolerance by binding abscisic acid (ABA), while wheat TaSTARD7 maintains cell membrane stability under salt stress by regulating lipid metabolism [16]. The ORP1 protein of Phytophthora infestans hijacks host lipid signaling through the START domain, and small molecule inhibitors targeting this domain can block its infection process [17]. Similarly, the PH-START protein deletion mutant of Pseudoperonospora cubensis loses pathogenicity, providing a molecular target for novel fungicide design [17,18]. In grapes, researchers observed that the expression of STARD genes was induced by salt stress and MeJA treatment. Specifically, VvSTARD5 overexpression resulted in reduced levels of malondialdehyde (MDA) and other stress markers following 24 h of NaCl treatment. Findings from these studies suggest that STARD proteins confer enhanced tolerance under plant stress conditions and may play a critical role in plant defense against abiotic stresses [19].
Cotton provides commercially valuable fibers essential for the textile, paper, and pharmaceutical industries [20,21]. Salt stress severely impacts cotton by reducing fiber yield and quality, posing a significant economic threat [22,23,24]. This study systematically characterized the STARD gene family across four cotton cultivars using the latest genome assembly, identifying 46–93 STARD genes per variety. Bioinformatic analyses revealed gene structures, subcellular localization predictions, and chromosomal distributions. Phylogenetic and motif analyses, combined with comparative genomics, classified these genes and identified conserved motifs. Evolutionary relationships were explored through collinearity and selective pressure analyses, while promoter analyses have predicted potential transcription factor interactions. Transcriptomic data mining identified salt-responsive GhSTARD candidates, validated by qRT-PCR showing tissue-specific expression of GhSTARD45. Protein–protein interaction networks further predicted functional associations. This work provides a foundation for cotton STARD research and genetic resources for improving salt tolerance.

2. Materials and Methods

2.1. Identification of STARD Genes in Cotton

Genome assemblies for Gossypium arboreum (CRI v1.0), Gossypium raimondii (JGI v2.0), Gossypium hirsutum (HAU v1.1), and Gossypium barbadense (ZJU v1.1) were obtained. The Arabidopsis thaliana, Theobroma cacao, Vitis vinifera and Oryza sativa genome was obtained from Phytozome (https://phytozome.jgi.doe.gov/pz/portal.html, accessed on 10 March 2025). HMM profiles for (PF01852) START domains were downloaded from Pfam (https://pfam.xfam.org/accessed on 10 March 2025). HMMER v3.0 software (http://www.hmmer.org/) was employed with an e-value threshold of 1 × 10⁻⁵ to identify candidate STARD proteins containing these domains. Putative STARDs were validated via Pfam motif scanning for further analysis. Transmembrane domains were predicted using TMHMM Server v2.0 (http://www.cbs.dtu.dk/services/TMHMM/, accessed on 10 March 2025 ). Biochemical parameters (pIs, MWs, GRAVY scores, charges) and exon–intron structures of G.hirsutum STARDs were extracted from CottonFGD. The subcellular localization of GhSTARD proteins was predicted using WOLF-PSORT (https://wolfpsort.hgc.jp/) [25].

2.2. Sequence Alignment and Phylogenetic Analysis

Full-length amino acid sequences of STARDs from G. hirsutum, G. arboreum, G. raimondii, G. barbadense, and other plants were aligned with ClustalW (https://www.genome.jp/tools-bin/clustalw, accessed on 10 March 2025) using default parameters. Maximum likelihood (ML) phylogenetic trees were constructed in MEGA X (Version 10.1.8, accessed on 10 March 2025) with 1000 bootstrap replicates under the Poisson model and visualized using EvolView (https://www.evolgenius.info/evolview, accessed on 12 March 2025) [26,27].

2.3. Chromosomal Locations of STARDs from Four Types of Cotton

Genomic, CDS, and GFF data for all four cotton species were obtained from CottonFGD. Physical chromosome positions of STARDs were mapped using TBtools (V1.098) [28].

2.4. Gene Duplication and Synteny Analysis in Different Cotton Types

Synteny blocks among G. hirsutum, G. arboreum, G. raimondii, and G. barbadense were identified using MCScanX [29] and visualized with Circos (http://circos.ca/, accessed on 10 July 2021) [26].

2.5. Calculation of Selection Pressure

Homologous gene pairs across the four cotton species were defined using MCScanX [29]. Selection pressure was assessed by calculating Ka/Ks ratios with KaKs_Calculator 3.0 [30].

2.6. Analysis of the Conserved Protein Motifs and Gene Structure

Gene structures (exons/introns) of GhSTARDs were visualized using GSDS (http://gsds.gao-lab.org/). Conserved protein motifs were identified via MEME with the following parameters: motif width 6–200 residues, maximum motifs = 20, and distribution = 0/1. The results were integrated with phylogenetic trees and G.hirsutum GFF3 data using TBtools [28].

2.7. Analysis of STARDs Promoter Regions

Promoter sequences (2000 bp upstream of TSS) of GhSTARDs were extracted from CottonFGD. Cis-regulatory elements were predicted using HOMER (http://homer.ucsd.edu/homer/) [31].

2.8. Gene Expression Pattern Analysis

Expression data were normalized using FPKM. GhSTARDs with FPKM > 1 or log2 (1 + FPKM) > 1 in the ≥1 stage were considered expressed. Tissue specificity was analyzed using a Python (Version 3.11.3, accessed on 10 March 2025) script. Heatmaps were generated using pheatmap.

2.9. RNA Extraction and RT qPCR Analysis

Total RNA was extracted with a Solarbio Kit (R1200) and reverse transcribed using PrimeScript™ II (TAKARA). RT-qPCR was performed with Vazyme Taq Pro Universal SYBR qPCR Master Mix (Q712-02) on a CFX96 system [32,33]. Data were analyzed via the 2−ΔΔCT method using GhHis3 as the reference. Primers were designed with Primer3 and synthesized by Sangon Biotech [34]. Two cotyledon with one true leaf stage seedlings of upland cotton (G. hirsutum) varieties were subjected to the following treatment. The NaCl solution used had a concentration of 200 mmol/L. The seedlings were initially cultivated in a growth chamber using a 1:1 mixture of nutrient soil and vermiculite as the growing medium. The growth conditions in the chamber were set at 28 °C during the day and 25 °C at night with a 12 h photoperiod. For the treatment, the seedlings were gently removed from the growing medium by soaking them in water, and their roots were thoroughly rinsed to clean off any remaining soil. Excess moisture was then blotted away with absorbent paper. The cleaned seedlings were subsequently placed in conical flasks, with the liquid level in the flasks set to rise above the roots of the seedlings.

2.10. Protein–Protein Interaction (PPI) Analysis

To decipher the functional interactions among candidate genes, protein–protein interaction (PPI) networks were constructed using the STRING database (v12.0) (https://cn.string-db.org/). Relevant gene-encoded proteins were submitted to STRING’s “multiple proteins” mode, employing default parameters.

3. Results

3.1. Identification of the STARD Proteins in Cotton

In this study, we identified 93, 93, 48, and 46 full-length STARD family genes from G. hirsutum (allotetraploid cotton), G. barbadense (allotetraploid cotton), G. arboreum (diploid cotton), and G. raimondii (diploid cotton), respectively. A structural analysis confirmed that the STAR-AP subfamily proteins contain a conserved STARD-trans domain, while the STARC subfamily sequences feature one or more STAR_permease or STAR_permease_2 motifs. Notably, the CAT subgroup within the STARC subfamily uniquely possesses a STAR_permease_C signature domain [35]. The identified STARD members across the four cotton species were systematically named based on their chromosomal positions. For cross-species comparability, GhSTARD genes were additionally annotated according to their phylogenetic relationships with A. thaliana, T. cacao, V. vinifera, and O. sativa homologs. Prefixes Gh, Gb, Ga, Gr, At, Os, Tc, and Vv denote genes from G. hirsutum, G. barbadense, G. arboreum, G. raimondii, A. thaliana, O. sativa, T. cacao, and V. vinifera, respectively, with detailed annotations provided in Table S1.
The comprehensive characterization of G. hirsutum STARD members included genomic architecture metrics (genomic length, CDS length, and chromosomal localization), protein properties (amino acid length, isoelectric point, and molecular weight), and structural features (transmembrane domains). As shown in Table S1, the GhSTARD proteins exhibited substantial size variation, ranging from 114 residues (GhSTARD5 on Ghir_A02) to 980 residues (GhSTARD37 on Ghir_A10). The calculated isoelectric points spanned from 5.33 (GhSTARD30) to 9.68 (GhSTARD4), while the molecular weight was between 12.2 (GhSTARD5) and 93.78 (GhSTARD37). Subcellular localization predictions unanimously indicated that all GhSTARD proteins are distributed in several locations, including the chloroplast, cytoplasm, extracellular space, nucleus, vacuole, and plasma membrane-related or cytoplasmic fluid (Table S1).

3.2. Phylogenetic Analysis of STARD Gene Family in Cotton

To investigate the evolutionary relationships of STARD genes in cotton, we performed a multiple sequence alignment of all STARD protein sequences from Arabidopsis thaliana, Oryza sativa, Theobroma cacao, Vitis vinifera, and cotton using the maximum likelihood (ML) method in MEGA X software. A rooted phylogenetic tree was subsequently constructed. Based on existing research on the STARD family in other organisms, STARD members were classified into four major subfamilies. Group 1 comprises 89 genes, Group 2 contains the highest number of genes (147), Group 3 has the fewest (68), and Group 4 includes 80 genes. Within these four groups, the distribution of STARD genes across the four cotton species Ga, Gr, Gb, and Gh is nearly uniform. In Group 1, which has the fewest genes, there are 9, 9, 16, and 16 genes from Ga, Gr, Gb, and Gh, respectively, whereas in Group 4, which has the largest number, there are 14, 17, 34, and 34 genes from these species (Figure 1). Furthermore, we calculated the correlation of STARD gene numbers across species within each subgroup. The average correlation across different groups was found to be 0.95, indicating a relatively stable evolution of STARD genes in each species.

3.3. Chromosomal Localization of Cotton STARD Genes

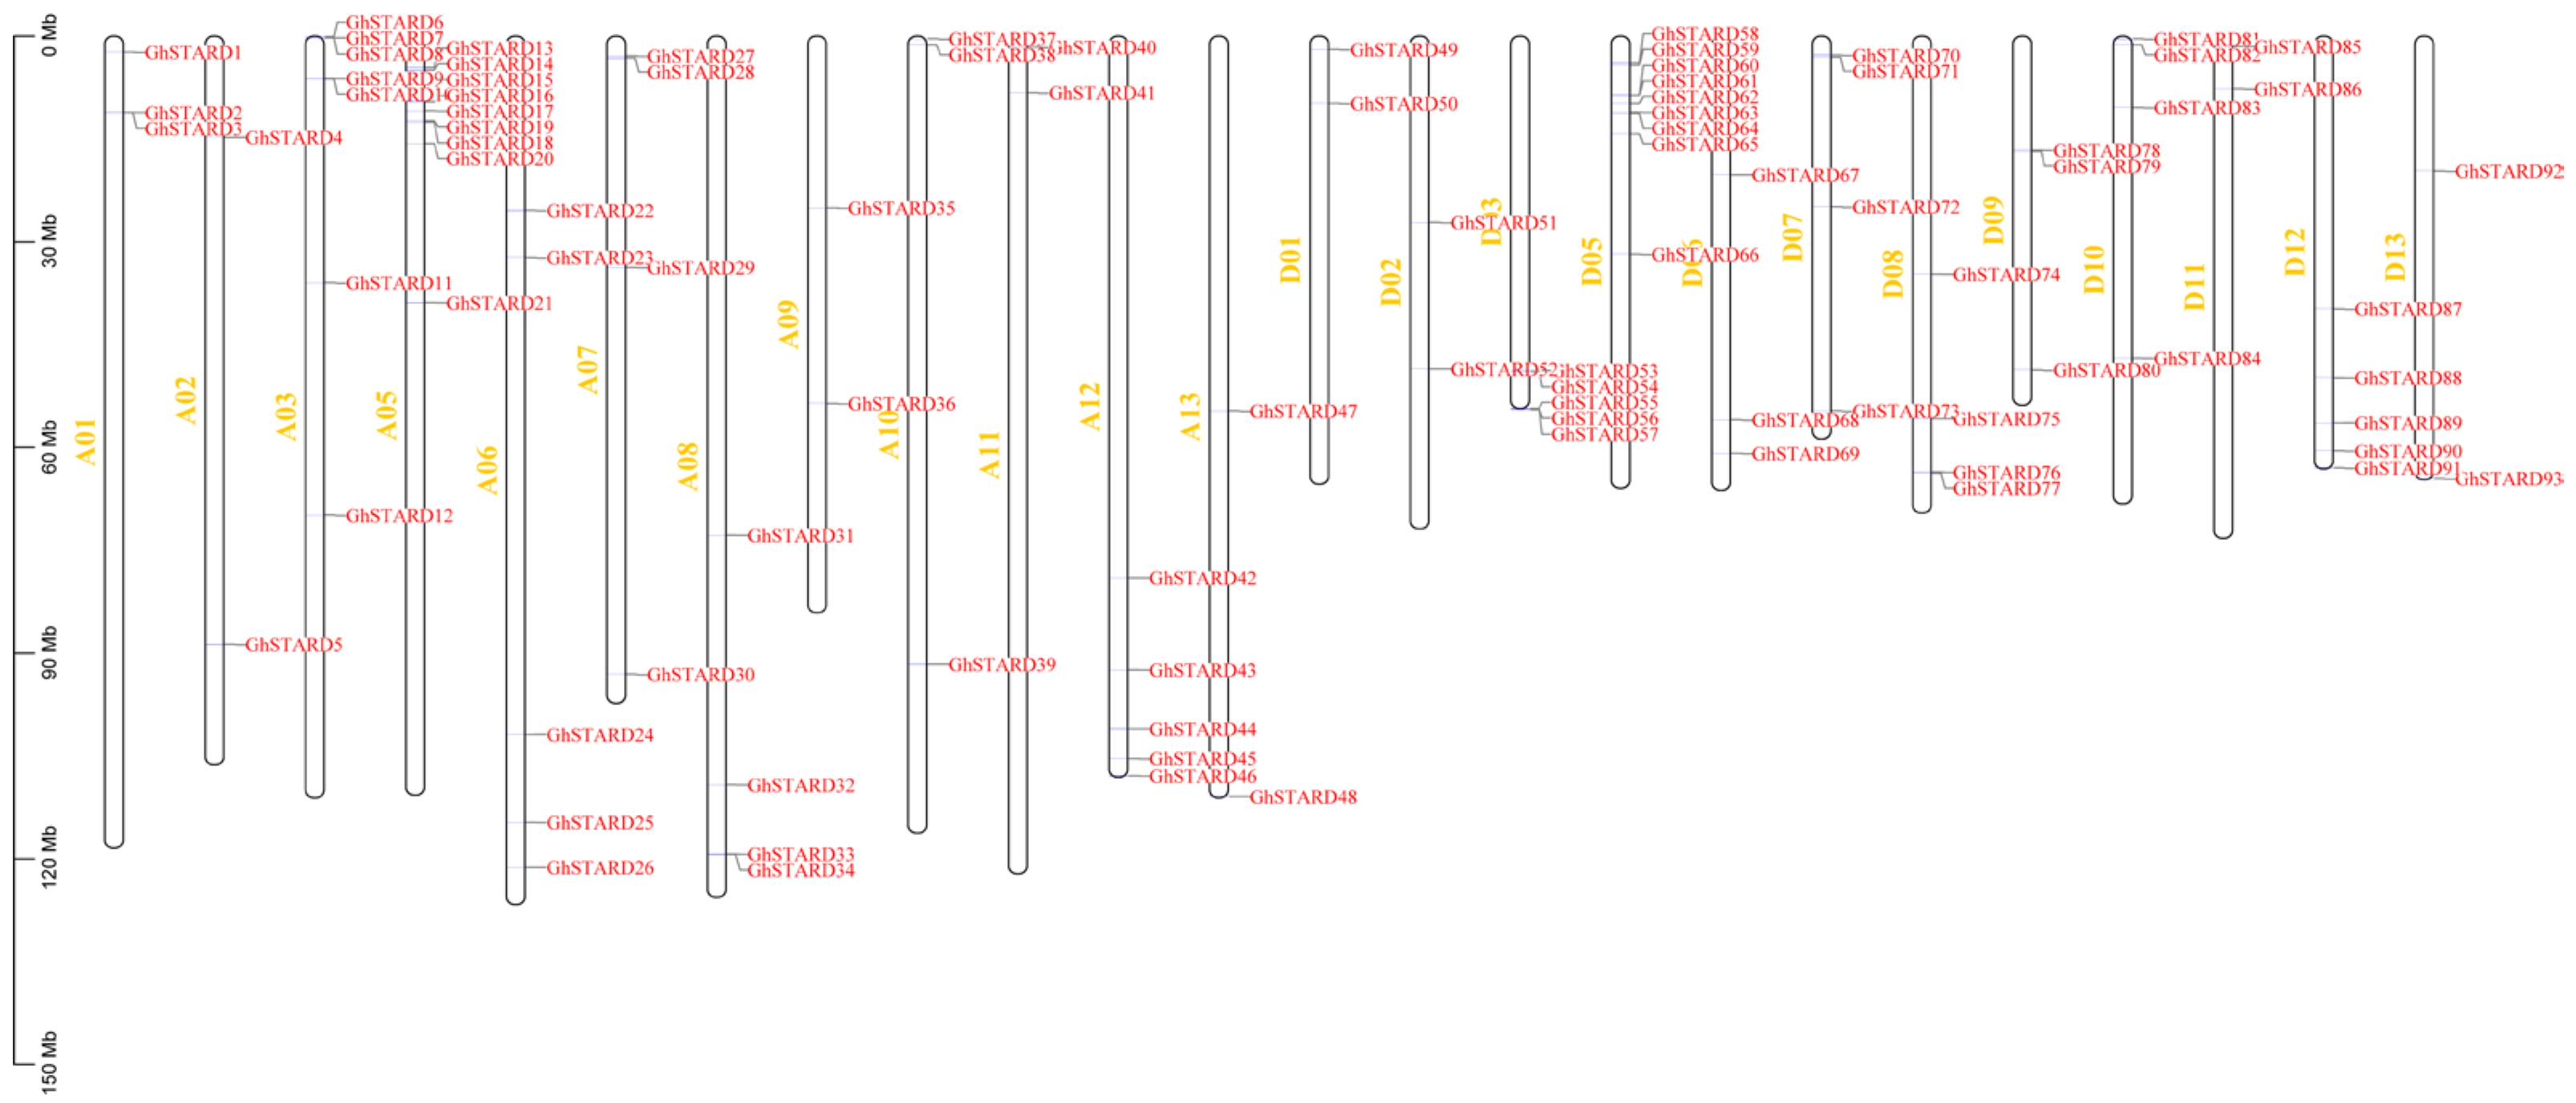
To elucidate the genomic organization patterns of STARD family genes in cotton, we conducted comprehensive chromosomal mapping of 280 STARD members across two allotetraploids (G. hirsutum and G. barbadense) and two diploids (G. raimondii and G. arboreum). In G. hirsutum, 93 STARD genes exhibited balanced subgenomic distribution: 48 localized to the Gh-A subgenome (12 chromosomes) and 45 to Gh-D (12 chromosomes), maintaining a near 1:1 allocation ratio, with no distribution observed on chromosome 4 (Figure 2). Chromosomal occupancy varied significantly, with maximum density on Gh-A05 (9 genes) and Gh-D05 (9 genes), contrasting with minimal representation on Gh-A02,09,11 and 13 (2) and Gh-D01,02,11 and 13 (2). Notably, all homologous chromosome pairs exhibited equivalent gene counts between subgenomes (Figure 2).
A parallel analysis of G. barbadense revealed 93 STARD genes positioned across 25 chromosomes, with subgenomic partitioning of 48 in Gb-A and 45 in Gb-D. Chromosomal distribution patterns mirrored those of G. hirsutum, with Gb-A05 harboring peak density (nine genes) versus minimal occupancy (one gene) on Gb-A02. A diploid analysis showed G. arboreum (48 STARDs) distributing across 11 chromosomes, while G. raimondii (46 STARDs) demonstrated skewed chromosomal allocation, with chromosome 9 containing 10 genes versus chromosome 13 holding only 2. A comparative subgenomic alignment between tetraploid cotton lineages and their diploid progenitors confirmed conserved chromosomal distribution patterns across evolutionary strata.

3.4. Collinearity Analysis and Selective Pressure Analysis

The evolution of gene families has primarily undergone three processes: whole-genome duplication or polyploidization, segmental duplication, and transposed duplication. These processes serve as the major driving forces behind the formation and evolution of gene families. Based on the open reading frame (ORF) sequences of all genes in each species, an analysis was conducted on the STARD family genes of four types of cotton to determine gene duplication and collinearity relationships.
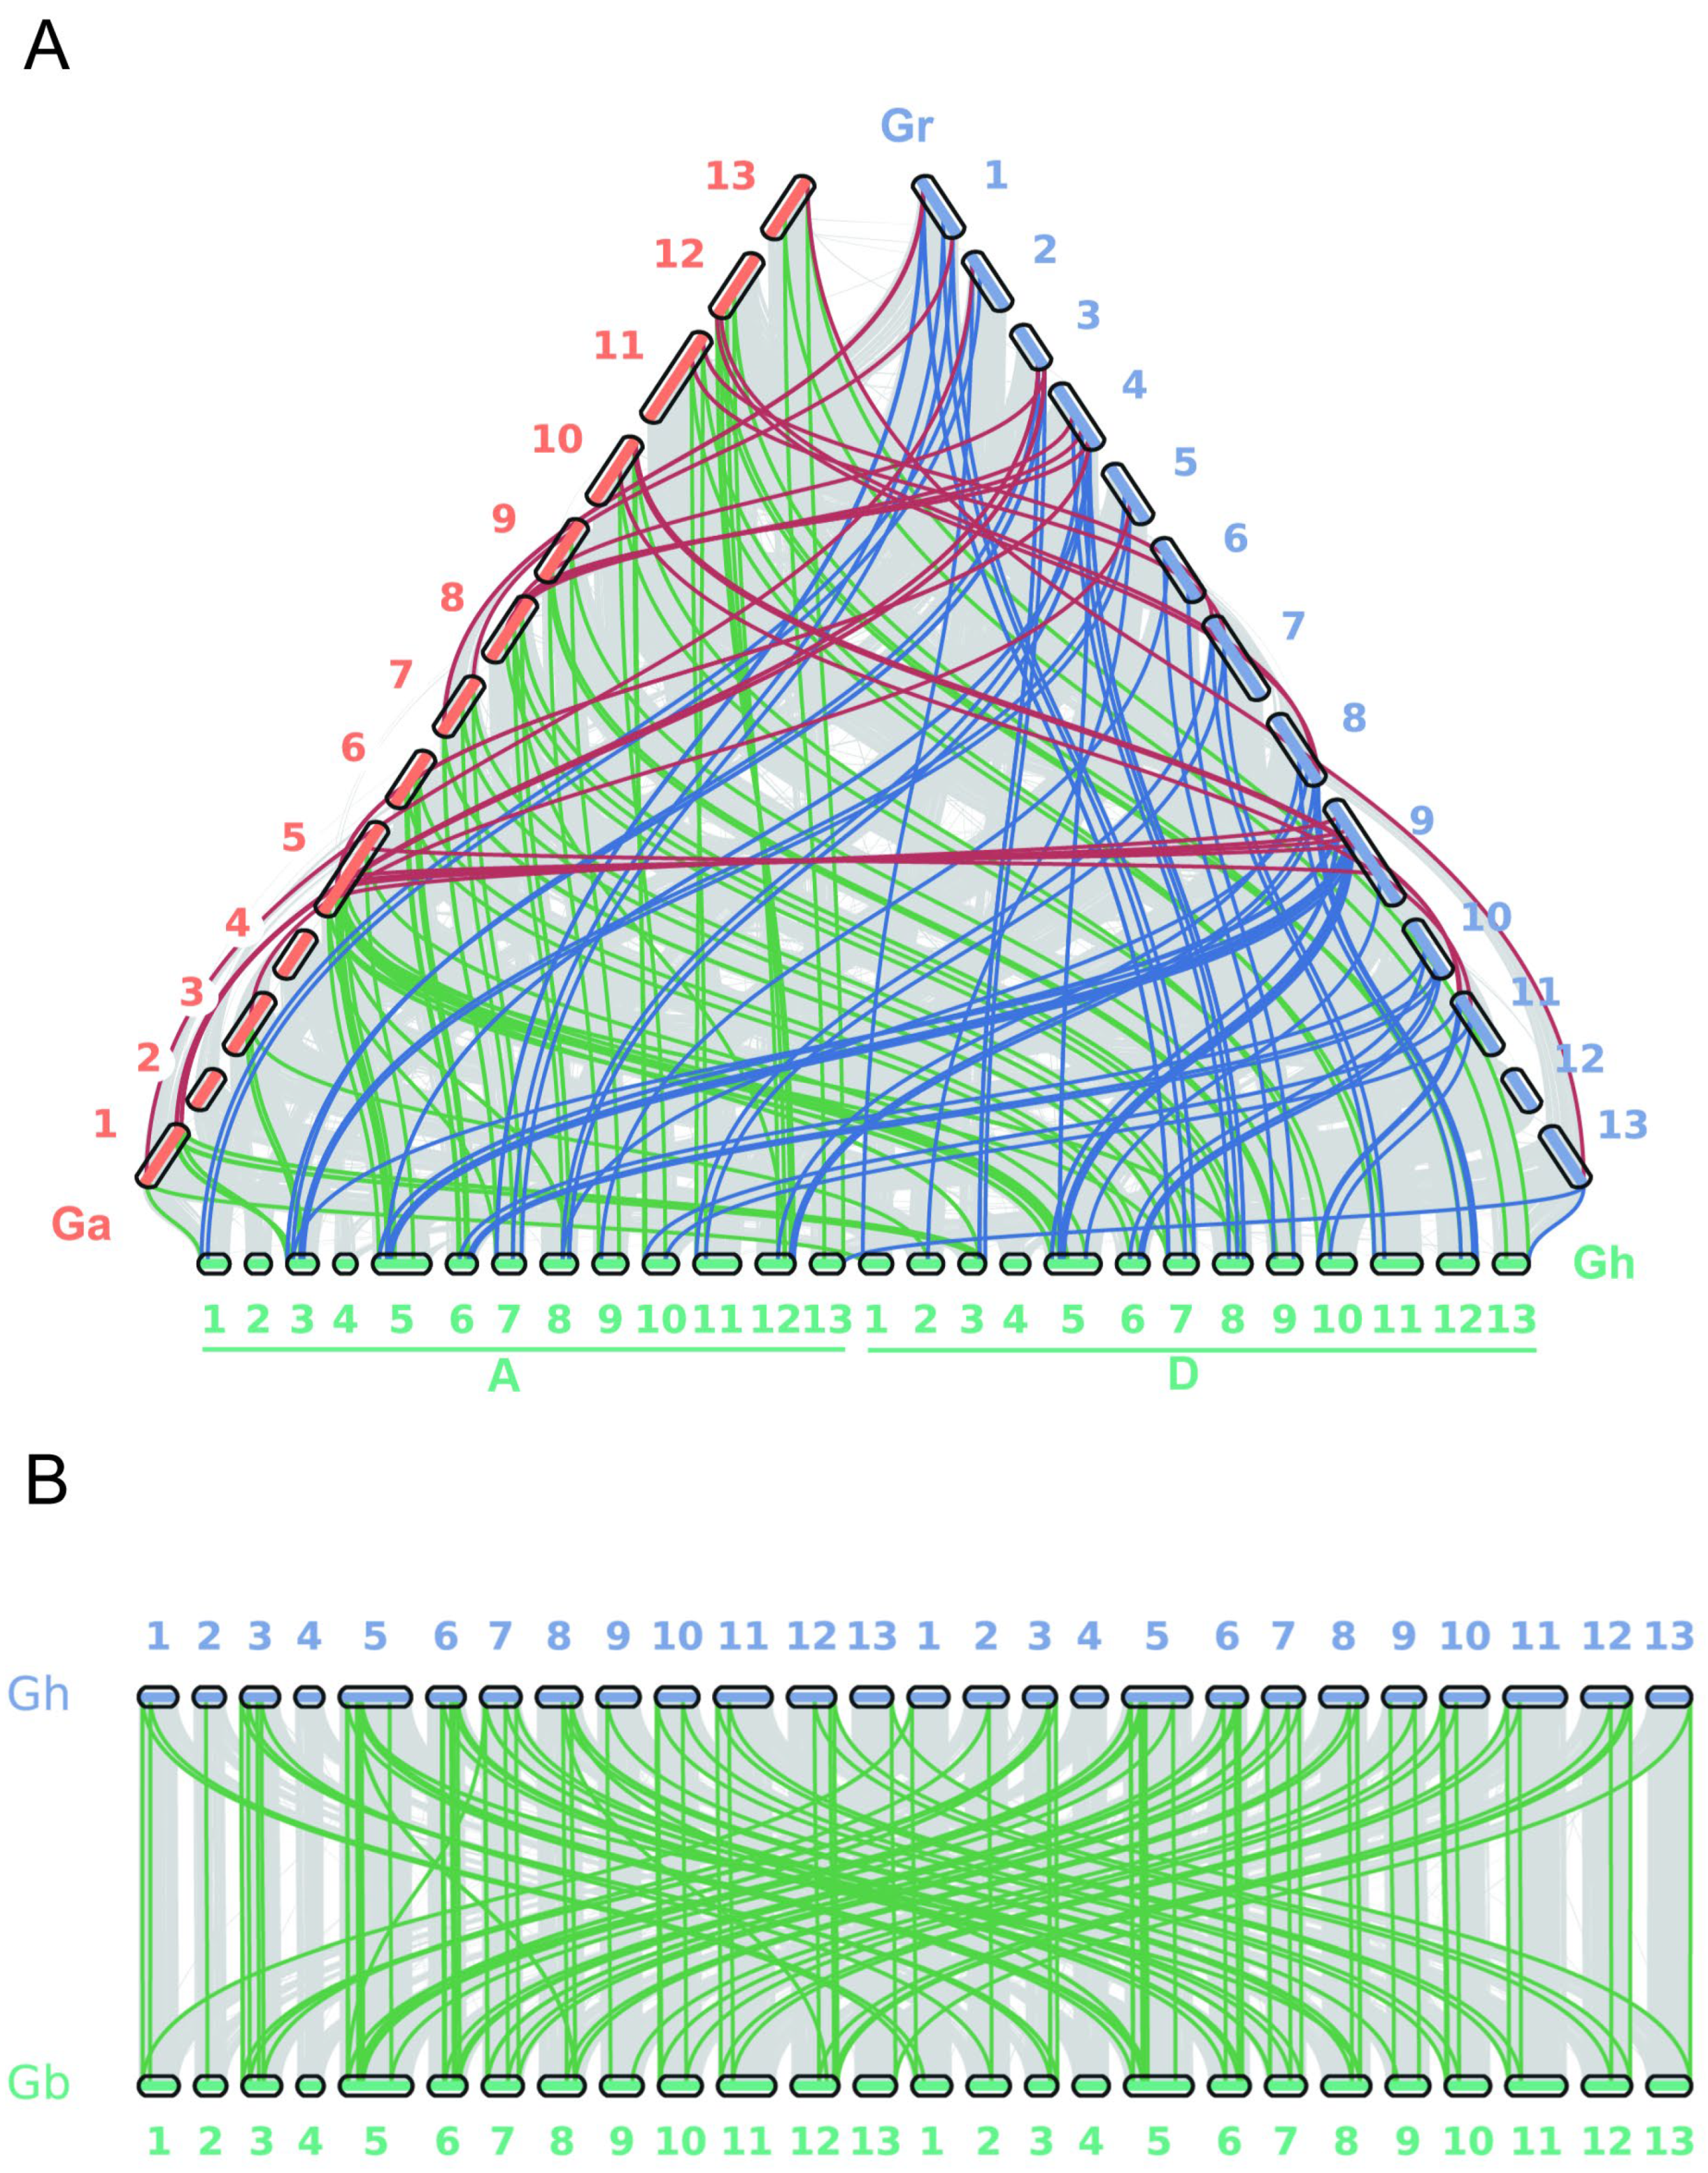
In G. hirsutum, G. barbadense, G. arboreum, and G. raimondii, 129, 126, 34, and 32 pairs of genes with segmental duplication were identified, respectively. Additionally, three, two, four, and one pair of transposed duplicated genes was found in each of these four cotton species. Furthermore, one pair of tandemly duplicated genes was identified in both G. arboreum and G. raimondii. All these findings indicate that both segmental duplication and transposed duplication have played crucial roles in the expansion of STARD family proteins in G. hirsutum, G. barbadense, G. arboreum, and G. raimondii, with segmental duplication being predominantly present across these four cotton species. Moreover, the distribution of whole-genome duplicated gene pairs among these four cotton species is illustrated in Figure 3 and Table S2.
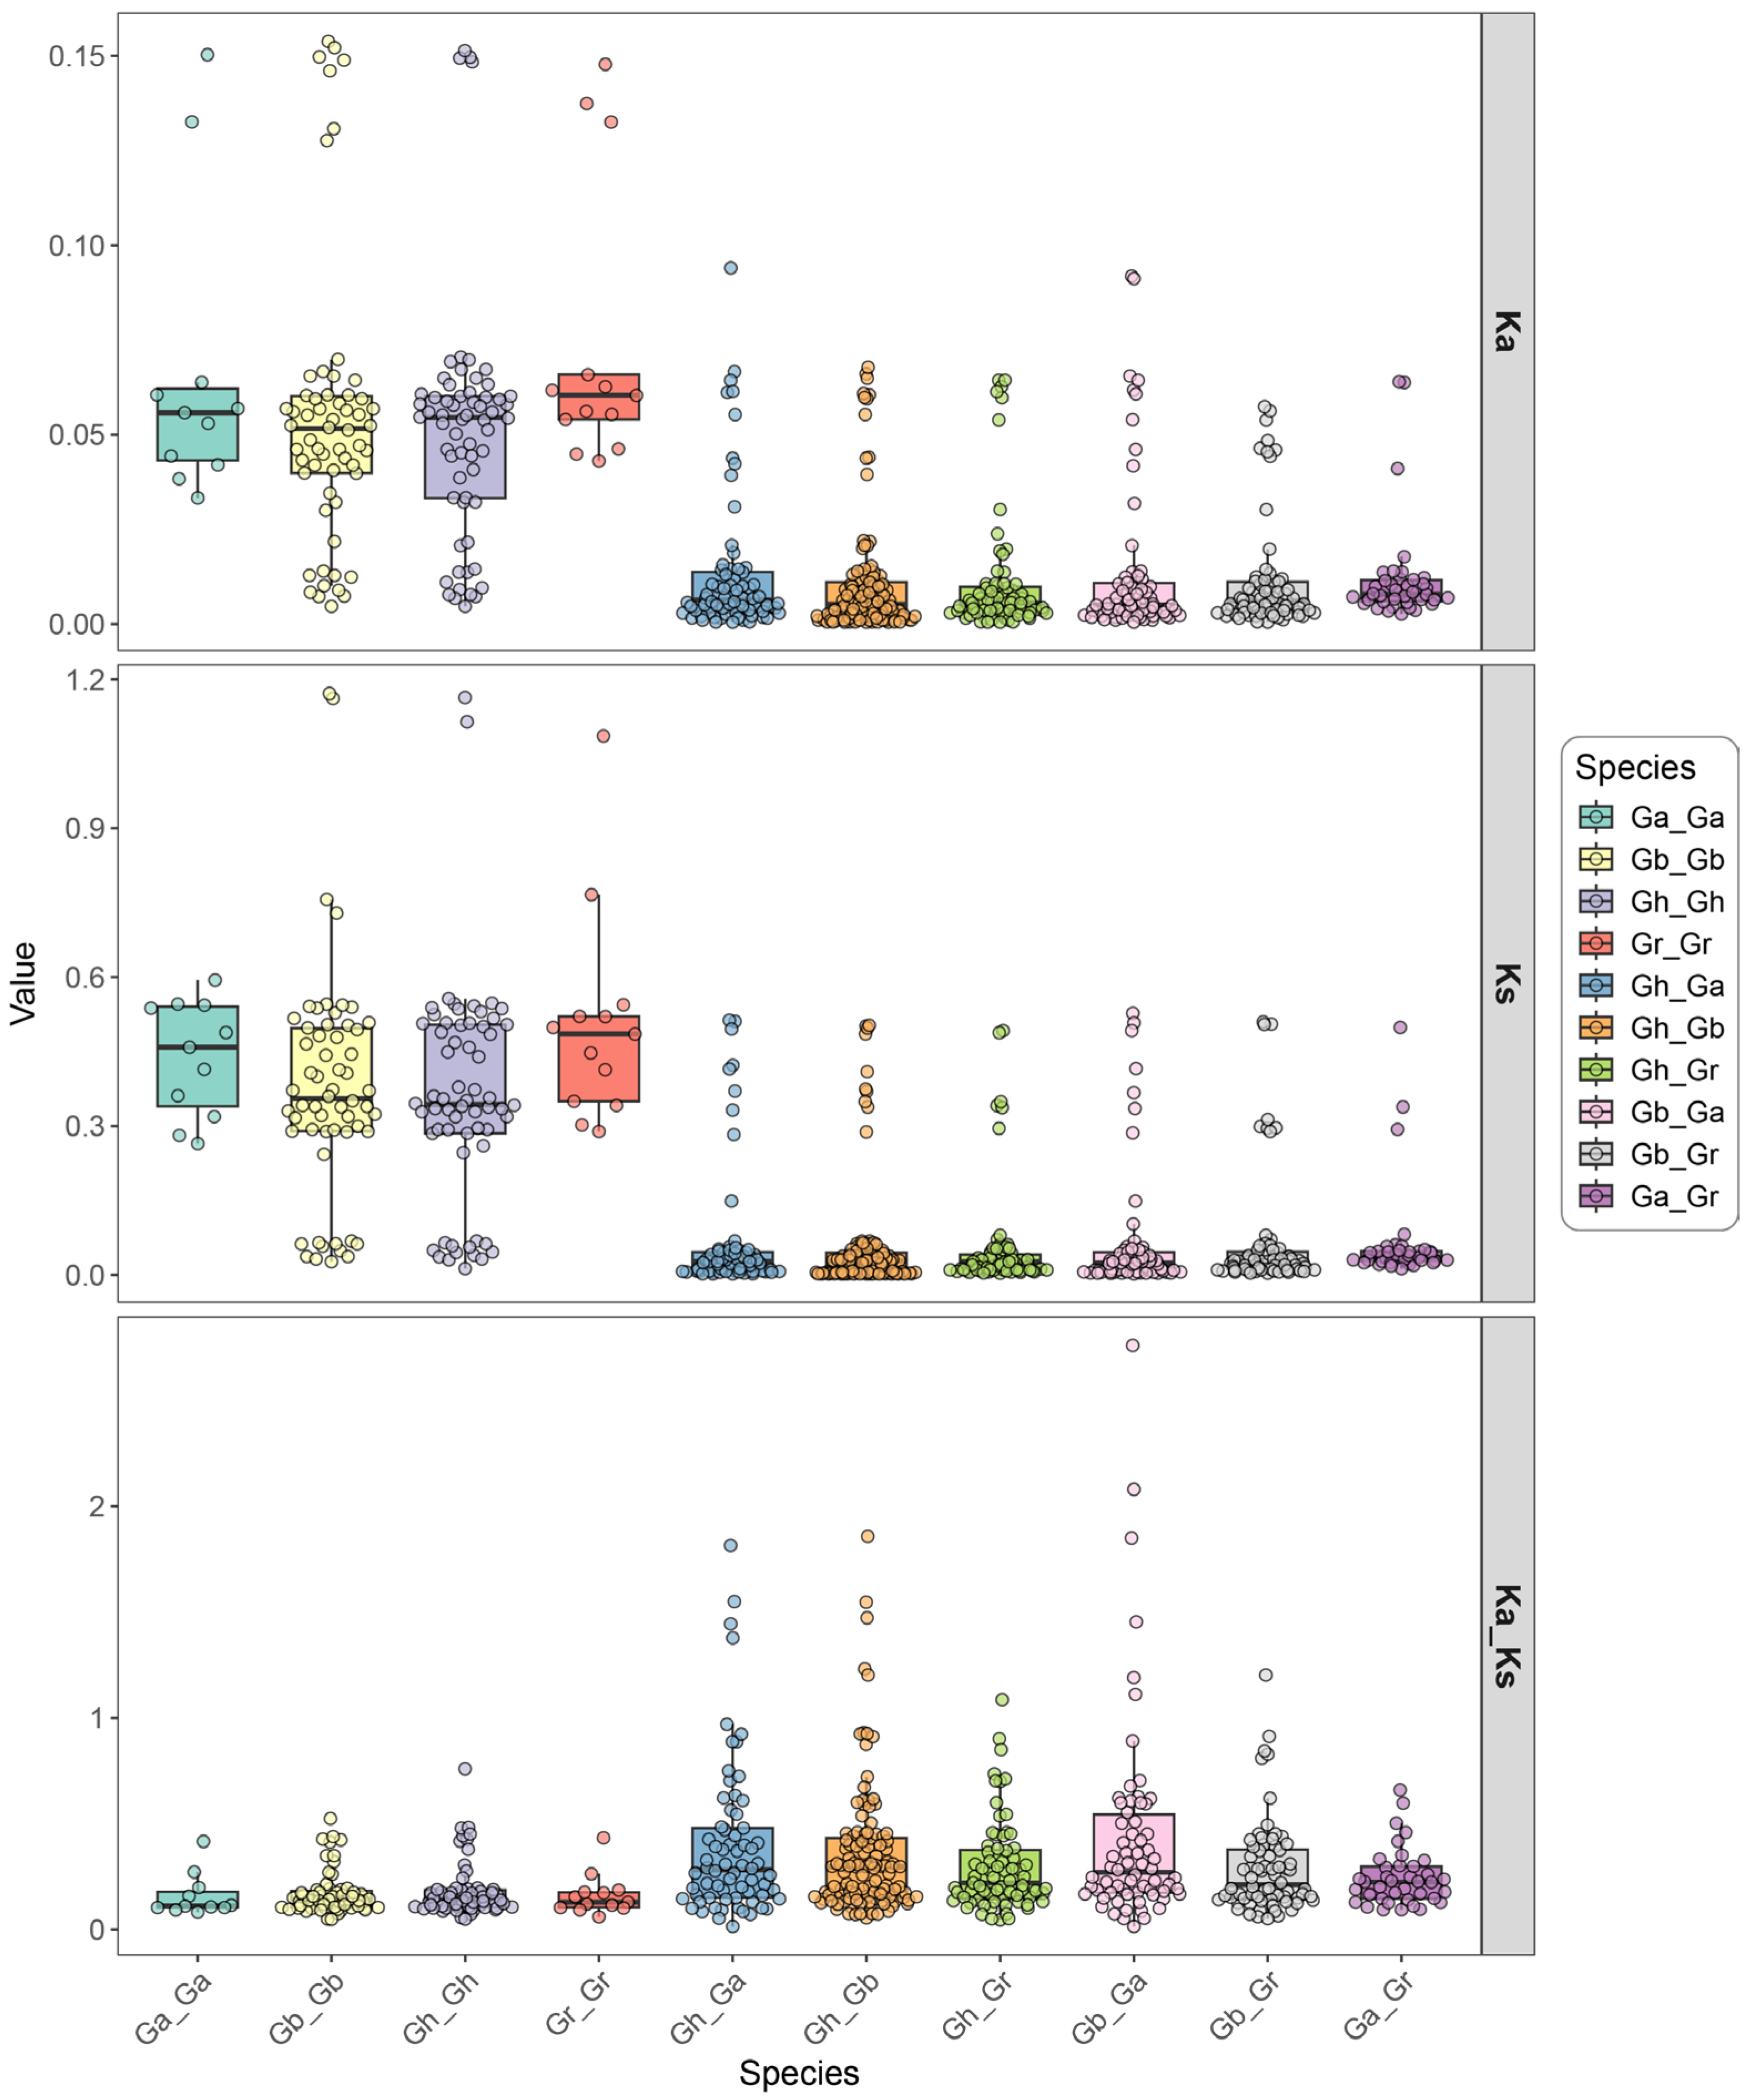
The ratio of non-synonymous (Ka) to synonymous (Ks) substitution rates (Ka/Ks) serves as a valuable metric for evaluating sequence divergence in protein-coding genes across species or taxa with uncertain phylogenetic relationships. This ratio reflects the selective pressures acting on homologous genes: Ka/Ks > 1 indicates positive selection, Ka/Ks = 1 suggests neutral evolution, and Ka/Ks < 1 implies purifying selection (Figure 4).
Within allotetraploid Gh, Ka/Ks values for STARD paralogous gene pairs ranged from 0.05–0.76, with no pairs exceeding 1. In interspecific comparisons among allotetraploid cotton species, 5/141 (3.55%) STARD orthologous gene pairs between G. hirsutum and G. barbadense exhibited Ka/Ks > 1, including one pair with Ka/Ks > 1.8, while the remaining values ranged from 0.01–0.99. For G. hirsutum vs. diploid G. arboreum, 5/71 (5.63%) STARD orthologs showed Ka/Ks > 1 (0–0.93 range for others), and 1/73 (1.37%) G. hirsutum vs. G. raimondii STARD orthologs exceeded Ka/Ks = 1 (0–0.90 range otherwise) (Figure 4 and Table S3).
Comparisons between allotetraploid and diploid species revealed 8/153 (5.23%) G. barbadense vs. G. arboreum STARD orthologs with Ka/Ks > 1 (0–0.97 otherwise) and 1/73 (1.37%) G. barbadense vs. G. raimondii STARD orthologs exceeding Ka/Ks = 1 (0–0.91 range). Within allotetraploid G. barbadense, STARD paralogs displayed Ka/Ks values between 0.05–0.52. Among diploid comparisons, G. arboreum vs. G. raimondii STARD orthologs showed Ka/Ks values from 0–0.66, while G. arboreum STARD paralogs ranged 0.08–0.42 and G. raimondii STARD paralogs ranged 0.06–0.43 (Table S3).

3.5. Structure Analysis of Cotton STARD Genes

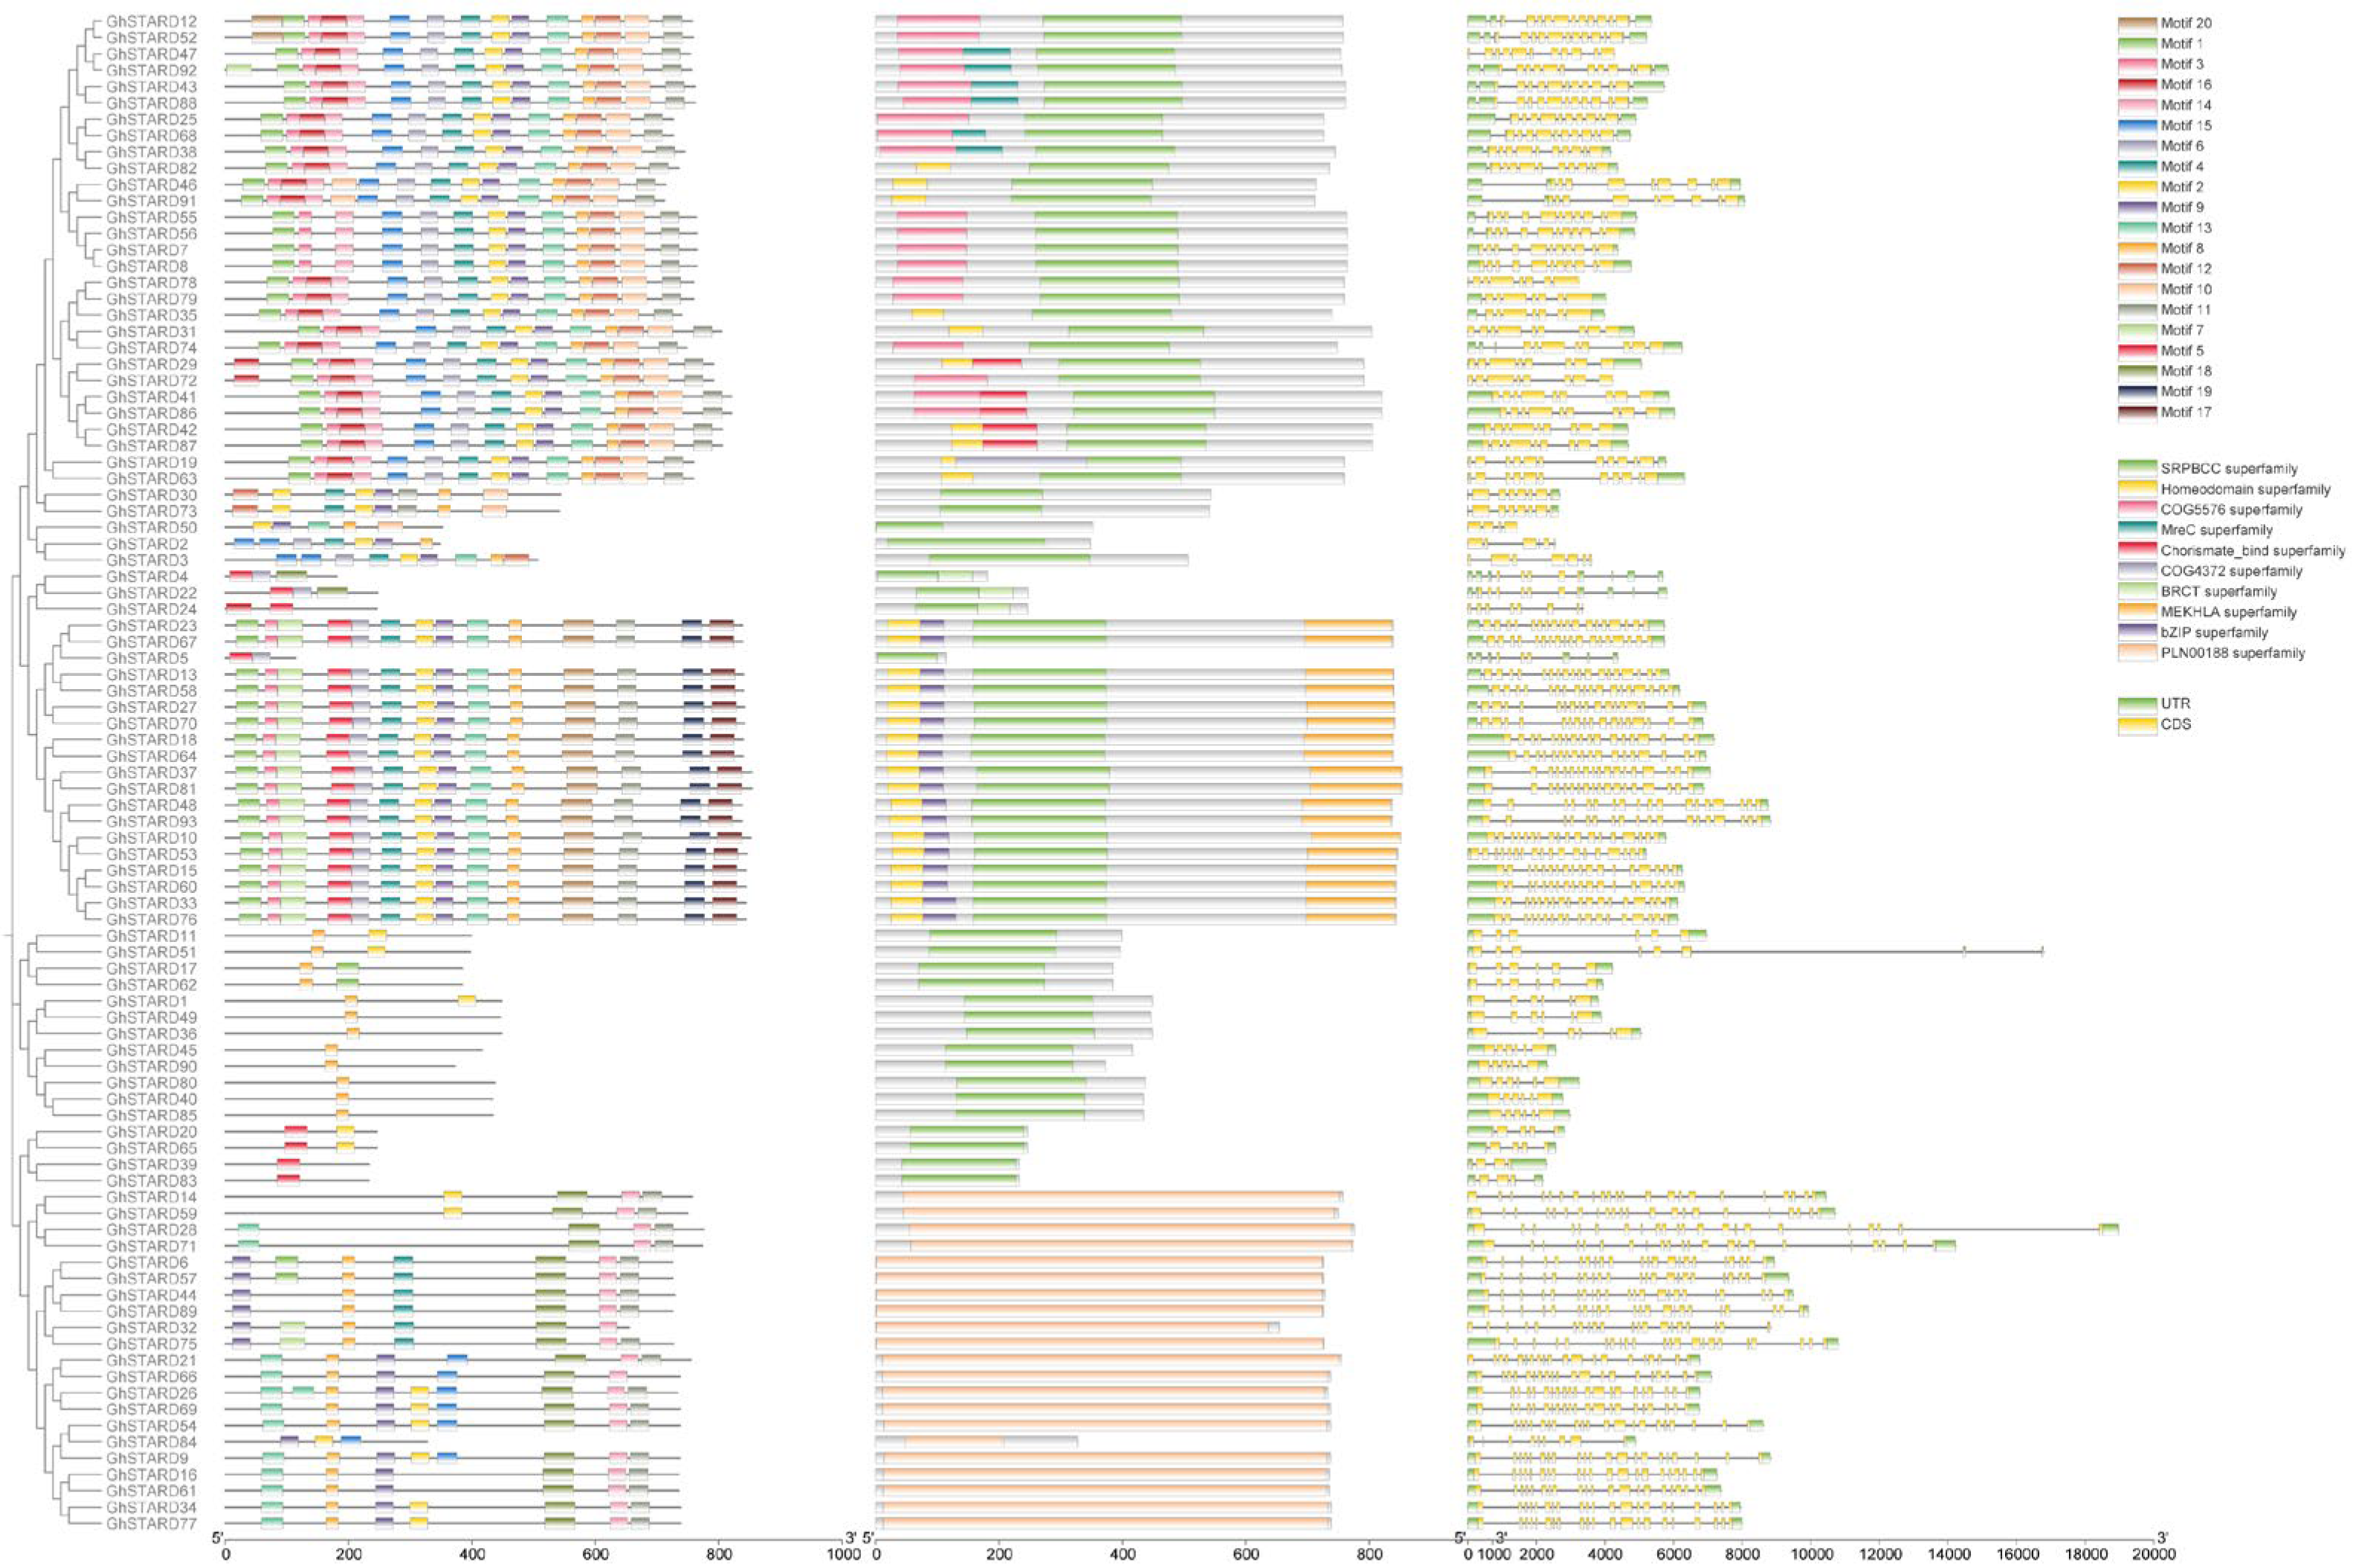
During the evolution of gene families, the diversification of protein domains serves as the foundation for the emergence of novel protein functions, enabling organisms to adapt to environmental changes. To investigate the evolutionary dynamics of the GhSTARD gene family, we conducted a comprehensive analysis of protein domain architectures and conserved motifs. Using the MEME suite(Version 5.5.8 https://meme-suite.org/meme/ accessed on 10 March 2025)., we identified 20 potential motifs within GhSTARD members. These motifs exhibited a non-random distribution across the 93 GhSTARD sequences, showing variability between evolutionary clades. Clade1 predominantly contains motif1, motif3, and motif15, with most members harboring the COG5576 superfamily domain, while some additionally possess MreC superfamily or Chorismate_bind superfamily domains. Clade2 is characterized by unique motifs 17, 19, and 20, which likely underpin their distinct functional characteristics, and all members of this clade contain the MEKHLA superfamily domain. Clade3 represents the most motif-depleted group, containing only motifs 2, 5, 7, and 8. Clade4 exhibits a unique motif 18 signature and is associated with the PLN00188 superfamily (Figure 5).
Furthermore, we explored the structural diversity of GhSTARD genes. The exon–intron distribution pattern correlates with gene phylogeny, and our analysis revealed that GhSTARD exons range in length from 5 to 766 bp. While exon counts vary across clades, most GhSTARD members within the same clade exhibit conserved exon–intron architectures, reflecting their evolutionary relationships.

3.6. Cis-Element Analysis of GhSTARD Gene Promotors

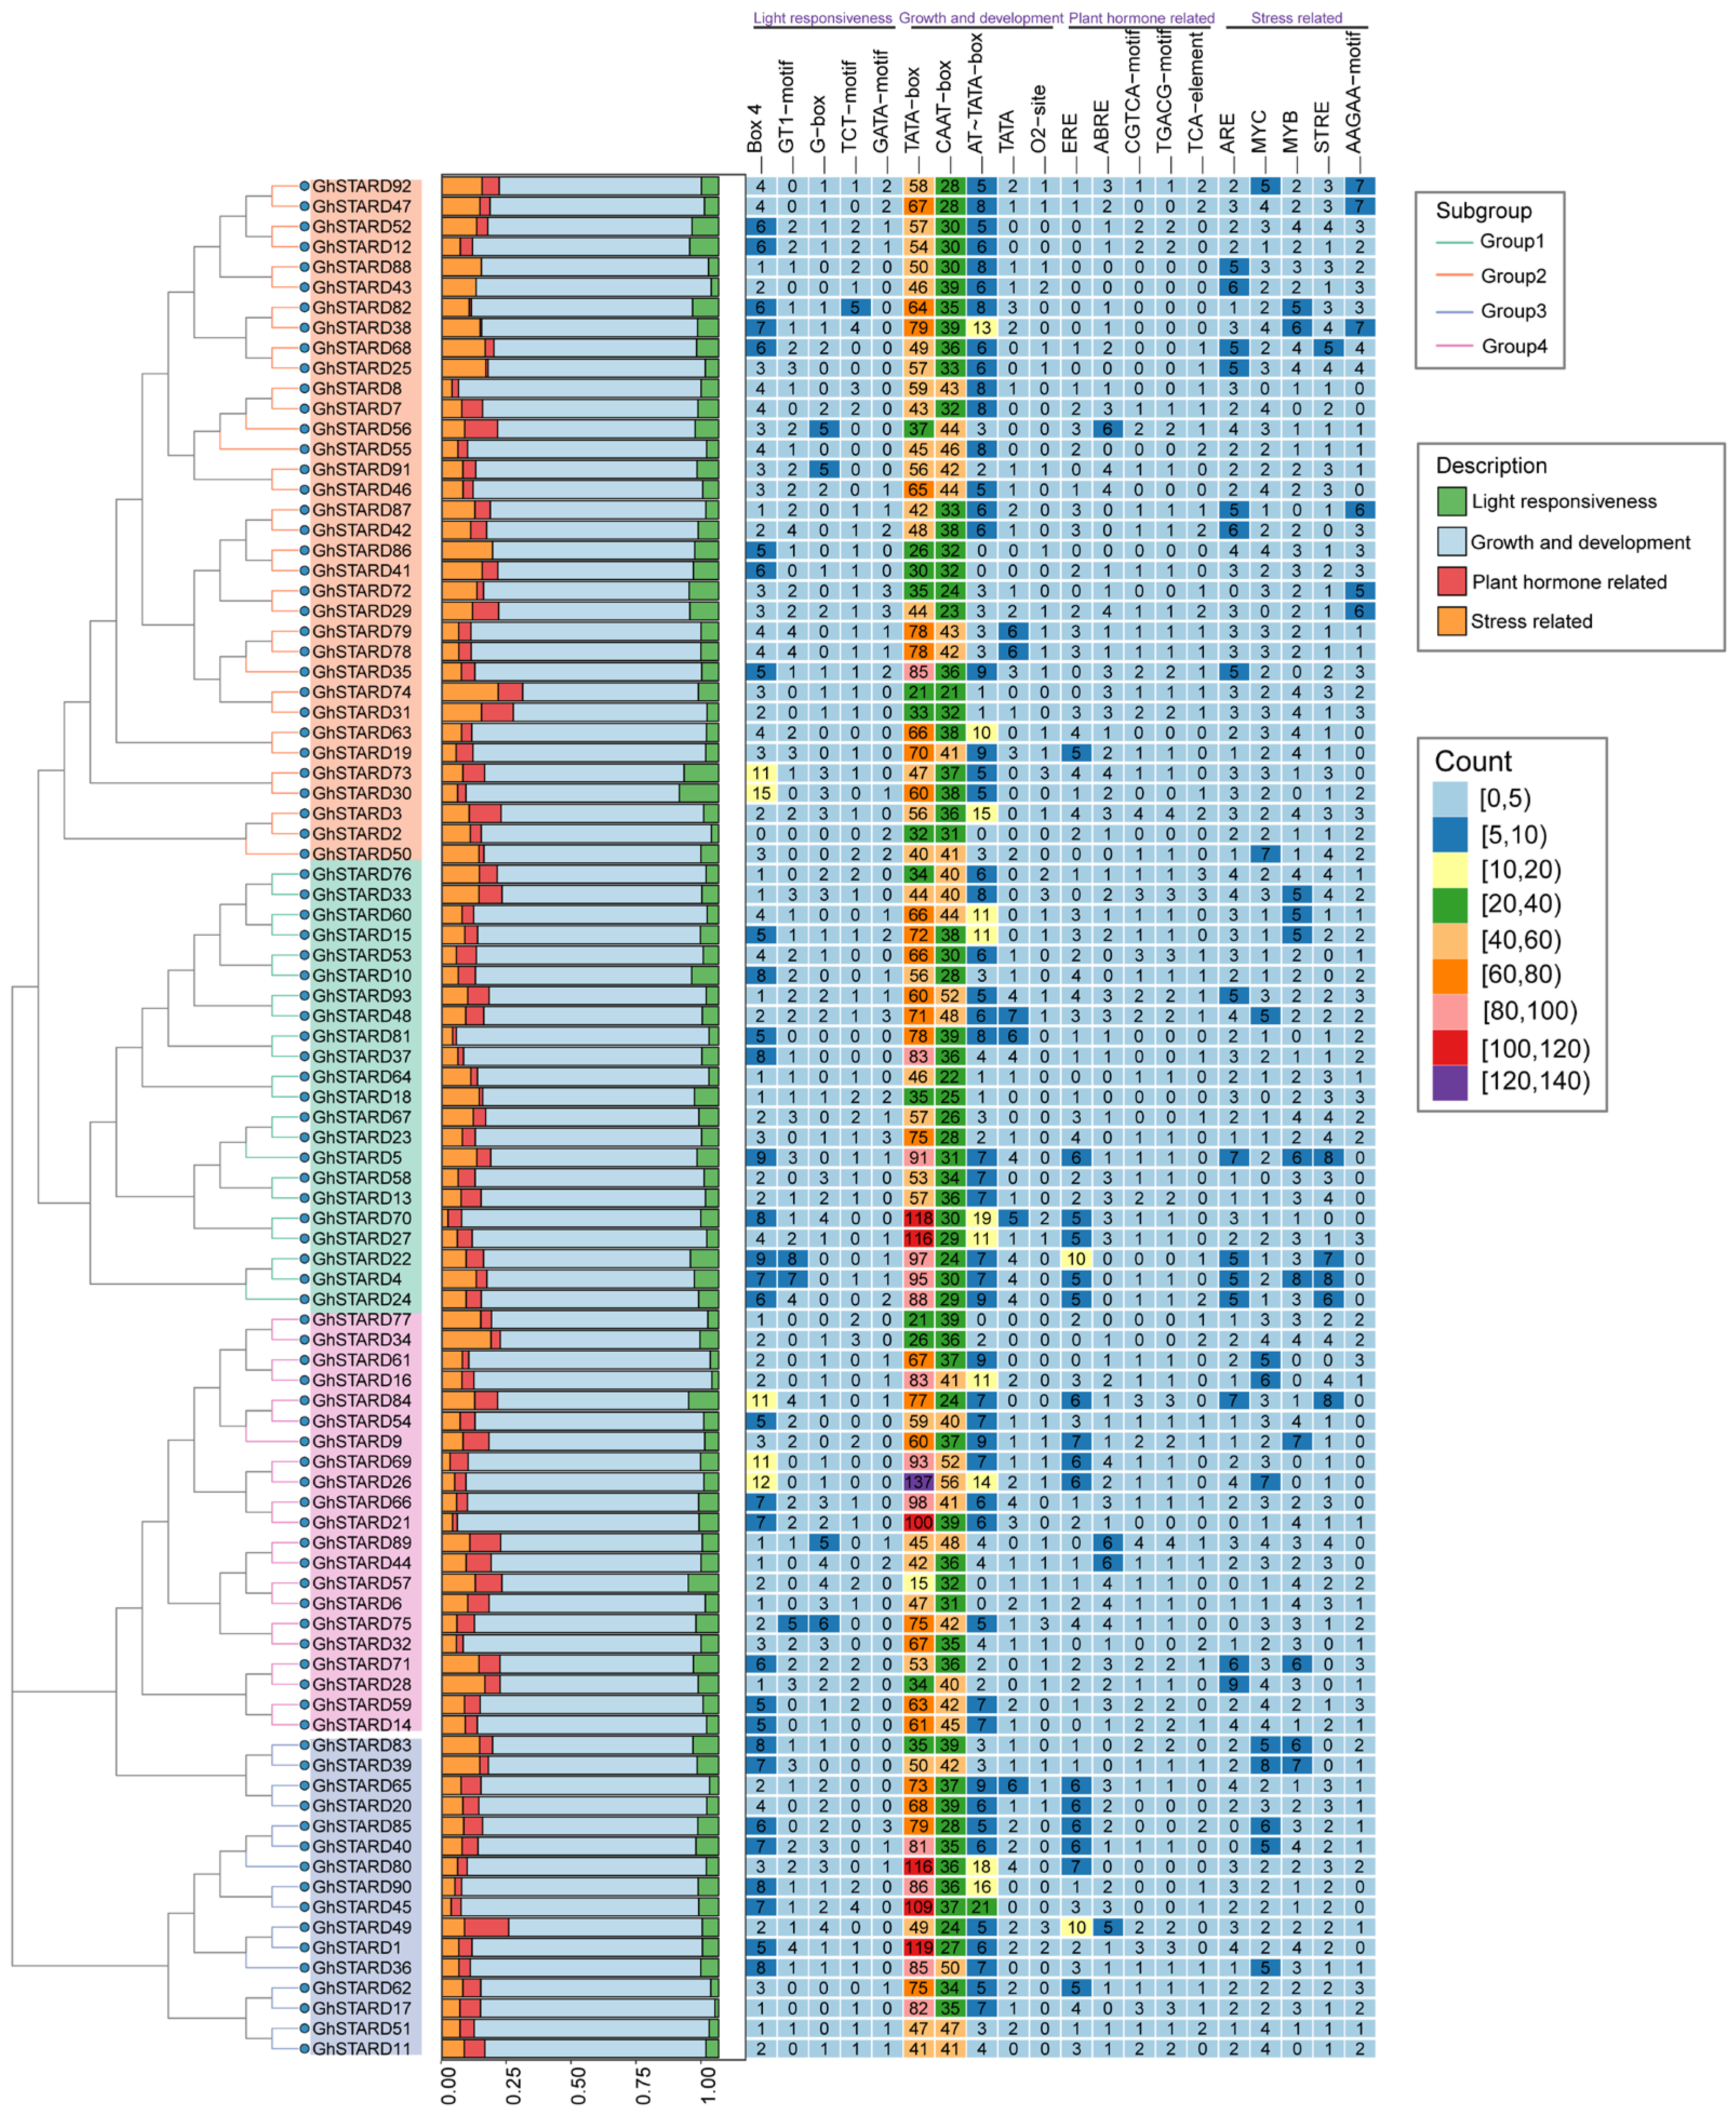
Cis-acting elements directly regulate the functional expression of downstream genes. In this study, the 2000 bp upstream sequences of GhSTARD genes were analyzed to identify cis-acting elements. The promoter regions contained 20 predominant types of cis-acting elements, which were categorized into four major classes: light responsiveness, plant growth and development, plant-hormone-related, and stress-related elements (Figure 6). Among these, TATA-box and CAAT-box (associated with plant growth and development) were the most abundant, followed by Box4 (light responsiveness) and low-temperature responsive elements. Additionally, five stress-related elements—ARE, MYC, MYB, STRE, and AAGAA-motif—were identified in the promoter regions of the GhSTARD gene family. Notably, genes in Group 4 harbored the highest number of cis-acting elements, whereas Group 2 exhibited the lowest average count. These findings suggest that GhSTARD genes may play critical roles in regulating plant growth and development, as well as in mediating abiotic stress responses.

3.7. The Induced Expression of Cotton STARD Genes Under Salt Stress

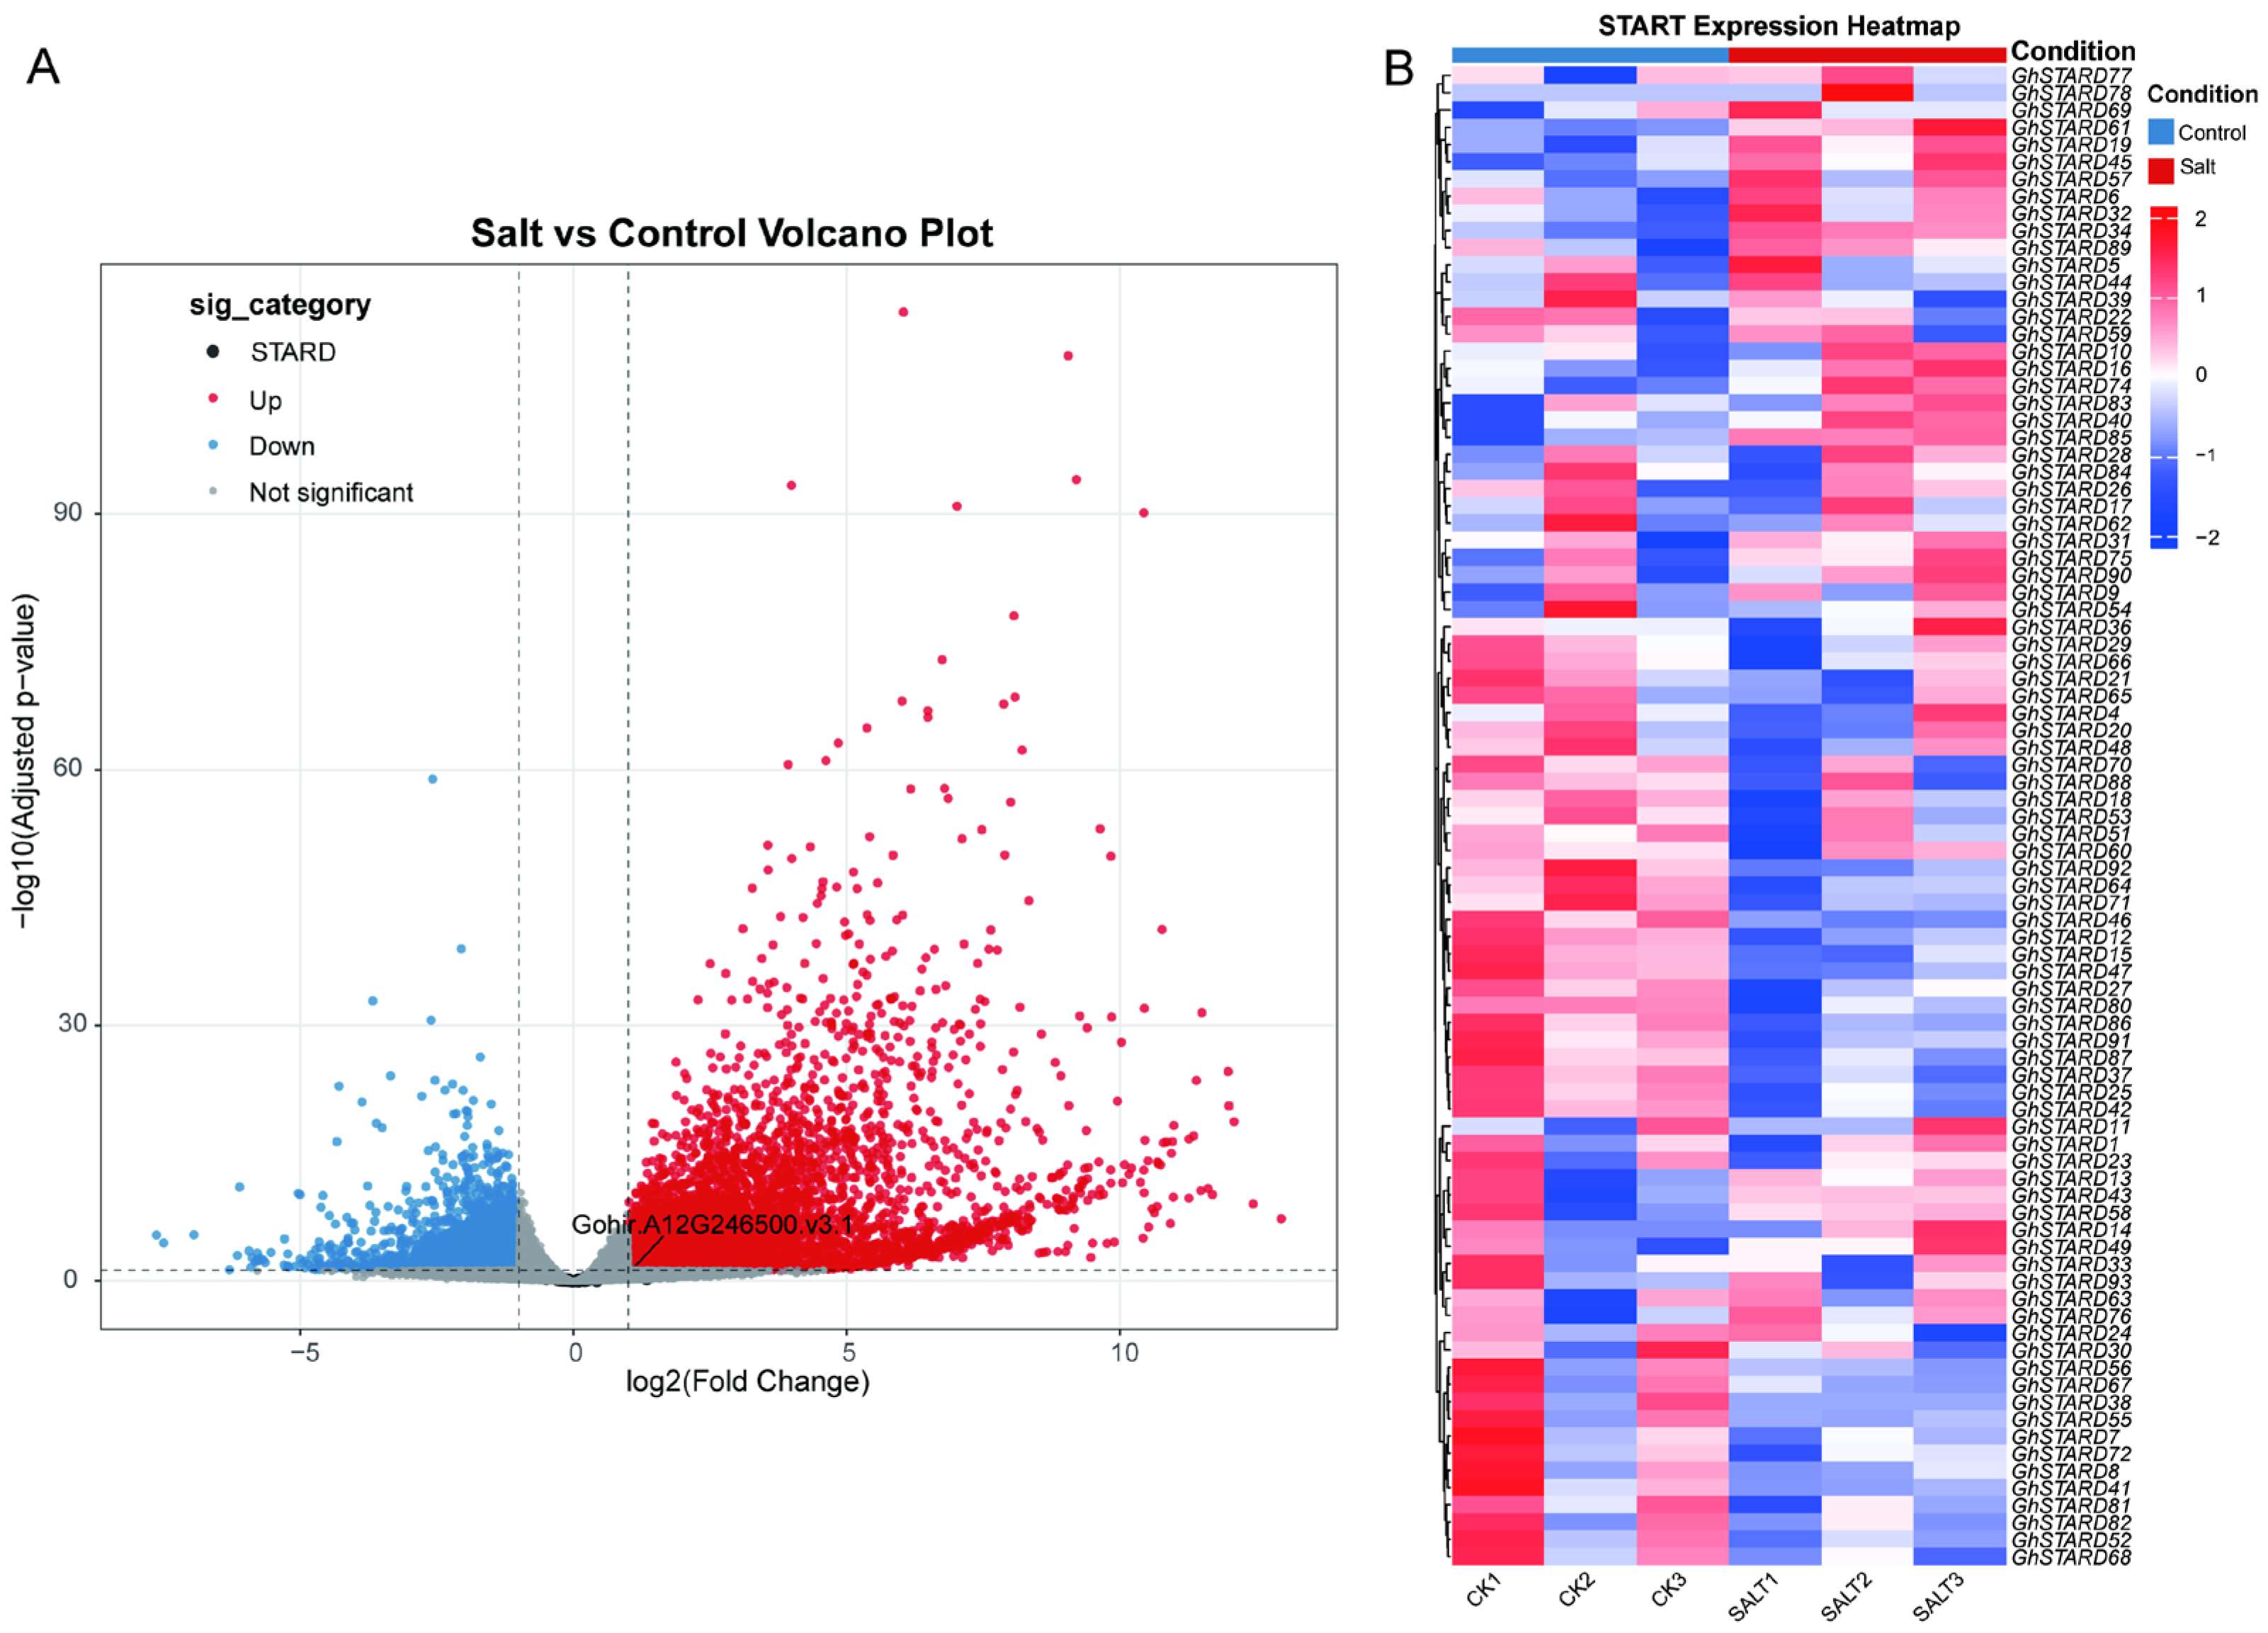
To elucidate the role of STARD genes in salt stress resistance, we conducted a differential expression analysis using published RNA-seq datasets from cotton (Gh) under salt stress [36]. Among the identified differentially expressed genes (DEGs), only 11 GhSTARD genes exhibited significant expression changes. Notably, four genes (GhSTARD61, GhSTARD90, GhSTARD45, and GhSTARD85) were upregulated in response to salt stress, while the remaining seven showed suppressed transcription levels. These findings suggest that a subset of GhSTARD genes specifically responds to salt stress and contributes to stress resistance. To investigate the scarcity of differentially expressed GhSTARD genes, we further analyzed their expression patterns using heatmap visualization. The results revealed that most GhSTARD genes displayed higher basal expression levels in control conditions (CK). However, limited reproducibility was observed for certain genes across biological replicates, which may partially explain the relatively small cohort of salt-responsive GhSTARD genes identified in this study (Figure 7).

3.8. Tissue Expression Patterns of GhSTARD45

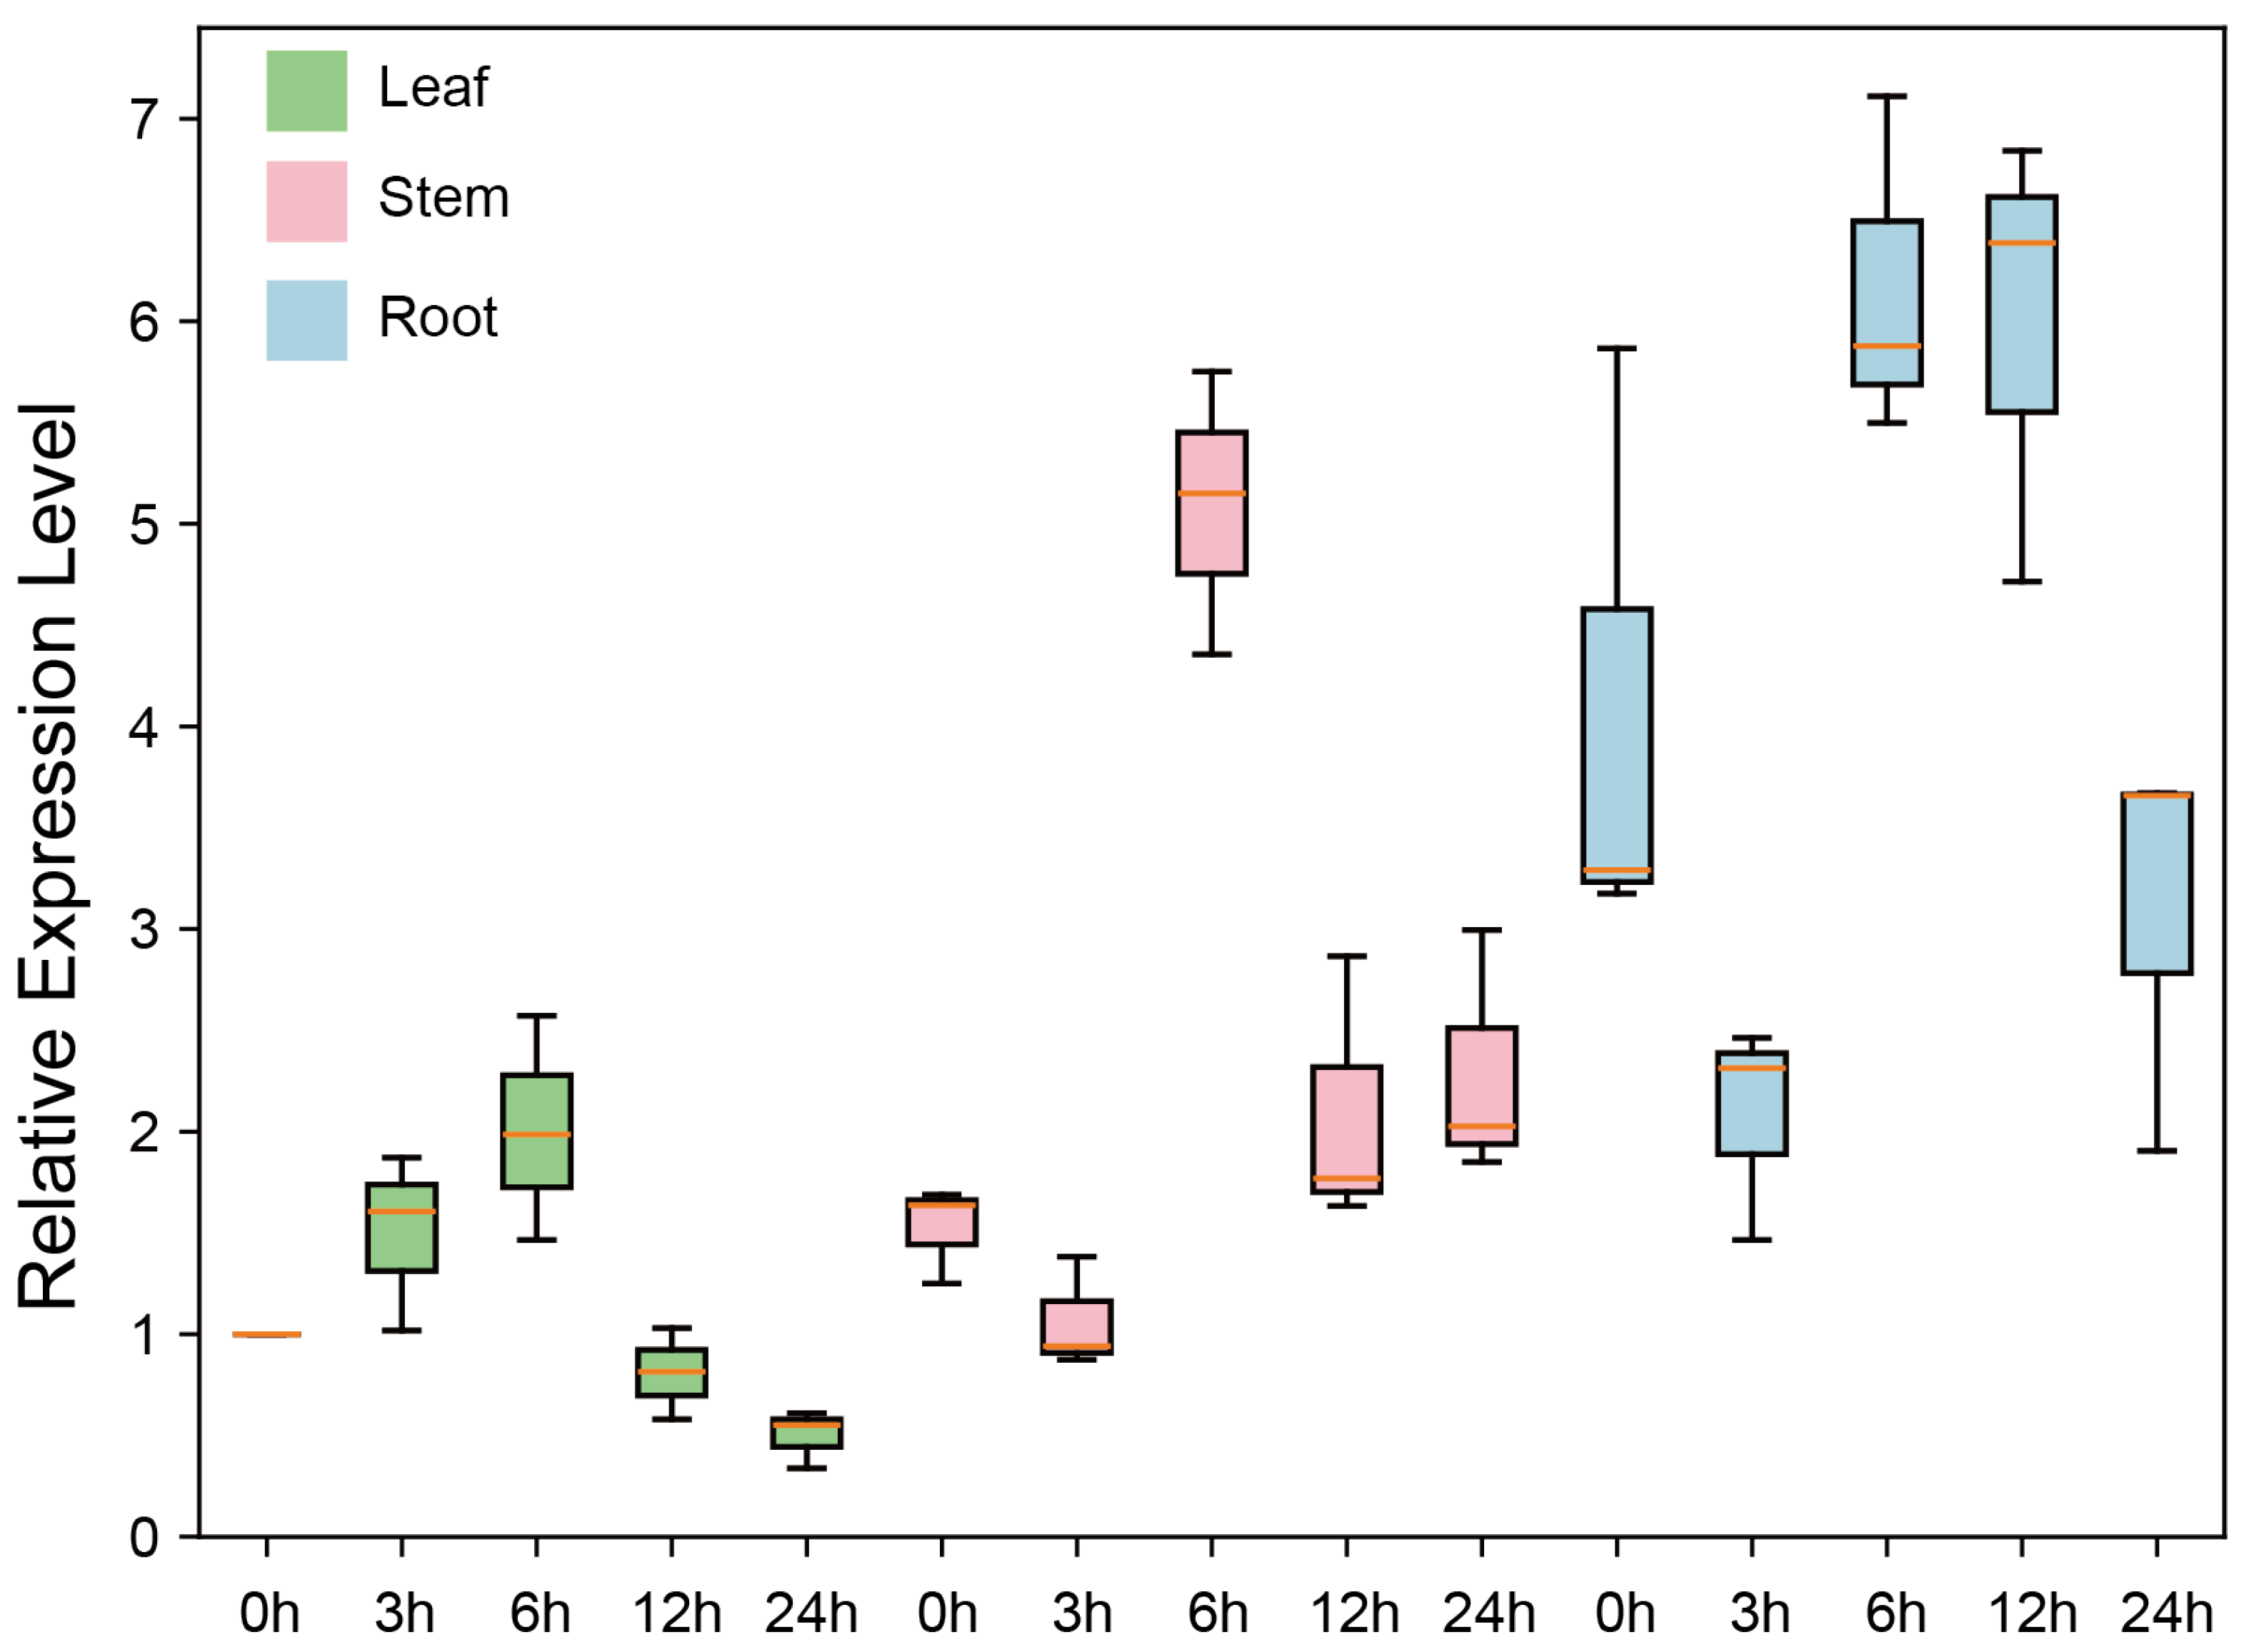
Among these four genes, GhSTARD45 exhibited the highest fold change and absolute expression levels, prompting further downstream analysis. To investigate the tissue-specific expression dynamics of GhSTARD45 under salt stress, we performed quantitative real-time PCR (qRT-PCR) on leaf, stem, and root tissues collected at 0, 3, 6, 12, and 24 h post-salt treatment (Table S4). The results revealed distinct expression profiles: leaf tissues showed consistently low GhSTARD45 transcription, reaching minimal levels at 24 h and stem tissues exhibited moderate expression with a peak at 6 h, whereas root tissues displayed the highest transcriptional activity, with significant induction at both 6 h and 12 h timepoints. This tissue-specific induction pattern, particularly the robust upregulation in roots under salt stress, suggests that GhSTARD45 may play a critical role in root-mediated salt tolerance mechanisms (Figure 8).

3.9. Gene Interaction Network

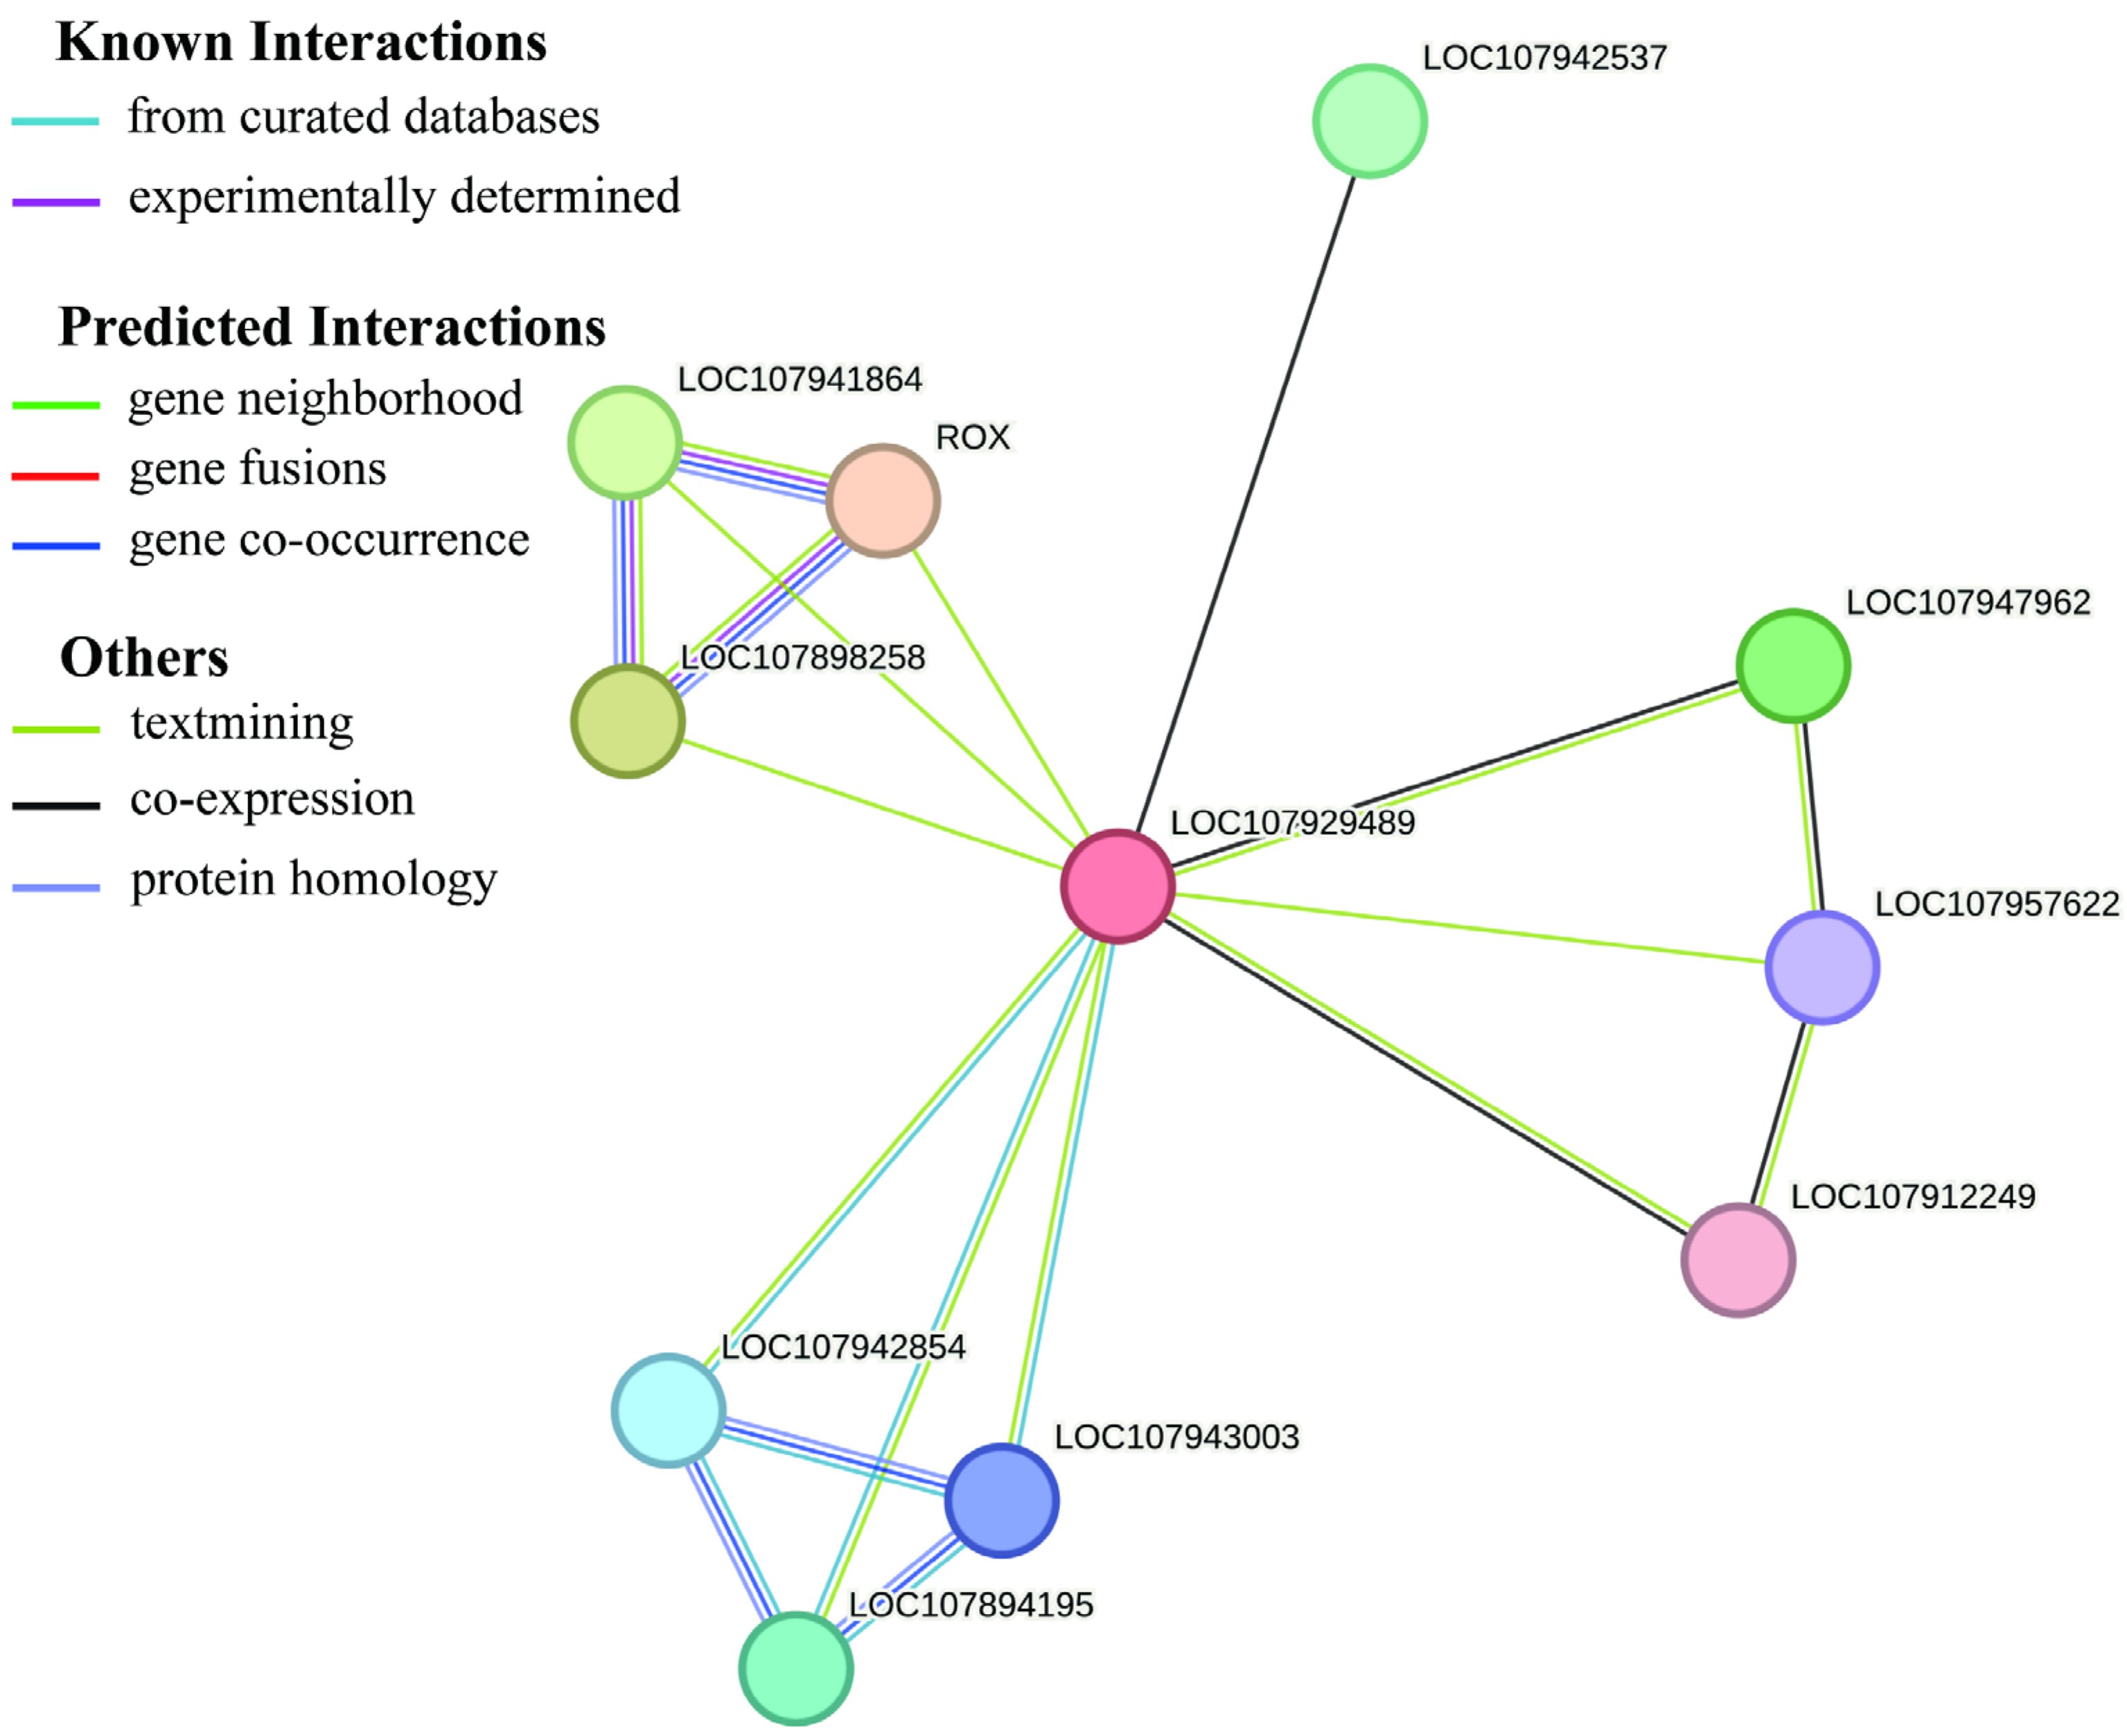
This study predicted the potential protein–protein interaction (PPI) network of the cotton target gene GhSTARD45 using multi-source bioinformatics approaches. Known interactions were derived from curated databases and experimentally validated data, while predicted interactions were generated through algorithms such as gene neighborhood, gene fusion, and gene co-occurrence. The prediction results revealed that GhSTARD45 potentially interacts with genes including LOC107941864, LOC107898258, LOC107957622, LOC107912249, LOC107943003, and LOC107894195. Additional candidate genes, such as LOC107942537 and LOC107947962, were also incorporated into the interaction network. Functional annotation indicated that these genes encode bHLH140 and probable 1-acyl-sn-glycerol-3-phosphate acyltransferase, respectively, suggesting that the target gene may participate in complex regulatory pathways. These findings provide critical insights for future functional validation and molecular mechanism studies in cotton (Figure 9).

4. Discussion

STARD genes have been categorized and described across various plant species [37]. Previous studies have identified 35 and 25 STARD gene members in Arabidopsis thaliana and rice, respectively, while only 23 STARD genes were identified in grapevine [19]. This study identified a significantly expanded STARD gene family (46–93 members) in tetraploid cottons, likely resulting from ancient and recent whole-genome duplications. We propose asymmetric subgenome-specific retention as a potential mechanism underlying this expansion. Notably, differential STARD gene retention between A/D subgenomes in G. hirsutum and G. barbadense suggests divergent adaptive contributions from ancestral genomes post-allopolyploidization. We speculate that this might be attributed to the presence of a START domain in the proteins of the HD-Zip III and HD-Zip IV subgroups, which is involved in processes such as cell differentiation, apical meristem differentiation, embryonic development, microtubule formation, morphogenesis, auxin polarity transport, and responses to biotic and abiotic stresses [7,9,38,39,40]. These processes are closely related to the growth characteristics of cotton.
Current research indicates that it is crucial to note that cultivated allotetraploid cottons, Gh and Gb, generally exhibit superior tolerance to salt, drought, and oxidative stress compared to their diploid relatives (G. arboreum and G. raimondii). This key phenomenon warrants in-depth exploration of its underlying molecular mechanisms in the discussion. Under salt stress, the G. barbadense cultivar Hai7124 outperformed the G. hirsutum accession TM-1, activating stronger defense-related responses (e.g., antioxidant metabolism and ABA/JA signaling pathways), while TM-1 prioritized pathways associated with ion homeostasis and growth. Furthermore, although STARD genes are widely present, their specific role in the salt stress response remains largely uncharacterized [41,42,43,]. A previous study in grapevine identified 23 STARD genes, with the majority exhibiting significant upregulation under NaCl treatment, while the remaining genes showed induced expression following methyl jasmonate (MeJA) treatment [19]. In contrast, our findings in cotton (Gh) reveal a distinct regulatory pattern: the majority of GhSTARD genes exhibited non-significant differential expression under salt stress, and differentially expressed members were predominantly downregulated. These observations suggest that while STARD genes may contribute to salt tolerance in cotton, they likely represent secondary regulatory components rather than primary mediators. Furthermore, although this study systematically characterized four candidate GhSTARD genes through bioinformatics analyses and identified salt-responsive candidates from RNA-seq datasets, functional validation via molecular experiments remains essential.
The protein–protein interaction (PPI) analysis predicted that GhSTARD45 interacts with a basic helix–loop–helix (bHLH) transcription factor. Notably, the promoter analysis revealed the significant enrichment of cis-elements associated with MYB transcription factors [44,45,46]. Given that MYB, bHLH, and WD40 proteins form a ternary complex (MYB-bHLH-WD40 and MBW complex) to co-regulate target gene expression [45], we hypothesize that this identified bHLH gene may function as a critical regulatory component upstream of GhSTARD45. Furthermore, potential candidate MYB transcription factors could be prioritized through integrated approaches such as co-expression network analysis, leveraging the known functional synergy between these transcription factor families in biological regulatory networks. Collectively, these results establish a foundation for investigating salt tolerance mechanisms in cotton and provide a theoretical basis for prioritizing gene candidates in future research.
While the identification of GhSTARD45 as a salt-responsive gene is promising, we acknowledge that the current study lacks deeper functional validation, such as transgenic overexpression, CRISPR knockouts, or phenotypic assays. This limitation restricts the strength of our functional claims. Future research should focus on these areas to confirm the role of GhSTARD45 in salt tolerance. For instance, transgenic cotton lines overexpressing GhSTARD45 could be generated and assessed for salt tolerance phenotypes. Similarly, CRISPR/Cas9 technology could be employed to create knockout mutants, and the resulting plants could be analyzed for alterations in salt stress responses. These experiments would provide more direct evidence of GhSTARD45′s function and its potential application in improving cotton salt tolerance.

5. Conclusions

This study provides novel insights into the role of the cotton STARD gene family in salt tolerance. Our findings reveal that the expansion of the STARD gene family in tetraploid cottons is primarily driven by whole-genome duplications, with asymmetric retention between A/D subgenomes. While most GhSTARD genes show no significant differential expression under salt stress, specific genes like GhSTARD45 are significantly upregulated in root tissues, suggesting their potential role in salt tolerance. Additionally, the protein–protein interaction network analysis of GhSTARD45 indicates its involvement in complex regulatory pathways. These results offer new perspectives for enhancing cotton salt tolerance through genetic engineering and provide valuable genetic resources for future research.

Supplementary Materials

The following supporting information can be downloaded at https://www.mdpi.com/article/10.3390/genes16070813/s1 Table S1: Characteristic information of the STARD gene; Table S2: Gene duplication information of cotton STARD; Table S3: Analysis results of STARD gene Ka and Ks.

Author Contributions

Conceptualization, R.C. and J.S.; methodology, S.L.; software, Y.C.; validation, C.R.; formal analysis, R.C. and J.S.; investigation, R.C. and J.S.; resources, R.C. and J.S.; data curation, R.C. and J.S.; writing—original draft preparation, M.S. and W.Y.; writing—review and editing, M.S. and W.Y.; visualization, M.S. and W.Y. All authors have read and agreed to the published version of the manuscript.

Funding

This research was funded by the Ph.D. Research Start-up Fund of the Anyang Institute of Technology (BSJ2022038).

Institutional Review Board Statement

Not applicable.

Informed Consent Statement

Not applicable.

Data Availability Statement

The original contributions presented in the study are included in the article, and further inquiries can be directed to the corresponding author.

Conflicts of Interest

The authors declare no conflicts of interest.

References

  1. Roderick, S.L.; Chan, W.W.; Agate, D.S.; Olsen, L.R.; Vetting, M.W.; Rajashankar, K.R.; Cohen, D.E. Structure of human phosphatidylcholine transfer protein in complex with its ligand. Nat. Struct. Biol. 2002, 9, 507–511. [Google Scholar] [CrossRef]
  2. Schrick, K.; Nguyen, D.; Karlowski, W.M.; Mayer, K.F.X. START lipid/sterol-binding domains are amplified in plants and are predominantly associated with homeodomain transcription factors. Genome Biol. 2004, 5, R41. [Google Scholar] [CrossRef]
  3. Clark, B.J. The mammalian START domain protein family in lipid transport in health and disease. J. Endocrinol. 2012, 212, 257–275. [Google Scholar] [CrossRef] [PubMed]
  4. Tillman, M.C.; Imai, N.; Li, Y.; Khadka, M.; Okafor, C.D.; Juneja, P.; Adhiyaman, A.; Hagen, S.J.; Cohen, D.E.; Ortlund, E.A. Allosteric regulation of thioesterase superfamily member 1 by lipid sensor domain binding fatty acids and lysophosphatidylcholine. Proc. Natl. Acad. Sci. USA 2020, 117, 22080–22089. [Google Scholar] [CrossRef]
  5. Alpy, F.; Legueux, F.; Bianchetti, L.; Tomasetto, C. Les protéines à domaine START, des trafiquants intracellulaires de lipides. Médecine/Sci. 2009, 25, 181–191. [Google Scholar] [CrossRef] [PubMed]
  6. Strauss, J.F.; Kishida, T.; Christenson, L.K.; Fujimoto, T.; Hiroi, H. START domain proteins and the intracellular trafficking of cholesterol in steroidogenic cells. Mol. Cell. Endocrinol. 2003, 202, 59–65. [Google Scholar] [CrossRef]
  7. Elhiti, M.; Stasolla, C. Structure and function of homodomain-leucine zipper (HD-Zip) proteins. Plant Signal. Behav. 2009, 4, 86–88. [Google Scholar] [CrossRef] [PubMed]
  8. Schrick, K.; Bruno, M.; Khosla, A.; Cox, P.N.; Marlatt, S.A.; Roque, R.A.; Nguyen, H.C.; He, C.; Snyder, M.P.; Singh, D.; et al. Shared functions of plant and mammalian StAR-related lipid transfer (START) domains in modulating transcription factor activity. BMC Biol. 2014, 12, 70. [Google Scholar] [CrossRef]
  9. Mukherjee, T.; Subedi, B.; Khosla, A.; Begler, E.M.; Stephens, P.M.; Warner, A.L.; Lerma-Reyes, R.; Thompson, K.A.; Gunewardena, S.; Schrick, K. The START domain mediates Arabidopsis GLABRA2 dimerization and turnover independently of homeodomain DNA binding. Plant Physiol. 2022, 190, 2315–2334. [Google Scholar] [CrossRef]
  10. Prigge, M.J.; Otsuga, D.; Alonso, J.M.; Ecker, J.R.; Drews, G.N.; Clark, S.E. Class III homeodomain-leucine zipper gene family members have overlapping, antagonistic, and distinct roles in Arabidopsis development. Plant Cell 2005, 17, 61–76. [Google Scholar] [CrossRef]
  11. Yu, L.; Chen, X.; Wang, Z.; Wang, S.; Wang, Y.; Zhu, Q.; Li, S.; Xiang, C. Arabidopsis enhanced drought tolerance1/homeodomain glabrous11 confers drought tolerance in transgenic rice without yield penalty. Plant Physiol. 2013, 162, 1378–1391. [Google Scholar] [CrossRef] [PubMed]
  12. Yu, L.-H.; Wu, S.-J.; Peng, Y.-S.; Liu, R.-N.; Chen, X.; Zhao, P.; Xu, P.; Zhu, J.-B.; Jiao, G.-L.; Pei, Y.; et al. Arabidopsis EDT1/HDG11 improves drought and salt tolerance in cotton and poplar and increases cotton yield in the field. Plant Biotechnol. J. 2016, 14, 72–84. [Google Scholar] [CrossRef]
  13. Lamour, K.H.; Stam, R.; Jupe, J.; Huitema, E. The oomycete broad-host-range pathogen Phytophthora capsici. Mol. Plant Pathol. 2012, 13, 329–337. [Google Scholar] [CrossRef] [PubMed]
  14. Miao, J.; Chi, Y.; Lin, D.; Tyler, B.M.; Liu, X. Mutations in ORP1 conferring oxathiapiprolin resistance confirmed by genome editing using CRISPR/Cas9 in Phytophthora capsici and P sojae. Phytopathology 2018, 108, 1412–1419. [Google Scholar] [CrossRef]
  15. Wang, Y.; Wang, Y. Phytophthora sojae effectors orchestrate warfare with host immunity. Curr. Opin. Microbiol. 2018, 46, 7–13. [Google Scholar] [CrossRef]
  16. Lai, S.-H.; Chye, M.-L. Plant Acyl-CoA-Binding Proteins—Their Lipid and Protein Interactors in Abiotic and Biotic Stresses. Cells 2021, 10, 1064. [Google Scholar] [CrossRef] [PubMed]
  17. Luo, X.; Tian, T.; Feng, L.; Yang, X.; Li, L.; Tan, X.; Wu, W.; Li, Z.; Treves, H.; Serneels, F.; et al. Pathogenesis-related protein 1 suppresses oomycete pathogen by targeting against AMPK kinase complex. J. Adv. Res. 2023, 43, 13–26. [Google Scholar] [CrossRef]
  18. Kamata, M.; Yamashita, T.; Kina, A.; Funata, M.; Mizukami, A.; Sasaki, M.; Tani, A.; Funami, M.; Amano, N.; Fukatsu, K. Design, synthesis, and structure–activity relationships of novel spiro-piperidines as acetyl-CoA carboxylase inhibitors. Bioorganic Med. Chem. Lett. 2012, 22, 3643–3647. [Google Scholar] [CrossRef]
  19. Lu, S.; He, H.; Wang, P.; Gou, H.; Cao, X.; Ma, Z.; Chen, B.; Mao, J. Evolutionary relationship analysis of STARD gene family and VvSTARD5 improves tolerance of salt stress in transgenic tomatoes. Physiol. Plant. 2022, 174, e13772. [Google Scholar] [CrossRef]
  20. Zhang, T.; Wang, S.; Chen, J.; Zhu, S.; Zhu, Q.; Zhao, T. Advances in cotton genomics, genetics and breeding. Plants 2024, 13, 2579. [Google Scholar] [CrossRef]
  21. Jareczek, J.J.; Grover, C.E.; Wendel, J.F. Cotton fiber as a model for understanding shifts in cell development under domestication. Front. Plant Sci. 2023, 14, 1146802. [Google Scholar] [CrossRef] [PubMed]
  22. Chaudhary, M.T.; Majeed, S.; Rana, I.A.; Ali, Z.; Jia, Y.; Du, X.; Hinze, L.; Azhar, M.T. Impact of salinity stress on cotton and opportunities for improvement through conventional and biotechnological approaches. BMC Plant Biol. 2024, 24, 20. [Google Scholar] [CrossRef] [PubMed]
  23. Sharif, I.; Aleem, S.; Farooq, J.; Rizwan, M.; Younas, A.; Sarwar, G.; Chohan, S.M. Salinity stress in cotton: Effects, mechanism of tolerance and its management strategies. Physiol. Mol. Biol. Plants 2019, 25, 807–820. [Google Scholar] [CrossRef] [PubMed]
  24. Dong, Y.; Hu, G.; Yu, J.; Thu, S.W.; Grover, C.E.; Zhu, S.; Wendel, J.F. Salt-tolerance diversity in diploid and polyploid cotton (Gossypium) species. Plant J. 2020, 101, 1135–1151. [Google Scholar] [CrossRef]
  25. Horton, P.; Park, K.-J.; Obayashi, T.; Fujita, N.; Harada, H.; Adams-Collier, C.J.; Nakai, K. WoLF PSORT: Protein localization predictor. Nucleic Acids Res. 2007, 35, W585–W587. [Google Scholar] [CrossRef]
  26. Kumar, S.; Stecher, G.; Li, M.; Knyaz, C.; Tamura, K. MEGA X: Molecular evolutionary genetics analysis across computing platforms. Mol. Biol. Evol. 2018, 35, 1547–1549. [Google Scholar] [CrossRef]
  27. Zhang, H.; Gao, S.; Lercher, M.J.; Hu, S.; Chen, W.-H. EvolView, an online tool for visualizing, annotating and managing phylogenetic trees. Nucleic Acids Res. 2012, 40, W569–W572. [Google Scholar] [CrossRef]
  28. Chen, C.; Chen, H.; Zhang, Y.; Thomas, H.R.; Frank, M.H.; He, Y.; Xia, R. TBtools: An integrative toolkit developed for interactive analyses of big biological data. Mol. Plant 2020, 13, 1194–1202. [Google Scholar] [CrossRef]
  29. Wang, Y.; Tang, H.; DeBarry, J.D.; Tan, X.; Li, J.; Wang, X.; Lee, T.-h.; Jin, H.; Marler, B.; Guo, H.; et al. MCScanX: A toolkit for detection and evolutionary analysis of gene synteny and collinearity. Nucleic Acids Res. 2012, 40, e49. [Google Scholar] [CrossRef]
  30. Zhang, Z. KaKs_Calculator 3.0: Calculating Selective Pressure on Coding and Non-Coding Sequences. Genom. Proteom. Bioinform. 2022, 20, 536–540. [Google Scholar] [CrossRef]
  31. Heinz, S.; Benner, C.; Spann, N.; Bertolino, E.; Lin, Y.C.; Laslo, P.; Cheng, J.X.; Murre, C.; Singh, H.; Glass, C.K. Simple combinations of lineage-determining transcription factors prime cis-regulatory elements required for macrophage and B cell identities. Mol. Cell 2010, 38, 576–589. [Google Scholar] [CrossRef]
  32. Stahlberg, A.; Hakansson, J.; Xian, X.; Semb, H.; Kubista, M. Properties of the reverse transcription reaction in mRNA quantification. Clin. Chem. 2004, 50, 509–515. [Google Scholar] [CrossRef] [PubMed]
  33. Zheng, W.; Di, Y.; Liu, Y.; Huang, G.; Zheng, Y.; Zhang, Y.; Fang, W. Development and application of a novel reverse transcription real-time PCR method for miR-499 quantification. Clin. Biochem. 2013, 46, 1566–1571. [Google Scholar] [CrossRef] [PubMed]
  34. Zhuang, H.; Fu, Y.; He, W.; Wang, L.; Wei, Y. Selection of appropriate reference genes for quantitative real-time PCR in oxytropis ochrocephala bunge using transcriptome datasets under abiotic stress treatments. Front. Plant Sci. 2015, 6, 475. [Google Scholar] [CrossRef] [PubMed]
  35. Thorsell, A.-G.; Lee, W.H.; Persson, C.; Siponen, M.I.; Nilsson, M.; Busam, R.D.; Kotenyova, T.; Schüler, H.; Lehtiö, L. Comparative structural analysis of lipid binding START domains. PLoS ONE 2011, 6, e19521. [Google Scholar] [CrossRef]
  36. Dong, Y.; Hu, G.; Grover, C.E.; Miller, E.R.; Zhu, S.; Wendel, J.F. Parental legacy versus regulatory innovation in salt stress responsiveness of allopolyploid cotton (Gossypium) species. Plant J. 2022, 111, 872–887. [Google Scholar] [CrossRef]
  37. Mahtha, S.K.; Purama, R.K.; Yadav, G. StAR-related lipid transfer (START) domains across the rice pangenome reveal how ontogeny recapitulated selection pressures during rice domestication. Front. Genet. 2021, 12, 737194. [Google Scholar] [CrossRef]
  38. Chew, W.; Hrmova, M.; Lopato, S. Role of homeodomain leucine zipper (HD-Zip) IV transcription factors in plant development and plant protection from deleterious environmental factors. Int. J. Mol. Sci. 2013, 14, 8122–8147. [Google Scholar] [CrossRef]
  39. Roodbarkelari, F.; Groot, E.P. Regulatory function of homeodomain-leucine zipper (HD-ZIP) family proteins during embryogenesis. New Phytol. 2017, 213, 95–104. [Google Scholar] [CrossRef]
  40. Sessa, G.; Carabelli, M.; Possenti, M.; Morelli, G.; Ruberti, I. Multiple links between HD-Zip proteins and hormone networks. Int. J. Mol. Sci. 2018, 19, 4047. [Google Scholar] [CrossRef]
  41. Satheesh, V.; Parameswaran, C.; Tejkumar, J.P.; Vajinder, K.; Jain, P.K.; Viswanathan, C.; Shripad, R.B.; Srinivasan, R. Transmembrane START domain proteins: In silico identification, characterization and expression analysis under stress conditions in chickpea (Cicer arietinum L.). Plant Signal. Behav. 2016, 11, e992698. [Google Scholar] [CrossRef] [PubMed]
  42. Luhua, S.; Hegie, A.; Suzuki, N.; Shulaev, E.; Luo, X.; Cenariu, D.; Ma, V.; Kao, S.; Lim, J.; Gunay, M.B.; et al. Linking genes of unknown function with abiotic stress responses by high-throughput phenotype screening. Physiol. Plant. 2013, 148, 322–333. [Google Scholar] [CrossRef]
  43. Feng, L.; Chen, Y.; Ma, T.; Zhou, C.; Sang, S.; Li, J.; Ji, S. Integrative physiology and transcriptome sequencing reveal differences between G. hirsutum and G. barbadense in response to salt stress and the identification of key salt tolerance genes. BMC Plant Biol. 2024, 24, 787. [Google Scholar] [CrossRef] [PubMed]
  44. Abdullah-Zawawi, M.-R.; Ahmad-Nizammuddin, N.-F.; Govender, N.; Harun, S.; Mohd-Assaad, N.; Mohamed-Hussein, Z.-A. Comparative genome-wide analysis of WRKY, MADS-box and MYB transcription factor families in Arabidopsis and rice. Sci. Rep. 2021, 11, 19678. [Google Scholar] [CrossRef]
  45. Wang, Z.; Zhou, L.; Lan, Y.; Li, X.; Wang, J.; Dong, J.; Guo, W.; Jing, D.; Liu, Q.; Zhang, S.; et al. An aspartic protease 47 causes quantitative recessive resistance to rice black-streaked dwarf virus disease and southern rice black-streaked dwarf virus disease. New Phytol. 2022, 233, 2520–2533. [Google Scholar] [CrossRef] [PubMed]
  46. Li, Y.; Liang, J.; Zeng, X.; Guo, H.; Luo, Y.; Kear, P.; Zhang, S.; Zhu, G. Genome-wide analysis of MYB gene family in potato provides insights into tissue-specific regulation of anthocyanin biosynthesis. Hortic. Plant J. 2021, 7, 129–141. [Google Scholar] [CrossRef]
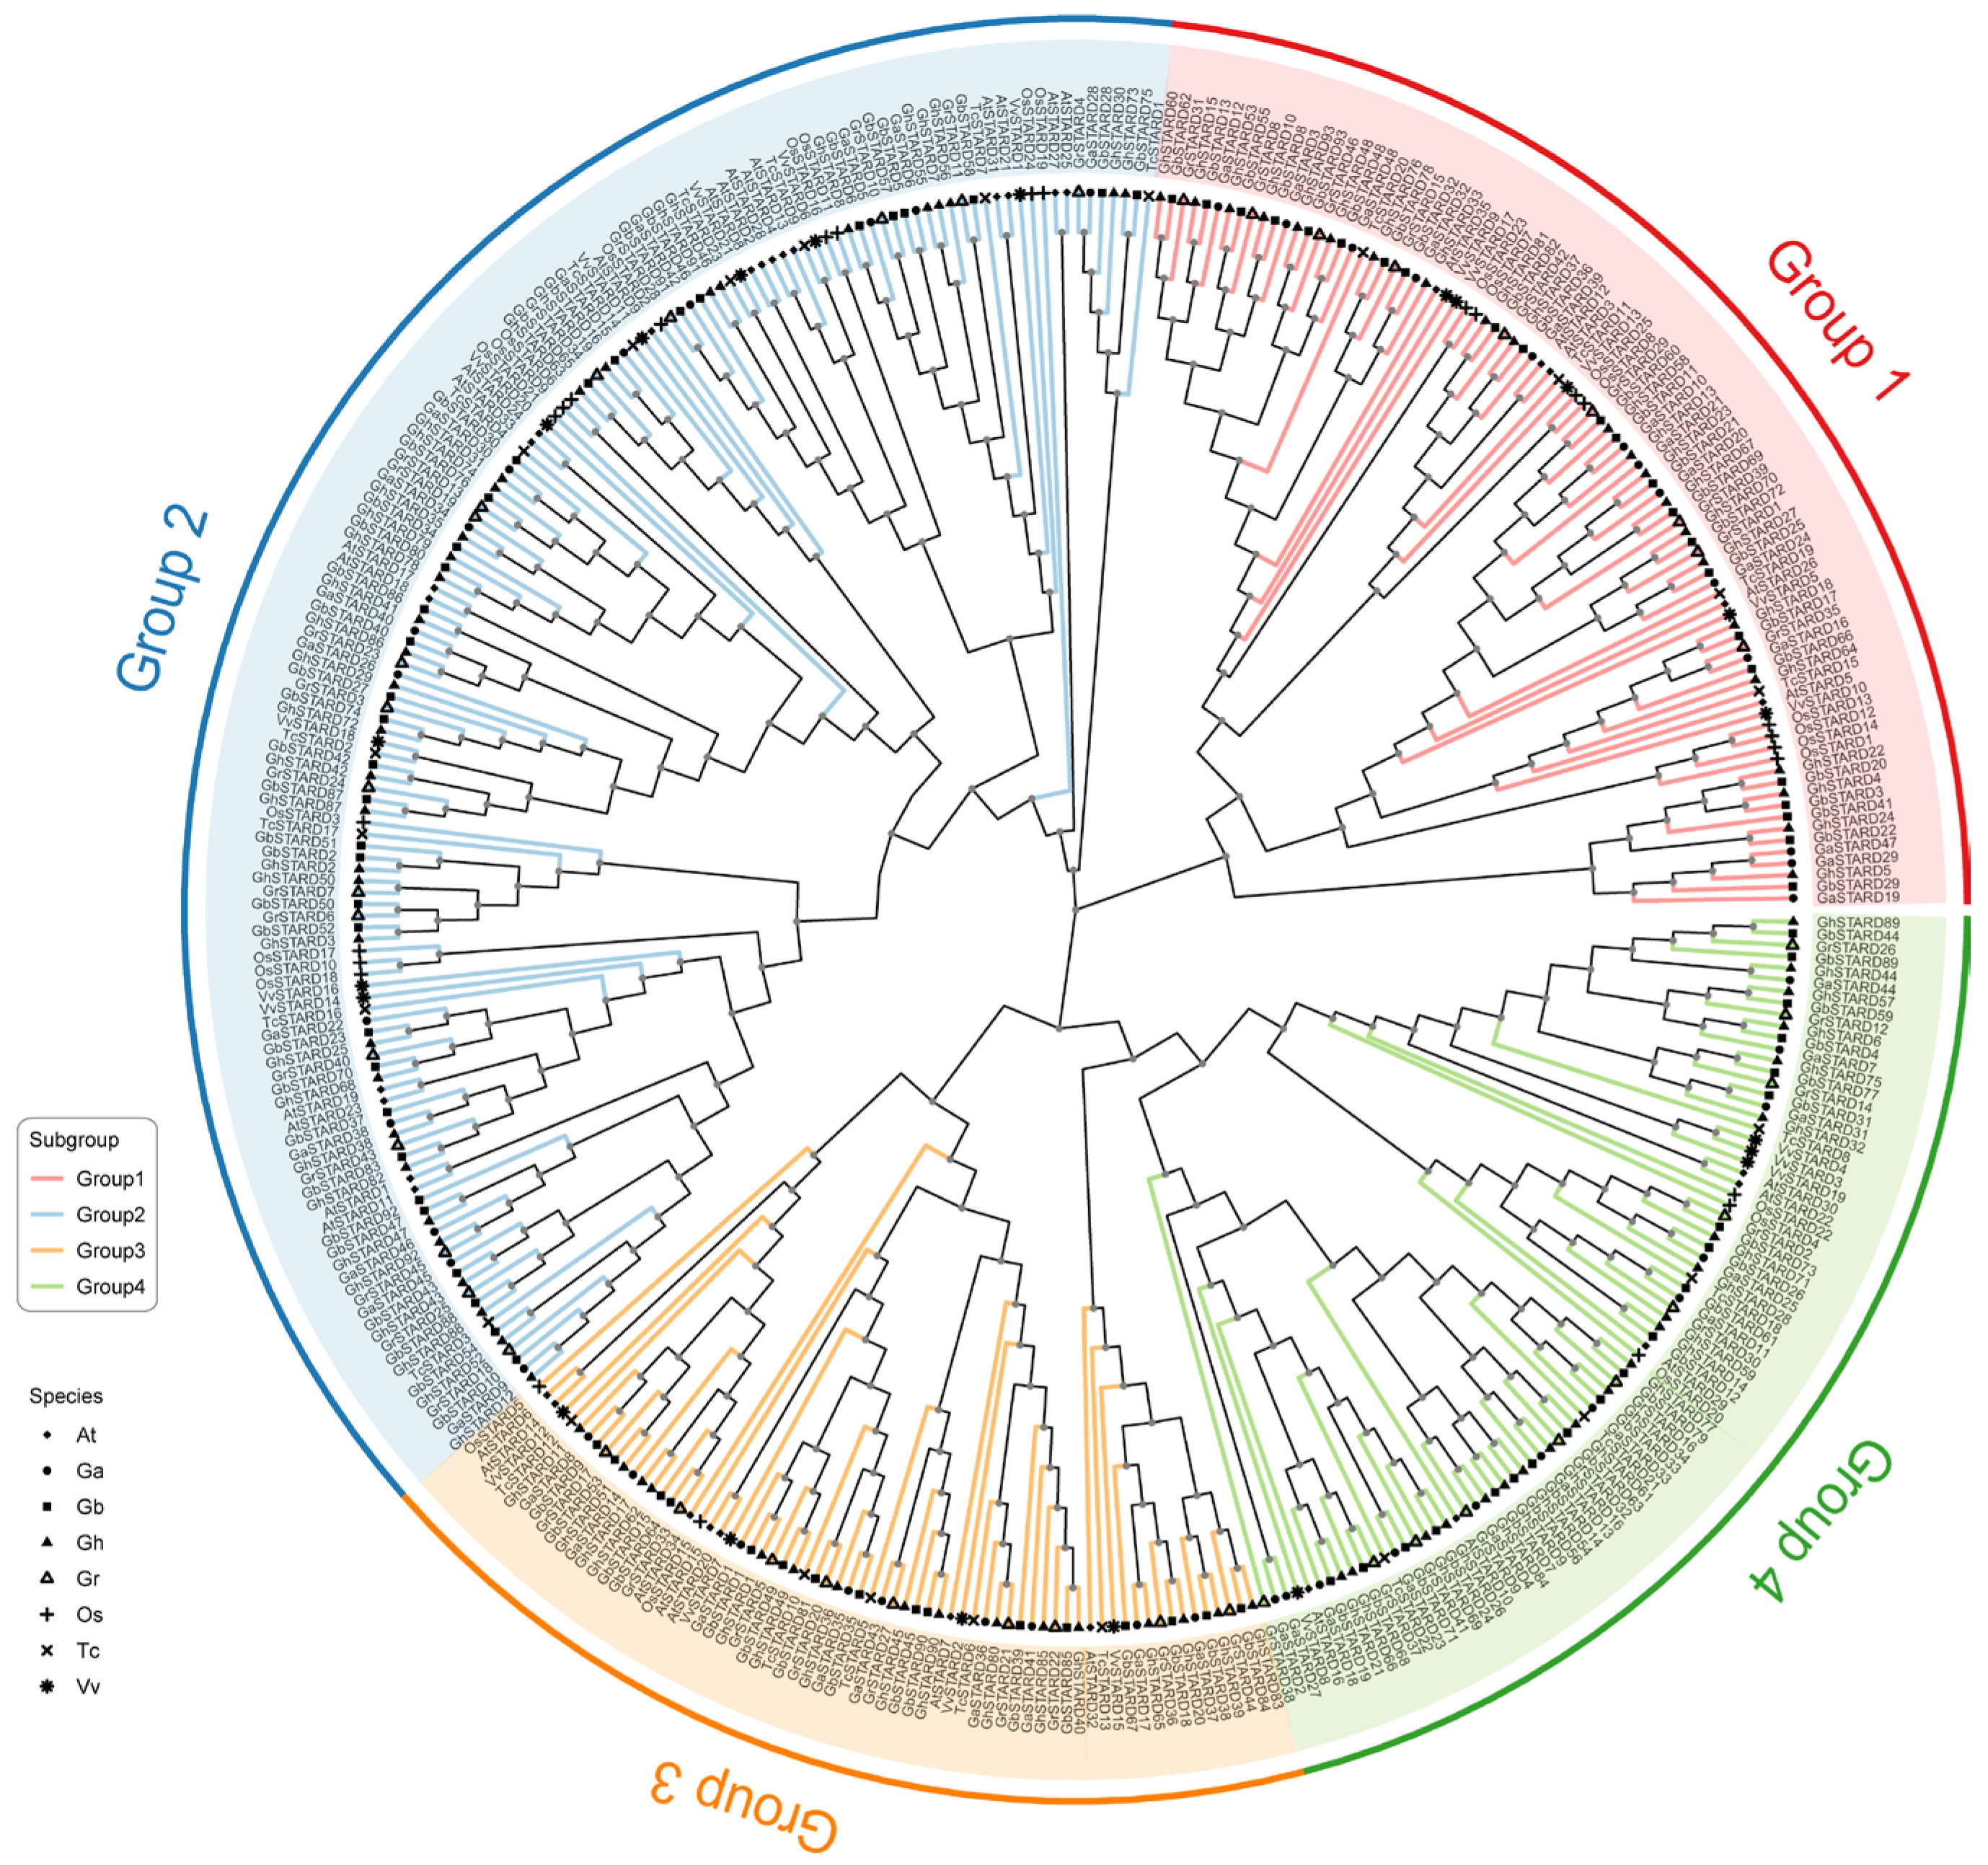
Figure 1. A phylogenetic tree depicting the evolutionary relationships among STARD proteins from cotton species (Gossypium hirsutum, Gossypium barbadense, Gossypium arboreum, and Gossypium raimondii) and STARD genes from Arabidopsis thaliana, Oryza sativa, Vitis vinifera, and Theobroma cacao was constructed. The tree shows STARD proteins grouped into four major clades (Groups I–IV), each represented by a distinct color. Different species are denoted by specific symbols: solid triangles (Gossypium hirsutumGh), hollow triangles (Gossypium raimondiiGr), solid circles (Arabidopsis thalianaAt), hollow circles (Oryza sativaOs), solid squares (Vitis viniferaVv), and hollow squares (Theobroma cacaoTc).
Genes 16 00813 g001
Figure 2. Distribution of STARD genes in Gossypium hirsutum. The y-axis indicates chromosome length, with chromosome numbering labeled in yellow font. Red markers denote the identified locations of STARD genes in G. hirsutum.
Genes 16 00813 g002
Figure 3. Synteny analysis of G. hirsutum L. with other cotton species: (A) synteny analysis between G. hirsutum and diploid cotton species G. raimondii/G. arboreum; (B) synteny analysis between G. hirsutum and allotetraploid cotton G. barbadense. Colored lines highlight syntenic blocks of the STARD gene family, while gray lines indicate syntenic regions from other genomic contexts.
Genes 16 00813 g003
Figure 4. Ka and Ks analysis of STARD genes across cotton species. Box plots display the distribution of non-synonymous substitution rates (Ka), synonymous substitution rates (Ks), and their ratios (Ka/Ks) for different comparison groups, arranged vertically from top to bottom.
Genes 16 00813 g004
Figure 5. Analysis of phylogenetic relationships, protein domains, and gene structures of GhSTARDs. (A) Phylogenetic analysis of GhSTARDs proteins. Conserved protein motifs in the amino acid sequences of GhSTARDs were analyzed using the MEME suite. (B) Visualization of gene structures for GhSTARDs, including exon–intron organization and untranslated regions (UTRs). (C) Identification and characterization of functional domains within GhSTARD proteins.
Genes 16 00813 g005
Figure 6. Analysis of GhSTARD gene promoters. From left to right: (A) phylogenetic analysis of GhSTARD proteins, (B) categorical quantification of promoter motifs, and (C) detailed distribution of specific promoter elements across genomic regions.
Genes 16 00813 g006
Figure 7. RNA-seq analysis results. (A) Volcano plot depicting differentially expressed genes (DEGs), with statistical significance (adjusted p-value) plotted against log2 fold change. (B) Heatmap illustrating the expression profiles of STARD genes across experimental conditions, with color gradients representing relative expression levels.
Genes 16 00813 g007
Figure 8. The qPCR analysis of GhSTARD45 expression across multiple tissues under salt stress at various time points.
Genes 16 00813 g008
Figure 9. In silico prediction of protein–protein interactions (PPIs) for GhSTARD45.
Genes 16 00813 g009
Disclaimer/Publisher’s Note: The statements, opinions and data contained in all publications are solely those of the individual author(s) and contributor(s) and not of MDPI and/or the editor(s). MDPI and/or the editor(s) disclaim responsibility for any injury to people or property resulting from any ideas, methods, instructions or products referred to in the content.