
Harnessing Multi-Omics and Predictive Modeling for Climate-Resilient Crop Breeding: From Genomes to Fields


Abstract
1. Introduction
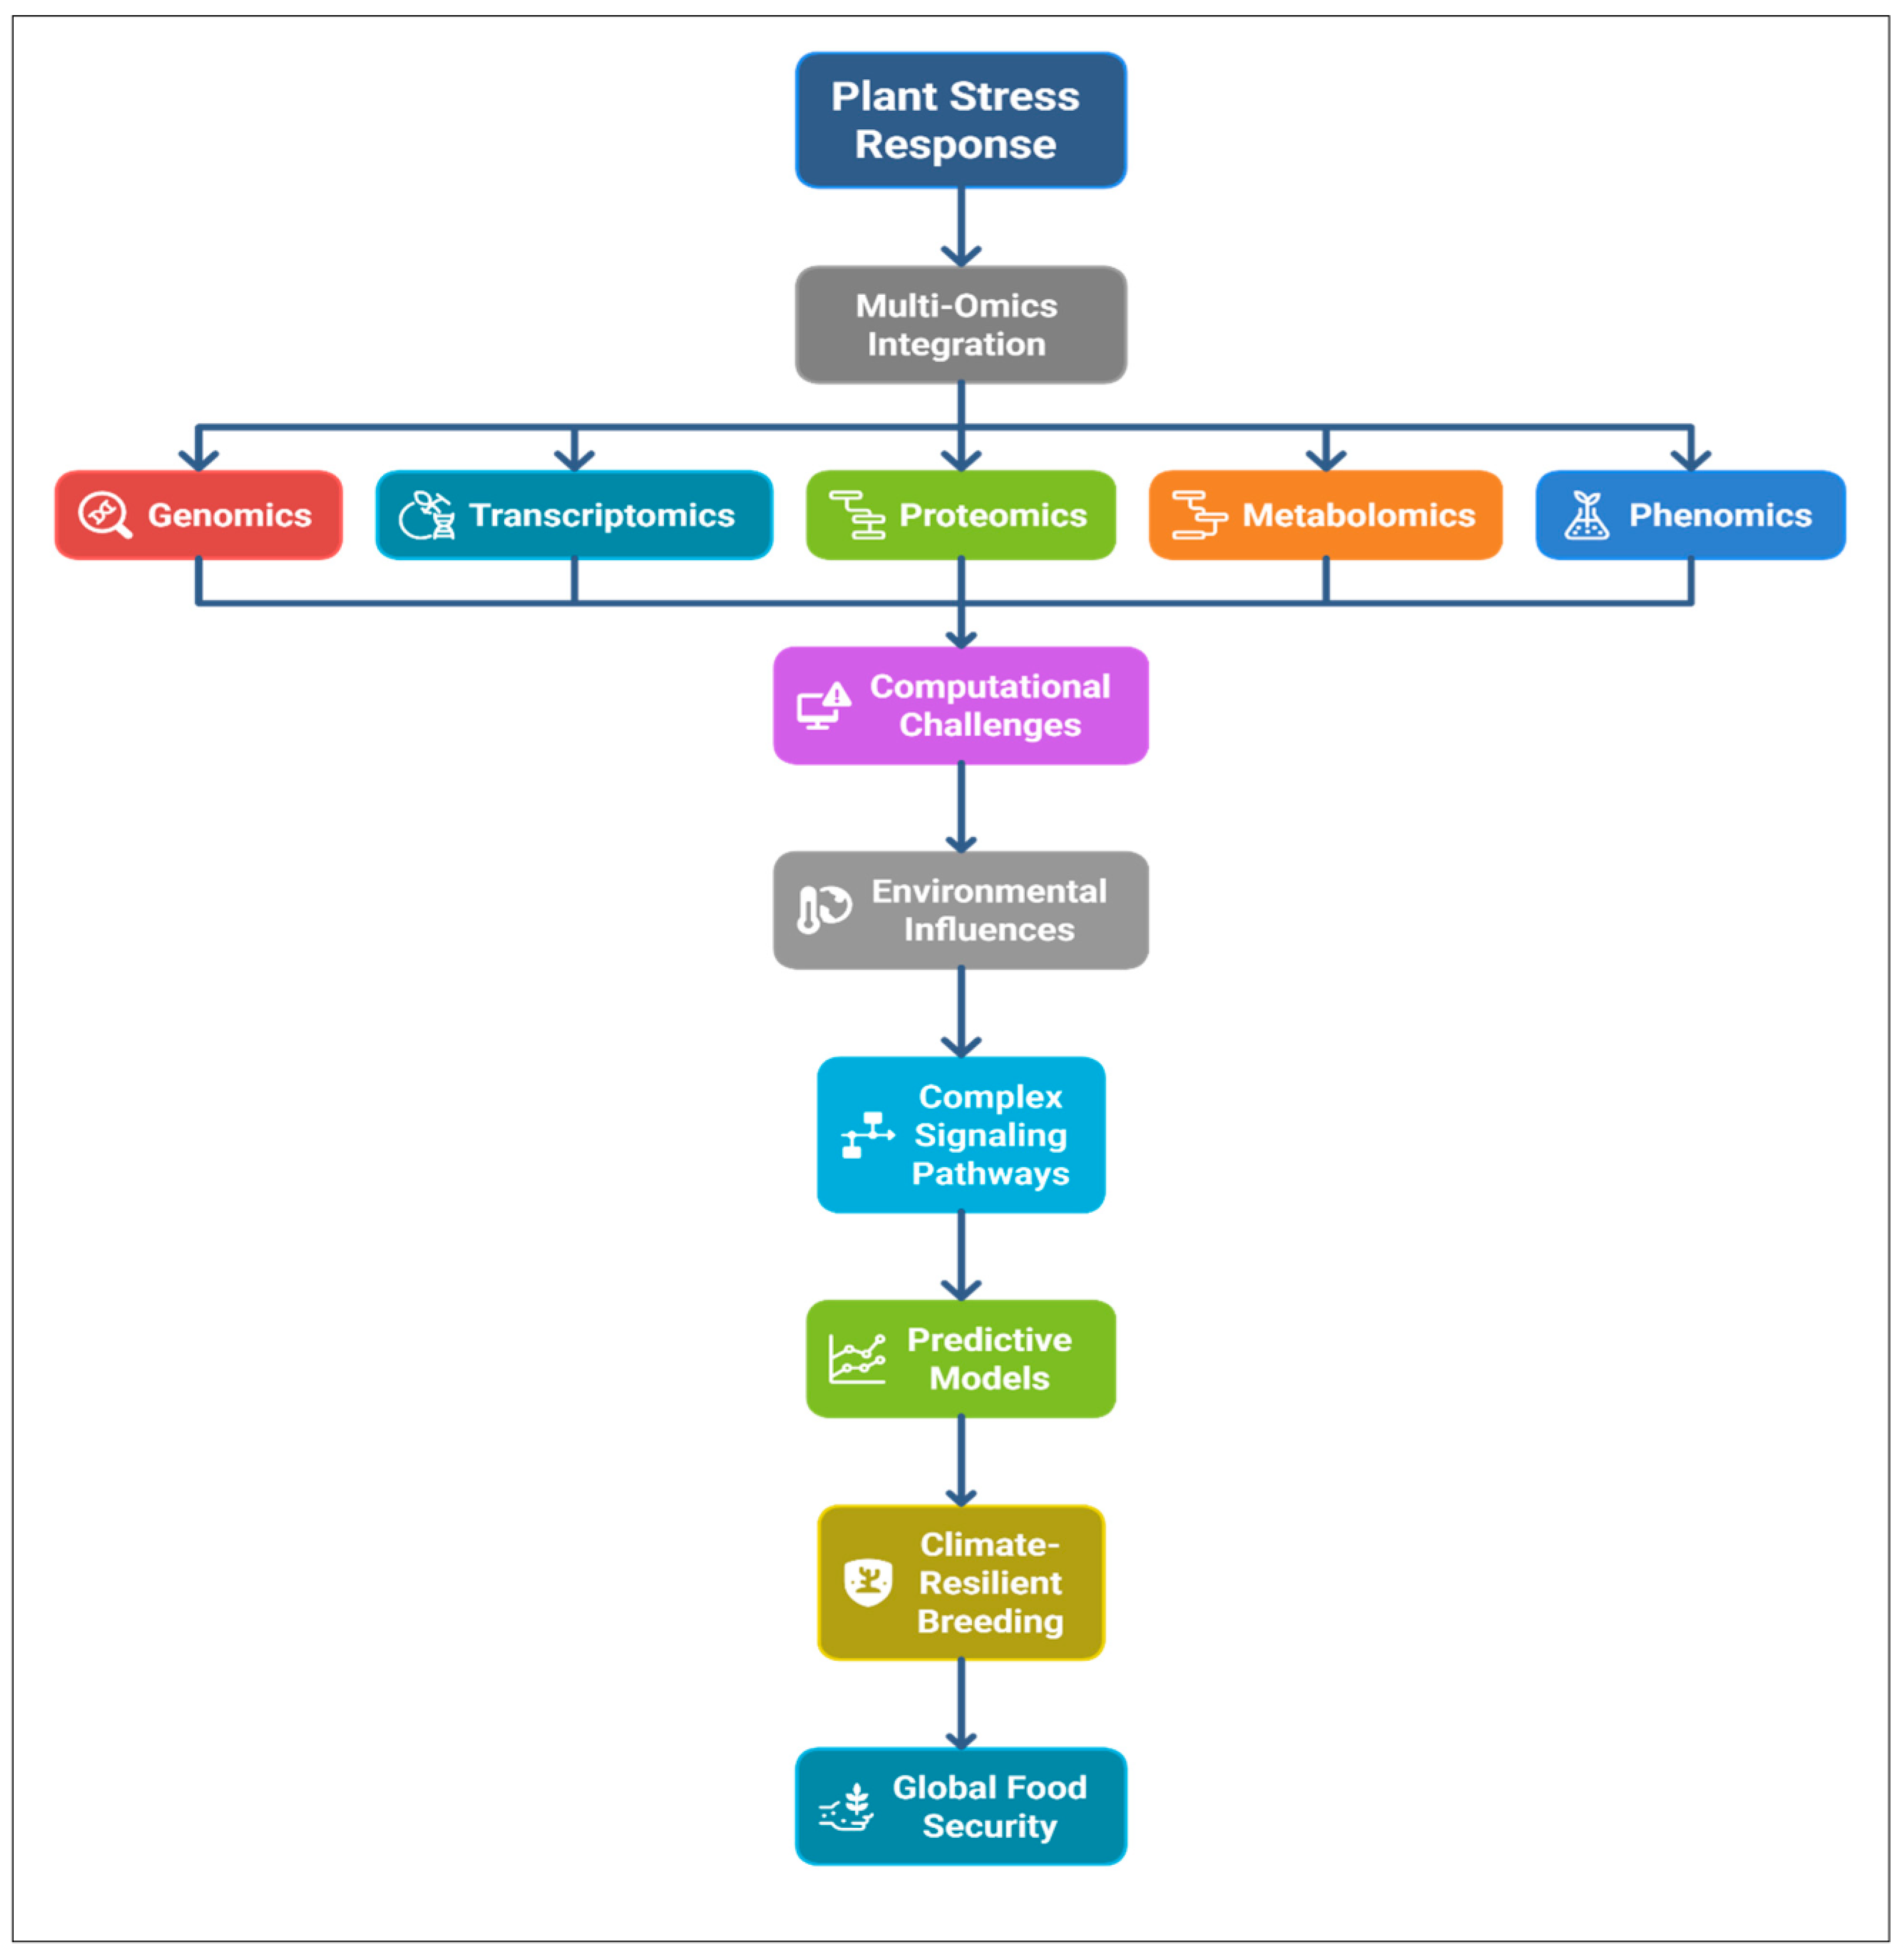
2. The Multi-Omics Toolkit in Plant Stress Biology
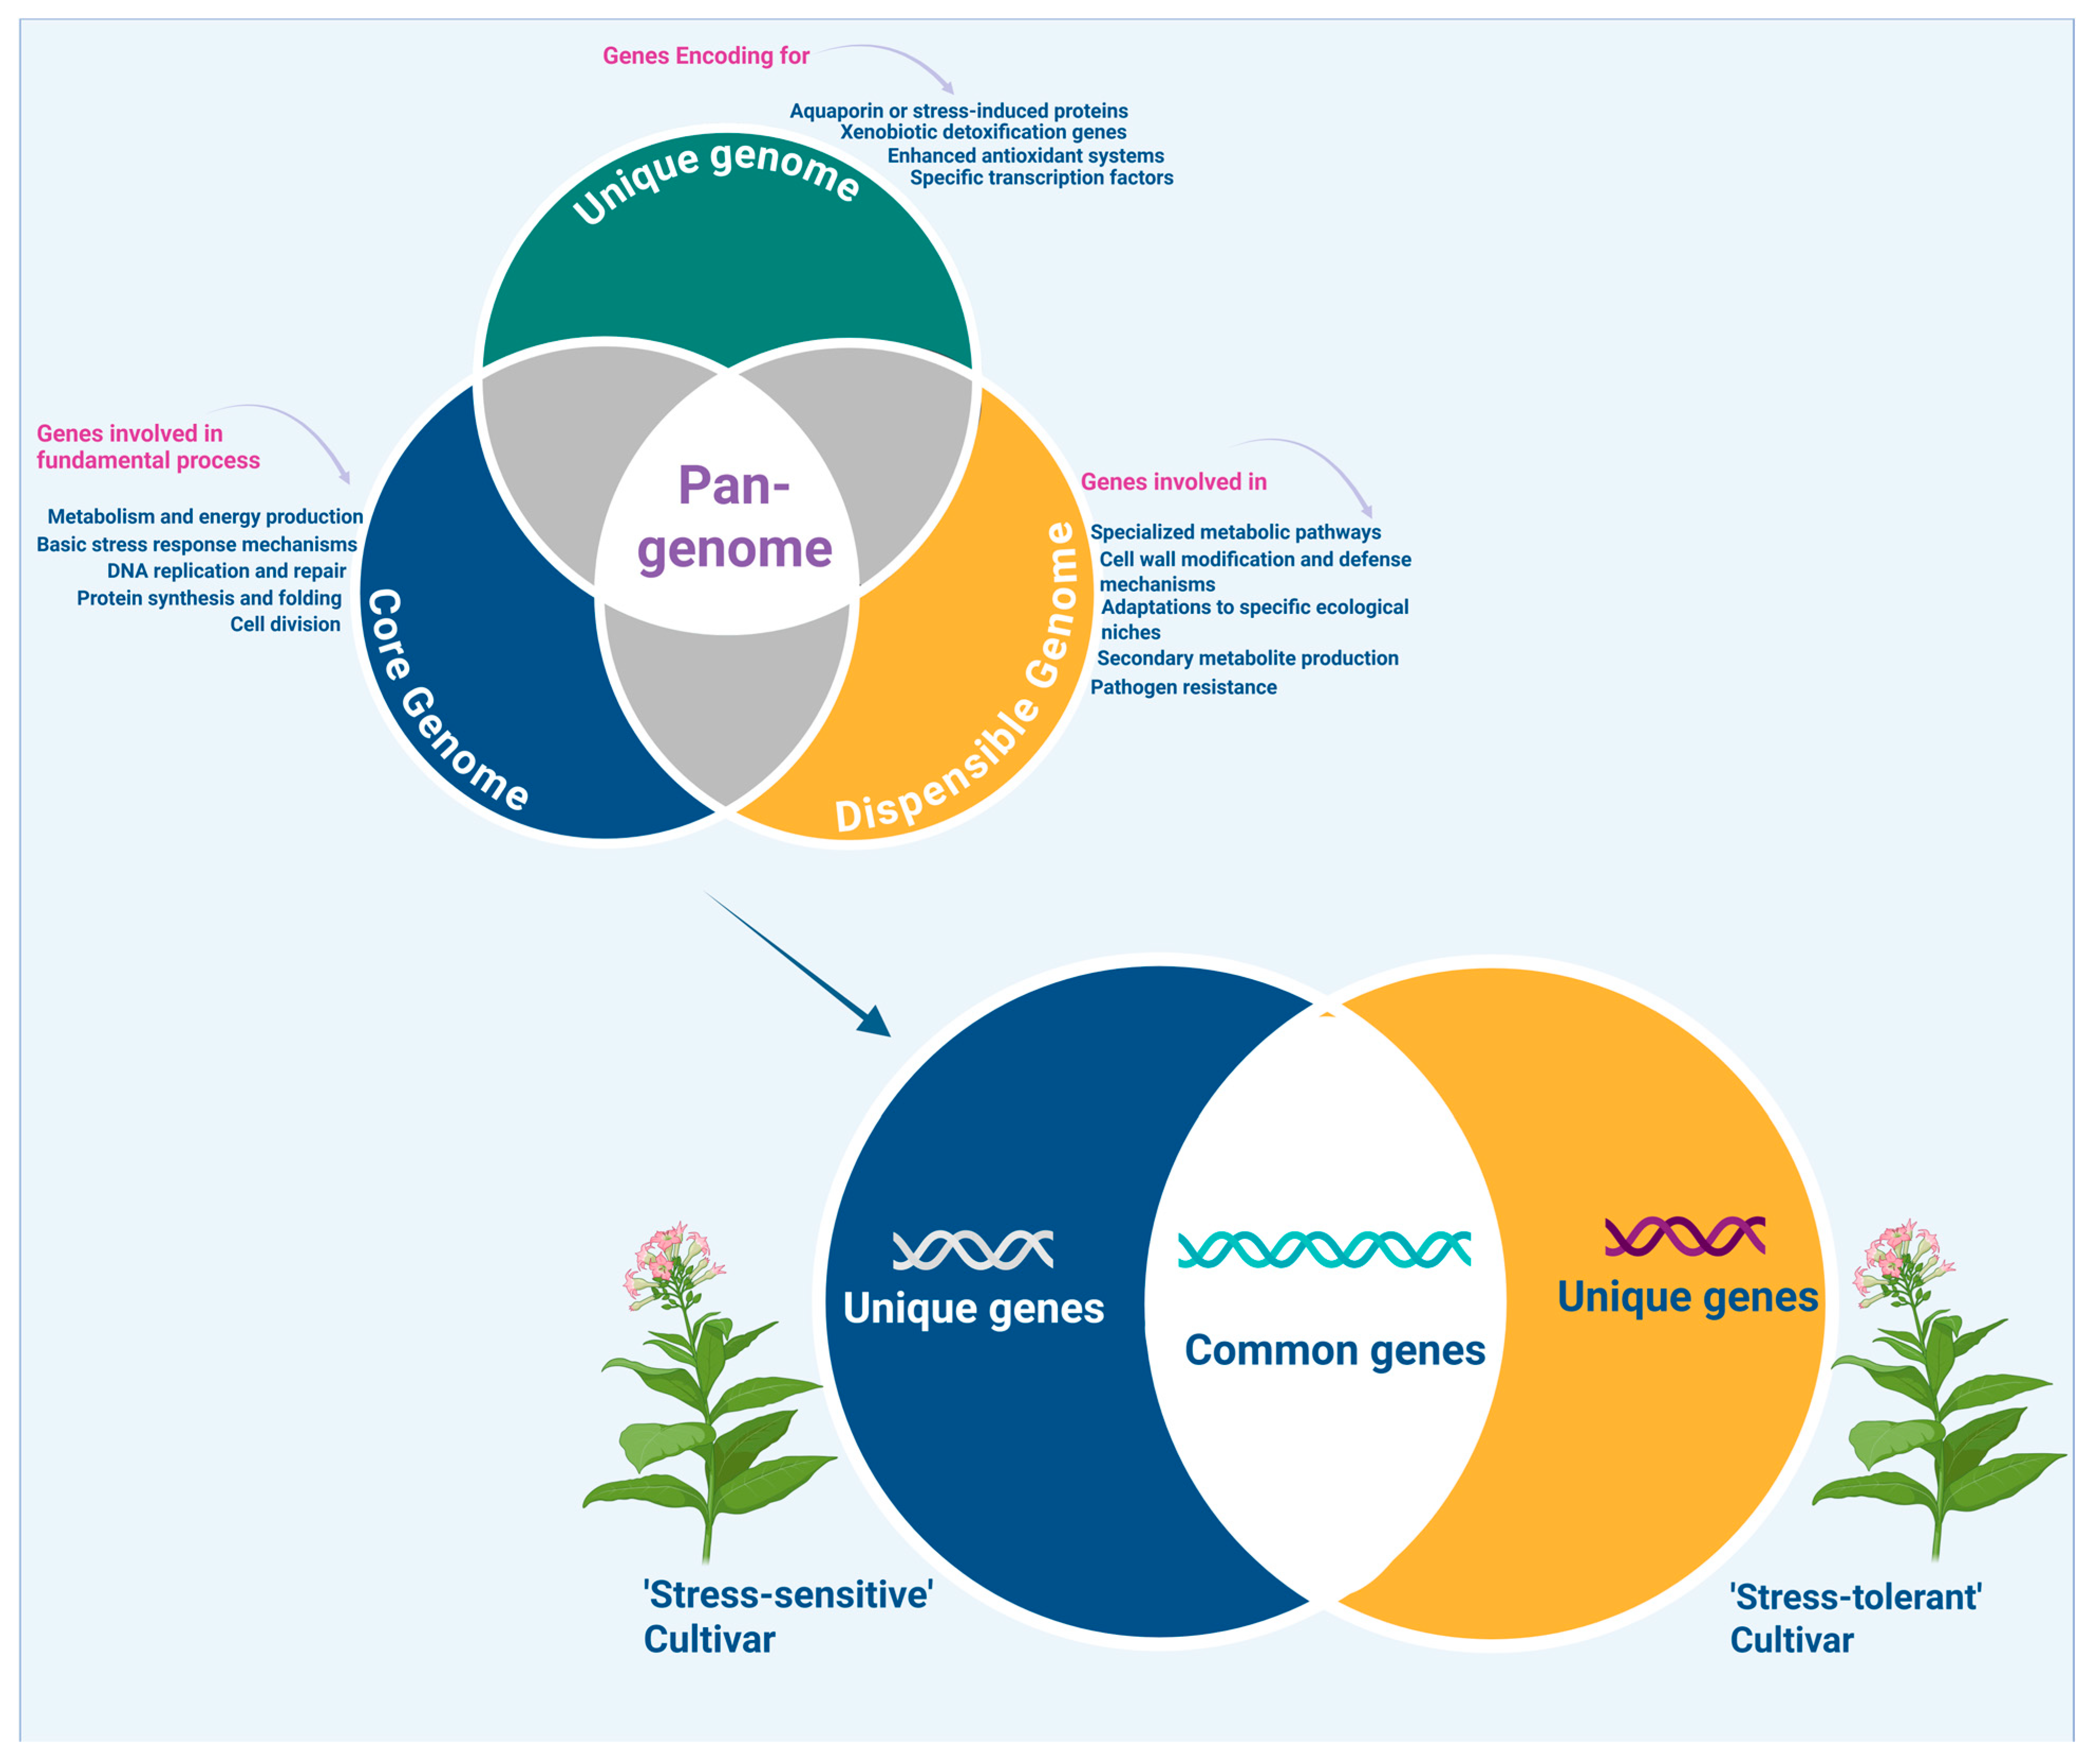
2.1. Genomics and Pan-Genomics in Crop Stress Adaptation
2.2. Transcriptomics and Alternative Splicing Analyses Under Stress
2.3. Proteomics and Post-Translational Modifications
2.4. Metabolomics and Stress-Induced Biochemical Pathways
2.5. Phenomics for Stress Tolerance Trait Quantification
3. Strategies for Multi-Omics Data Integration
3.1. Conceptual Frameworks for Omics Integration
3.2. Integration Tools and Data Fusion Platforms
3.3. Technical Challenges in Omics Fusion
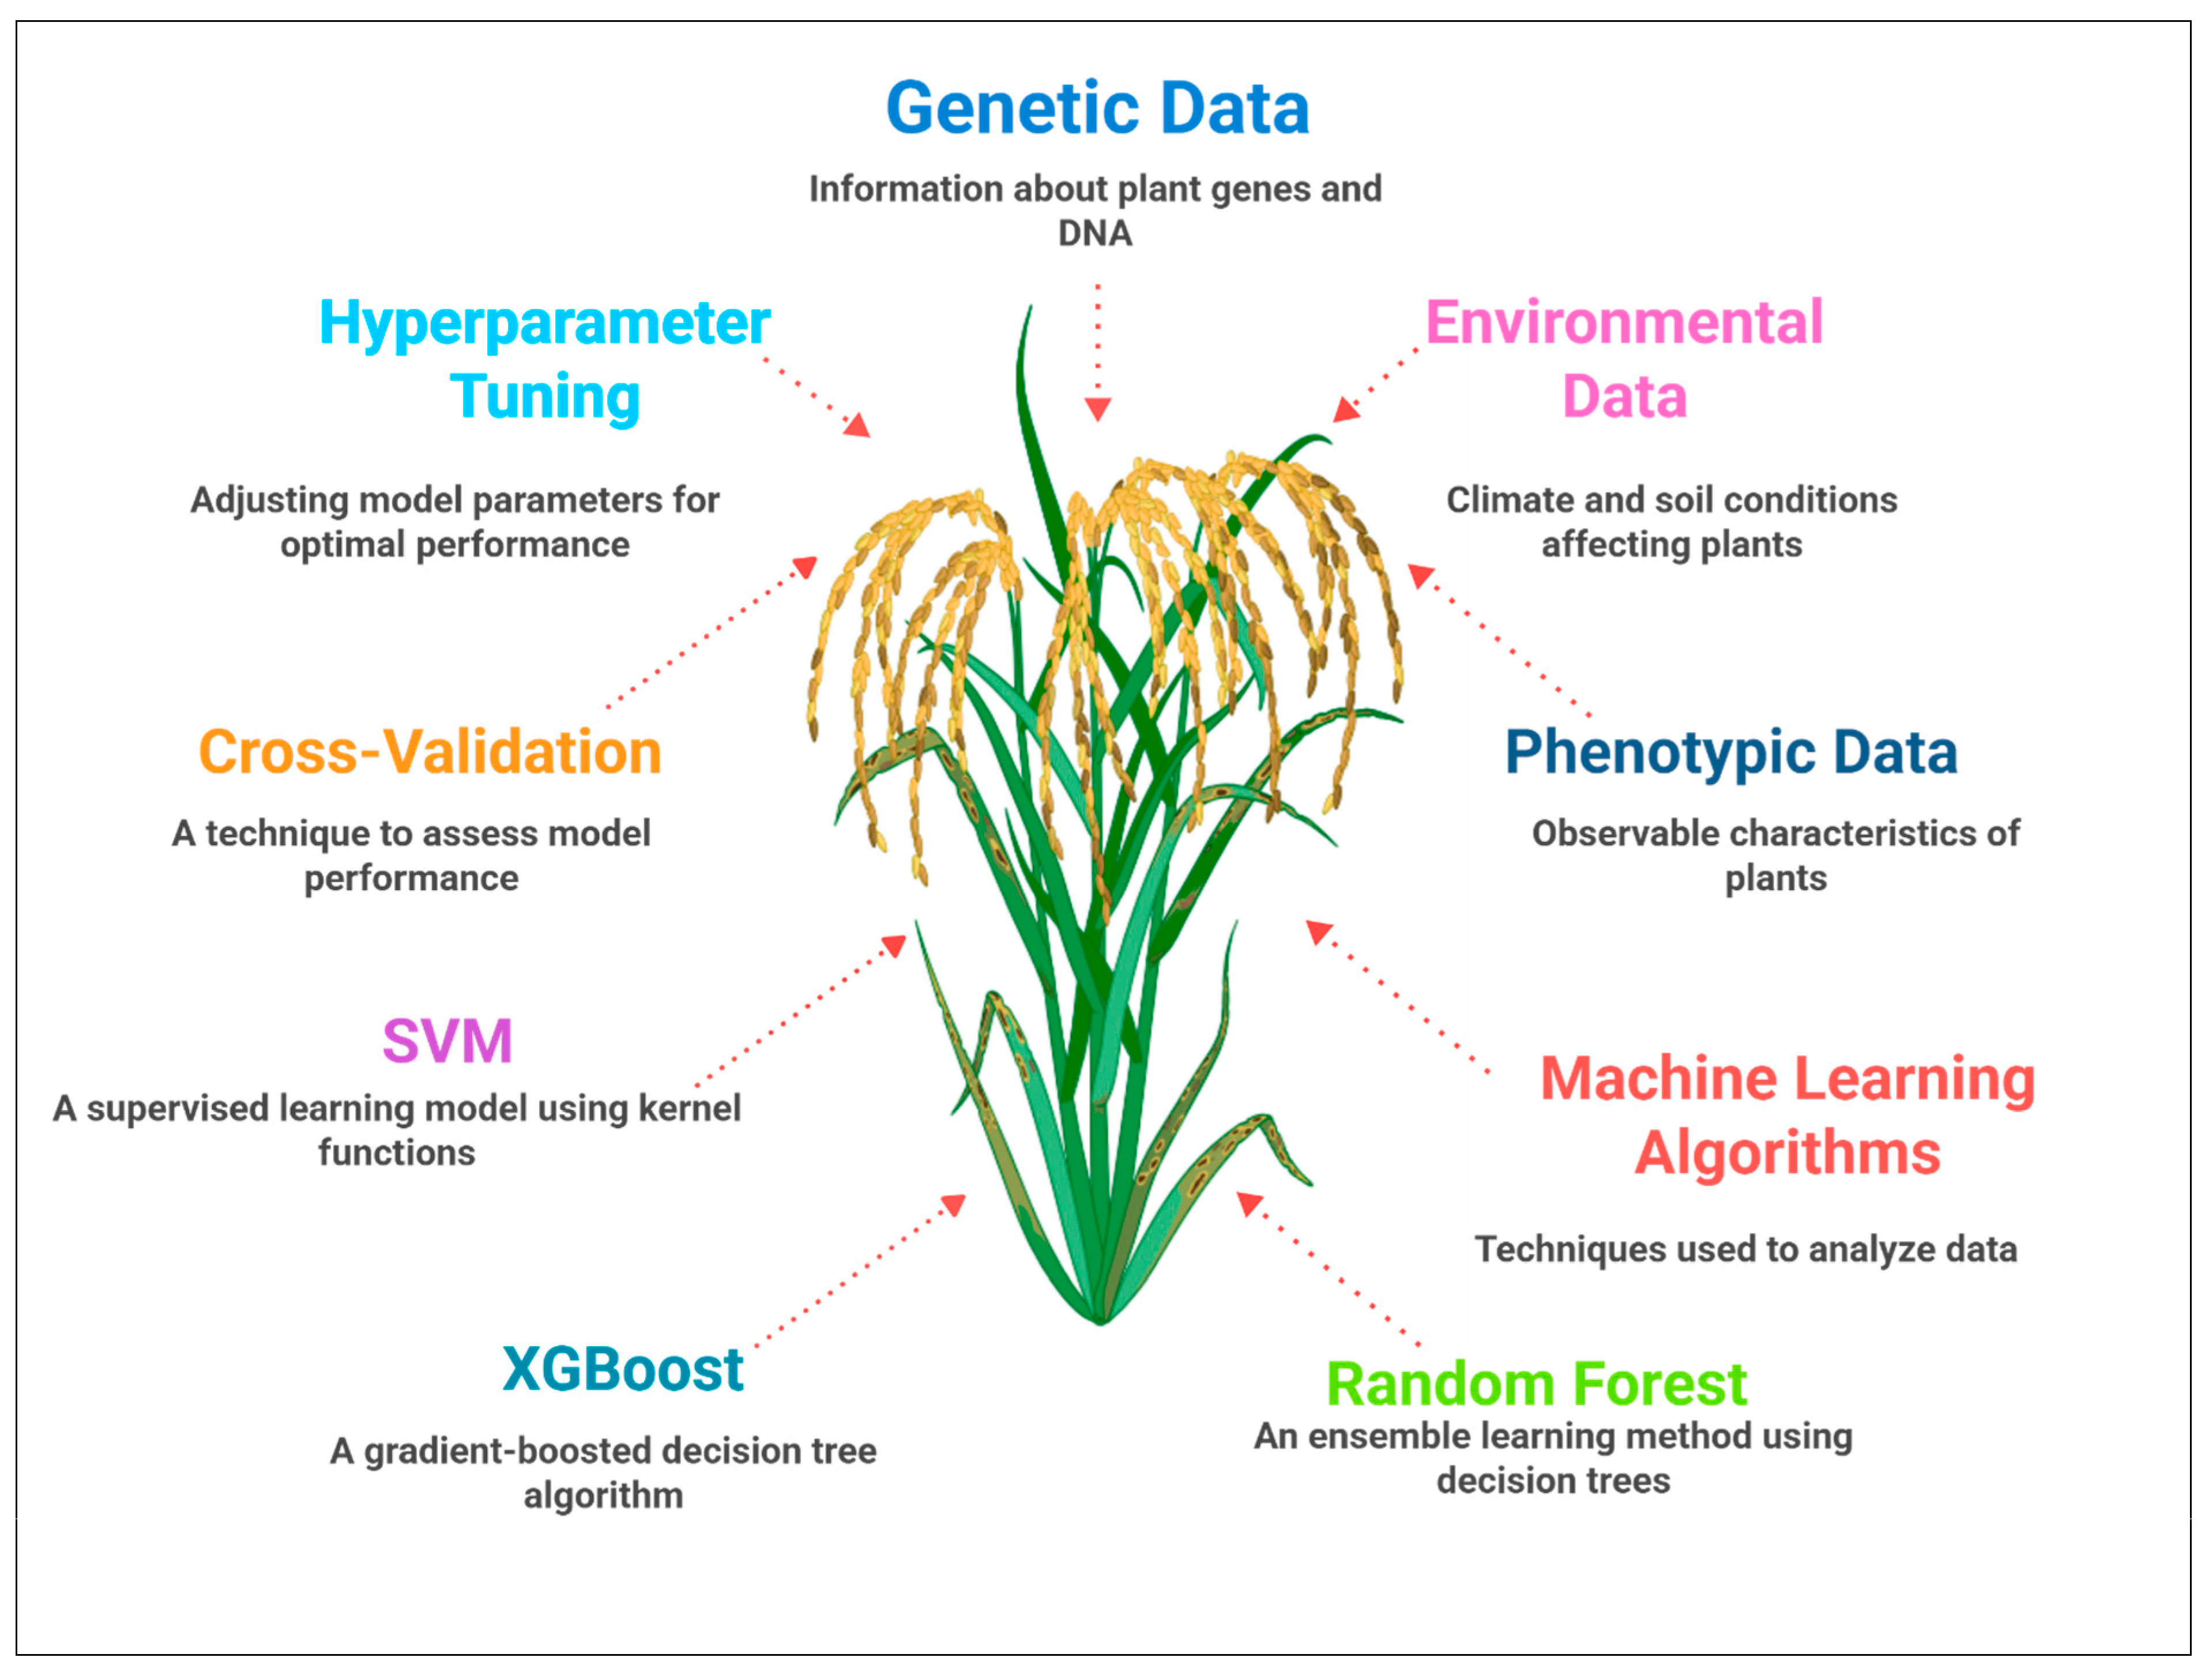
4. Predictive Modeling for Trait Selection
4.1. Machine Learning Algorithms for Trait Prediction
4.2. Deep Learning for Omics-Guided Genotype-to-Phenotype Modeling
4.3. Genomic Prediction Enhancement with Multi-Omics Layers
5. Digital Phenotyping and Environmental Interfacing
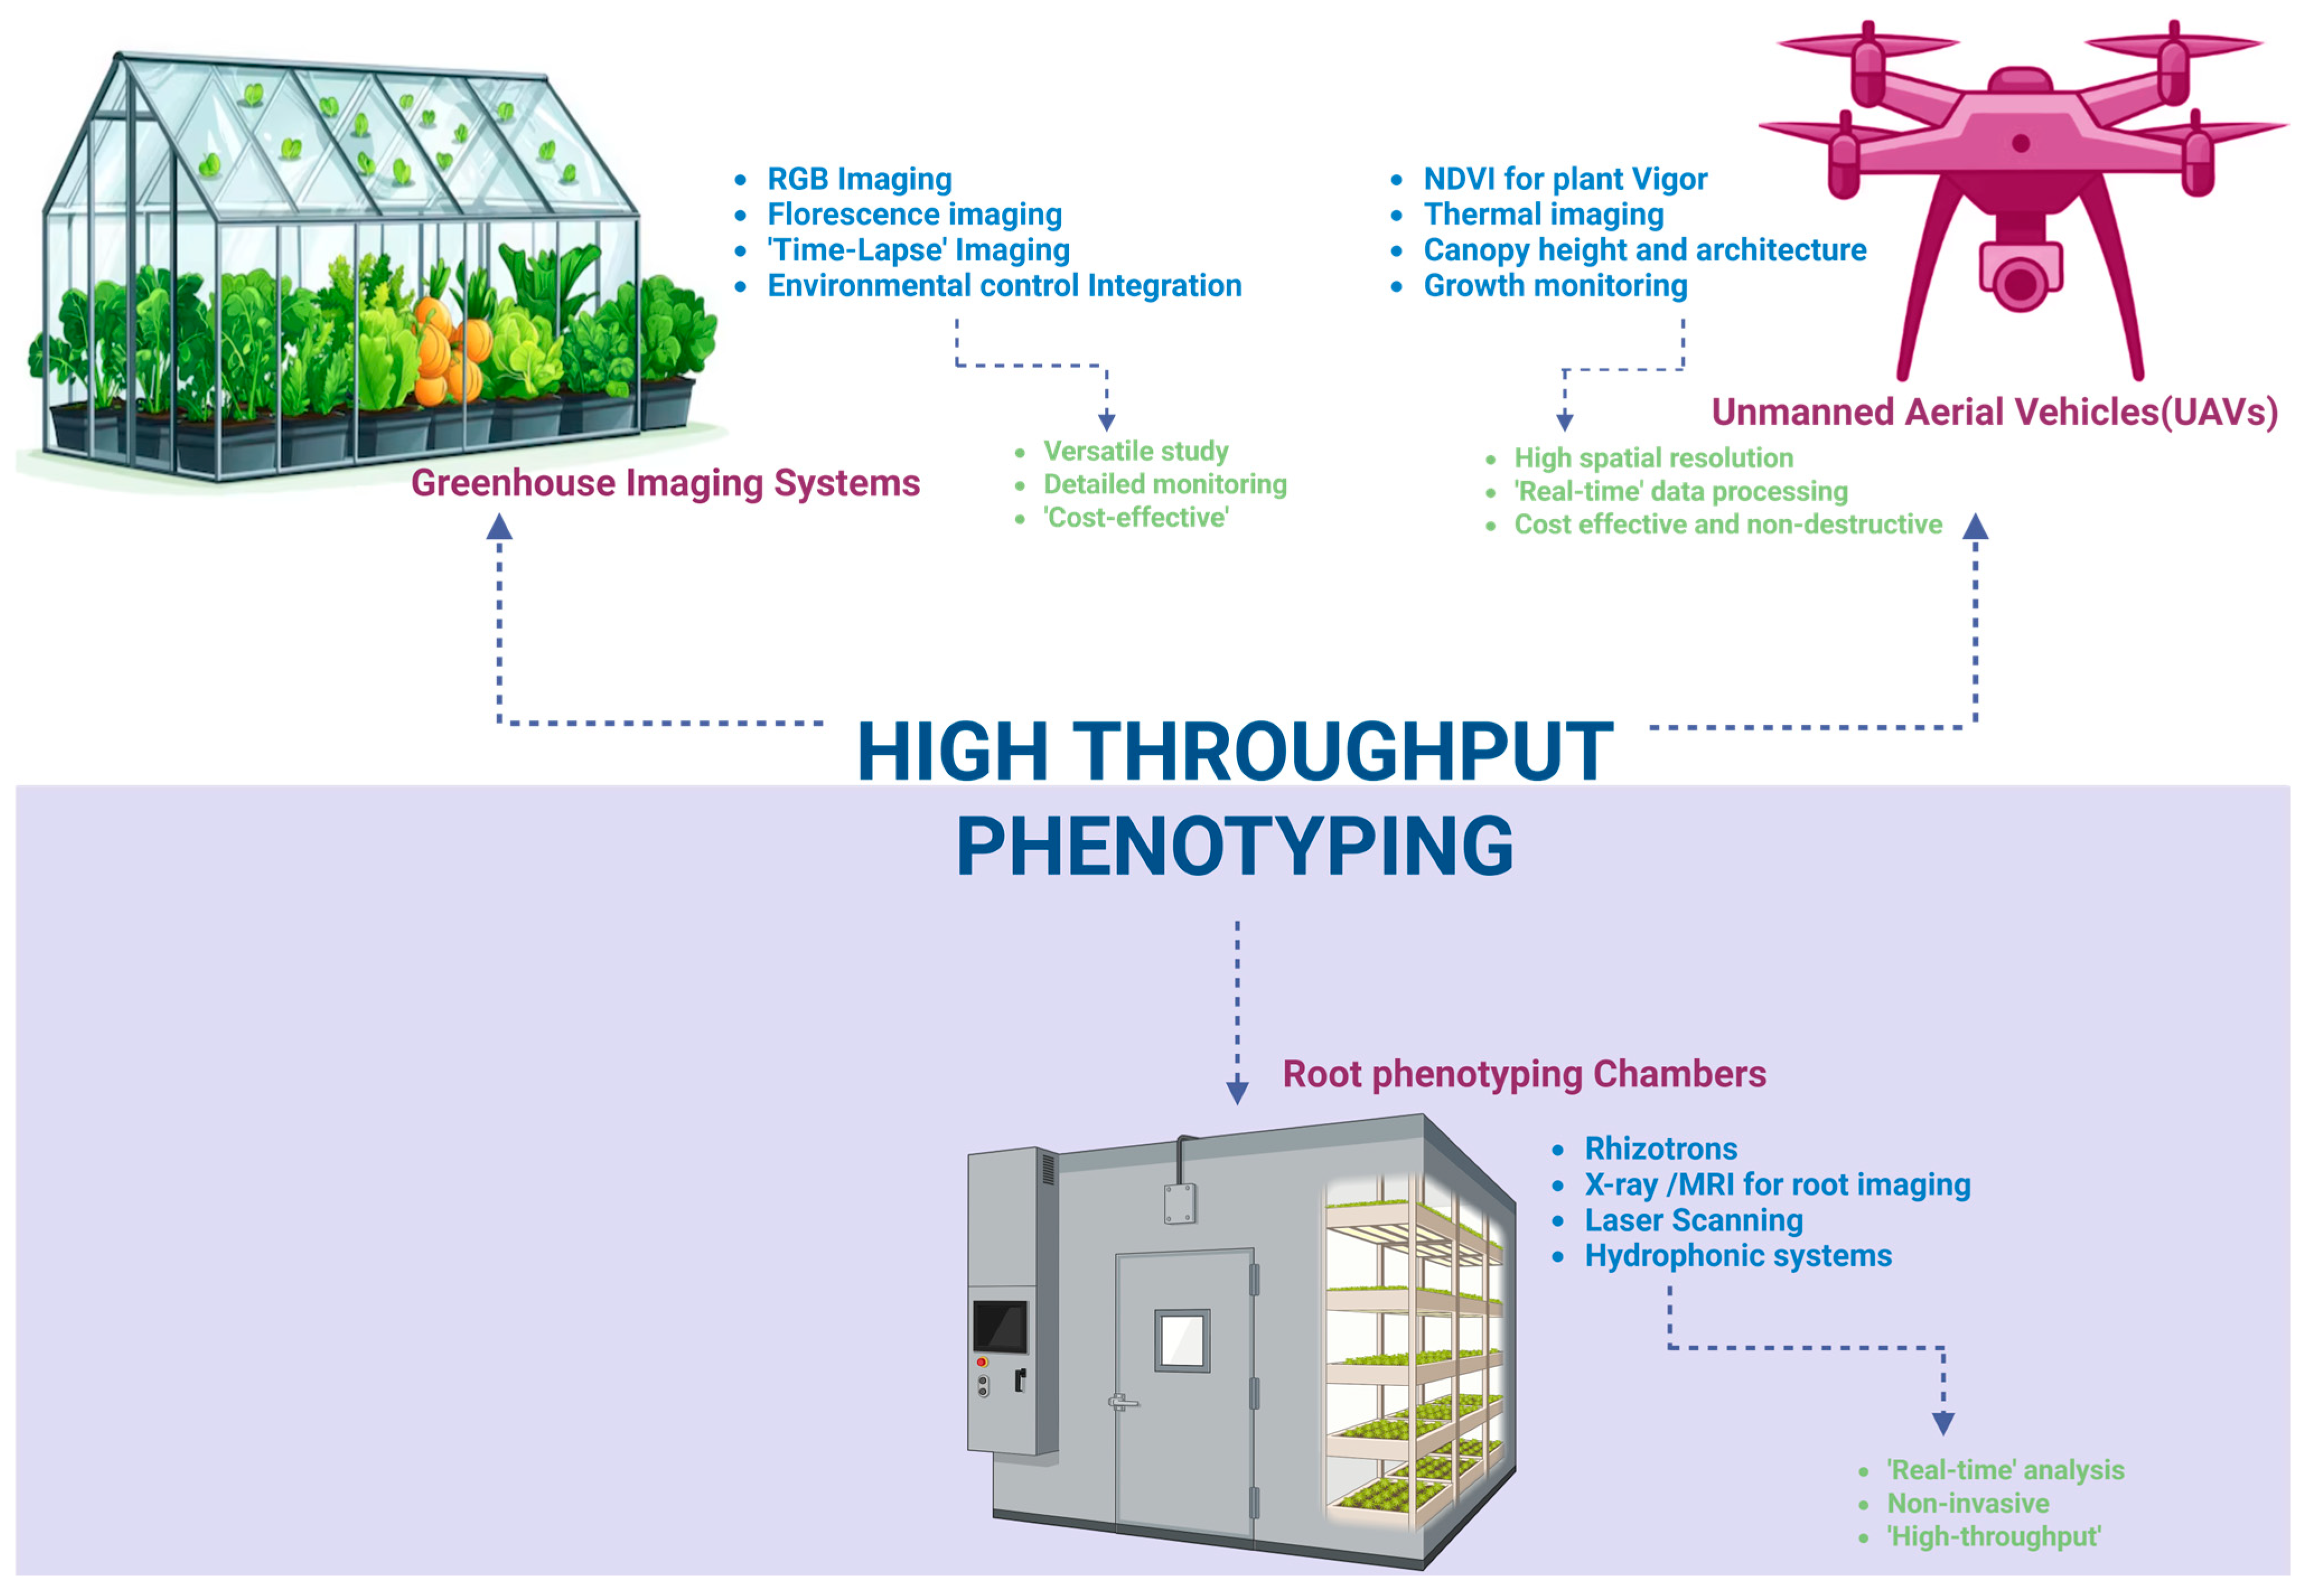
5.1. High-Throughput Phenotyping Platforms
5.2. Modeling G × E Interactions in Predictive Breeding
5.3. Integrating Climate and Omics Data
6. Challenges and Opportunities
6.1. Computational and Data Integration Bottlenecks
6.2. Biological Interpretation and Trait Complexity
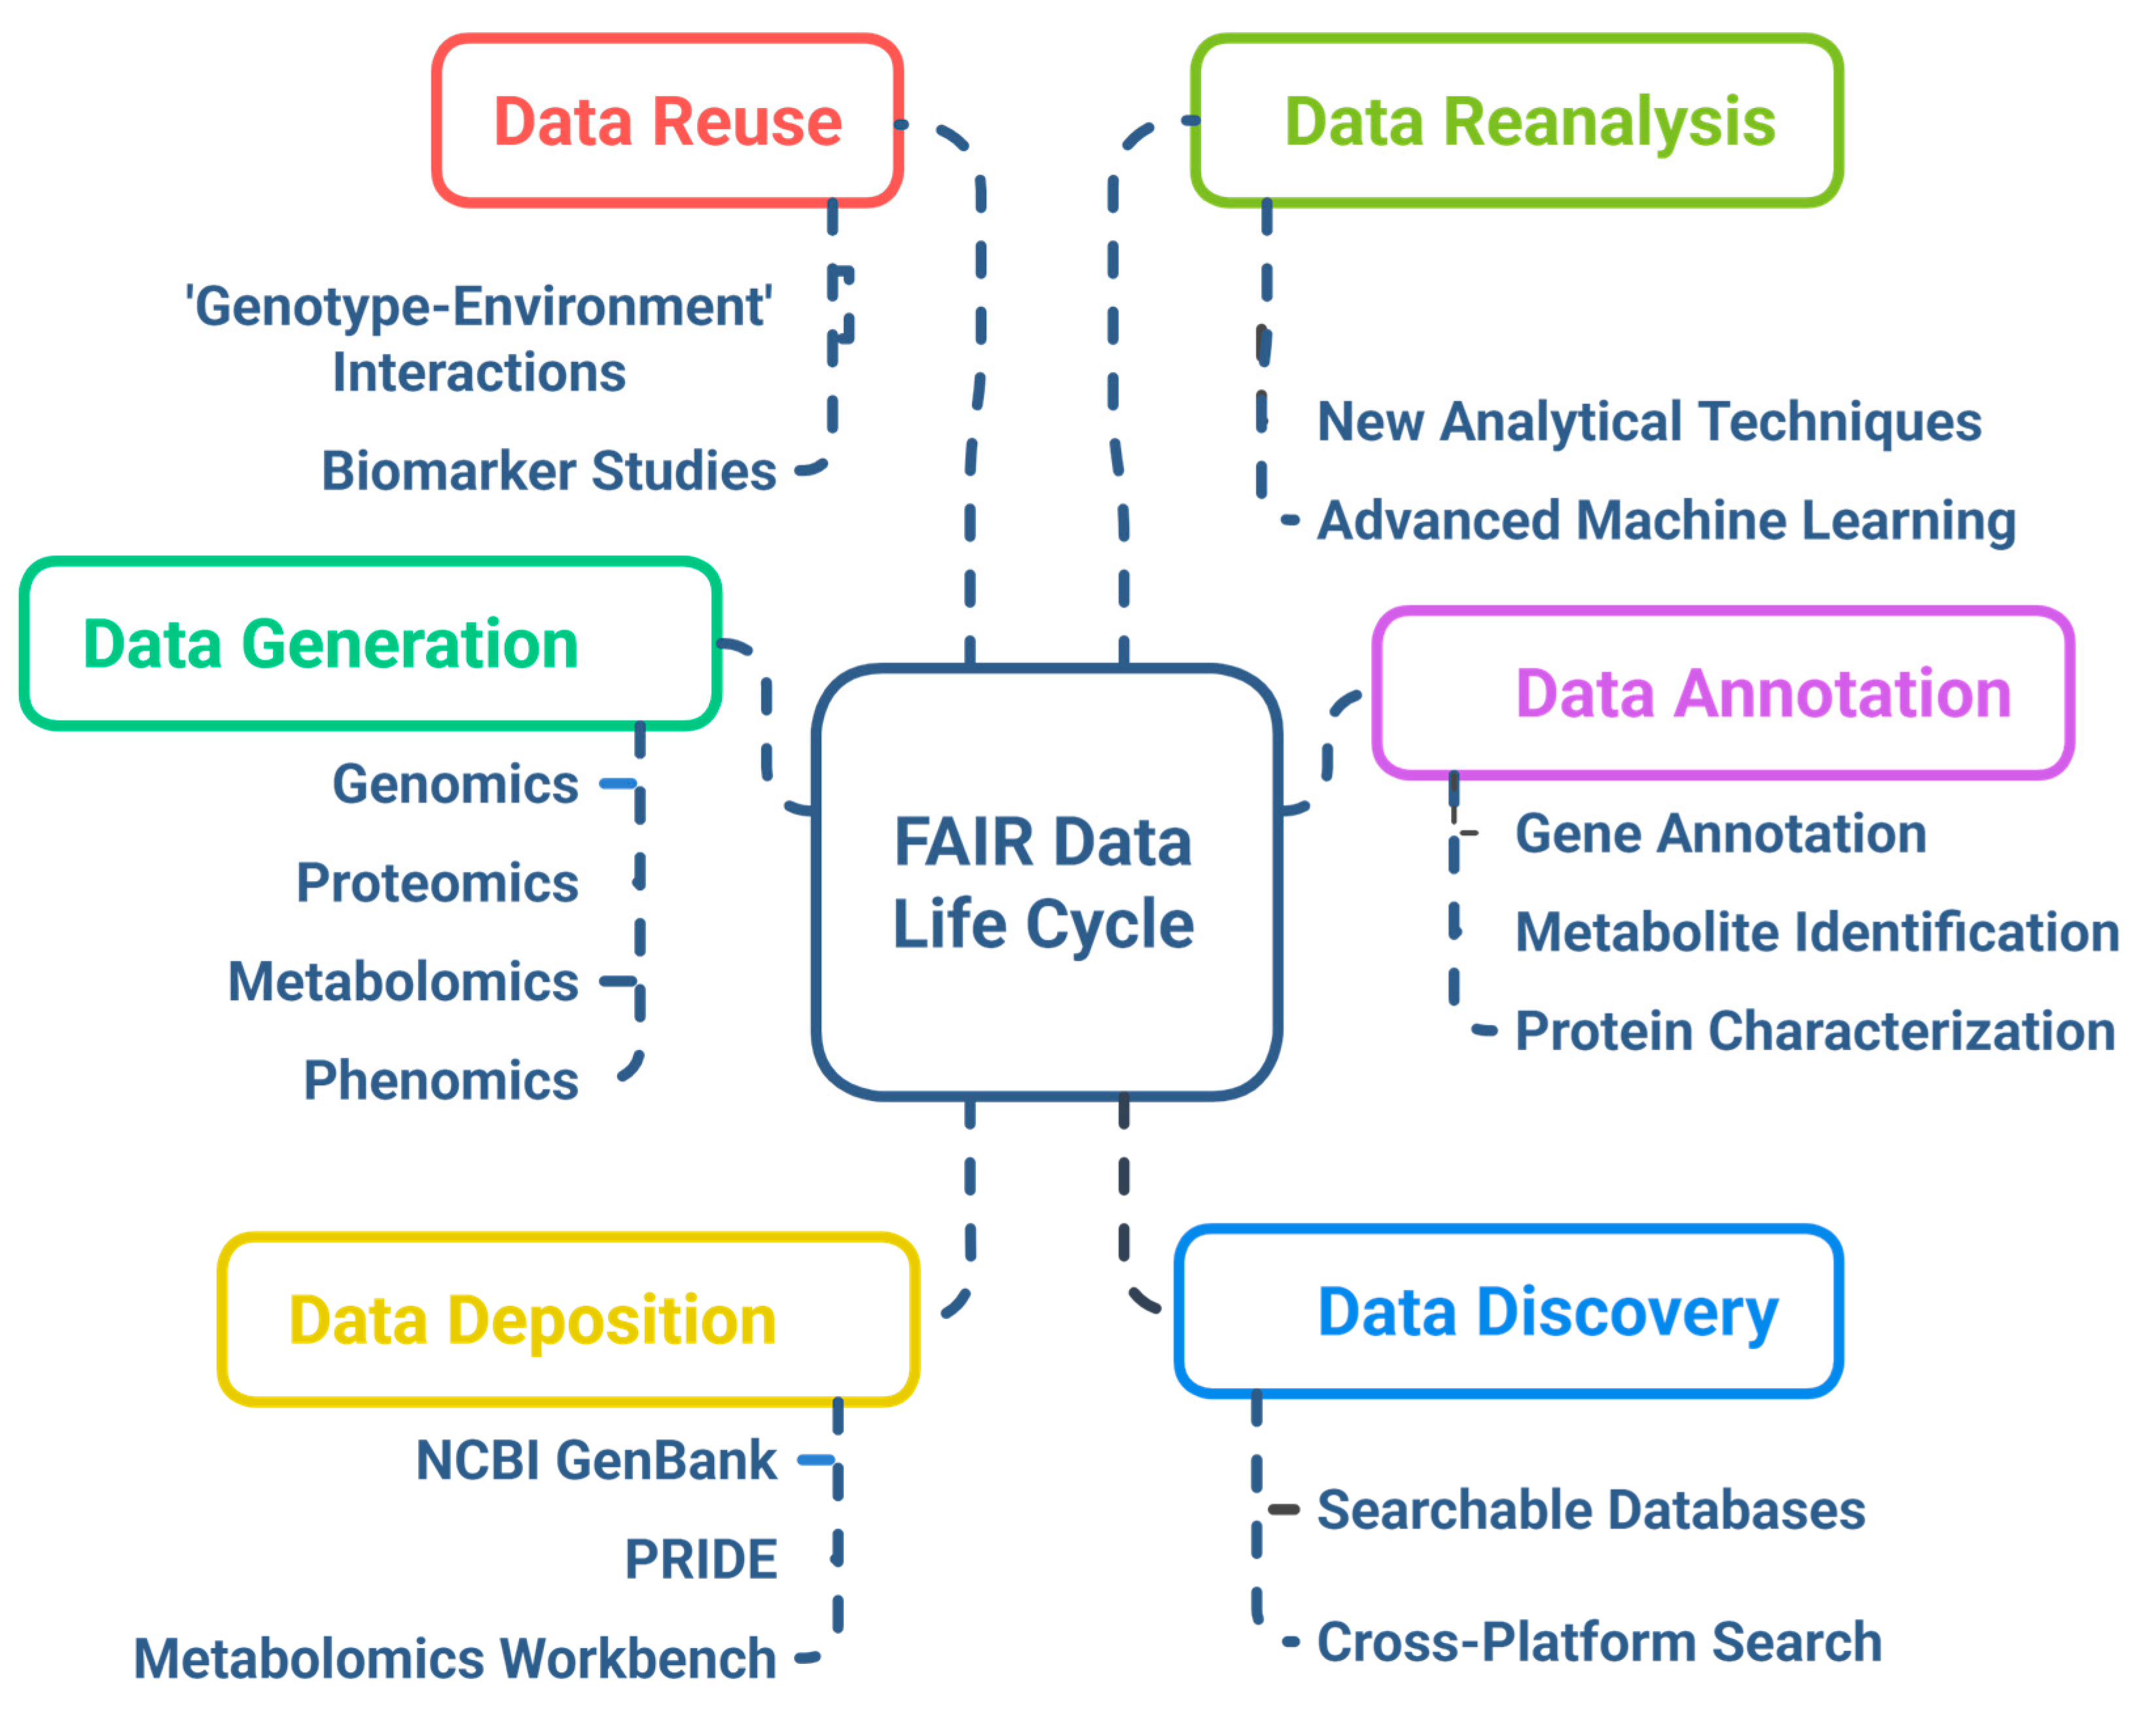
6.3. FAIR Data Principles and Ethical Considerations
6.4. Roadmap for Future Integration
7. Conclusions
Author Contributions
Funding
Conflicts of Interest
References
- Leisner, C. Review: Climate change impacts on food security- focus on perennial cropping systems and nutritional value. Plant Sci. Int. J. Exp. Plant Biol. 2020, 293, 110412. [Google Scholar]
- Raza, A.; Safdar, M.; Adnan Shahid, M.; Shabir, G.; Khil, A.; Hussain, S.; Khan, M.; Aziz, S.U.R.; Azam, S.; Sattar, J. Climate Change Impacts on Crop Productivity and Food Security: An Overview. In Transforming Agricultural Management for a Sustainable Future Climate Change and Machine Learning Perspectives; Springer: Berlin/Heidelberg, Germany, 2024; pp. 163–186. [Google Scholar]
- Chaudhry, S.; Sidhu, G.P.S. Climate change regulated abiotic stress mechanisms in plants: A comprehensive review. Plant Cell Rep. 2022, 41, 1–31. [Google Scholar] [PubMed]
- Tester, M.; Langridge, P. Breeding technologies to increase crop production in a changing world. Science 2010, 327, 818–822. [Google Scholar] [PubMed]
- Singh, B.D.; Singh, A.K. Marker-Assisted Plant Breeding: Principles and Practices; Springer: Berlin/Heidelberg, Germany, 2015. [Google Scholar]
- Boopathi, N.M. Genetic Mapping and Marker Assisted Selection; Springer: New Delhi, India, 2013; Volume 10, pp. 978–981. [Google Scholar]
- Jiang, G.-L. Molecular markers and marker-assisted breeding. In Plant Breeding from Laboratories to Fields; IntechOpen: London, UK, 2013; pp. 45–85. [Google Scholar]
- Satrio, R.D.; Fendiyanto, M.H.; Miftahudin, M. Tools and techniques used at global scale through genomics, transcriptomics, proteomics, and metabolomics to investigate plant stress responses at the molecular level. In Molecular Dynamics of Plant Stress and Its Management; Springer: Berlin/Heidelberg, Germany, 2024; pp. 555–607. [Google Scholar]
- Alexandrov, T. Spatial metabolomics and imaging mass spectrometry in the age of artificial intelligence. Annu. Rev. Biomed. Data Sci. 2020, 3, 61–87. [Google Scholar]
- Li, Y.; Wu, F.-X.; Ngom, A. A review on machine learning principles for multi-view biological data integration. Brief. Bioinform. 2018, 19, 325–340. [Google Scholar]
- Hesami, M.; Alizadeh, M.; Jones, A.M.P.; Torkamaneh, D. Machine learning: Its challenges and opportunities in plant system biology. Appl. Microbiol. Biotechnol. 2022, 106, 3507–3530. [Google Scholar]
- Bhuiyan, M.M.R.; Rahaman, M.M.; Aziz, M.M.; Islam, M.R.; Das, K. Predictive analytics in plant biotechnology: Using data science to drive crop resilience and productivity. J. Environ. Agric. Stud. 2023, 4, 77–83. [Google Scholar]
- Fan, B.-L.; Chen, L.-H.; Chen, L.-L.; Guo, H. Integrative Multi-Omics Approaches for Identifying and Characterizing Biological Elements in Crop Traits: Current Progress and Future Prospects. Int. J. Mol. Sci. 2025, 26, 1466. [Google Scholar]
- Granier, C.; Vile, D. Phenotyping and beyond: Modelling the relationships between traits. Curr. Opin. Plant Biol. 2014, 18, 96–102. [Google Scholar]
- Wörheide, M.A.; Krumsiek, J.; Kastenmüller, G.; Arnold, M. Multi-omics integration in biomedical research–A metabolomics-centric review. Anal. Chim. Acta 2021, 1141, 144–162. [Google Scholar]
- Kamali, S.; Singh, A. Genomic and Transcriptomic Approaches to Developing Abiotic Stress-Resilient Crops. Agronomy 2023, 13, 2903. [Google Scholar] [CrossRef]
- Mayr, M.; Mayr, U.; Chung, Y.L.; Yin, X.; Griffiths, J.R.; Xu, Q. Vascular proteomics: Linking proteomic and metabolomic changes. Proteomics 2004, 4, 3751–3761. [Google Scholar] [PubMed]
- Upadhyay, V.R.; Ramesh, V.; Kumar, H.; Somagond, Y.M.; Priyadarsini, S.; Kuniyal, A.; Prakash, V.; Sahoo, A. Phenomics in livestock research: Bottlenecks and promises of digital phenotyping and other quantification techniques on a global scale. OMICS A J. Integr. Biol. 2024, 28, 380–393. [Google Scholar]
- Silaiyiman, S.; Liu, J.; Wu, J.; Ouyang, L.; Cao, Z.; Shen, C. A Systematic Review of the Advances and New Insights into Copy Number Variations in Plant Genomes. Plants 2025, 14, 1399. [Google Scholar] [CrossRef]
- Whibley, A.; Kelley, J.L.; Narum, S.R. The Changing Face of Genome Assemblies: Guidance on Achieving High-Quality Reference Genomes; Wiley Online Library: Hoboken, NJ, USA, 2021. [Google Scholar]
- Sherman, R.M.; Salzberg, S.L. Pan-genomics in the human genome era. Nat. Rev. Genet. 2020, 21, 243–254. [Google Scholar]
- Amir, R.; Maqsood, W.; Munir, F.; Fatima, N.; Siddiqa, A.; Ahmad, J. Pan-genomics of plant pathogens and its applications. In Pan-Genomics: Applications, Challenges, and Future Prospects; Elsevier: Amsterdam, The Netherlands, 2020; pp. 121–145. [Google Scholar]
- Sarawad, A.; Hosagoudar, S.; Parvatikar, P. Pan-genomics: Insight into the Functional Genome, Applications, Advancements, and Challenges. Curr. Genom. 2025, 26, 2–14. [Google Scholar]
- Tyagi, A.; Mir, Z.A.; Almalki, M.A.; Deshmukh, R.; Ali, S. Genomics-assisted breeding: A powerful breeding approach for improving plant growth and stress resilience. Agronomy 2024, 14, 1128. [Google Scholar] [CrossRef]
- Pirona, R.; Frugis, G.; Locatelli, F.; Mattana, M.; Genga, A.; Baldoni, E. Transcriptomic analysis reveals the gene regulatory networks involved in leaf and root response to osmotic stress in tomato. Front. Plant Sci. 2023, 14, 1155797. [Google Scholar]
- Javaid, M.H.; Khan, A.R.; Salam, A.; Neelam, A.; Azhar, W.; Ulhassan, Z.; Gan, Y. Exploring the adaptive responses of plants to abiotic stresses using transcriptome data. Agriculture 2022, 12, 211. [Google Scholar] [CrossRef]
- Mastrangelo, A.M.; Marone, D.; Laidò, G.; De Leonardis, A.M.; De Vita, P. Alternative splicing: Enhancing ability to cope with stress via transcriptome plasticity. Plant Sci. 2012, 185, 40–49. [Google Scholar]
- Hassan, M.Q.; Tye, C.E.; Stein, G.S.; Lian, J.B. Non-coding RNAs: Epigenetic regulators of bone development and homeostasis. Bone 2015, 81, 746–756. [Google Scholar] [PubMed]
- Singh, S.; Praveen, A.; Dudha, N.; Sharma, V.K.; Bhadrecha, P. Single-cell transcriptomics: A new frontier in plant biotechnology research. Plant Cell Rep. 2024, 43, 294. [Google Scholar] [PubMed]
- Filichkin, S.; Priest, H.; Givan, S.; Shen, R.; Bryant, D.; Fox, S.; Wong, W.-K.; Mockler, T. Genome-wide mapping of alternative splicing in Arabidopsis thaliana. Genome Res. 2010, 20, 45–58. [Google Scholar] [PubMed]
- Filichkin, S.; Hamilton, M.; Dharmawardhana, P.; Singh, S.K.; Sullivan, C.; Ben-Hur, A.; Reddy, A.; Jaiswal, P. Abiotic Stresses Modulate Landscape of Poplar Transcriptome via Alternative Splicing, Differential Intron Retention, and Isoform Ratio Switching. Front. Plant Sci. 2018, 9, 5. [Google Scholar]
- Li, S.; Yu, X.; Cheng, Z.; Zeng, C.; Li, W.; Zhang, L.; Peng, M. Large-scale analysis of the cassava transcriptome reveals the impact of cold stress on alternative splicing. J. Exp. Bot. 2019, 71, 422–434. [Google Scholar]
- Yang, L.; Yang, L.; Zhao, C.; Liu, J.; Tong, C.; Zhang, Y.; Cheng, X.; Jiang, H.; Shen, J.; Xie, M.; et al. Differential alternative splicing genes and isoform co-expression networks of Brassica napus under multiple abiotic stresses. Front. Plant Sci. 2022, 13, 1009998. [Google Scholar]
- Kim, N.; Lee, J.; Yeom, S.-I.; Kang, N.-J.; Kang, W.-H. The landscape of abiotic and biotic stress-responsive splice variants with deep RNA-seq datasets in hot pepper. Sci. Data 2024, 11, 3811. [Google Scholar]
- Wu, Z.-H.; He, L.-L.; Wang, C.-C.; Liang, C.; Li, H.-Y.; Zhong, D.-W.; Dong, Z.-X.; Zhang, L.-J.; Zhang, X.-Q.; Ge, L.-F.; et al. Unveiling unique alternative splicing responses to low temperature in Zoysia japonica through ZjRTD1.0, a high-quality reference transcript dataset. Physiol. Plant. 2024, 176, e14280. [Google Scholar]
- Wijesinghege, C.; Tran, K.-N.; Dassanayake, M. Alternative splicing preferentially increases transcript diversity associated with stress responses in the extremophyte Schrenkiella parvula. bioRxiv 2022. [Google Scholar] [CrossRef]
- Song, L.; Pan, Z.; Chen, L.; Dai, Y.; Wan, J.; Ye, H.; Nguyen, H.; Zhang, G.; Chen, H. Analysis of Whole Transcriptome RNA-seq Data Reveals Many Alternative Splicing Events in Soybean Roots under Drought Stress Conditions. Genes 2020, 11, 1520. [Google Scholar] [CrossRef]
- Xu, L.; Deng, J.; Wang, H.; Zhang, L.; Mi, X.; Luo, L.; Xie, H.; Liu, S.; Wang, S.; Huang, S.; et al. Transcriptome analysis revealed alternative splicing landscape in response to gray-blight disease in tea plant. Ind. Crops Prod. 2025, 225, 120571. [Google Scholar]
- Vogel, C.; Marcotte, E.M. Insights into the regulation of protein abundance from proteomic and transcriptomic analyses. Nat. Rev. Genet. 2012, 13, 227–232. [Google Scholar] [PubMed]
- Kosová, K.; Vítámvás, P.; Urban, M.O.; Prášil, I.T.; Renaut, J. Plant abiotic stress proteomics: The major factors determining alterations in cellular proteome. Front. Plant Sci. 2018, 9, 122. [Google Scholar]
- Samaržija, I. Post-translational modifications that drive prostate cancer progression. Biomolecules 2021, 11, 247. [Google Scholar] [CrossRef]
- Lacoursiere, R.E.; Hadi, D.; Shaw, G.S. Acetylation, phosphorylation, ubiquitination (oh my!): Following post-translational modifications on the ubiquitin road. Biomolecules 2022, 12, 467. [Google Scholar] [CrossRef]
- Basar, M.A.; Hosen, M.F.; Paul, B.K.; Hasan, M.R.; Shamim, S.M.; Bhuyian, T. Identification of drug and protein-protein interaction network among stress and depression: A bioinformatics approach. Inform. Med. Unlocked 2023, 37, 101174. [Google Scholar]
- Salam, U.; Ullah, S.; Tang, Z.-H.; Elateeq, A.A.; Khan, Y.; Khan, J.; Khan, A.; Ali, S. Plant metabolomics: An overview of the role of primary and secondary metabolites against different environmental stress factors. Life 2023, 13, 706. [Google Scholar] [CrossRef]
- Chen, Q.; Lu, X.; Guo, X.; Guo, Q.-X.; Li, D. Metabolomics Characterization of Two Apocynaceae Plants, Catharanthus roseus and Vinca minor, Using GC-MS and LC-MS Methods in Combination. Molecules 2017, 22, 997. [Google Scholar]
- Dai, H.; Xiao, C.; Liu, H.; Tang, H. Combined NMR and LC-MS analysis reveals the metabonomic changes in Salvia miltiorrhiza Bunge induced by water depletion. J. Proteome Res. 2010, 9, 1460–1475. [Google Scholar]
- Hamade, K.; Fliniaux, O.; Fontaine, J.-X.; Molinié, R.; N’Nang, E.O.; Bassard, S.; Guénin, S.; Gutierrez, L.; Lainé, É.; Hano, C.; et al. NMR and LC-MS-Based Metabolomics to Study Osmotic Stress in Lignan-Deficient Flax. Molecules 2021, 26, 767. [Google Scholar]
- Raletsena, M.; Mdlalose, S.; Bodede, O.; Assress, H.; Woldesemayat, A.; Modise, D. 1H-NMR and LC-MS Based Metabolomics Analysis of Potato (Solanum tuberosum L.) Cultivars Irrigated with Fly Ash Treated Acid Mine Drainage. Molecules 2022, 27, 1187. [Google Scholar] [PubMed]
- Jung, Y.; Ha, M.-K.; Lee, J.; Ahn, Y.; Kwak, J.; Ryu, D.; Hwang, G. Metabolite Profiling of the Response of Burdock Roots to Copper Stress. J. Agric. Food Chem. 2015, 63, 1309–1317. [Google Scholar] [PubMed]
- Allwood, J.; Goodacre, R. An introduction to liquid chromatography-mass spectrometry instrumentation applied in plant metabolomic analyses. Phytochem. Anal. PCA 2010, 21, 33–47. [Google Scholar] [PubMed]
- Tzin, V.; Malitsky, S.; Zvi, M.M.B.; Bedair, M.; Sumner, L.; Aharoni, A.; Galili, G. Expression of a bacterial feedback-insensitive 3-deoxy-D-arabino-heptulosonate 7-phosphate synthase of the shikimate pathway in Arabidopsis elucidates potential metabolic bottlenecks between primary and secondary metabolism. New Phytol. 2012, 194, 430–439. [Google Scholar]
- Kaiser, K. Metabolic Profiling of Primary and Secondary Biosynthetic Pathways in Angiosperms: Comparative Metabonomics and Applications of Hyphenated LC-NMR and LC-MS. Ph.D. Thesis, University of California, San Francisco, CA, USA, 2012. [Google Scholar]
- Angidi, S.; Madankar, K.; Tehseen, M.M.; Bhatla, A. Advanced High-Throughput Phenotyping Techniques for Managing Abiotic Stress in Agricultural Crops—A Comprehensive Review. Crops 2025, 5, 8. [Google Scholar]
- Zhang, Y.; Zhang, N. Imaging technologies for plant high-throughput phenotyping: A review. Front. Agric. Sci. Eng. 2018, 5, 406–419. [Google Scholar]
- Li, D.; Quan, C.; Song, Z.; Li, X.; Yu, G.; Li, C.; Muhammad, A. High-throughput plant phenotyping platform (HT3P) as a novel tool for estimating agronomic traits from the lab to the field. Front. Bioeng. Biotechnol. 2021, 8, 623705. [Google Scholar]
- Srivastava, U.; Kanchan, S.; Kesheri, M.; Gupta, M.K.; Singh, S. Types of omics data: Genomics, metagenomics, epigenomics, transcriptomics, proteomics, metabolomics, and phenomics. In Integrative Omics; Elsevier: Amsterdam, The Netherlands, 2024; pp. 13–34. [Google Scholar]
- Knox, S.S. From’omics’ to complex disease: A systems biology approach to gene-environment interactions in cancer. Cancer Cell Int. 2010, 10, 11. [Google Scholar]
- Ritchie, M.D.; Holzinger, E.R.; Li, R.; Pendergrass, S.A.; Kim, D. Methods of integrating data to uncover genotype–phenotype interactions. Nat. Rev. Genet. 2015, 16, 85–97. [Google Scholar]
- Ma, X.; Xia, H.; Liu, Y.; Wei, H.; Zheng, X.; Song, C.; Chen, L.; Liu, H.; Luo, L. Transcriptomic and metabolomic studies disclose key metabolism pathways contributing to well-maintained photosynthesis under the drought and the consequent drought-tolerance in rice. Front. Plant Sci. 2016, 7, 1886. [Google Scholar]
- Vahabi, N.; Michailidis, G. Unsupervised multi-omics data integration methods: A comprehensive review. Front. Genet. 2022, 13, 854752. [Google Scholar]
- Ulfenborg, B. Vertical and horizontal integration of multi-omics data with miodin. BMC Bioinform. 2019, 20, 649. [Google Scholar]
- Wang, B.; Liu, C.; Zhang, D.; He, C.; Zhang, J.; Li, Z. Effects of maize organ-specific drought stress response on yields from transcriptome analysis. BMC Plant Biol. 2019, 19, 335. [Google Scholar]
- Santiago-Rodriguez, T.M.; Hollister, E.B. Multi ‘omic data integration: A review of concepts, considerations, and approaches. Semin. Perinatol. 2021, 45, 151456. [Google Scholar] [PubMed]
- Ullah, M.A.; Abdullah-Zawawi, M.-R.; Zainal-Abidin, R.-A.; Sukiran, N.L.; Uddin, M.I.; Zainal, Z. A review of integrative omic approaches for understanding rice salt response mechanisms. Plants 2022, 11, 1430. [Google Scholar] [CrossRef]
- Akdemir, D.; Knox, R.; Isidro y Sánchez, J. Combining partially overlapping multi-omics data in databases using relationship matrices. Front. Plant Sci. 2020, 11, 947. [Google Scholar]
- Hecker, M.; Lambeck, S.; Toepfer, S.; Van Someren, E.; Guthke, R. Gene regulatory network inference: Data integration in dynamic models—A review. Biosystems 2009, 96, 86–103. [Google Scholar]
- Lv, L.; Zhang, W.; Sun, L.; Zhao, A.; Zhang, Y.; Wang, L.; Liu, Y.; Li, Z.; Li, H.; Chen, X. Gene co-expression network analysis to identify critical modules and candidate genes of drought-resistance in wheat. PLoS ONE 2020, 15, e0236186. [Google Scholar]
- Lee, B.; Zhang, S.; Poleksic, A.; Xie, L. Heterogeneous multi-layered network model for omics data integration and analysis. Front. Genet. 2020, 10, 1381. [Google Scholar]
- Misra, B.B.; Langefeld, C.; Olivier, M.; Cox, L.A. Integrated omics: Tools, advances and future approaches. J. Mol. Endocrinol. 2019, 62, R21–R45. [Google Scholar]
- Rohart, F.; Gautier, B.; Singh, A.; Lê Cao, K.-A. mixOmics: An R package for ‘omics feature selection and multiple data integration. PLoS Comput. Biol. 2017, 13, e1005752. [Google Scholar]
- John Martin, J.J.; Song, Y.; Hou, M.; Zhou, L.; Liu, X.; Li, X.; Fu, D.; Li, Q.; Cao, H.; Li, R. Multi-Omics Approaches in Oil Palm Research: A Comprehensive Review of Metabolomics, Proteomics, and Transcriptomics Based on Low-Temperature Stress. Int. J. Mol. Sci. 2024, 25, 7695. [Google Scholar] [PubMed]
- Calado, R.A. Statistical Methods for the Integrative Analysis of Single-Cell Multi-Omics Data. Ph.D. Thesis, University of Cambridge, Cambridge, UK, 2020. [Google Scholar]
- Xue, Z. Integration of High-Throughput Phenotyping and Genomics Data to Explore Arabidopsis Natural Variation. Ph.D. Thesis, Université Paris-Saclay, Paris, France, 2020. [Google Scholar]
- Roychowdhury, R.; Das, S.P.; Gupta, A.; Parihar, P.; Chandrasekhar, K.; Sarker, U.; Kumar, A.; Ramrao, D.P.; Sudhakar, C. Multi-omics pipeline and omics-integration approach to decipher plant’s abiotic stress tolerance responses. Genes 2023, 14, 1281. [Google Scholar] [PubMed]
- Pei, G.; Chen, L.; Zhang, W. WGCNA application to proteomic and metabolomic data analysis. In Methods in Enzymology; Elsevier: Amsterdam, The Netherlands, 2017; Volume 585, pp. 135–158. [Google Scholar]
- Singh, A.; Gautier, B.; Shannon, C.P.; Vacher, M.; Rohart, F.; Tebbutt, S.J.; Cao, K.-A.L. DIABLO–an integrative, multi-omics, multivariate method for multi-group classification. BioRxiv 2016. [Google Scholar] [CrossRef]
- Chu, Y.; Kaushik, A.C.; Wang, X.; Wang, W.; Zhang, Y.; Shan, X.; Salahub, D.R.; Xiong, Y.; Wei, D.-Q. DTI-CDF: A cascade deep forest model towards the prediction of drug-target interactions based on hybrid features. Brief. Bioinform. 2019, 22, 451–462. [Google Scholar]
- Cuba Samaniego, C.; Franco, E. Ultrasensitive molecular controllers for quasi-integral feedback. Cell Syst. 2021, 12, 272–288.e273. [Google Scholar]
- Koh, H.W.L.; Fermin, D.; Vogel, C.; Choi, K.P.; Ewing, R.M.; Choi, H. iOmicsPASS: Network-based integration of multiomics data for predictive subnetwork discovery. NPJ Syst. Biol. Appl. 2019, 5, 22. [Google Scholar]
- Langfelder, P.; Horvath, S. WGCNA: An R package for weighted correlation network analysis. BMC Bioinform. 2008, 9, 559. [Google Scholar]
- Argelaguet, R.; Velten, B.; Arnol, D.; Dietrich, S.; Zenz, T.; Marioni, J.C.; Buettner, F.; Huber, W.; Stegle, O. Multi-Omics Factor Analysis—A framework for unsupervised integration of multi-omics data sets. Mol. Syst. Biol. 2018, 14, e8124. [Google Scholar]
- Guo, F.; Wang, D.; Wang, L. Progressive approach for SNP calling and haplotype assembly using single molecular sequencing data. Bioinformatics 2018, 34, 2012–2018. [Google Scholar]
- Hill, J.; Su, Y.-S. Assessing lack of common support in causal inference using Bayesian nonparametrics: Implications for evaluating the effect of breastfeeding on children’s cognitive outcomes. Ann. Appl. Stat. 2013, 7, 1386–1420. [Google Scholar]
- Morris, J.S.; Baladandayuthapani, V. Statistical contributions to bioinformatics: Design, modelling, structure learning and integration. Stat. Model. 2017, 17, 245–289. [Google Scholar]
- Huang, Z.; Wang, C. A review on differential abundance analysis methods for mass spectrometry-based metabolomic data. Metabolites 2022, 12, 305. [Google Scholar] [CrossRef] [PubMed]
- Tyler, A.L.; Asselbergs, F.W.; Williams, S.M.; Moore, J.H. Shadows of complexity: What biological networks reveal about epistasis and pleiotropy. Bioessays 2009, 31, 220–227. [Google Scholar] [PubMed]
- Fenu, G.; Malloci, F.M. Evaluating impacts between laboratory and field-collected datasets for plant disease classification. Agronomy 2022, 12, 2359. [Google Scholar] [CrossRef]
- Kim, M.; Tagkopoulos, I. Data integration and predictive modeling methods for multi-omics datasets. Mol. Omics 2018, 14, 8–25. [Google Scholar]
- Mahmood, U.; Li, X.; Fan, Y.; Chang, W.; Niu, Y.; Li, J.; Qu, C.; Lu, K. Multi-omics revolution to promote plant breeding efficiency. Front. Plant Sci. 2022, 13, 1062952. [Google Scholar]
- Cembrowska-Lech, D.; Krzemińska, A.; Miller, T.; Nowakowska, A.; Adamski, C.; Radaczyńska, M.; Mikiciuk, G.; Mikiciuk, M. An integrated multi-omics and artificial intelligence framework for advance plant phenotyping in horticulture. Biology 2023, 12, 1298. [Google Scholar] [CrossRef]
- Zafar, I.; Anwar, S.; Yousaf, W.; Nisa, F.U.; Kausar, T.; ul Ain, Q.; Unar, A.; Kamal, M.A.; Rashid, S.; Khan, K.A. Reviewing methods of deep learning for intelligent healthcare systems in genomics and biomedicine. Biomed. Signal Process. Control. 2023, 86, 105263. [Google Scholar]
- Hayes, C.N.; Nakahara, H.; Ono, A.; Tsuge, M.; Oka, S. From Omics to Multi-Omics: A Review of Advantages and Tradeoffs. Genes 2024, 15, 1551. [Google Scholar] [CrossRef] [PubMed]
- Bustos-Korts, D.; Malosetti, M.; Chapman, S.; van Eeuwijk, F. Modelling of genotype by environment interaction and prediction of complex traits across multiple environments as a synthesis of crop growth modelling, genetics and statistics. In Crop Systems Biology: Narrowing the Gaps Between Crop Modelling and Genetics; Springer: Berlin/Heidelberg, Germany, 2016; pp. 55–82. [Google Scholar]
- Sánchez, J.C.M.; Mesa, H.G.A.; Espinosa, A.T.; Castilla, S.R.; Lamont, F.G. Improving wheat yield prediction through variable selection using Support Vector Regression, Random Forest, and Extreme Gradient Boosting. Smart Agric. Technol. 2025, 10, 100791. [Google Scholar]
- Tembhare, K.; Sharma, T.; Kasibhatla, S.M.; Achalere, A.; Joshi, R. Multi-ensemble machine learning framework for omics data integration: A case study using breast cancer samples. Inform. Med. Unlocked 2024, 47, 101507. [Google Scholar]
- Wu, C.; Luo, J.; Xiao, Y. Multi-omics assists genomic prediction of maize yield with machine learning approaches. Mol. Breed. 2024, 44, 14. [Google Scholar] [PubMed]
- Xu, Y.; Yang, W.; Qiu, J.; Zhou, K.; Yu, G.; Zhang, Y.; Wang, X.; Jiao, Y.; Wang, X.; Hu, S. Metabolic marker-assisted genomic prediction improves hybrid breeding. Plant Commun. 2025, 6, 101199. [Google Scholar] [PubMed]
- Liu, Q.; Zuo, S.-m.; Peng, S.; Zhang, H.; Peng, Y.; Li, W.; Xiong, Y.; Lin, R.; Feng, Z.; Li, H. Development of machine learning methods for accurate prediction of plant disease resistance. Engineering 2024, 40, 100–110. [Google Scholar]
- Pimpalkar, A.; Gandhewar, N.; Shelke, N.; Patil, S.; Chhabria, S. An Efficient Deep Convolutional Neural Networks Model for Genomic Sequence Classification. In Genomics at the Nexus of AI, Computer Vision, and Machine Learning; Wiely: Hoboken, NJ, USA, 2025; pp. 345–375. [Google Scholar]
- Liang, H.; Zhou, Y.; Lu, Y.; Pei, S.; Xu, D.; Lu, Z.; Yao, W.; Liu, Q.; Yu, L.; Li, H. Evaluation of Soybean Drought Tolerance Using Multimodal Data from an Unmanned Aerial Vehicle and Machine Learning. Remote Sens. 2024, 16, 2043. [Google Scholar]
- Lin, C. Analysis of Complex Dynamical Systems by Combining Recurrent Neural Networks and Mechanistic Models. Ph.D. Thesis, University of Ottawa, Ottawa, Canada, 2024. [Google Scholar]
- Haji, A. Comparative Analysis of Autoencoder and PCA for Dimensionality Reduction in Gene Expression Data. 2024. Available online: https://his.diva-portal.org/smash/get/diva2:1883117/FULLTEXT02.pdf (accessed on 3 July 2025).
- Montesinos-López, O.A.; Chavira-Flores, M.; Kismiantini; Crespo-Herrera, L.; Saint Piere, C.; Li, H.; Fritsche-Neto, R.; Al-Nowibet, K.; Montesinos-López, A.; Crossa, J. A review of multimodal deep learning methods for genomic-enabled prediction in plant breeding. Genetics 2024, 228, iyae161. [Google Scholar]
- Wang, X.; Zeng, H.; Lin, L.; Huang, Y.; Lin, H.; Que, Y. Deep learning-empowered crop breeding: Intelligent, efficient and promising. Front. Plant Sci. 2023, 14, 1260089. [Google Scholar]
- Nicolas, J. Artificial intelligence and bioinformatics. In A Guided Tour of Artificial Intelligence Research: Volume III: Interfaces and Applications of Artificial Intelligence; Springer: Berlin/Heidelberg, Germany, 2020; pp. 209–264. [Google Scholar]
- Lac, L.; Leung, C.K.; Hu, P. Computational frameworks integrating deep learning and statistical models in mining multimodal omics data. J. Biomed. Inform. 2024, 152, 104629. [Google Scholar]
- Yue, T.; Wang, Y.; Zhang, L.; Gu, C.; Xue, H.; Wang, W.; Lyu, Q.; Dun, Y. Deep Learning for Genomics: From Early Neural Nets to Modern Large Language Models. Int. J. Mol. Sci. 2023, 24, 15858. [Google Scholar]
- Chen, H.; Lu, D.; Xiao, Z.; Li, S.; Zhang, W.; Luan, X.; Zhang, W.; Zheng, G. Comprehensive applications of the artificial intelligence technology in new drug research and development. Health Inf. Sci. Syst. 2024, 12, 41. [Google Scholar] [PubMed]
- Desta, Z.A.; Ortiz, R. Genomic selection: Genome-wide prediction in plant improvement. Trends Plant Sci. 2014, 19, 592–601. [Google Scholar] [PubMed]
- Vogel, J.T.; Liu, W.; Olhoft, P.; Crafts-Brandner, S.J.; Pennycooke, J.C.; Christiansen, N. Soybean yield formation physiology—A foundation for precision breeding based improvement. Front. Plant Sci. 2021, 12, 719706. [Google Scholar]
- Du, H.; Zhu, J.; Su, H.; Huang, M.; Wang, H.; Ding, S.; Zhang, B.; Luo, A.; Wei, S.; Tian, X. Bulked segregant RNA-seq reveals differential expression and SNPs of candidate genes associated with waterlogging tolerance in maize. Front. Plant Sci. 2017, 8, 1022. [Google Scholar]
- Sandhu, K.S.; Mihalyov, P.D.; Lewien, M.J.; Pumphrey, M.O.; Carter, A.H. Combining genomic and phenomic information for predicting grain protein content and grain yield in spring wheat. Front. Plant Sci. 2021, 12, 613300. [Google Scholar]
- Robert, P.; Goudemand, E.; Auzanneau, J.; Oury, F.-X.; Rolland, B.; Heumez, E.; Bouchet, S.; Caillebotte, A.; Mary-Huard, T.; Le Gouis, J. Phenomic selection in wheat breeding: Prediction of the genotype-by-environment interaction in multi-environment breeding trials. Theor. Appl. Genet. 2022, 135, 3337–3356. [Google Scholar]
- Chawade, A.; Van Ham, J.; Blomquist, H.; Bagge, O.; Alexandersson, E.; Ortiz, R. High-throughput field-phenotyping tools for plant breeding and precision agriculture. Agronomy 2019, 9, 258. [Google Scholar]
- Mansoor, S.; Chung, Y.S. Functional phenotyping: Understanding the dynamic response of plants to drought stress. Curr. Plant Biol. 2024, 38, 100331. [Google Scholar]
- Xu, Y.; Zhang, X.; Li, H.; Zheng, H.; Zhang, J.; Olsen, M.S.; Varshney, R.K.; Prasanna, B.M.; Qian, Q. Smart breeding driven by big data, artificial intelligence, and integrated genomic-enviromic prediction. Mol. Plant 2022, 15, 1664–1695. [Google Scholar]
- Gano, B.; Bhadra, S.; Vilbig, J.M.; Ahmed, N.; Sagan, V.; Shakoor, N. Drone-based imaging sensors, techniques, and applications in plant phenotyping for crop breeding: A comprehensive review. Plant Phenome J. 2024, 7, e20100. [Google Scholar]
- Awais, M.; Li, W.; Cheema, M.J.M.; Zaman, Q.U.; Shaheen, A.; Aslam, B.; Zhu, W.; Ajmal, M.; Faheem, M.; Hussain, S. UAV-based remote sensing in plant stress imagine using high-resolution thermal sensor for digital agriculture practices: A meta-review. Int. J. Environ. Sci. Technol. 2022, 20, 1135–1152. [Google Scholar]
- Messina, G.; Modica, G. Applications of UAV thermal imagery in precision agriculture: State of the art and future research outlook. Remote Sens. 2020, 12, 1491. [Google Scholar]
- Ashfaq, W.; Brodie, G.; Fuentes, S.; Gupta, D. Infrared thermal imaging and morpho-physiological indices used for wheat genotypes screening under drought and heat stress. Plants 2022, 11, 3269. [Google Scholar] [CrossRef] [PubMed]
- Wang, N. The Potential of UAV-Based Sun-Induced Chlorophyll Fluorescence in Understanding Crop Photosynthesis. Ph.D. Thesis, Wageningen University and Research, Wageningen, The Netherlands, 2022. [Google Scholar]
- Driever, S.M.; Mossink, L.; Ocaña, D.N.; Kaiser, E. A simple system for phenotyping of plant transpiration and stomatal conductance response to drought. Plant Sci. 2023, 329, 111626. [Google Scholar] [PubMed]
- McGrail, R.K.; Van Sanford, D.A.; McNear, D.H., Jr. Trait-based root phenotyping as a necessary tool for crop selection and improvement. Agronomy 2020, 10, 1328. [Google Scholar] [CrossRef]
- Ludovisi, R.; Tauro, F.; Salvati, R.; Khoury, S.; Mugnozza Scarascia, G.; Harfouche, A. UAV-Based Thermal Imaging for High-Throughput Field Phenotyping of Black Poplar Response to Drought. Front. Plant Sci. 2017, 8, 1681. [Google Scholar]
- Zhang, H.; Wang, L.; Jin, X.; Bian, L.; Ge, Y. High-throughput phenotyping of plant leaf morphological, physiological, and biochemical traits on multiple scales using optical sensing. Crop J. 2023, 11, 1303–1318. [Google Scholar]
- Gill, T.; Gill, S.K.; Saini, D.K.; Chopra, Y.; de Koff, J.P.; Sandhu, K.S. A comprehensive review of high throughput phenotyping and machine learning for plant stress phenotyping. Phenomics 2022, 2, 156–183. [Google Scholar]
- Wen, T.; Li, J.-H.; Wang, Q.; Gao, Y.-Y.; Hao, G.-F.; Song, B.-A. Thermal imaging: The digital eye facilitates high-throughput phenotyping traits of plant growth and stress responses. Sci. Total Environ. 2023, 899, 165626. [Google Scholar]
- Jin, X.; Zarco-Tejada, P.J.; Schmidhalter, U.; Reynolds, M.P.; Hawkesford, M.J.; Varshney, R.K.; Yang, T.; Nie, C.; Li, Z.; Ming, B.; et al. High-Throughput Estimation of Crop Traits: A Review of Ground and Aerial Phenotyping Platforms. IEEE Geosci. Remote Sens. Mag. 2021, 9, 200–231. [Google Scholar]
- Li, L.; Zhang, Q.; Huang, D. A Review of Imaging Techniques for Plant Phenotyping. Sensors 2014, 14, 20078–20111. [Google Scholar] [CrossRef] [PubMed]
- Zhou, J.; Vong, C.N.; Zhou, J. Imaging Technology for High-Throughput Plant Phenotyping. In Sensing, Data Managing, and Control Technologies for Agricultural Systems; Ma, S., Lin, T., Mao, E., Song, Z., Ting, K.-C., Eds.; Springer International Publishing: Cham, Switzerland, 2022; pp. 75–99. [Google Scholar]
- Thorp, K.R.; Thompson, A.L.; Harders, S.J.; French, A.N.; Ward, R.W. High-Throughput Phenotyping of Crop Water Use Efficiency via Multispectral Drone Imagery and a Daily Soil Water Balance Model. Remote Sens. 2018, 10, 1682. [Google Scholar]
- Mertens, S.; Verbraeken, L.; Sprenger, H.; De Meyer, S.; Demuynck, K.; Cannoot, B.; Merchie, J.; De Block, J.; Vogel, J.T.; Bruce, W.; et al. Monitoring of drought stress and transpiration rate using proximal thermal and hyperspectral imaging in an indoor automated plant phenotyping platform. Plant Methods 2023, 19, 132. [Google Scholar] [PubMed]
- Des Marais, D.L.; Hernandez, K.M.; Juenger, T.E. Genotype-by-environment interaction and plasticity: Exploring genomic responses of plants to the abiotic environment. Annu. Rev. Ecol. Evol. Syst. 2013, 44, 5–29. [Google Scholar]
- Negash, A.W.; Mwambi, H.; Zewotir, T.; Taye, G. Additive main effects and multiplicative interactions model (AMMI) and genotype main effect and genotype by environment interaction (GGE) biplot analysis of multi-environmental wheat variety trials. Afr. J. Agric. Res. 2013, 8, 1033–1040. [Google Scholar]
- Achenef, G. Advancement of Analytical models quantifying G× E interactions and Stability analysis in Multi-environment Trial. Int. J. Res. Agric. Sci. 2022, 9, 103–120. [Google Scholar]
- Tesfaye, K.; Sonder, K.; Cairns, J.; Magorokosho, C.; Tarekegn, A.; Kassie, G.T.; Getaneh, F.; Abdoulaye, T.; Abate, T.; Erenstein, O. Targeting drought-tolerant maize varieties in southern Africa: A geospatial crop modeling approach using big data. Int. Food Agribus. Manag. Rev. 2016, 19, 75–92. [Google Scholar]
- Yan, W.; Tinker, N.A. An integrated biplot analysis system for displaying, interpreting, and exploring genotype× environment interaction. Crop Sci. 2005, 45, 1004–1016. [Google Scholar]
- Frutos, E.; Galindo, M.P.; Leiva, V. An interactive biplot implementation in R for modeling genotype-by-environment interaction. Stoch. Environ. Res. Risk Assess. 2014, 28, 1629–1641. [Google Scholar]
- Al-Ashkar, I.; Sallam, M.; Almutairi, K.F.; Shady, M.; Ibrahim, A.; Alghamdi, S.S. Detection of high-performance wheat genotypes and genetic stability to determine complex interplay between genotypes and environments. Agronomy 2023, 13, 585. [Google Scholar] [CrossRef]
- Blum, A.; Blum, A. Drought resistance and its improvement. In Plant Breeding for Water-Limited Environments; Springer: Berlin/Heidelberg, Germany, 2011; pp. 53–152. [Google Scholar]
- Rakshit, S.; Ganapathy, K.N.; Gomashe, S.S.; Rathore, A.; Ghorade, R.B.; Kumar, M.V.N.; Ganesmurthy, K.; Jain, S.K.; Kamtar, M.Y.; Sachan, J.S. GGE biplot analysis to evaluate genotype, environment and their interactions in sorghum multi-location data. Euphytica 2012, 185, 465–479. [Google Scholar]
- Gonçalves, G.d.M.C.; Ferreira-Gomes, R.L.; Lopes, Â.C.d.A.; Vieira, P.F.d.M.J. Adaptability and yield stability of soybean genotypes by REML/BLUP and GGE Biplot. Crop Breed. Appl. Biotechnol. 2020, 20, e282920217. [Google Scholar]
- Weraikat, D.; Šorič, K.; Žagar, M.; Sokač, M. Data Analytics in Agriculture: Enhancing Decision-Making for Crop Yield Optimization and Sustainable Practices. Sustainability 2024, 16, 7331. [Google Scholar] [CrossRef]
- Ali, I.; Greifeneder, F.; Stamenkovic, J.; Neumann, M.; Notarnicola, C. Review of machine learning approaches for biomass and soil moisture retrievals from remote sensing data. Remote Sens. 2015, 7, 16398–16421. [Google Scholar]
- Levizzani, V.; Cattani, E. Satellite remote sensing of precipitation and the terrestrial water cycle in a changing climate. Remote Sens. 2019, 11, 2301. [Google Scholar]
- Singh, S.; Praveen, A.; Dudha, N.; Bhadrecha, P. Integrating physiological and multi-omics methods to elucidate heat stress tolerance for sustainable rice production. Physiol. Mol. Biol. Plants 2024, 30, 1185–1208. [Google Scholar]
- Deng, C.H.; Naithani, S.; Kumari, S.; Cobo-Simón, I.; Quezada-Rodríguez, E.H.; Skrabisova, M.; Gladman, N.; Correll, M.J.; Sikiru, A.B.; Afuwape, O.O. Genotype and phenotype data standardization, utilization and integration in the big data era for agricultural sciences. Database 2023, 2023, baad088. [Google Scholar]
- Mohr, A.E.; Ortega-Santos, C.P.; Whisner, C.M.; Klein-Seetharaman, J.; Jasbi, P. Navigating challenges and opportunities in multi-omics integration for personalized healthcare. Biomedicines 2024, 12, 1496. [Google Scholar] [CrossRef]
- Mukherjee, A.; Abraham, S.; Singh, A.; Balaji, S.; Mukunthan, K.S. From data to cure: A comprehensive exploration of multi-omics data analysis for targeted therapies. Mol. Biotechnol. 2025, 67, 1269–1289. [Google Scholar] [PubMed]
- Mathur, P. Cloud computing infrastructure, platforms, and software for scientific research. In High Performance Computing in Biomimetics: Modeling, Architecture and Applications; Springer: Berlin/Heidelberg, Germany, 2024; pp. 89–127. [Google Scholar]
- Huang, Y.-N.; Munteanu, V.; Love, M.I.; Ronkowski, C.F.; Deshpande, D.; Wong-Beringer, A.; Corbett-Detig, R.; Dimian, M.; Moore, J.H.; Garmire, L.X. Perceptual and technical barriers in sharing and formatting metadata accompanying omics studies. Cell Genom. 2025, 5, 100845. [Google Scholar] [PubMed]
- Adamer, M.F.; Brüningk, S.; Tejada-Arranz, A.; Estermann, F.; Basler, M.; Borgwardt, K.M. reComBat: Batch effect removal in large-scale, multi-source omics data integration. bioRxiv 2021. [Google Scholar] [CrossRef]
- Das, S.; Mukhopadhyay, I. TiMEG: An integrative statistical method for partially missing multi-omics data. Sci. Rep. 2021, 11, 24077. [Google Scholar]
- Voß, H.; Schlumbohm, S.; Wurlitzer, M.; Dottermusch, M.; Neumann, P.; Barwikowski, P.; Schlüter, H.; Krisp, C.; Neumann, J. OTHR-07. A new framework for missing value tolerant data integration. Neuro-Oncology 2022, 24, i148. [Google Scholar]
- Mertens, B. Transformation, Normalization, and Batch Effect in the Analysis of Mass Spectrometry Data for Omics Studies. arXiv 2016, arXiv:1606.05360. [Google Scholar]
- Yan, X.; Ang, K.S.; Van Olst, L.; Edwards, A.; Watson, T.; Zheng, R.; Fan, R.; Li, M.; Gate, D.; Chen, J. Mosaic integration of spatial multi-omics with SpaMosaic. bioRxiv 2024. [Google Scholar] [CrossRef]
- Baião, A.; Cai, Z.; Poulos, R.; Robinson, P.; Reddel, R.; Zhong, Q.; Vinga, S.; Gonccalves, E. A technical review of multi-omics data integration methods: From classical statistical to deep generative approaches. arXiv 2025, arXiv:2501.17729. [Google Scholar]
- Flores, J.; Claborne, D.; Weller, Z.; Webb-Robertson, B.; Waters, K.; Bramer, L. Missing data in multi-omics integration: Recent advances through artificial intelligence. Front. Artif. Intell. 2023, 6, 1098308. [Google Scholar]
- Ugidos, M.; Tarazona, S.; Prats-Montalbán, J.; Ferrer, A.; Conesa, A. MultiBaC: A strategy to remove batch effects between different omic data types. Stat. Methods Med. Res. 2020, 29, 2851–2864. [Google Scholar]
- Hui, H.; Goh, W. Uncovering the consequences of batch effect associated missing values in omics data analysis. bioRxiv 2023. [Google Scholar] [CrossRef]
- Wang, D.; Bodovitz, S. Single cell analysis: The new frontier in ‘omics’. Trends Biotechnol. 2010, 28, 281–290. [Google Scholar] [PubMed]
- Doust, A.N.; Lukens, L.; Olsen, K.M.; Mauro-Herrera, M.; Meyer, A.; Rogers, K. Beyond the single gene: How epistasis and gene-by-environment effects influence crop domestication. Proc. Natl. Acad. Sci. USA 2014, 111, 6178–6183. [Google Scholar] [PubMed]
- Eichler, E.E.; Flint, J.; Gibson, G.; Kong, A.; Leal, S.M.; Moore, J.H.; Nadeau, J.H. Missing heritability and strategies for finding the underlying causes of complex disease. Nat. Rev. Genet. 2010, 11, 446–450. [Google Scholar] [PubMed]
- Mata, J.; Marguerat, S.; Bähler, J. Post-transcriptional control of gene expression: A genome-wide perspective. Trends Biochem. Sci. 2005, 30, 506–514. [Google Scholar] [PubMed]
- Joshi, A.; Rienks, M.; Theofilatos, K.; Mayr, M. Systems biology in cardiovascular disease: A multiomics approach. Nat. Rev. Cardiol. 2021, 18, 313–330. [Google Scholar] [PubMed]
- Yurekten, O.; Payne, T.; Tejera, N.; Amaladoss, F.X.; Martin, C.; Williams, M.; O’Donovan, C. MetaboLights: Open data repository for metabolomics. Nucleic Acids Res. 2024, 52, D640–D646. [Google Scholar]
- Ugochukwu, A.I.; Phillips, P.W.B. Open data ownership and sharing: Challenges and opportunities for application of FAIR principles and a checklist for data managers. J. Agric. Food Res. 2024, 16, 101157. [Google Scholar]
- Buck, M.; Hamilton, C. The Nagoya Protocol on access to genetic resources and the fair and equitable sharing of benefits arising from their utilization to the Convention on Biological Diversity. Rev. Eur. Community Int. Environ. Law 2011, 20, 47–61. [Google Scholar]
- Aydin, S.; Aydin, M.N. Semantic and syntactic interoperability for agricultural open-data platforms in the context of IoT using crop-specific trait ontologies. Appl. Sci. 2020, 10, 4460. [Google Scholar]
- Adepoju, A.G.; Adepoju, D.A. Biomarker Discovery in Clinical Biology Enhances Early Disease Detection, Prognosis, and Personalized Treatment Strategies. Int. J. Adv. Res. Publ. Rev. 2025, 2, 229–252. [Google Scholar]
- Rossi, B.; Russo, B.; Succi, G. Adoption of free/libre open source software in public organizations: Factors of impact. Inf. Technol. People 2012, 25, 156–187. [Google Scholar]
- Committee on Key Challenge Areas for Convergence and Health; Board on Life Sciences; Division on Earth and Life Studies; National Research Council. Convergence: Facilitating Transdisciplinary Integration of Life Sciences, Physical Sciences, Engineering, and Beyond; National Academies Press (US): Washington, DC, USA, 2014.

| Plant Species | Platform | Stress Type(s) | Key Findings | References |
|---|---|---|---|---|
| Arabidopsis thaliana | RNA-seq | Abiotic (heat and dehydration) | Stress increased full-length transcript variants via exon skipping in the SR45a gene | [29] |
| Arabidopsis thaliana | RNA-seq | Abiotic | 42% of intron-containing genes were alternatively spliced; stress shifted isoform ratios | [30] |
| Populus trichocarpa | RNA-seq + Iso-Seq | Drought, salt, and temperature | Differential intron retention and isoform ratio switching across tissues | [31] |
| Cassava (Manihot esculenta) | Isoform-Seq, ssRNA-seq, Degradome-seq | Cold and drought | Intron retention dominant; cold stress altered splicing regulators and triggered transcript decay | [32] |
| Brassica napus | RNA-seq | Cold, salt, dehydration, and ABA | 357 genes showed alternative splicing; hub genes linked to stress tolerance pathways | [33] |
| Capsicum annuum (Pepper) | RNA-seq | Biotic (bacteria, virus, and oomycete) | 4354 genes with stress-induced AS; 841.49 Gb data compiled from 425 samples | [34] |
| Zoysia japonica | RNA-seq | Cold | Dataset ZjRTD1.0 enables precise analysis of cold-induced splicing and co-regulation of isoforms | [35] |
| Schrenkiella parvula | Iso-Seq + RNA-seq | Salinity | Isoform diversity linked to salt tolerance; distinct isoform usage vs. A. thaliana | [36] |
| Glycine max (Soybean) | RNA-seq | Drought | Over 2000 genes alternatively spliced; splicing factors enriched under drought conditions | [37] |
| Camellia sinensis (Tea) | RNA-seq | Biotic (gray blight) | Splicing changes correlated with catechin biosynthesis; DASGs associated with disease defense | [38] |
| Metabolite Class | Key Examples | Detection Techniques | Stress Type(s) | Physiological Functions | References |
|---|---|---|---|---|---|
| Sugars | Glucose, sucrose, trehalose, and raffinose | GC-MS, LC-MS, and NMR | Drought, salt, and cold | Osmoprotection, energy source, and stress signaling | [45] |
| Amino Acids | Proline, glutamate, GABA, and tryptophan | GC-MS, LC-MS, and NMR | Osmotic, oxidative, and heat | Osmotic balance, ROS scavenging, and precursors to secondary metabolites | [46,47] |
| Organic Acids | Malate, citrate, and fumarate | GC-MS and NMR | Drought, cold, and metal | Central in TCA cycle, energy production, and pH regulation | [48] |
| Phenolics | Flavonoids, phenolic acids, and lignans | LC-MS/MS and NMR | Oxidative, UV, and drought | Antioxidant activity, UV protection, and defense | [46,47] |
| Alkaloids | Serpentine, tabersonine, and vinblastine | Targeted LC-MS | Biotic (pathogen and herbivory) | Defense compounds and anti-insect and anti-fungal agents | [45] |
| Terpenoids | Tanshinones and monoterpenes | LC-DAD-MS and GC-MS | Pathogen and drought | Antimicrobial properties, ROS modulation, and signaling | [46] |
| Fatty Acids | Linoleic acid and oleic acid | GC-MS and UPLC-QTRAP-MS | Heavy metal and cold | Membrane fluidity and precursors to signaling-related lipids | [49] |
| Sugar Alcohols | Mannitol and sorbitol | GC-MS and LC-MS | Salinity and drought | Osmoprotectants and ROS scavengers | [50] |
| Hormonal Intermediates | ABA precursors and auxin conjugates | LC-MS/MS | Drought, salinity, and temperature | Regulators of gene expression and stress adaptation | [51] |
| Shikimate Pathway Intermediates | Chorismate and phenylalanine | LC-MS and NMR | Drought and biotic stress | Links between primary and secondary metabolism; stress adaptation compound synthesis | [51] |
| Volatile Organic Compounds (VOCs) | Isoprene and linalool | GC-MS | Heat and biotic stress | Defense, communication, and thermotolerance | [52] |
| Tool | Supported Omics Types | Statistical Methodology | Integration Approach | Data Handling | Visualization | Typical Use Case | Limitations | References |
|---|---|---|---|---|---|---|---|---|
| mixOmics | Transcriptomics, proteomics, metabolomics, microbiome, and epigenomics | PLS, CCA, sPLS, and DIABLO | Both (via different functions) | Handles missing data moderately well; requires scaling | Yes—heatmaps, networks, and correlation circles | Multi-omics classification, biomarker selection, and exploratory analysis | Sensitive to missing data; requires tuning; overfitting risk in small datasets | [70,77] |
| MOFA+ | Any continuous omics: transcriptomics, epigenomics, proteomics, and metabolomics | Bayesian latent factor model | Unsupervised | Robust to missing values; normalizes data internally | Yes—factor plots and feature weights | Identification of shared and specific signals across -omics; sample stratification | Complex to interpret latent factors; high computational load for large datasets | [78] |
| iOmicsPASS | Transcriptomics, proteomics, metabolomics, and phenotypic data | Partial correlation networks + phenotype weighting | Supervised | Requires preprocessed complete matrices | Yes—modular network visualization | Disease/trait prediction; pathway–phenotype linkage | Phenotypic data needed; may struggle with very sparse networks | [79] |
| WGCNA | Primarily transcriptomics, extendable to proteomics/metabolomics | Weighted correlation-based network analysis | Unsupervised | Requires complete data; sensitive to outliers | Yes—dendrograms and module–trait heatmaps | Identification of co-expressed modules, hub genes, and module–trait associations | Not natively multi-omics; manual integration required | [80] |
| DIABLO (in mixOmics) | Multi-block omics: transcriptomics, metabolomics, and proteomics | Supervised sparse PLS | Supervised | Performs variable selection; handles moderate sparsity | Yes—sample plots and relevance networks | Supervised feature extraction; class-based biomarker identification | Requires high-quality labels; less effective in unsupervised scenarios | [70] |
| Multi-Omics Factor Analysis (MOFA) | Transcriptomics, metabolomics, and epigenomics | Matrix factorization via variational inference | Unsupervised | Missing data allowed; scalable | Yes—dimensional reduction plots | Discovery of hidden factors driving variation across omics | Needs large sample sizes for meaningful factors; interpretability issues | [81] |
| IntLIM | Transcriptomics + metabolomics | Linear modeling with interaction terms | Supervised | Focused on two-omics comparisons | No (basic plots only) | Tests for phenotype-dependent omics interactions | Limited to two omics types; limited data scaling options | [82] |
| JIVE | Any omics (continuous) | Joint and individual variation explained | Unsupervised | Missing data imputation not supported | Limited (basic singular-value plots) | Decomposition of joint vs. specific signals across datasets | Requires manual feature interpretation; basic statistical output | [83] |
| Model Type | Input Modalities | Task/Application | Performance Metrics | Key Strengths | Limitations | References |
|---|---|---|---|---|---|---|
| CNN (Convolutional Neural Network) | Genomic sequences + UAV-derived images | Soybean stress phenotype prediction | Accuracy increased 15% over baseline; R2 ~0.71 | Captures spatial dependencies; combines omics and imagery | Requires large, labeled image datasets | [104] |
| RNN/LSTM | Time-series transcriptome + stress phenotype data | Temporal modeling of stress responses | RMSE: 0.15–0.20; accuracy up to 89% | Effective for dynamic, sequential data | Sensitive to time-gap variation; needs careful tuning | [105] |
| Autoencoder | High-dimensional omics (e.g., transcriptome and metabolome) | Dimensionality reduction + phenotype prediction | RMSE: 0.12–0.18; comparable to LSTM; R2 ~0.68 | Denoises data; unsupervised feature extraction | Black-box interpretability; sensitive to latent dimension choice | [104] |
| Variational Autoencoder (VAE) | Genomics + imaging + environmental metadata | Multi-modal maize yield prediction | Accuracy: 85–90%; lower RMSE vs. linear models | Captures nonlinear joint distributions | Computational cost; sampling noise | [106] |
| Multi-modal DL Model | Genomics, metabolomics, and spectral imagery | Yield prediction under abiotic stress | R2: 0.78; RMSE: 0.11; accuracy: ~88% | Integrates diverse-omics and environmental data | Requires harmonized, co-measured datasets | [107] |
| Hybrid CNN+LSTM | Genomic images + temporal gene expression | Combined spatial-temporal modeling | Accuracy: 90.2%; R2 ~0.76; reduced overfitting compared to standalone models | Leverages strengths of both CNNs and RNNs | Higher model complexity | [108] |
| Trait Measured | HTP Platform/Modality | Sensor Type/Technique | Biological Relevance | References |
|---|---|---|---|---|
| Canopy temperature | UAV-based aerial thermal imaging | Thermal infrared cameras | Proxy for stomatal conductance and transpiration under heat/drought stress | [124] |
| NDVI (Normalized Difference Vegetation Index) | UAV multispectral imaging | Multispectral cameras (Red/NIR) | Indicator of photosynthetic activity and biomass | [125] |
| Chlorosis/leaf senescence | RGB + multispectral UAV | RGB and spectral indices (e.g., GNDVI and SAVI) | Visual cues of nutrient stress, senescence, and disease | [126] |
| Photosynthetic efficiency (ΦPSII) | Ground-based sensor | Pulse-amplitude-modulated (PAM) chlorophyll fluorometry | Captures efficiency of light reactions in photosynthesis under stress | [127] |
| Stomatal conductance (gs) | Portable leaf gas analyzers | Infrared gas analyzer (IRGA) | Measures gas exchange related to water loss and carbon uptake | [128] |
| Root system architecture | X-ray CT, rhizotrons, and Shovelomics | High-resolution 3D imaging or transparent interface | Essential for belowground trait monitoring under drought or nutrient stress | [129] |
| Canopy structure/LAI | UAV LiDAR + multispectral fusion | Light Detection and Ranging (LiDAR) + NDVI | Reflects total photosynthetic surface and canopy penetration | [130] |
| Water use efficiency (WUE) | UAV-based multispectral + ET modeling | NDVI-derived biomass + evapotranspiration estimates | Assesses yield relative to water use; key trait under water-limited conditions | [131] |
| Transpiration rate | Proximal thermal imaging in automated systems | Leaf surface temperature profiles over time | Indicates water loss dynamics and drought response | [132] |
| Plant height/growth rate | Time-lapse 3D LiDAR or stereo vision | Structure-from-motion (SfM) and laser range scanning | Non-invasive quantification of growth dynamics | [129] |
| Omics Layer | Computational Bottleneck | Mitigation Strategy | Explanation | References |
|---|---|---|---|---|
| Genomics | Variant calling variability; batch-specific sequencing biases | Standardized pipelines (e.g., GATK); batch correction tools like reComBat | Ensures consistent variant detection across batches; tools like reComBat mitigate batch effects in heterogeneous datasets | [152] |
| Transcriptomics | Integration of RNA-seq datasets with missing samples and inconsistent coverage | Bayesian models (e.g., TiMEG); advanced imputation and joint modeling | Models like TiMEG handle partially missing transcript data without requiring full imputation, improving integration reliability | [153] |
| Proteomics | High frequency of missing values due to detection limits and instrumentation | Missing-value-tolerant frameworks (e.g., matrix dissection and no imputation) | Mitigates imputation biases by correcting only where data are present, maintaining statistical integrity | [154] |
| Metabolomics | Peak alignment errors; inconsistent quantification across batches | Transformation and normalization pipelines; batch-aware preprocessing | Careful preprocessing and normalization mitigate artifacts from instrumentation and sample prep variability | [155] |
| Epigenomics | Data sparsity; modality-specific biases (e.g., methylation depth vs. accessibility) | Cross-modal imputation; graph neural networks; contrastive learning | Emerging AI methods (e.g., SpaMosaic) reconstruct missing modalities and enable high-fidelity integration | [156] |
| Multi-omics (general) | Heterogeneous data types and missing modalities | Deep generative models (e.g., VAEs); multi-modal latent space integration | Variational autoencoders and other AI tools embed omics data into shared spaces, enabling joint analysis and imputation | [157,158] |
| All layers (meta-level) | Batch effects coupled with missing data (BEAMs: Batch-Effect-Associated Missing Values) | Hybrid methods accounting for batch and missingness (e.g., MultiBaC, BEAM-aware imputation) | MultiBaC exploits shared modalities across datasets to correct for lab-specific artifacts; BEAM-aware workflows prevent imputation bias | [159,160] |
| Single-cell omics | High sparsity and noise in individual cell profiles; multi-modal alignment | Product-of-Experts VAEs; latent space alignment and batch-aware learning | Enables robust integration across scRNA, ATAC, and protein modalities in sparse, high-dimensional data | [161] |
Disclaimer/Publisher’s Note: The statements, opinions and data contained in all publications are solely those of the individual author(s) and contributor(s) and not of MDPI and/or the editor(s). MDPI and/or the editor(s) disclaim responsibility for any injury to people or property resulting from any ideas, methods, instructions or products referred to in the content. |
© 2025 by the authors. Licensee MDPI, Basel, Switzerland. This article is an open access article distributed under the terms and conditions of the Creative Commons Attribution (CC BY) license (https://creativecommons.org/licenses/by/4.0/).
Share and Cite
Amin, A.; Zaman, W.; Park, S. Harnessing Multi-Omics and Predictive Modeling for Climate-Resilient Crop Breeding: From Genomes to Fields. Genes 2025, 16, 809. https://doi.org/10.3390/genes16070809
Amin A, Zaman W, Park S. Harnessing Multi-Omics and Predictive Modeling for Climate-Resilient Crop Breeding: From Genomes to Fields. Genes. 2025; 16(7):809. https://doi.org/10.3390/genes16070809
Chicago/Turabian StyleAmin, Adnan, Wajid Zaman, and SeonJoo Park. 2025. "Harnessing Multi-Omics and Predictive Modeling for Climate-Resilient Crop Breeding: From Genomes to Fields" Genes 16, no. 7: 809. https://doi.org/10.3390/genes16070809
APA StyleAmin, A., Zaman, W., & Park, S. (2025). Harnessing Multi-Omics and Predictive Modeling for Climate-Resilient Crop Breeding: From Genomes to Fields. Genes, 16(7), 809. https://doi.org/10.3390/genes16070809