Article

Selection and Validation of Stable Reference Genes for RT-qPCR Analyses of Rumex patientia (Polygonaceae) Under Four Abiotic Stresses

1
School of Life Sciences, Qinghai Normal University, Xining 810008, China
2
Key Laboratory of Biodiversity Formation Mechanism and Comprehensive Utilization of the Qinghai-Tibet Plateau in Qinghai Province, Qinghai Normal University, Xining 810008, China
3
Academy of Plateau Science and Sustainability, Qinghai Normal University, Xining 810016, China
4
Department of Botany, National Museum of Natural History, Smithsonian Institution, Washington, DC 20013, USA
5
Department of Biology, University of Mississippi, Oxford, MS 38677, USA
*
Authors to whom correspondence should be addressed.
Genes 2025, 16(7), 787; https://doi.org/10.3390/genes16070787
Submission received: 4 June 2025 / Revised: 28 June 2025 / Accepted: 29 June 2025 / Published: 30 June 2025
(This article belongs to the Section Plant Genetics and Genomics)

Abstract

Background: Rumex patientia (Polygonaceae), a perennial herbaceous species predominantly found in northern temperate regions, has been historically utilized in traditional Chinese medicine for its hematological regulatory properties, including blood cooling, hemostasis, and detoxification. Despite the pharmacological value of this species, unvalidated reference genes compromise precise gene expression profiling. Methods: We initially selected eight candidate genes (ACT, GAPDH, YLS, SKD1, UBQ, UBC, EF-1α, TUA) from R. patientia transcriptomes and then assessed their transcriptional stability using RT-qPCR across root, stem, and leaf tissues under four abiotic stresses: cold, drought, salinity, and heavy metal exposure. Results: ACT emerged as the most stable reference gene in three specific scenarios: root/leaf tissues under cold stress, stems during drought exposure, and roots subjected to salt treatment, revealing distinct tissue–stress response patterns. TUA emerged as the most stable reference in cold- and salt-challenged stems, while SKD1 exhibited superior stability in drought-affected roots/leaves, heavy-metal-stressed tissues, and salt-treated leaves. Validation via the drought-inducible MYB transcription factor confirmed reference gene reliability. Conclusions: This work pioneers a standardized reference gene framework for R. patientia under multi-stress conditions, offering essential methodological foundations for subsequent molecular research in this medicinal plant.

1. Introduction

Plants growing in unstable environments frequently encounter biotic stresses throughout their life cycle [1]. Abiotic stressors, including cold, frost, heat, drought, soil salinity, and heavy metal toxicity, significantly constrain plant growth and agricultural productivity globally [2]. Notably, cold, drought, and soil salinity critically define plant biogeography, constrain crop yields, and jeopardize global food security [3]. Heavy metal stressors, however, trigger intricate biochemical disturbances that compromise plant survival. These toxic elements impair enzymatic functions, displace vital metal cofactors in biomolecules, and generate reactive oxygen species [4]. Such molecular disturbances ultimately destabilize cellular membranes and disrupt fundamental metabolic processes, including photosynthetic pathways, energy production, and ion regulation. To counter these pressures, plants evolve adaptive mechanisms to minimize cellular damage [5].
A comprehensive evaluation of plant responses to abiotic stressors necessitates an analysis of gene expression dynamics [6]. While conventional approaches like Northern blot and competitive quantitative PCR have historically dominated transcript profiling, these techniques face limitations including narrow dynamic ranges, insufficient sensitivity, prolonged processing times, and substantial RNA requirements [7,8]. In contrast, real-time quantitative PCR (RT-qPCR) has become a standard methodology due to its enhanced sensitivity, precision, rapid throughput, and capacity for absolute mRNA quantification [9]. Yet its accuracy remains vulnerable to multiple technical variables, including RNA integrity, enzymatic fidelity during reverse transcription, and amplification consistency [10]. Consequently, implementing normalization using endogenous reference genes is essential for reliable data [11]. Reference genes should exhibit invariant expression across developmental stages and tissue types while resisting experimental perturbations [12]. Commonly employed plant reference genes include Actin, GAPDH, EF-1α, β-tubulin, and 18S rRNA [13]. These genes typically display reduced variability relative to alternative references. Despite their prevalent usage, prior research necessitates taxon- and condition-specific reference gene selection for experimental rigor [7].
R. patientia, an Asian–European perennial herb (Polygonaceae), features erect stems and robust roots while being pharmacologically significant [14,15]. Some of these properties include detoxification, laxative, blood-activating, heat-clearing, hemostasis, and insecticidal properties. Current studies on R. patientia have explored multiple aspects of its biology and physiology, including the characterization of its chemical constituents [16,17,18], the composition of rhizosphere and non-rhizosphere bacterial communities [19], the anti-inflammatory effects of root extracts [20], the physiology of stomata [21], the effect of ultraviolet light on leaf development [22], a transcriptomic analysis of cold stress [23], and its genetic diversity across habitats [24]. Demirezer et al. isolated emodin-6-O-β-D-glucopyranoside and flavan-3-ol (6-chlorocatechin) from R. patientia, confirming their cytotoxic activity and radical scavenging capacity in antioxidant studies [15]. An assessment of transcriptome data detected 66 up-regulated genes related to cold stress in R. patientia, representing the MYB, AP2/ERF, CBF, Znf, bZIP, NAC, and COR families [23]. Despite extensive research, validated reference genes remain undocumented for R. patientia, crucially constraining mechanistic insights into its gene regulatory networks.
Eight candidate reference genes were identified from R. patientia transcriptomes: ACT, GAPDH, YLS, SKD1, UBQ, UBC, EF-1α, and TUA. Their expression stability was evaluated under four abiotic stresses via multi-algorithm validation (ΔCt, BestKeeper, geNorm, NormFinder, RefFinder). Optimal and suboptimal references were further validated using the drought-responsive MYB gene. This work establishes a standardized reference gene framework for R. patientia across tissues and stress conditions, enabling reliable RT-qPCR normalization in related Rumex species.

2. Materials and Methods

2.1. Plant Materials and Experimental Treatments

Mature R. patientia seeds were harvested from wild populations in Nangqian County, Yushu Tibetan Autonomous Prefecture, Qinghai Province (32°16′55.8″ N, 96°27′39.6″ E). Plump, uniformly sized, and disease-free seeds were selected. Followed rinsing with distilled water, germination was initiated on moist filter paper in Petri dishes. Resultant seedlings underwent cultivation in growth chambers (26 °C; 16/8 h light/dark photoperiod). After one month, seedlings exhibiting uniform size and development (four-leaf stage) were selected for subsequent experiments.
Four abiotic environmental stresses that could affect R. patientia, namely cold, soil salinity, heavy metal contamination, and drought, were selected. For the cold treatment, we exposed R. patientia seedlings to constant cold stress by placing them in a refrigerator set at 4 °C. The salt and drought treatments were simulated via watering each pot with 300 mL of 200 mM NaCl solution and 300 mL of 10% (w/v) PEG-6000 (polyethylene glycol, molecular weight 6000), respectively. For the heavy metal treatment, we watered the pot soils using 300 mL of 200 mM CdCl2 solution. At 0, 6, 12, 24, and 48 h post-treatment, triplicate samples of roots, stems, and leaves were collected, immediately flash-frozen in liquid nitrogen, and stored at −80 °C for subsequent molecular analysis.

2.2. RNA Extraction, Quality Assessment, and cDNA Synthesis

Total RNA was isolated from root, stem, and leaf tissues with a Plant Total RNA Extraction Kit (TaKaRa, Dalian, China). Purity/concentration was measured spectrophotometrically (NanoDrop 2000, Thermo Fisher Scientific, Waltham, MA, USA) at A260/A280 (1.90–2.10). Integrity was verified via 1.0% agarose gel electrophoresis. cDNA synthesis used a gDNA-eliminating reverse transcription kit (PrimeScript RT, TaKaRa). cDNA products were 10× diluted in nuclease-free water and stored at −20 °C for RT-qPCR analyses.

2.3. Reference Gene Selection and Primer Design

The R. patientia transcriptome (NCBI SRA: SRR18011456) was used to screen eight candidate reference genes: ACT, GAPDH, YLS, SKD1, UBQ, UBC, EF-1α, and TUA. Complete ORFs were annotated, and Primer Premier 5.0 (Ding et al., 2004) was used to design gene-specific primers with the following criteria: melting temperature (Tm) 54–62 °C, primer length 18–25 bp, GC content 40–60%, and amplicon size under 300 bp. The specificity of the primers was confirmed via 1% agarose gel electrophoresis, Sanger sequencing of purified PCR products (performed by BGI Genomics with bidirectional primers), and melting curve analysis. All amplified sequences were aligned to the R. patientia transcriptome reference sequences using SnapGene 6.0.2 software to confirm primer specificity and target identity. We determined amplification efficiency (E) and correlation coefficients (R2) via standard curves created with ten-fold serial dilutions (Table 1).

2.4. Real-Time Quantitative PCR Analysis

Using a QuantStudioTM 6 Flex System (Thermo Fisher Scientific, Waltham, MA, USA) and TB Green chemistry, RT-qPCR reactions (20 µL total volume) contained the following components: 10 µL TB Green Premix Ex Taq, 0.4 µL each PCR primer, 0.4 μL ROX Reference Dye (50×), 6.8 μL ddH2O, and 2 μL cDNA. Thermal cycling conditions were as follows: 95 °C for 30 s and then 48 cycles of 95 °C for 5 s and 58 °C for 34 s.

2.5. Gene Expression Stability Analysis

The stability of gene expression was evaluated using a multi-algorithm strategy that combined four computational tools: the ΔCt method, geNorm v3.5 [25], NormFinder v20 [26], and BestKeeper v1 [27]. This integrated analysis was performed in conjunction with the RefFinder web platform [28]. RT-qPCR generated raw quantification cycle (Cq)/cycle threshold (Ct) values for the assessment. For the ΔCt method, pairwise Ct differences between all candidate genes were computed across all samples, followed by the calculation of the average standard deviation for each gene, where lower values indicate higher stability [29]. The Ct values were converted to 2−ΔCt using the following formula: ΔCt = sample Ct − minimum Ct. These transformed values were input into geNorm to compute expression stability metrics (M-values), with lower M-values indicating higher transcriptional stability [30]. Pairwise variation (Vn/Vn+1) identified the appropriate number of reference genes (n) as the smallest number where Vn/Vn+1 ≤ 0.15. NormFinder identifies the optimal normalization gene within a candidate set by evaluating and ranking genes based on expression stability across samples and experimental conditions; the gene with the lowest stability value exhibits the most stable expression. In this context, the gene with the lowest stability value is deemed to have the most stable expression among the examined gene set. Raw Ct values were used to calculate the coefficient of variance (CV) and standard deviation (SD) of candidate genes in BestKeeper. Integrative analysis was performed using RefFinder to synthesize multi-algorithm datasets, incorporating geNorm-derived M-values, NormFinder stability indices, BestKeeper variability metrics (CV/SD), and ΔCt normalization factors. Through weighted geometric mean computations [31], this approach generated consensus stability rankings, ensuring statistically robust reference gene selection across methodological frameworks.

2.6. Reference Gene Validation

RefFinder’s comprehensive ranking framework was utilized to validate reference gene selection efficacy, identifying both optimal and suboptimal candidates under drought stress. The drought-responsive MYB transcription factor family—renowned for its phylogenetic prominence in plant stress adaptation—served as a validation target. MYB genes orchestrate transcriptional regulation of developmental processes, phytohormone signaling networks, and stress response pathways, exhibiting characteristic drought-inducible expression patterns [32]. Using RT-qPCR with the forward primer 5′-ATCCTAAGCAAGAGCCAAGGTCAC-3′ and the reverse primer 5′-TACCTCTCAACCCCAAGAAATCAT-3′, MYB gene amplification enabled the analysis of its expression across R. patientia tissues under drought stress. Expression quantification used the 2−ΔΔCT method, employing the worst and top two RefFinder-pinpointed reference genes per stressed tissue.

3. Results

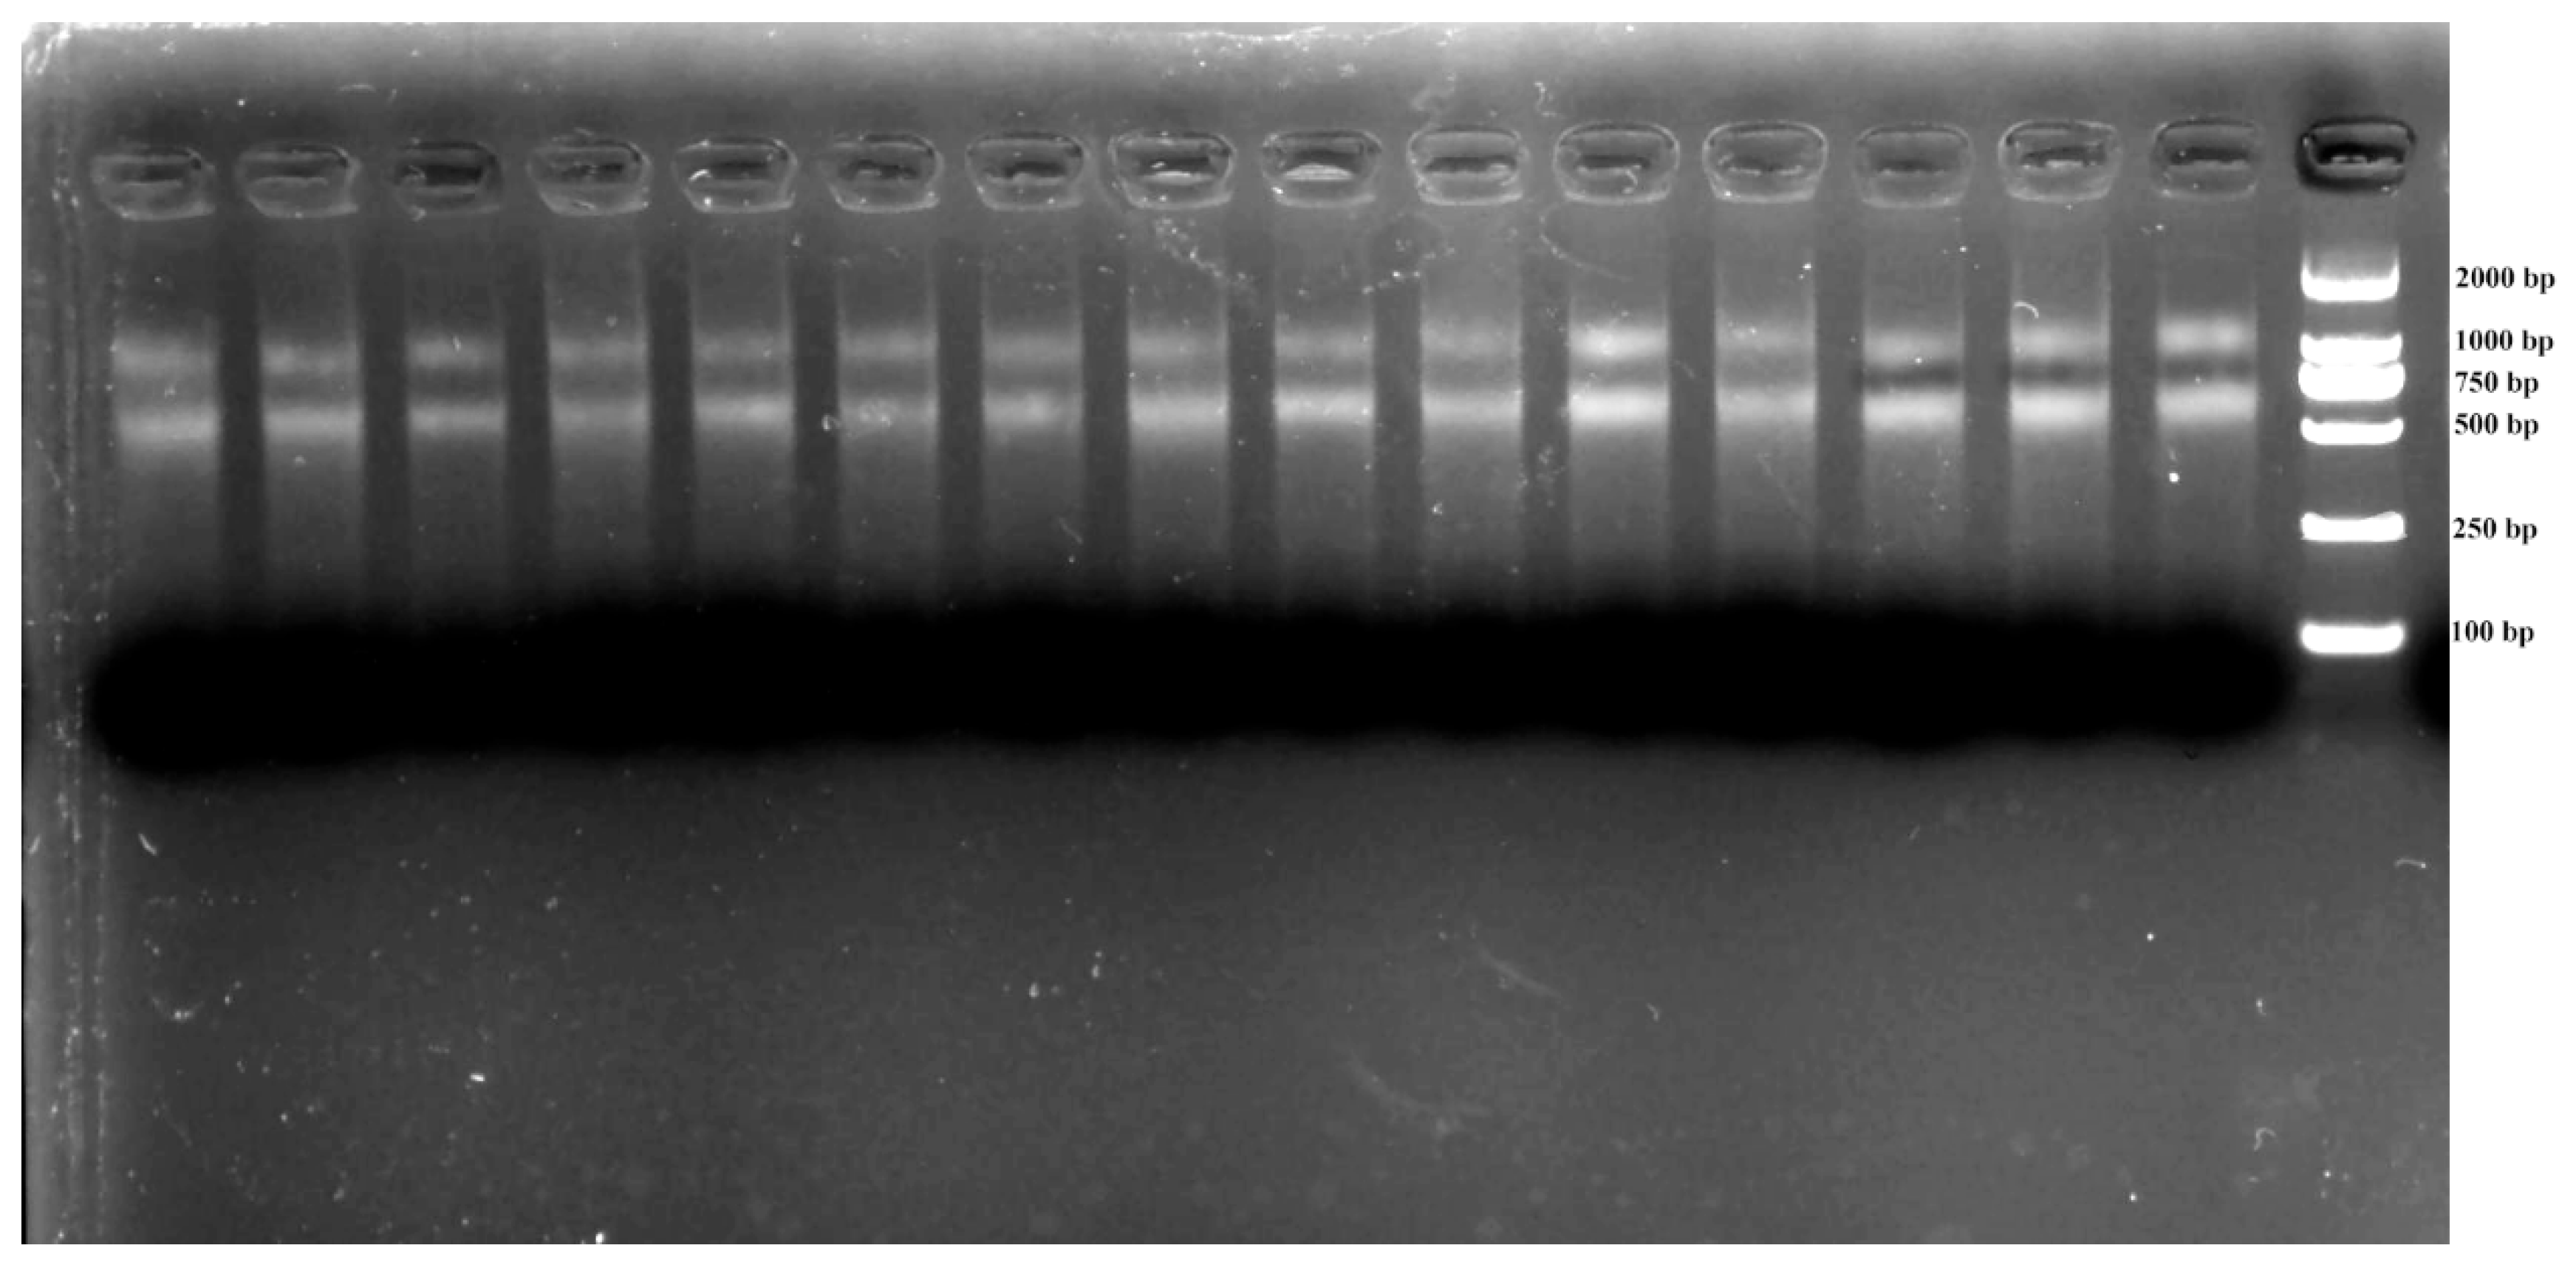
3.1. RNA Integrity and Primer Specificity

Total RNA isolation across samples yielded A260/A280 absorbance ratios (1.9–2.1) and sharp 18S/28S bands (Figure 1), confirming suitability for RT-qPCR analysis. Primer specificity was confirmed through three-tier validation: (1) target-specific electrophoretic bands (Figure 2), (2) monophasic melt curve profiles (Figure 3), and (3) amplification efficiency parameters. Quantitative analysis revealed primer performance metrics within acceptable thresholds—amplification efficiencies spanned 92.6–127.4% (UBC to GAPDH), and regression coefficients (R2) varied from 0.97 (in GAPDH) to 0.99 (in ACT) (Figure 4, Table 1).

3.2. Expression Profile of Reference Genes

RT-qPCR analysis typically requires Ct values within 15–35, as proposed by prior research [33]. In this study, all samples tested showed Ct values from 16.66 to 35.97. Among them, EF-1α, GAPDH, and TUA showed the highest expression (mean Ct: 22.84, 23.12, 24.18), while YLS and ACT had the lowest (29.31 and 27.07, respectively) across treatments. Most candidate genes showed broad Ct variation across tissues/treatments, while UBC and YLS exhibited relatively stable expression in R. patientia under all conditions (Figure 5).

3.3. Expression Stability of Candidate Reference Genes

Reference gene stability was assessed using five approaches: geNorm, NormFinder, BestKeeper, RefFinder, and the Delta-Ct method. Differential outcomes emerged across Ct data treatments, as subsequently detailed.

3.3.1. The Comparative Delta-Ct Method Analysis

The Delta-Ct method evaluates reference gene stability by calculating pairwise differences in Ct values (ΔCt) between all candidate genes across all samples. For each gene pair, the mean ΔCt value and standard deviation (SD) are computed. These pairwise standard deviations are then aggregated for every individual gene, and the mean standard deviation is calculated per candidate gene. Genes demonstrating lower mean standard deviation values exhibit higher expression stability. Under cold stress, SKD1 exhibited the lowest mean standard deviation (SD) values in roots, stems, and leaves (0.8984, 0.9013, and 0.9044, respectively), while UBC showed the highest values (1.8240, 1.6853, and 1.6883), indicating SKD1 was the most stable reference gene and UBC the least stable. Similarly, under heavy metal stress, SKD1 displayed the lowest SD values across tissues (roots: 0.9169; stems: 0.8610; leaves: 0.9031), whereas UBC had the highest (roots: 1.8890; stems: 1.6280; leaves: 1.6785), confirming SKD1 as the most stable and UBC as the least stable reference gene. During drought stress, EF-1α, TUA, and SKD1 were the most stable reference genes in roots, stems, and leaves, respectively, with UBC being the least stable in roots and YLS least stable in stems and leaves. Likewise, under salt stress, SKD1 demonstrated the highest stability across all tissues, while UBC remained the least stable reference gene (Figure 6).

3.3.2. geNorm Analysis

geNorm analysis revealed tissue-specific stable reference gene pairs under different stresses: for cold stress, roots used GAPDH and EF-1α, stems used GAPDH and TUA, and leaves used GAPDH and SKD1; under drought stress, roots used GAPDH and TUA while both stems and leaves used GAPDH and SKD1; for heavy metal stress, the optimal pairs differed across tissues, including GAPDH and TUA, GAPDH and UBC, or UBC and TUA; for salt stress, roots used ACT and UBQ, stems used GAPDH and TUA, and leaves used ACT and SKD1, as shown in Figure 7. Pairwise variation Vn/n+1 analysis demonstrated that two reference genes adequately normalized salt-stressed tissues, with V2/3 values remaining below the 0.15 threshold. However, for stems subjected to cold, drought, or heavy metal stress, V2/3 values exceeded 0.15 while V3/4 values remained below 0.15, necessitating the top three reference genes for precise normalization (Figure 8).

3.3.3. NormFinder Analysis

NormFinder analysis revealed the optimal reference genes across stress conditions: under cold treatment, ACT and SKD1 in roots, ACT and YLS in stems and leaves; under drought, SKD1 and UBQ in roots, ACT and YLS in stems and leaves; for salt stress, ACT and UBQ in roots, ACT and YLS in stems, and YLS and SKD1 in leaves; and under heavy metal stress, SKD1 and UBQ in roots, SKD1 and YLS in stems, and ACT and SKD1 in leaves (Figure 9).

3.3.4. BestKeeper Analysis

Using BestKeeper, we assessed the stability of reference genes through CV and SD. Reference genes with the lowest CV and SD were considered the most stable. BestKeeper results showed that under salt treatment, the most stable genes in roots, stems, and leaves were UBC (1.75 ± 5.81), SKD1 (0.36 ± 1.48), and SKD1 (0.71 ± 2.89), respectively. In drought treatment, the most stable genes were UBC (0.2 ± 0.73) in roots, SKD1 (0.36 ± 1.48) in stems, and GAPDH (0.45 ± 2.21) in leaves. For cold treatment, the most stable genes were UBC (0.25 ± 0.92) in roots, SKD1 (0.46 ± 1.81) in stems, and GAPDH (0.97 ± 4.67) in leaves. In heavy metal treatment, the most stable genes were UBC (0.19 ± 0.68) in roots, SKD1 (0.46 ± 1.81) in stems, and SKD1 (0.4 ± 1.63) in leaves (Table 2).

3.3.5. RefFinder Analysis

Comprehensive gene stability rankings revealed that under cold treatment, the most stable genes were ACT and SKD1 in roots, ACT and TUA in stems, and ACT and GAPDH in leaves, with TUA and EF-1α being the least stable. During drought treatment, roots showed SKD1 and GAPDH as the most stable, while stems and leaves both had ACT and SKD1 as optimal, and EF-1α was the least stable. For heavy metal treatment, ACT and SKD1 were the most stable in roots, SKD1 and GAPDH in stems, and SKD1 and TUA in leaves, again with EF-1α as the least stable. Under salt stress, ACT and UBQ were the most stable in roots, TUA and ACT in stems, and SKD1 and YLS in leaves, while EF-1α and TUA were the least stable, as shown in Figure 10.

3.4. Validation of the Stability for Candidate Reference Genes Based on MYB

To validate reference gene stability, MYB expression under drought stress was analyzed. Using the stable genes SKD1 and GAPDH in roots yielded significantly different MYB expression levels compared to unstable EF-1α. Similarly, in stems, the stable pair ACT and SKD1 produced higher MYB expression than EF-1α. In leaves, unstable EF-1α generated values significantly diverging from stable genes SKD1 and ACT, as illustrated in Figure 11.

4. Discussion

This study systematically evaluated the stability of eight candidate reference genes (ACT, TUA, EF-1α, GAPDH, UBQ, UBC, SKD1, YLS) across R. patientia tissues (roots, stems, and leaves) under four abiotic stressors. Our results showed that gene amplification efficiency (E) for all genes was within the normal range, fluctuating from 90% to 110% [34], except for GAPDH, whose E value reached up to 127%. Despite such anomalies typically compromising expression quantification accuracy [35]), GAPDH demonstrated exceptional stability as a reference gene in cold-stressed leaves and drought-exposed roots. In fact, GAPDH performed similarly to SKD1, which was the first-ranked internal reference gene, in inferring expression levels of MYB in stems under drought stress. Therefore, we inferred that the presence of inhibitors or pipetting errors can explain the amplification efficiency being greater than 100% [36], but these errors had a limited effect on GAPDH. However, this gene and protocols for its amplification in R. patientia merit further exploration in future studies.
Quantitative cycle threshold values (Ct values) in RT-qPCR reflect gene expression levels, with lower values representing higher gene expression levels [37]. Our comparison of Ct values from eight candidate reference genes in R. patientia showed that they ranged from 16 to 36. TUA showed the greatest variability in expression abundance. Given these differences, we further analyzed the Ct values obtained in the experiment using the ΔCt method, geNorm, NormFinder, and BestKeeper. Differences in calculation principles among these three software packages explain different results from the same sample (Table 3). Such is the case with gene SKD1, which was the most stable in stems under drought stress based on scores from geNorm and BestKeeper, but the fourth most stable in NormFinder. Using the ΔCt method, it was found that SKD1 demonstrated the most stable expression under cold, salt, and heavy metal stress conditions. This discrepancy likely arises from the distinct algorithms employed: geNorm and BestKeeper primarily assess the pairwise variation or correlation between genes, potentially favoring co-regulated genes like SKD1 under specific conditions. In contrast, NormFinder explicitly incorporates estimates of both intra- and inter-group variation, making it more sensitive to systematic expression differences across experimental groups, which may have affected SKD1’s ranking. Similarly, the most stable reference gene in roots under salt stress was UBC based on BestKeeper, but this gene was ranked eighth in geNorm and NormFinder. BestKeeper heavily relies on the correlation of each gene’s expression with the geometric mean of all candidates. A gene like UBC, showing strong correlation despite potentially high individual variance, might be highly ranked by BestKeeper. However, geNorm, which focuses on minimizing pairwise variation between genes, and NormFinder, which penalizes genes with high variation across groups, may assign UBC a low stability rank if its expression exhibits high variance or lacks consistent co-regulation with other candidates within the salt-stressed root samples.
RefFinder functions as an integrative platform rather than a standalone algorithm, synthesizing outputs from geNorm, NormFinder, BestKeeper, and other computational approaches. It employs scoring or ranking mechanisms to holistically evaluate the stability of candidate reference genes [38]. Therefore, our final assessment performed to account for these differences using RefFinder indicated that ACT was the gene with the best stability in roots and leaves of R. patientia under cold stress, which was consistent with previous results in Hibiscus esculentus (Malvaceae) [39]. Regarding the heavy metal stress treatment, SKD1 was depicted as the best gene in the three tissues of R. patientia, and it showed a remarkably good stability in roots and leaves under drought stress and leaves under salt stress. Likewise, SKD1 was also the preferred endogenous reference gene in Polygonum cuspidatum (Polygonaceae) under hormonal stress [40] and in Pyrus serotina (Rosaceae) [41]. The putative function of SKD1 is to encode a protein contributing to vacuolar trafficking and maintaining the large central vacuole, which can confer tolerance to stressors like salt and drought [42,43]. Given the context-dependent variability of reference gene stability across tissues, species, and experimental conditions, systematic screening of optimal normalization genes remains essential prior to gene expression quantification. Besides confirming gene stability with RefFinder, we also recommend validating the gene expression stability of the best reference genes like we did here using MYB under drought stress [44].
In conclusion, our study highlights the critical importance of selecting appropriate reference genes for accurate RT-qPCR normalization. Our data emphasize the need to perform gene expression analyses with an appropriate reference gene—typically an experimentally tested or housekeeping gene based on its functions—to achieve accurate results [29]. While traditional housekeeping genes (e.g., ACT, EF-1α, GAPDH, UBQ) have been widely used, recent studies confirm that their instability varies dramatically across species and experimental conditions [45]. For instance, ACT and UBQ were stably expressed in Triticum aestivum (Poaceae) but not in Solanum lycopersicum (Solanaceae) [46,47]. Importantly, recent validations continue to underscore this context-dependency: novel reference genes COG7 and TULP6 were identified as superior to traditional choices like HSP90 and SDH5 across diverse tissues and stresses in Norway spruce [48], while in Phytophthora capsici interacting with its host, EF-1α and WS21 were validated as highly stable, whereas others like EF2 were unreliable [49]. In our study, UBQ exhibited the second lowest stability in stems and leaves under cold stress and in roots and stems under heavy metal stress. Regarding environmental conditions, GAPDH was identified as the most stable reference gene in Psammochloa villosa (Poaceae) under drought stress [50], but it was unstable in Oryza sativa (Poaceae) and Prunus persica (Rosaceae) under different experimental treatments [51,52,53]. Contrastingly, while EF-1α ranks among the most stable genes in drought-treated S. lycopersicum and Arabis alpina [54,55], it showed the lowest stability across all R. patientia tissues under drought. Collectively, these findings demonstrate that stable reference genes vary significantly across species and experimental conditions, highlighting the critical importance of selecting appropriate reference genes for accurate gene expression normalization.

5. Conclusions

Comprehensive analysis identified distinct tissue-specific stability patterns among eight candidate reference genes in R. patientia subjected to abiotic stresses. ACT demonstrated optimal expression stability in roots and leaves under cold stress, stems under drought stress, and roots under salt stress. SKD1 exhibited superior performance in roots and leaves during drought exposure, all root, stem, and leaf tissues under heavy metal stress, and leaves under salt stress. TUA achieved peak stability in stems experiencing both cold and salt stresses. Validation using the drought-responsive MYB gene confirmed the reliability of selected reference genes for the seedling tissues analyzed, establishing essential standardization protocols for future transcriptional studies of this species under environmental challenges. However, it is imperative to emphasize that these stability profiles were determined specifically in seedlings. Given the well-documented variation in reference gene stability across developmental stages, future studies are essential to validate and establish appropriate reference genes for mature R. patientia plants under these abiotic stresses. Results from this work will benefit future studies on gene expression assessing abiotic stressors in R. patientia seedlings and serve as a benchmark for investigations into mature plants.

Author Contributions

Q.Y.: Writing—Original Draft. X.L.: Writing—Original Draft. R.Q.: Resources. Y.L.: Writing—Review and Editing. X.S.: Conceptualization. J.J.: Resources. M.Y.: Data Curation. Z.C.: Resources. P.Z.: Resources. Y.Z.: Resources. X.G.: Resources. M.A.C.-O.: Conceptualization. All authors have read and agreed to the published version of the manuscript.

Funding

This work was supported by grants from the National Natural Science Foundation of China (No. 32360305, 32160297) to Xu Su and Yuping Liu, the Qinghai Provincial Major Science and Technology Special Project (No. 2023-SF-A5) to Xu Su and Yuping Liu, and the Second Tibetan Plateau Scientific Expedition and Research (STEP) Program (No. 2019QZKK0502) to Xu Su.

Institutional Review Board Statement

Not applicable.

Informed Consent Statement

Not applicable.

Data Availability Statement

Data will be made available on request.

Acknowledgments

We thank the anonymous reviewers for their helpful comments.

Conflicts of Interest

The authors declare that they have no known competing financial interests or personal relationships that could have appeared to influence the work reported in this paper.

References

  1. Nawaz, M.; Sun, J.; Shabbir, S. A review of plants strategies to resist biotic and abiotic environmental stressors. Sci. Total Environ. 2023, 900, 165832. [Google Scholar] [CrossRef] [PubMed]
  2. Baweja, P.; Kumar, G. Abiotic stress in plants: An overview. Plant Stress Biol. Strateg. Trends 2021, 1–15. [Google Scholar] [CrossRef]
  3. Muluneh, M.G. Impact of climate change on biodiversity and food security: A global perspective—A review article. Agric. Food Secur. 2021, 10, 36. [Google Scholar] [CrossRef]
  4. Ghori, N.H.; Ghori, T.; Hayat, M.Q.; Imadi, S.R.; Gul, A.; Altay, V.; Ozturk, M. Heavy metal stress and responses in plants. Int. J. Environ. Sci. Technol. 2019, 16, 1807–1828. [Google Scholar] [CrossRef]
  5. Lamalakshmi, D.E.; Kumar, S.; Basanta, S.T.; Sharma, S.K.; Beemrote, A.; Devi, C.P.; Chongtham, S.K.; Singh, C.H.; Yumlembam, R.A.; Haribhushan, A.; et al. Adaptation strategies and defense mechanisms of plants during environmental stress. In Medicinal Plants and Environmental Challenges; Springer: Cham, Switzerland, 2017; pp. 359–413. [Google Scholar] [CrossRef]
  6. Son, S.; Im, J.H.; Ko, J.H. Role of plant cell wall in biotic and abiotic stress resistance. Front. Plant Sci. 2025, 16, 1617371. [Google Scholar] [CrossRef]
  7. Qi, J.N.; Yu, S.C.; Zhang, F.L.; Shen, X.Q.; Zhao, X.Y.; Yu, Y.J.; Zhang, D.S. Reference gene selection for real-time quantitative polymerase chain reaction of mRNA transcript levels in Chinese cabbage (Brassica rapa L. ssp. pekinensis). Plant Mol. Biol. Rep. 2010, 28, 597–604. [Google Scholar] [CrossRef]
  8. Dean, J.D.; Goodwin, P.H.; Hsiang, T. Comparison of relative RT-PCR and northern blot analyses to measure expression of β-1,3-glucanase in Nicotiana benthamiana infected with Colltotrichum destructivum. Plant Mol. Biol. Rep. 2002, 20, 347–356. [Google Scholar] [CrossRef]
  9. Zhand, S.; Goss, D.M.; Cheng, Y.Y. Recent advances in microfluidics for nucleic acid analysis of small extracellular vesicles in cancer. Adv. Healthc. Mater. 2025, 14, 2401295. [Google Scholar] [CrossRef] [PubMed]
  10. Grätz, C.; Bui, M.L.U.; Thaqi, G. Obtaining reliable RT-qPCR results in molecular diagnostics—MIQE goals and pitfalls for transcriptional biomarker discovery. Life 2022, 12, 386. [Google Scholar] [CrossRef]
  11. Zheng, H.; Zhao, H.; Zhang, X. Systematic identification and validation of suitable reference genes for the normalization of gene expression in Prunella vulgaris under different organs and spike development stages. Genes 2022, 13, 1947. [Google Scholar] [CrossRef]
  12. Gasmi, A.; Triki, T.; Bennani, L. Identification of reference genes and analysis of heat shock protein gene expression (Hsp90) in arta (Calligonum comosum L.) leaf under heat stress. S. Afr. J. Bot. 2024, 167, 570–577. [Google Scholar] [CrossRef]
  13. Luan, Y.; Xu, C.; Wang, X. Selection of stable reference genes for quantitative real-time PCR on Paeonia ostii T. Hong et JX Zhang leaves exposed to different drought stress conditions. Phyton 2022, 91, 1045. [Google Scholar] [CrossRef]
  14. Zhao, Y.Q. Anti-tumor Activity Composition Screening of Rumex patientia L. Root. Master’s thesis, Shanxi University of Chinese Medicine, Taiyuan, China, 2018. [Google Scholar]
  15. Demirezer, L.Ö.; Kuruüzüm-Uz, A.; Bergere, I.; Schiewe, H.J.; Zeeck, A. The structures of antioxidant and cytotoxic agents from natural source: Anthraquinones and tannins from roots of Rumex patientia. Phytochemistry 2001, 58, 1213–1217. [Google Scholar] [CrossRef] [PubMed]
  16. Demirezer, Ö.; Kuruüzüm, A.; Bergere, I.; Schiewe, H.J.; Zeeck, A. Five naphthalene glycosides from the roots of Rumex patientia. Phytochemistry 2001, 56, 399–402. [Google Scholar] [CrossRef]
  17. Yuan, Y.; Chen, W.S.; Zheng, S.Q.; Yang, G.J.; Zhang, W.D.; Zhang, H.M. Studies on chemical constituents in root of Rumex patientia L. Chung-kuo Chung Yao Tsa Chih. 2001, 26, 256–258. Available online: https://pubmed.ncbi.nlm.nih.gov/12525048/ (accessed on 3 June 2025).
  18. Liu, J.; Xia, Z.T.; Zhou, G.R.; Zhang, L.L.; Kong, L.Y. Study on the chemical constituents of Rumex patientia. Zhong Yao Cai Zhongyaocai J. Chin. Med. Mater. 2011, 34, 893–895. Available online: https://pubmed.ncbi.nlm.nih.gov/22017004/ (accessed on 3 June 2025).
  19. Süleyman, H.; Demirezer, L.Ö.; Kuruüzüm, A.; Banoğlu, Z.N.; Göçer, F.; Özbakir, O.; Gepdiremen, A. Antiinflammatory effect of the aqueous extract from Rumex patientia L. roots. J. Ethnopharmacol. 1999, 65, 141–148. [Google Scholar] [CrossRef] [PubMed]
  20. Qi, X.J.; Wang, E.; Xing, M.; Zhao, W.; Chen, X. Rhizosphere and non-rhizosphere bacterial community composition of the wild medicinal plant Rumex patientia. World J. Microbiol. Biotechnol. 2012, 28, 2257–2265. [Google Scholar] [CrossRef]
  21. Sayre, J.D. Physiology of stomata of Rumex patientia. Science 1923, 57, 205–206. [Google Scholar] [CrossRef]
  22. Dickson, J.G.; Caldwell, M.M. Leaf development of Rumex patientia L. (Polygonaceae) exposed to UV irradiation (280–320 nm). Am. J. Bot. 1978, 65, 857–863. [Google Scholar] [CrossRef]
  23. Liu, J.; Xu, Y.; Zhang, L.; Li, W.; Cai, Z.X.; Li, F.; Peng, M.; Li, F.L.; Hu, B.Z. De novo assembly and analysis of the transcriptome of Rumex patientia L. during cold stress. PLoS ONE 2017, 12, e0186470. [Google Scholar] [CrossRef]
  24. Zhang, Y.L.; Ju, Y.L.; Yang, Q.C.; Li, B.L.; Yang, Z.M. Genetic diversity of Rumex k-1(Rumex patientia × R.tianschanicus cv.Rumex k-1) and Wild Rumex spp. Acta Agrestia Sinica 2004, 12, 298–302. [Google Scholar] [CrossRef]
  25. Vandesompele, J.; De Preter, K.; Pattyn, F.; Poppe, B.; Roy, N.V.; Paepe, A.D.; Speleman, F. Accurate normalization of real-time quantitative RT-PCR data by geometric averaging of multiple internal control genes. Genome Biol. 2002, 3, research0034.1. [Google Scholar] [CrossRef] [PubMed]
  26. Andersen, C.L.; Jensen, J.L.; Ørntoft, T.F. Normalization of real-time quantitative reverse transcription-PCR data: A model-based variance estimation approach to identify genes suited for normalization, applied to bladder and colon cancer data sets. Cancer Res. 2004, 64, 5245–5250. [Google Scholar] [CrossRef] [PubMed]
  27. Pfaffl, M.W. Quantification strategies in real-time PCR. AZ Quant. PCR 2004, 1, 89–113. [Google Scholar]
  28. Xie, F.L.; Xiao, P.; Chen, D.L.; Xu, L.; Zhang, B.H. miRDeepFinder: A miRNA analysis tool for deep sequencing of plant small RNAs. Plant Mol. Biol. 2012, 80, 75–84. [Google Scholar] [CrossRef] [PubMed]
  29. Silver, N.; Best, S.; Jiang, J.; Thein, S.L. Selection of housekeeping genes for gene expression studies in human reticulocytes using real-time PCR. BMC Mol. Biol. 2006, 7, 33. [Google Scholar] [CrossRef]
  30. Zhou, W.; Wang, S.; Yang, L. Reference genes for qRT-PCR normalisation in different tissues, developmental stages, and stress conditions of Hypericum perforatum. Peer J. 2019, 7, e7133. [Google Scholar] [CrossRef]
  31. Niu, K.; Shi, Y.; Ma, H. Selection of candidate reference genes for gene expression analysis in Kentucky Bluegrass (Poa pratensis L.) under abiotic stress. Front. Plant Sci. 2017, 8, 193. [Google Scholar] [CrossRef]
  32. Baldoni, E.; Genga, A.; Cominelli, E. Plant MYB transcription factors: Their role in drought response mechanisms. Int. J. Mol. Sci. 2015, 16, 15811–15851. [Google Scholar] [CrossRef]
  33. Derveaux, S.; Vandesompele, J.; Hellemans, J. How to do successful gene expression analysis using real-time PCR. Methods 2010, 50, 227–230. [Google Scholar] [CrossRef] [PubMed]
  34. Taylor, S.; Wakem, M.; Dijkman, G.; Alsarraj, M.; Nguyen, M. A practical approach to RT-qPCR-publishing data that conform to the MIQE guidelines. Methods 2010, 50, S1–S5. [Google Scholar] [CrossRef] [PubMed]
  35. Sreedharan, S.P.; Kumar, A.; Giridhar, P. Primer design and amplification efficiencies are crucial for reliability of quantitative PCR studies of caffeine biosynthetic N-methyltransferases in coffee. 3 Biotech 2018, 8, 467. [Google Scholar] [CrossRef] [PubMed]
  36. Suslov, O.; Steindler, D.A. PCR inhibition by reverse transcriptase leads to an overestimation of amplification efficiency. Nucleic Acids Res. 2005, 33, e181. [Google Scholar] [CrossRef]
  37. Ramezani, A. CtNorm: Real time PCR cycle of threshold (Ct) normalization algorithm. J. Microbiol. Methods 2021, 187, 106267. [Google Scholar] [CrossRef] [PubMed]
  38. Xie, F.; Wang, J.; Zhang, B. RefFinder: A web-based tool for comprehensively analyzing and identifying reference genes. Funct. Integr. Genom. 2023, 23, 125. [Google Scholar] [CrossRef]
  39. Li, Y.; Ye, X.; Wang, B.; Chen, M.; Liu, J.; Zhu, H.; Wen, Q. Cloning and selection evaluation of reference gene for quantitative real-time PCR in Hibiscus esculentus L. J. Nucl. Agric. Sci. 2021, 35, 60–71. [Google Scholar]
  40. Wang, X.W.; Wu, Z.J.; Bao, W.Q.; Hu, H.Y.; Chen, M.; Chai, T.Y.; Wang, H. Identification and evaluation of reference genes for quantitative real-time PCR analysis in Polygonum cuspidatum based on transcriptome data. BMC Plant Biol. 2019, 19, 498. [Google Scholar] [CrossRef] [PubMed]
  41. Liu, Z.; Cheng, K.X.; Qin, Z.Q.; Wu, T.; Li, X.M.; Tu, J.F.; Yang, F.C.; Zhu, H.Y.; Yang, L. Selection and validation of suitable reference genes for qRT-PCR analysis in pear leaf tissues under distinct training systems. PLoS ONE 2018, 13, e0202472. [Google Scholar] [CrossRef]
  42. Buono, R.A.; Paez-Valencia, J.; Miller, N.D.; Goodman, K.; Spitzer, C.; Spalding, E.P.; Otegui, M.S. Role of SKD1 regulators LIP5 and IST1-LIKE1 in endosomal sorting and plant development. Plant Physiol. 2016, 171, 251–264. [Google Scholar] [CrossRef]
  43. Xia, Z.; Wei, Y.; Sun, K.; Wu, J.; Wang, Y.; Wu, K. The maize AAA-type protein SKD1 confers enhanced salt and drought stress tolerance in transgenic tobacco by interacting with Lyst-interacting protein 5. PLoS ONE 2013, 8, e69787. [Google Scholar] [CrossRef] [PubMed]
  44. Hu, R.; Fan, C.; Li, H. Evaluation of putative reference genes for gene expression normalization in soybean by quantitative real-time RT-PCR. BMC Mol. Biol. 2009, 10, 93. [Google Scholar] [CrossRef] [PubMed]
  45. Chi, X.Y.; Hu, R.B.; Yang, Q.L.; Zhang, X.W.; Pan, L.J.; Chen, M.N.; Yang, Z.; Wang, T.; He, Y.N.; Yu, S.L. Validation of reference genes for gene expression studies in peanut by quantitative real-time RT-PCR. Mol. Genet. Genom. 2012, 287, 167–176. [Google Scholar] [CrossRef] [PubMed]
  46. Long, X.Y.; He, B.; Gao, X.S.; Qin, Y.X.; Yang, J.H.; Fang, Y.J.; Qi, J.Y.; Tang, C.R. Validation of reference genes for quantitative real-time PCR during latex regeneration in rubber tree. Gene 2015, 563, 190–195. [Google Scholar] [CrossRef]
  47. Mascia, T.; Santovito, E.; Gallitelli, D.; Cillo, F. Evaluation of reference genes for quantitative reverse-transcription polymerase chain reaction normalization in infected tomato plants. Mol. Plant Pathol. 2010, 11, 805–816. [Google Scholar] [CrossRef]
  48. Singh, V.V.; Naseer, A.; Sellamuthu, G. Robust reference gene selection in Norway spruce: Essential for real-time quantitative PCR across different tissue, stress and developmental conditions. Front. For. Glob. Change 2024, 7, 1458554. [Google Scholar] [CrossRef]
  49. Vijayakumar, S.; Sakuntala, M. Validation of reference gene stability for normalization of RT-qPCR in Phytophthora capsici Leonian during its interaction with Piper nigrum L. Sci. Rep. 2024, 14, 7331. [Google Scholar] [CrossRef]
  50. Liu, Y.P.; Zhang, Y.; Liu, F.; Liu, T.; Chen, J.Y.; Fu, G.; Zheng, C.Y.; Su, D.D.; Wang, Y.N.; Zhou, H.K.; et al. Establishment of reference (housekeeping) genes via quantitative real-time PCR for investigation of the genomic basis of abiotic stress resistance in Psammochloa villosa (Poaceae). J. Plant Physiol. 2022, 268, 153575. [Google Scholar] [CrossRef]
  51. Jain, M.; Nijhawan, A.; Tyagi, A.K.; Khurana, J.P. Validation of housekeeping genes as internal control for studying gene expression in rice by quantitative real-time PCR. Biochem. Biophys. Res. Commun. 2006, 345, 646–651. [Google Scholar] [CrossRef]
  52. Tong, Z.G.; Gao, Z.H.; Wang, F.; Zhou, Z. Selection of reliable reference genes for gene expression studies in peach using real-time PCR. BMC Mol. Biol. 2009, 10, 71. [Google Scholar] [CrossRef]
  53. Reid, K.E.; Olsson, N.; Schlosser, J.; Peng, F.; Lund, S.T. An optimized grapevine RNA isolation procedure and statistical determination of reference genes for real-time RT-PCR during berry development. BMC Plant Biol. 2006, 6, 27. [Google Scholar] [CrossRef] [PubMed]
  54. Tang, X.; Zhang, N.; Si, H. Selection and validation of reference genes for RT-qPCR analysis in potato under abiotic stress. Plant Methods 2017, 13, 85. [Google Scholar] [CrossRef] [PubMed]
  55. Stephan, L.; Tilmes, V.; Hülskamp, M. Selection and validation of reference genes for quantitative Real-Time PCR in Arabisalpina. PLoS ONE 2019, 14, e0211172. [Google Scholar] [CrossRef] [PubMed]
Figure 1. Assessment of RNA integrity by partial agarose gel electrophoresis.
Genes 16 00787 g001
Figure 2. Amplicon size of eight candidate reference genes of R. patientia. Numbers 1 to 8 correspond to genes ACT, GAPDH, YLS, SKD1, UBQ, UBC, EF-1α, and TUA, respectively. M represents a 500 bp DNA ladder.
Genes 16 00787 g002
Figure 3. Melting curves showing primer specificity of eight candidate reference genes of R. patientia.
Genes 16 00787 g003
Figure 4. Standard curves of eight candidate reference genes of R. patientia based on 10-fold dilution of cDNA.
Genes 16 00787 g004
Figure 5. Mean Ct values of candidate reference genes in R. patientia across all treatments. The box plot displays the Ct value distribution: top line (upper quartile), middle line (median), bottom line (lower quartile), top edge (maximum), and bottom edge (minimum).
Genes 16 00787 g005
Figure 6. Stability assessment of R. patientia reference genes across four stress conditions via ΔCt method. Note: C: low-temperature stress; D: drought stress; CD: heavy metal stress; S: salt stress. R, S, and L stand for root, stem, and leaf, respectively.
Genes 16 00787 g006
Figure 7. geNorm evaluation of reference gene expression stability in R. patientia. Abbreviations in the panels are as follows: C: low-temperature stress; D: drought stress; CD: heavy metal stress; S: salt stress.
Genes 16 00787 g007
Figure 8. Number of best candidate genes of R. patientia analyzed by geNorm. Note: C: low-temperature stress; D: drought stress; CD: heavy metal stress; S: salt stress. R, S, and L stand for root, stem, and leaf, respectively. Vn/Vn+1 determines the optimal count of reference genes for data normalization under given experimental conditions.
Genes 16 00787 g008
Figure 9. NormFinder stability assessment of candidate reference genes in R. patientia.
Genes 16 00787 g009
Figure 10. Heatmap visualization of RefFinder-based expression stability for eight reference genes in R. patientia. Note: (A) Cold stress, (B) drought stress, (C) salt stress, (D) heavy metal stress. R, S, and L denote root, stem, and leaf, respectively.
Genes 16 00787 g010
Figure 11. The relative expression of the MYB gene in R. patientia under drought stress across different tissues. (A), (B), and (C) represent roots, stems, and leaves, respectively.
Genes 16 00787 g011
Table 1. Statistical information for primer sequences used to amplify reference genes to normalize RT-qPCR in R. patientia.
Gene
Name
Gene IDPrimer Sequence (5′-3′) (Forward/Reverse)Amplicon LengthTm (°C)RT-qPCR Efficiency(%)R2
ACTTRINITY_DN197GGGCTGGCTGATAGGATGAG/
GCACTTGCGATGAACGATT
2015695.2510.999
GAPDHTRINITY_DN2913AACTTCGGCATTGTTGAGGGAT/
TGGGAATGATGTTGAATGAGGC
12756127.3640.975
YLSTRINITY_DN2081GTCTTACCTTCTCCCGCATCT/
CAAAGTTCTTTATAGTCTCAGCCAC
16456113.5470.988
SKD1TRINITY_DN115AGGAAGCCATCACGCAGAAAT/
GCGGAGTTCAACCCAGACCTAA
21758101.8450.998
UBQTRINITY_DN16GCTCCCAATACCAACCCTC/
GAATCAGACATAGCACGCAGTT
2755897.4620.992
UBCTRINITY_DN11678GGACTGACTGGGAAGGTGG/
GACAAACAGTTCCTGATGGGT
1325892.5830.987
EF-1αTRINITY_DN2194GAAGGAGGCTGCTGAGATG/
GGTGTAGGCAAGAAGAGCG
29859108.5660.986
TUATRINITY_DN2714GCTGTGGCTACAATCAAGACC/
AGAACTCACCTTCCTCCATACC
26559105.6320.984
Table 2. Expression stability of candidate reference genes from R. patientia analyzed by BestKeeper. Abbreviations are as follows: SD, standard deviation; CV, coefficient of variance; C, low-temperature stress; D, drought stress; CD, heavy metal stress; S, salt stress; R, root; ST, stem; L, leaf.
GroupGeneSDCVrGroupGeneSDCVrGroupGeneSDCVr
S-RACT3.7912.760.983S-STACT0.983.810.984S-LACT1.184.580.126
GAPDH4.3516.600.993GAPDH0.743.600.539GAPDH0.723.28−0.782
YLS2.207.470.978YLS1.465.040.87YLS1.063.560.729
SKD14.0114.480.978SKD10.341.420.461SKD10.712.89−0.104
UBQ3.5012.460.981UBQ3.3712.540.898UBQ2.468.970.876
UBC1.575.810.542UBC2.449.430.189UBC1.826.92−0.367
EF-1α4.6719.610.99EF-1α4.0318.660.881EF-1α3.6616.250.675
TUA5.2919.230.994TUA0.914.350.686TUA4.0915.840.312
D-RACT2.9710.180.978D-STACT1.054.010.763D-LACT1.134.590.975
GAPDH3.1312.330.986GAPDH0.622.940.069GAPDH0.452.210.278
YLS1.103.650.946YLS1.224.250.959YLS1.505.390.952
SKD13.0010.720.993SKD10.361.480.353SKD10.964.120.922
UBQ1.826.320.987UBQ2.338.750.89UBQ2.6310.190.945
UBC0.200.730.295UBC2.208.490.053UBC2.067.89−0.751
EF-1α3.9116.220.991EF-1α3.8317.330.866EF-1α4.7621.220.972
TUA3.2311.990.981TUA0.813.840.608TUA0.974.520.32
C-RACT2.779.320.993C-STACT0.943.540.706C-LACT1.254.850.931
GAPDH3.7214.860.998GAPDH0.884.170.114GAPDH0.974.670.408
YLS1.625.380.952YLS1.324.550.986YLS1.575.480.98
SKD13.2511.620.986SKD10.381.52−0.113SKD11.124.570.558
UBQ2.69.030.922UBQ2.328.70.861UBQ2.529.770.92
UBC0.250.920.305UBC1.947.37−0.134UBC1.244.61−0.133
EF-1α3.4814.90.991EF-1α3.6015.860.797EF-1α3.8917.050.96
TUA3.7814.780.936TUA0.743.380.13TUA2.3210.030.982
CD-RACT3.6312.450.985CD-STACT1.65.950.8CD-LACT1.134.4100.727
GAPDH3.3312.930.985GAPDH1.295.69−0.561GAPDH1.295.63−0.445
YLS1.364.450.805YLS1.384.60.966YLS1.776.180.629
SKD13.4912.480.995SKD10.461.81−0.371SKD10.41.630.315
UBQ2.17.610.95UBQ2.117.780.515UBQ2.9411.290.993
UBC0.190.680.494UBC1.455.45−0.365UBC1.776.71−0.747
EF-1α4.2417.380.987EF-1α3.2913.570.419EF-1α3.7616.050.914
TUA3.4312.370.995TUA1.486.08−0.138TUA14.19−0.883
Table 3. Reference gene ranking using five methods. Abbreviations are as follows: C, low-temperature stress; D, drought stress; CD, heavy metal stress; S, salt stress; R, root; ST, stem; L, leaf; (R), ranking.
SoftwareReference GeneC-R(R)C-S
(R)
C-L
(R)
CD-R
(R)
CD-S
(R)
CD-L
(R)
ST-R
(R)
ST-S
(R)
ST-L
(R)
D-R(R)D-S(R)D-L(R)
geNormUBC867812865867
TUA715141618133
YLS644756754755
UBQ576677176676
ACT443465232544
SKD1331334341311
GAPDH222223423222
EF-1α188588887488
NormFinderUBC877856876876
TUA743464738538
YLS522723611621
UBQ365277265265
ACT111331123313
SKD1234112352142
GAPDH456545444454
EF-1α688688587787
BestKeeperUBC163136165166
TUA727462848632
YLS254225253255
UBQ376377376377
ACT435653434444
SKD1512511511513
GAPDH841744622721
EF-1α688888787888
RefFinderUBC766644676677
TUA825253818545
YLS654735542754
UBQ477477265366
ACT111562123412
SKD1233111351121
GAPDH342326434233
EF-1α588888787888
ΔCtUBC888888888876
TUA433523433212
YLS677777667688
UBQ255355255365
ACT766666766743
SKD1111111111451
GAPDH522232522534
EF-1α344444344127
Disclaimer/Publisher’s Note: The statements, opinions and data contained in all publications are solely those of the individual author(s) and contributor(s) and not of MDPI and/or the editor(s). MDPI and/or the editor(s) disclaim responsibility for any injury to people or property resulting from any ideas, methods, instructions or products referred to in the content.

