
Auditory Event-Related Potentials in Two Rat Models of Attention-Deficit Hyperactivity Disorder: Evidence of Automatic Attention Deficits in Spontaneously Hypertensive Rats but Not in Latrophilin-3 Knockout Rats

 , , , , and
Abstract
1. Introduction
1.1. ADHD and Lphn3
1.2. Lphn3 and Animal Models of ADHD Phenotypes
1.3. Auditory-Evoked Potentials and Attention in ADHD
1.4. The Current Study
2. Materials and Methods
2.1. Animals
2.2. Electrode Placement
2.3. ERP Recordings and Auditory Stimuli
2.4. EEG Processing and ERP Analyses
3. Results
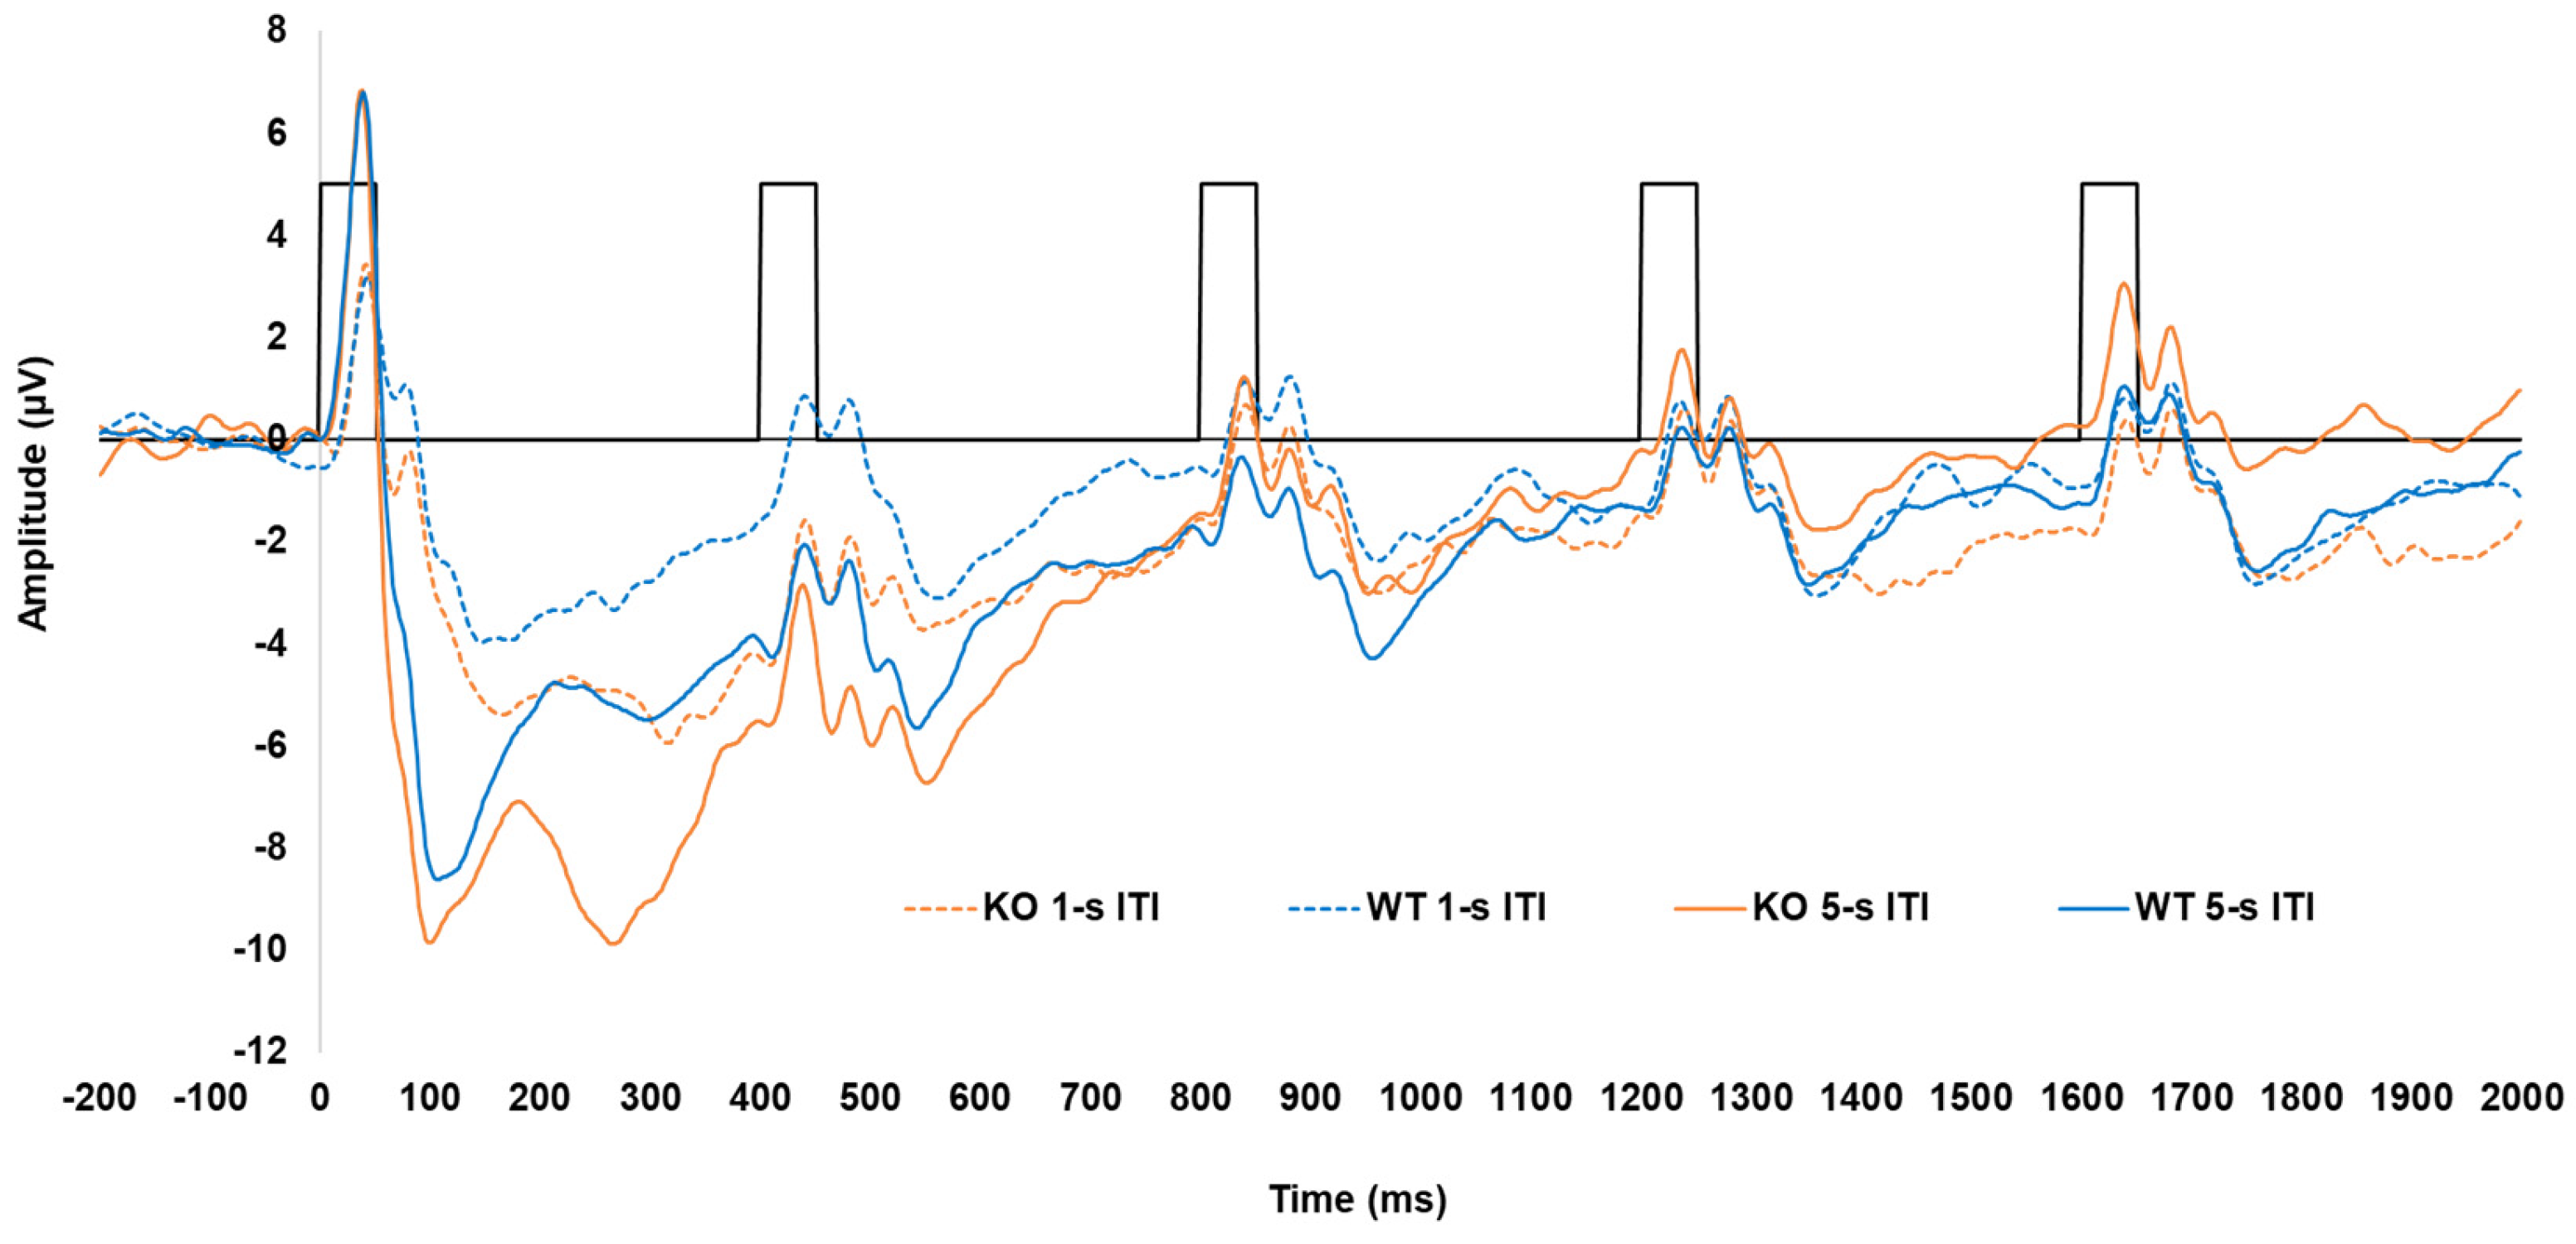
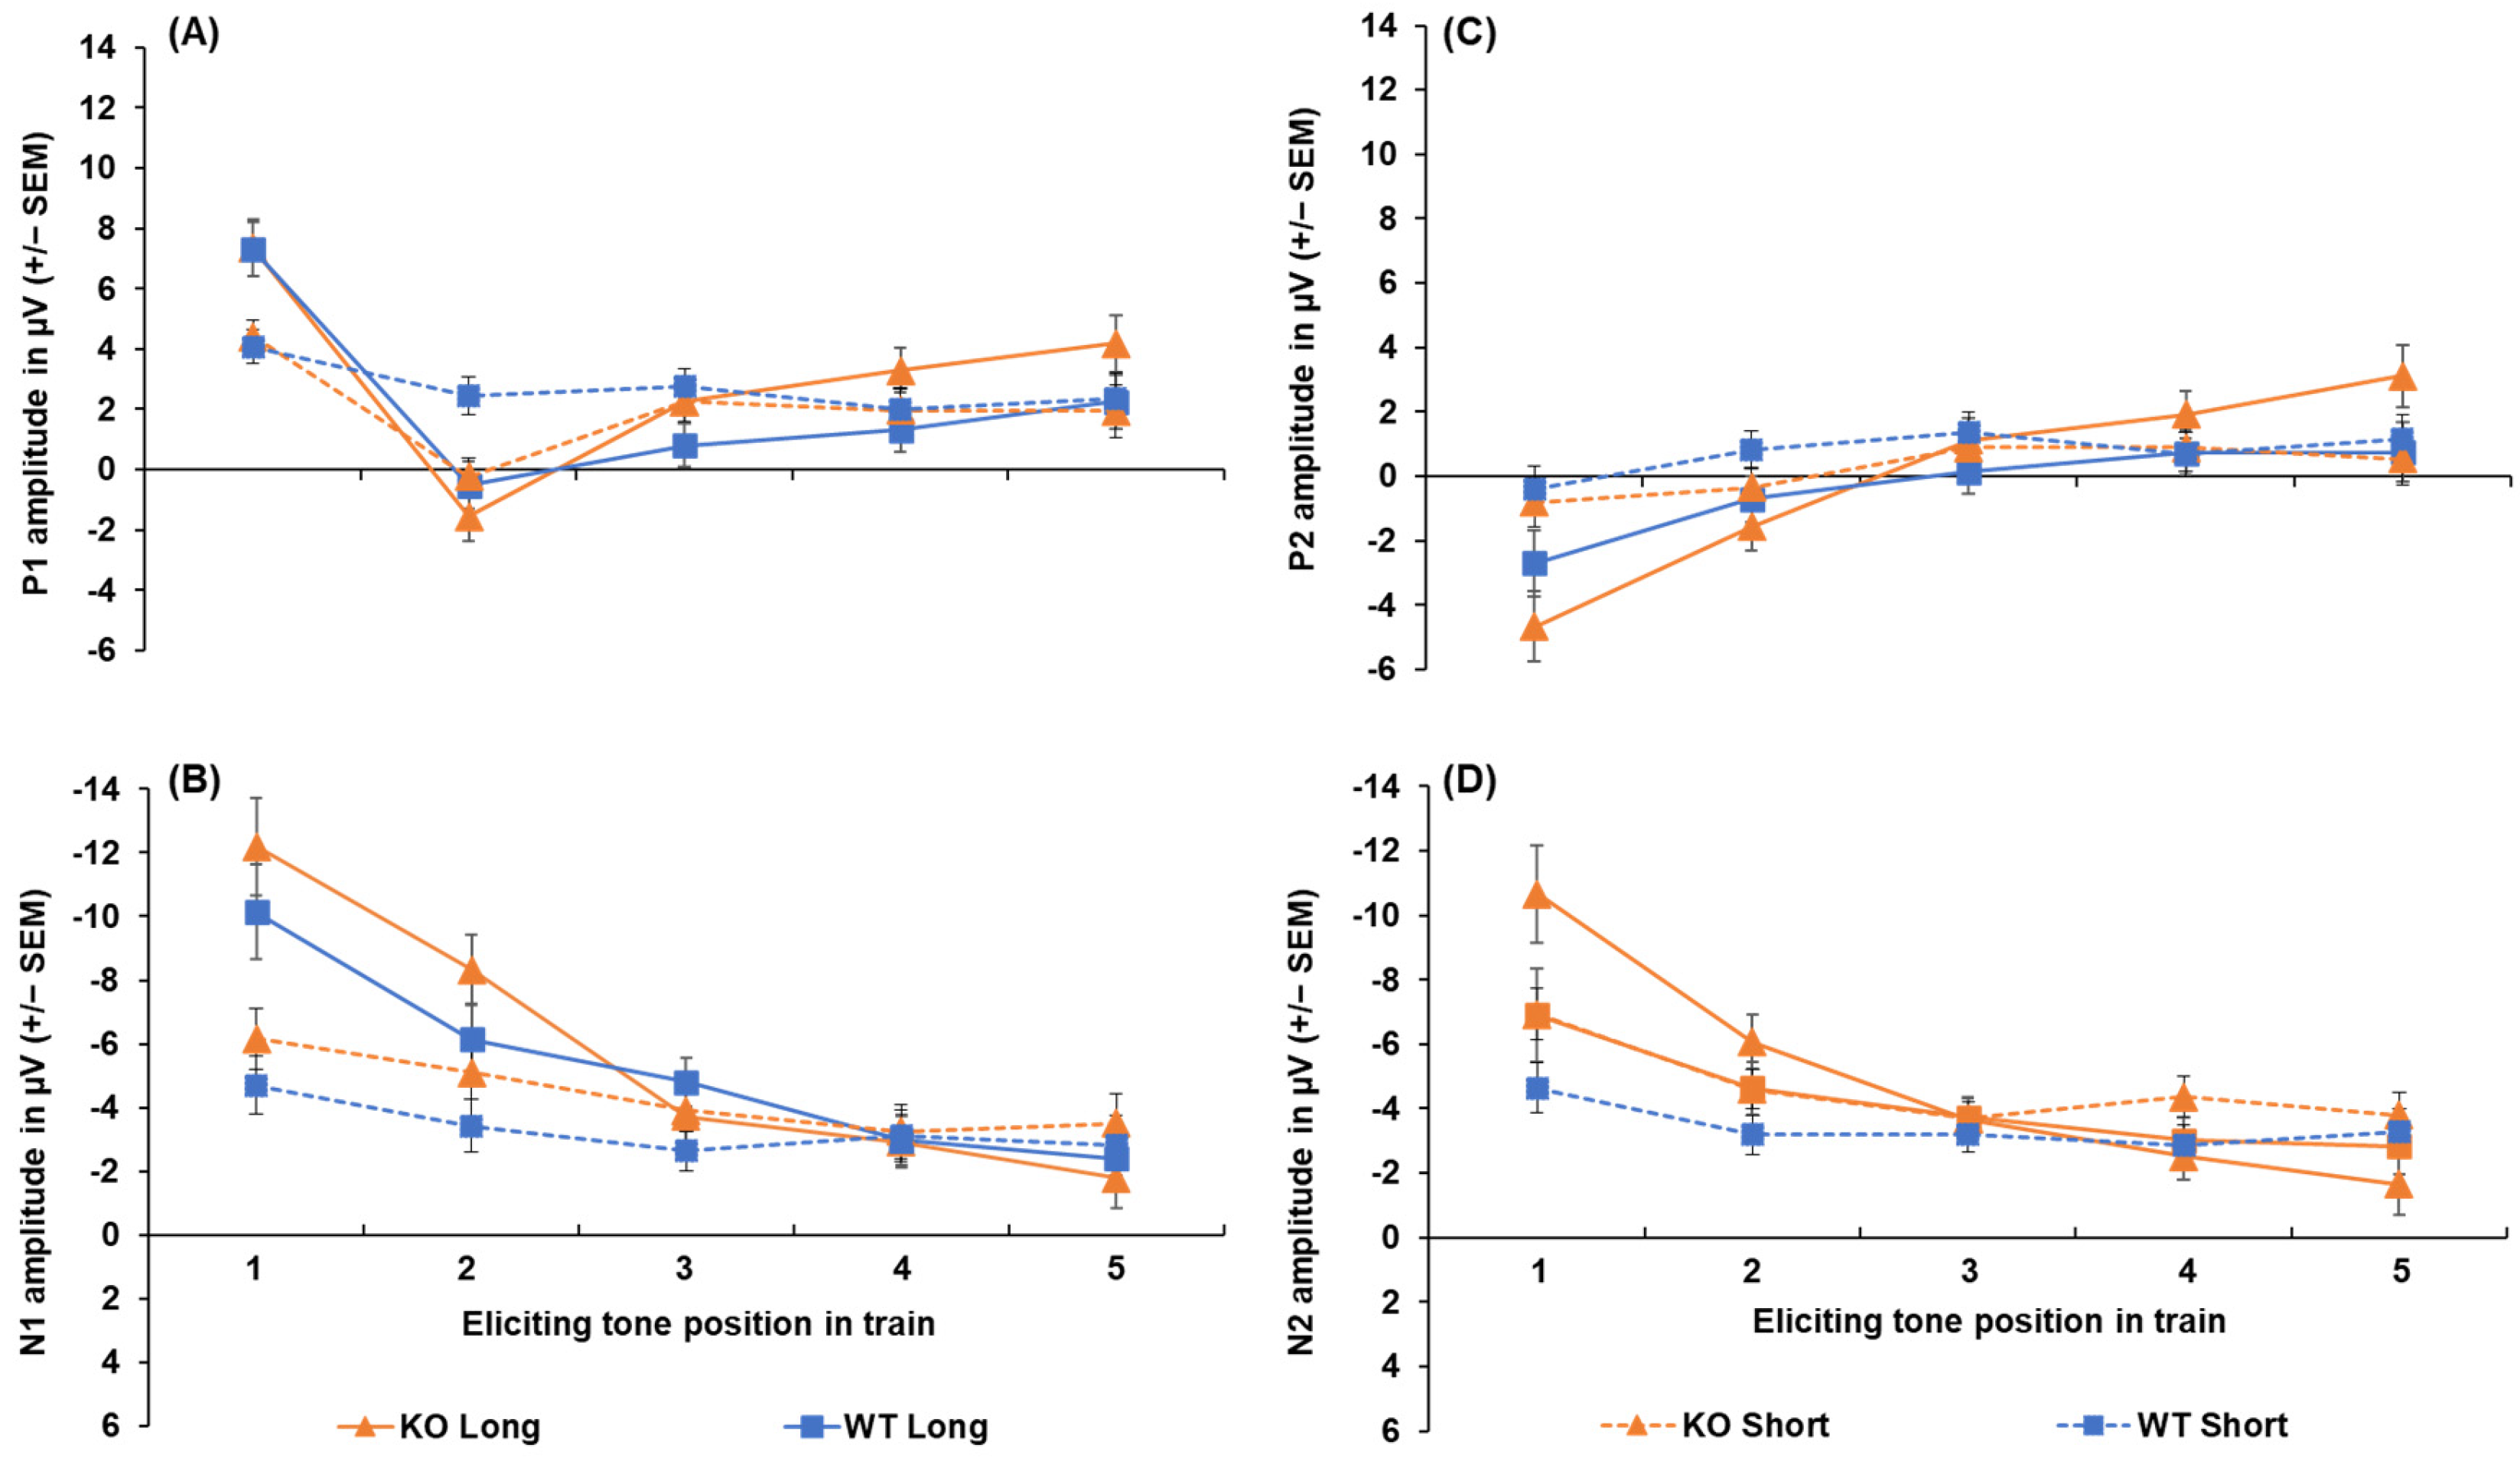
3.1. Lphn3 KO Rats
Peak Amplitudes and Latencies in KOs Versus WTs
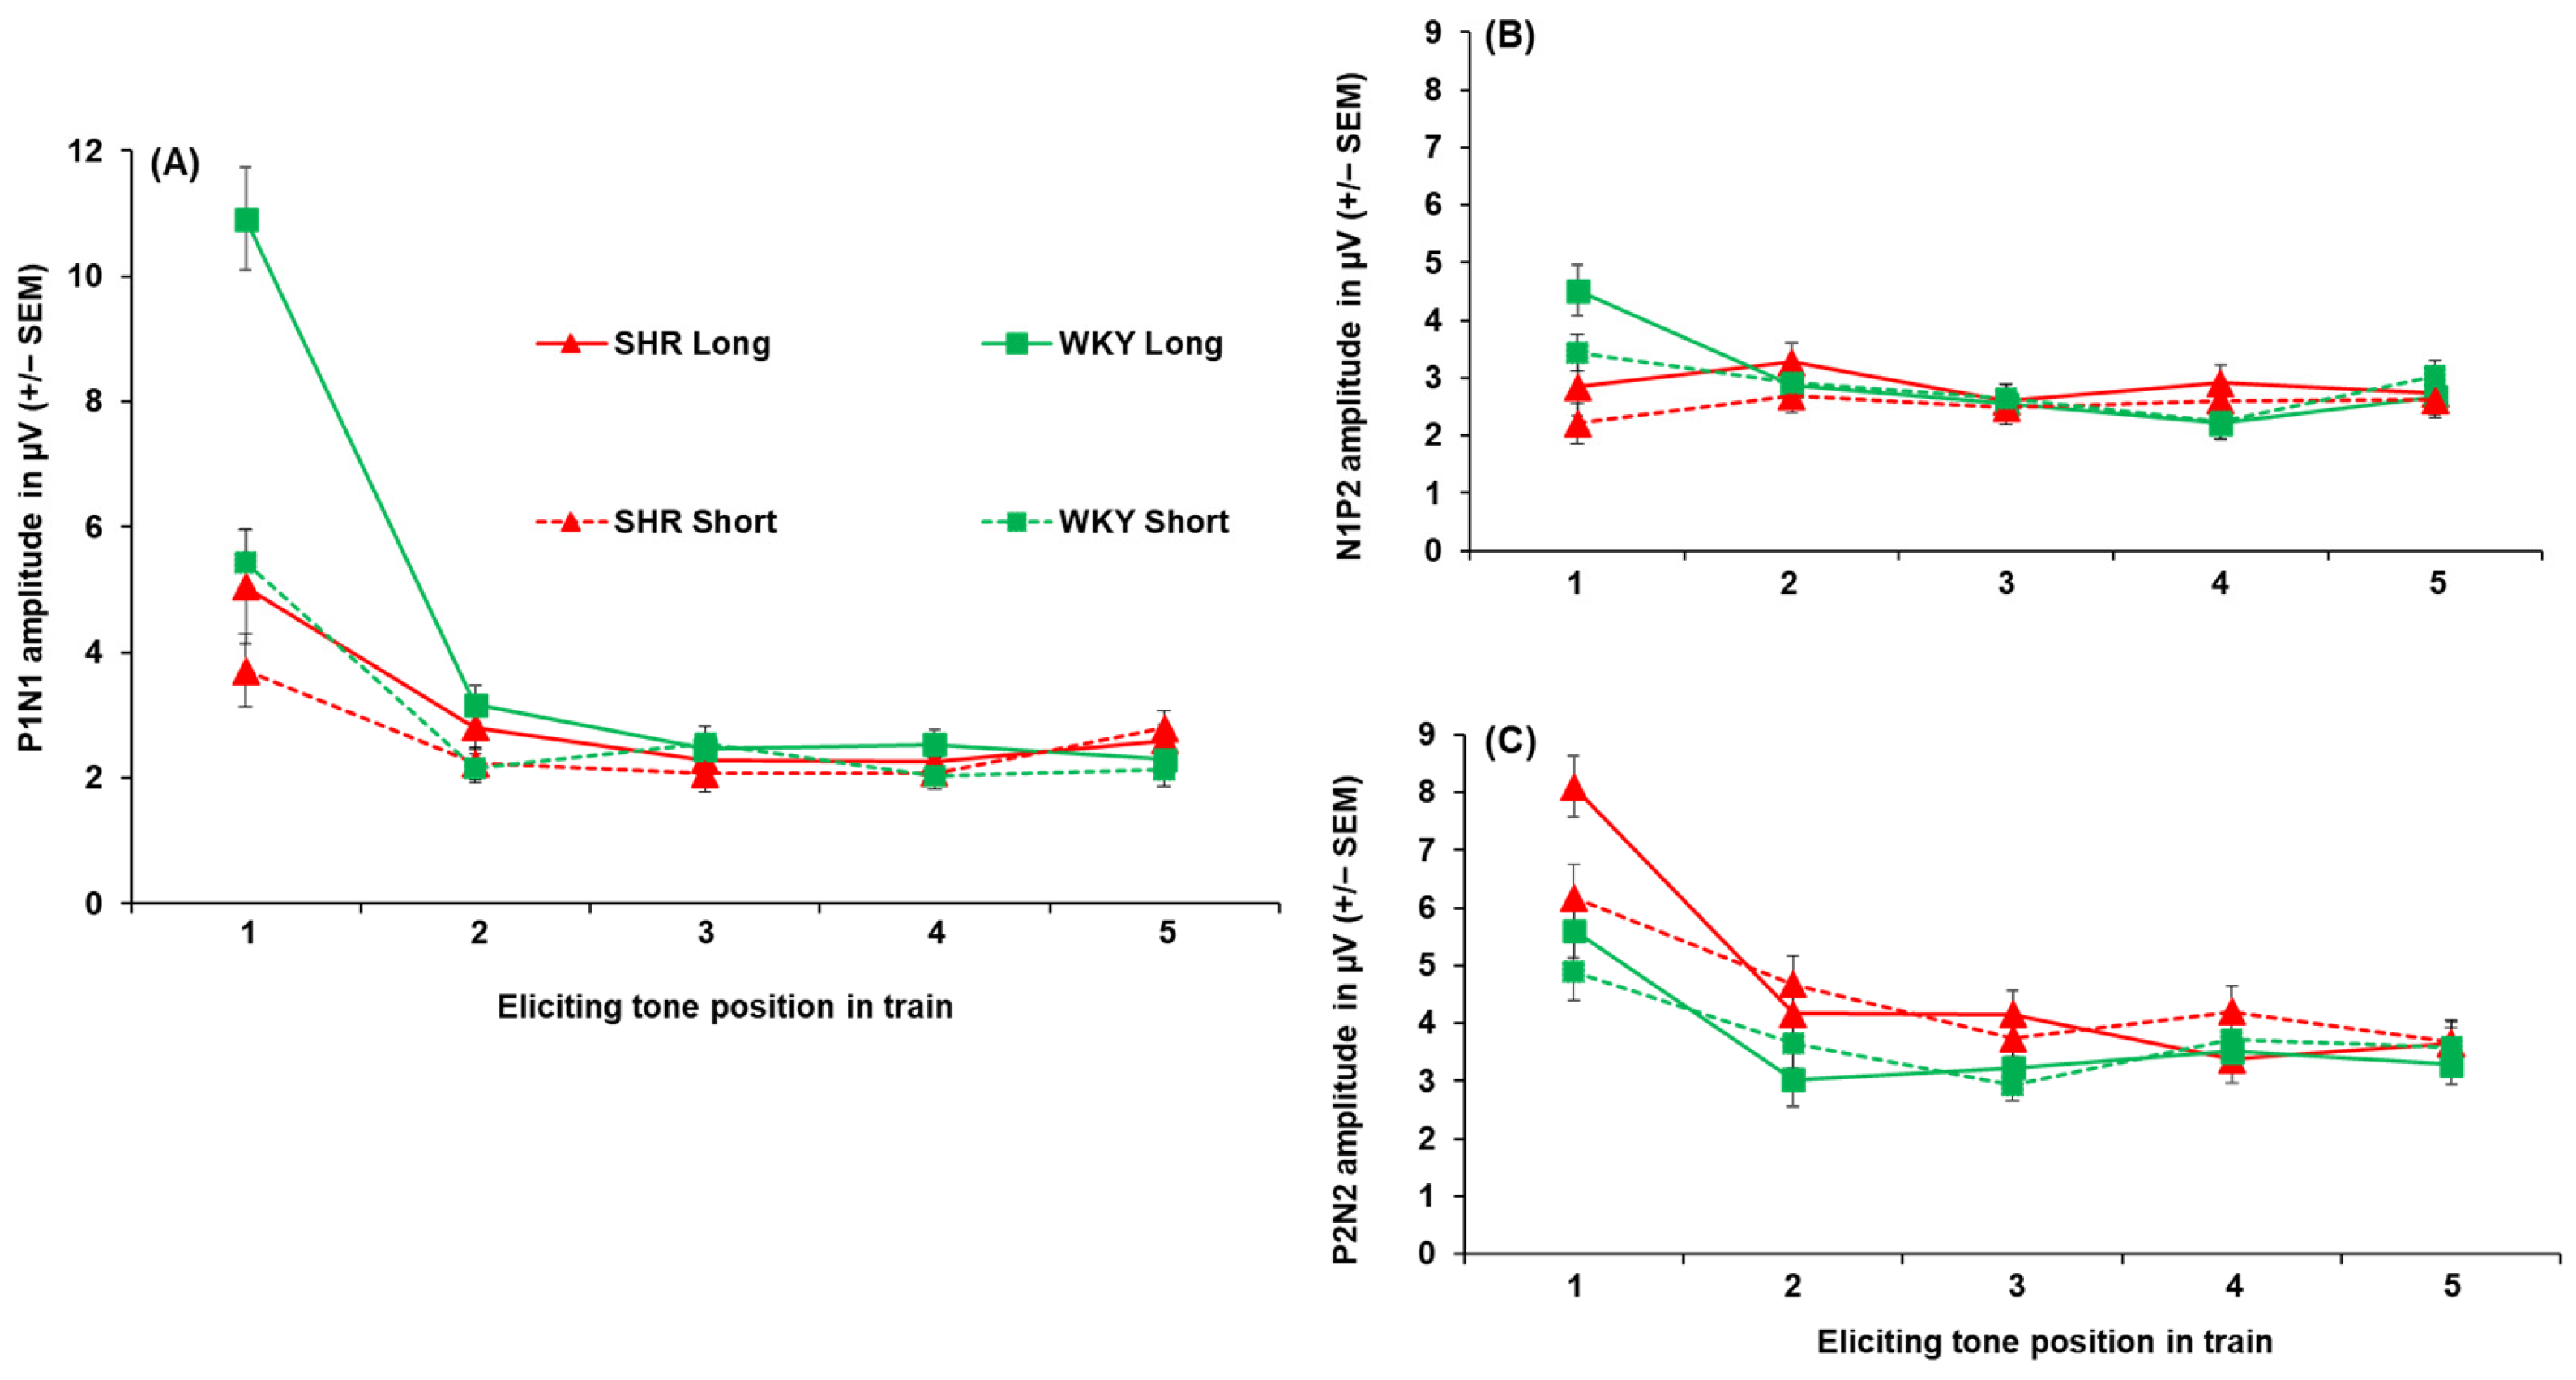
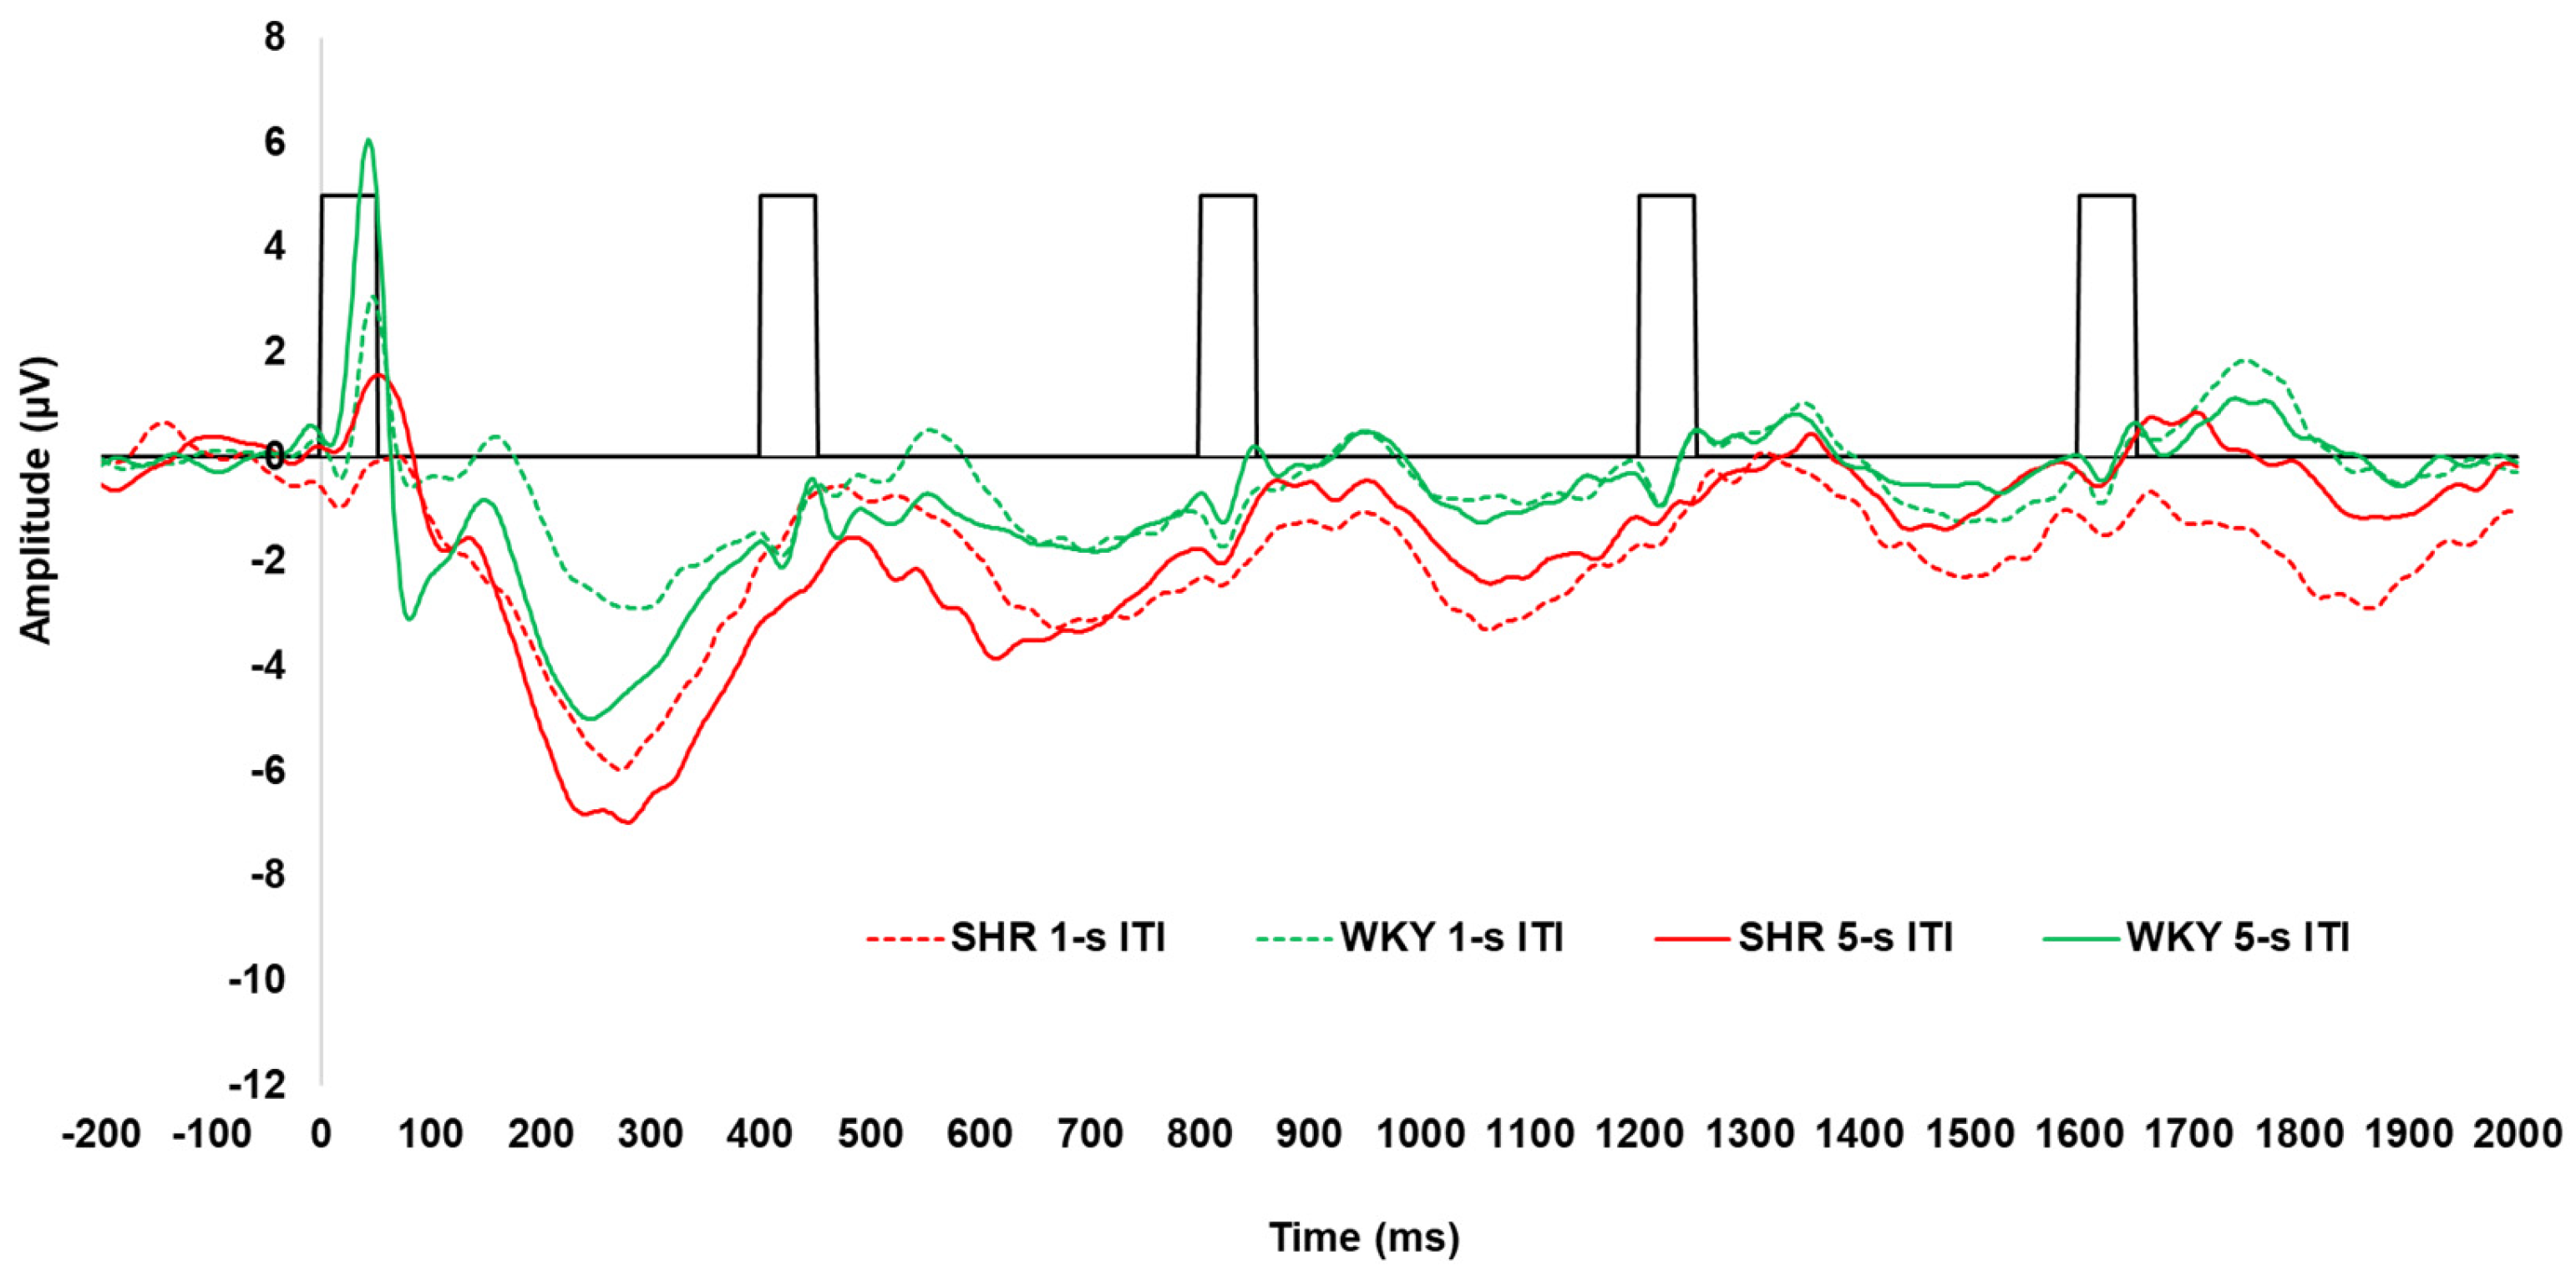
3.2. Spontaneously Hypertensive Rats
Peak Amplitudes and Latencies in SHRs Versus WKYs
4. Discussion
4.1. SHRs and the Locus Coeruleus
4.2. Lphn3 KOs and Dopamine Dysfunction
4.3. Considerations and Limits
4.4. Clinical Implications and Future Research
5. Conclusions
Supplementary Materials
Author Contributions
Funding
Institutional Review Board Statement
Informed Consent Statement
Data Availability Statement
Acknowledgments
Conflicts of Interest
Abbreviations
| Adgrl3 | Adhesion G protein-coupled receptor L3 |
| ADHD | Attention-deficit hyperactivity disorder |
| DA | Dopamine |
| DAT | Dopamine transporter |
| EEG | Electroencephalography/electroencephalogram |
| ERP | Event-related potential |
| ITI | Inter-train interval |
| KO | Knockout |
| LC | Locus coeruleus |
| LLAEP | Long latency auditory-evoked potential |
| Lphn3 | Latrophilin-3 |
| mPFC | Medial prefrontal cortex |
| NAcc | Nucleus accumbens |
| NE | Norepinephrine |
| NET | Norepinephrine transporter |
| WT | Wildtype |
| RDoC | Research domain criteria |
| SHR | Spontaneously hypertensive rat |
| WKY | Wistar–Kyoto |
Appendix A
Appendix A.1. Lphn3 Knockout Rats: Peak-to-Peak Amplitudes

Appendix A.2. Lphn3 Knockout Rats: Effect of Sex on Peak Amplitude and Latency
Appendix A.3. Spontaneously Hypertensive Rats: Peak-to-Peak Amplitudes
Appendix A.4. Spontaneously Hypertensive Rats: Effect of Sex on Peak Amplitude and Latency
References
- American Psychiatric Association. Diagnostic and Statistical Manual of Mental Disorders, 5th ed.; American Psychiatric Publishing: Washington, DC, USA, 2022. [Google Scholar] [CrossRef]
- Danielson, M.L.; Claussen, A.H.; Bitsko, R.H.; Katz, S.M.; Newsome, K.; Blumberg, S.J.; Kogan, M.D.; Reem, G. ADHD prevalence among US children and adolescents in 2022: Diagnosis, severity, co-occurring disorders, and treatment. J. Clin. Child Adolesc. Psychol. 2024, 53, 343–360. [Google Scholar] [CrossRef] [PubMed]
- Staley, B.S.; Robinson, L.R.; Claussen, A.H.; Katz, S.M.B.; Danielson, M.L.; Summers, A.D.; Farr, S.L.; Blumberg, S.J.; Tinker, S.C. Attention-deficit/hyperactivity disorder diagnosis, Treatment, and telehealth use in adults—National center for health statistics rapid surveys system, United States, October–November 2023. Morb. Mortal. Wkly. Rep. 2014, 73, 890–895. [Google Scholar] [CrossRef] [PubMed]
- Faraone, S.V.; Biederman, J.; Mick, E. The age-dependent decline of attention deficit hyperactivity disorder: A meta-analysis of follow-up studies. Psychol. Med. 2006, 36, 159–165. [Google Scholar] [CrossRef]
- Luo, Y.; Weibman, D.; Halperin, J.M.; Li, X. A review of heterogeneity in attention deficit/hyperactivity disorder. Front. Hum. Neurosci. 2019, 13, 42. [Google Scholar] [CrossRef]
- Faraone, S.V.; Larsson, H. Genetics of attention deficit hyperactivity disorder. Mol. Psychiatry 2019, 24, 562–575. [Google Scholar] [CrossRef]
- Faraone, S.V.; Asherson, P.; Banaschewski, T.; Biederman, J.; Buitelaar, J.K.; Ramos-Quiroga, J.A.; Rhode, L.A.; Sonuga-Barke, E.J.S.; Tannock, R.; Franke, B. Attention-deficit/hyperactivity disorder. Nat. Rev. Dis. Primers 2015, 1, 15020. [Google Scholar] [CrossRef]
- Faraone, S.V.; Biederman, J. Can attention-deficit/hyperactivity disorder onset occur in adulthood? JAMA Psychiatry 2016, 73, 655–656. [Google Scholar] [CrossRef]
- Larsson, H.; Anckarsater, H.; Råstam, M.; Chang, Z.; Lichtenstein, P. Childhood attention-deficit hyperactivity disorder as an extreme of a continuous trait: A quantitative genetic study of 8500 twin pairs. J. Child Psychol. Psychiatry 2012, 53, 73–80. [Google Scholar] [CrossRef]
- Arcos-Burgos, M.; Castellanos, F.X.; Pineda, D.; Lopera, F.; Palacio, J.D.; Palacio, L.G.; Rapoport, J.L.; Berg, K.; Bailey-Wilson, J.E.; Muenke, M. Attention-deficit/hyperactivity disorder in a population isolate: Linkage to loci at 4q13. 2, 5q33. 3, 11q22, and 17p11. Am. J. Hum. Genet. 2004, 75, 998–1014. [Google Scholar] [CrossRef]
- Arcos-Burgos, M.; Jain, M.; Acosta, M.T.; Shively, S.; Stanescu, H.; Wallis, D.; Domené, S.; I Vélez, J.; Karkera, J.D.; Balog, J.; et al. A common variant of the latrophilin-3 gene, Lphn3, confers susceptibility to ADHD and predicts effectiveness of stimulant medication. Mol. Psychiatry 2010, 15, 1053–1066. [Google Scholar] [CrossRef]
- Jain, M.; Palacio, L.G.; Castellanos, F.X.; Palacio, J.D.; Pineda, D.; Restrepo, M.I.; Muñoz, J.F.; Lopera, F.; Wallis, D.; Berg, K.; et al. Attention-deficit/hyperactivity disorder and comorbid disruptive behavior disorders: Evidence of pleiotropy and new susceptibility loci. Biol. Psychiatry 2007, 61, 1329–1339. [Google Scholar] [CrossRef] [PubMed]
- Ribasés, M.; Ramos-Quiroga, J.A.; Sánchez-Mora, C.; Bosch, R.; Richarte, V.; Palomar, G.; Gastaminza, X.; Bielsa, A.; Arcos-Burgos, M.; Muenke, M.; et al. Contribution of Lphn3 to the genetic susceptibility to ADHD in adulthood: A replication study. Genes Brain Behav. 2011, 10, 149–157. [Google Scholar] [CrossRef] [PubMed]
- Bruxel, E.M.; Moreira-Maia, C.R.; Akutagava-Martins, G.C.; Quinn, T.P.; Klein, M.; Franke, B.; Ribasés, M.; Rovira, P.; Sánchez-Mora, C.; Kappel, D.B.; et al. Meta-analysis and systematic review of Adgrl3 (Lphn3) polymorphisms in ADHD susceptibility. Mol. Psychiatry 2021, 26, 2277–2285. [Google Scholar] [CrossRef] [PubMed]
- Andersson, A.; Tuvblad, C.; Chen, Q.; Du Rietz, E.; Cortese, S.; Kuja-Halkola, R.; Larsson, H. Research Review: The strength of the genetic overlap between ADHD and other psychiatric symptoms—A systematic review and meta-analysis. J. Child Psychol. Psychiatry 2020, 61, 1173–1183. [Google Scholar] [CrossRef]
- Cuthbert, B.N. Research domain criteria (RDoC): Progress and potential. Curr. Dir. Psychol. Sci. 2022, 31, 107–114. [Google Scholar] [CrossRef]
- Cuthbert, B.N.; Insel, T.R. Toward the future of psychiatric diagnosis: The seven pillars of RDoC. BMC Med. 2013, 11, 126. [Google Scholar] [CrossRef]
- Iacono, W.G.; Malone, S.M.; Vrieze, S.I. Endophenotype best practices. Int. J. Psychophysiol. 2017, 111, 115–144. [Google Scholar] [CrossRef]
- Miller, G.A.; Rockstroh, B. Endophenotypes in psychopathology research: Where do we stand? Annu. Rev. Clin. Psychol. 2013, 9, 177–213. [Google Scholar] [CrossRef]
- van der Voet, Á.; Harich, Á.; Franke, Á.; Schenck, A. ADHD-associated dopamine transporter, latrophilin and neurofibromin share a dopamine-related locomotor signature in Drosophila. Mol. Psychiatry 2016, 21, 565–573. [Google Scholar] [CrossRef]
- Fontana, B.D.; Reichmann, F.; Tilley, C.A.; Lavlou, P.; Shkumatava, A.; Alnassar, N.; Hillman, C.; Karlsson, K.A.; Norton, W.H.J.; Parker, M.O. Adgrl3.1-deficient zebrafish show noradrenaline-mediated externalizing behaviors, and altered expression of externalizing disorder-candidate genes, suggesting functional targets for treatment. Transl. Psychiatry 2023, 13, 304. [Google Scholar] [CrossRef]
- Lange, M.; Norton, W.; Coolen, M.; Chaminade, M.; Merker, S.; Proft, F.; Schmitt, A.; Vernier, P.; Lesch, K.-P.; Bally-Cuif, L. The ADHD-susceptibility gene lphn3.1 modulates dopaminergic neuron formation and locomotor activity during zebrafish development. Mol. Psychiatry 2012, 17, 946–954. [Google Scholar] [CrossRef] [PubMed]
- Lange, M.; Froc, C.; Grunwald, H.; Norton, W.H.; Bally-Cuif, L. Pharmacological analysis of zebrafish lphn3. 1 morphant larvae suggests that saturated dopaminergic signaling could underlie the ADHD-like locomotor hyperactivity. Prog. Neuro-Psychopharmacol. Biol. Psychiatry 2018, 84, 181–189. [Google Scholar] [CrossRef] [PubMed]
- Sveinsdóttir, H.S.; Christensen, C.; Þorsteinsson, H.; Lavalou, P.; Parker, M.O.; Shkumatava, A.; Norton, W.H.J.; Andriambeloson, E.; Wagner, S.; Karlsson, K.A. Novel non-stimulants rescue hyperactive phenotype in an Adgrl3.1 mutant zebrafish model of ADHD. Neuropsychopharmacology 2023, 48, 1155–1163. [Google Scholar] [CrossRef] [PubMed]
- Mortimer, N.; Ganster, T.; O’Leary, A.; Popp, S.; Freudenberg, F.; Reif, A.; Artigas, M.A.; Ribasés, M.; Ramos-Quiroga, J.A.R.; Lesch, K.; et al. Dissociation of impulsivity and aggression in mice deficient for the ADHD risk gene Adgrl3: Evidence for dopamine transporter dysregulation. Neuropharmacology 2019, 156, 107557. [Google Scholar] [CrossRef]
- Orsini, C.A.; Setlow, B.; DeJesus, M.; Galaviz, S.; Loesch, K.; Ioerger, T.; Wallis, D. Behavioral and transcriptomic profiling of mice null for Lphn3, a gene implicated in ADHD and addiction. Mol. Genet. Genom. Med. 2016, 4, 322–343. [Google Scholar] [CrossRef]
- Wallis, D.; Hill, D.; Mendez, I.A.; Abbott, L.C.; Finnell, R.H.; Wellman, P.J.; Setlow, B. Initial characterization of mice null for Lphn3, a gene implicated in ADHD and addiction. Brain Res. 2012, 1463, 85–92. [Google Scholar] [CrossRef]
- Regan, S.L.; Hufgard, J.R.; Pitzer, E.M.; Sugimoto, C.; Hu, Y.C.; Williams, M.T.; Vorhees, C.V. Knockout of latrophilin-3 in Sprague-Dawley rats causes hyperactivity, hyper-reactivity, under-response to amphetamine, and disrupted dopamine markers. Neurobiol. Dis. 2019, 130, 104494. [Google Scholar] [CrossRef]
- Carbajal, M.S.; Bounmy, A.J.; Harrison, O.B.; Nolen, H.G.; Regan, S.L.; Williams, M.T.; Vorhees, C.V.; Sable, H.J.K. Impulsive choice in two different rat models of ADHD—Spontaneously hypertensive and Lphn3 knockout rats. Front. Neurosci. 2023, 17, 1084218. [Google Scholar] [CrossRef]
- González-Barriga, F.; Orduña, V. Spontaneously hypertensive rats show higher impulsive action, but equal impulsive choice with both positive and aversive consequences. Behav. Brain Res. 2022, 427, 113858. [Google Scholar] [CrossRef]
- Sable, H.J.; Lester, D.B.; Potter, J.L.; Nolen, H.G.; Cruthird, D.M.; Estes, L.M.; Johnson, A.D.; Regan, S.L.; Vorhees, C.V. An assessment of executive function in two different rat models of attention-deficit hyperactivity disorder: Spontaneously hypertensive versus Lphn3 knockout rats. Genes Brain Behav. 2021, 20, e12767. [Google Scholar] [CrossRef]
- Regan, S.L.; Pitzer, E.M.; Hufgard, J.R.; Sugimoto, C.; Williams, M.T.; Vorhees, C.V. A novel role for the ADHD risk gene latrophilin-3 in learning and memory in Lphn3 knockout rats. Neurobiol. Dis. 2021, 158, 105456. [Google Scholar] [CrossRef] [PubMed]
- Picton, T.W.; Bentin, S.; Berg, P.; Donchin, E.; Hillyard, S.A.; Johnson, R.; Miller, G.A.; Ritter, W.; Ruchkin, D.S.; Rugg, M.D.; et al. Guidelines for using human event-related potentials to study cognition: Recording standards and publication criteria. Psychophysiology 2000, 37, 127–152. [Google Scholar] [CrossRef] [PubMed]
- van Beijsterveldt, C.E.M.; Boomsma, D.I. Genetics of the human electroencephalogram (EEG) and event-related brain potentials (ERPs): A review. Hum. Genet. 1994, 94, 319–330. [Google Scholar] [CrossRef]
- Rosen, A.M.; Spellman, T.; Gordon, J.A. Electrophysiological endophenotypes in rodent models of schizophrenia and psychosis. Biol. Psychiatry 2015, 77, 1041–1049. [Google Scholar] [CrossRef]
- Modi, M.E.; Sahin, M. Translational use of event-related potentials to assess circuit integrity in ASD. Nat. Rev. Neurol. 2017, 13, 160–170. [Google Scholar] [CrossRef]
- Hauser, M.F.; Wiescholleck, V.; Colitti-Klausnitzer, J.; Bellebaum, C.; Manahan-Vaughan, D. Event-related potentials evoked by passive visuospatial perception in rats and humans reveal common denominators in information processing. Brain Struct. Funct. 2019, 224, 1583–1597. [Google Scholar] [CrossRef]
- Sambeth, A.; Maes, J.H.; Luijtelaar, G.V.; Molenkamp, I.B.; Jongsma, M.L.; Rijn, C.M. Auditory event-related potentials in humans and rats: Effects of task manipulation. Psychophysiology 2003, 40, 60–68. [Google Scholar] [CrossRef]
- Sambeth, A.; Maes, J.H.; Quiroga, R.Q.; Coenen, A.M. Effects of stimulus repetitions on the event-related potential of hummans and rats. Int. J. Psychophysiol. 2004, 53, 197–205. [Google Scholar] [CrossRef]
- Pratt, H. Sensory ERP components. In The Oxford Handbook of ERP Components; Luck, S.J., Kappenman, E., Eds.; Oxford University Press: New York, NY, USA, 2012; pp. 98–114. [Google Scholar]
- Näätänen, R.; Picton, T. The N1 wave of the human electric and magnetic response to sound: A review and an analysis of the component structure. Psychophysiology 1987, 24, 375–425. [Google Scholar] [CrossRef]
- Näätänen, R.; Kujala, T.; Winkler, I. Auditory processing that leads to conscious perception: A unique window to central auditory processing opened by the mismatch negativity and related responses. Psychophysiology 2011, 48, 4–22. [Google Scholar] [CrossRef]
- Barry, R.J.; Johnstone, S.J.; Clarke, A.R. A review of electrophysiology in attention-deficit/hyperactivity disorder: II. Event-related potentials. Clin. Neurophysiol. 2003, 114, 184–198. [Google Scholar] [CrossRef] [PubMed]
- Johnstone, S.J.; Barry, R.J.; Clarke, A.R. Ten years on: A follow-up review of ERP research in attention-deficit/hyperactivity disorder. Clin. Neurophysiol. 2013, 124, 644–657. [Google Scholar] [CrossRef] [PubMed]
- Kaiser, A.; Aggensteiner, P.M.; Baumeister, S.; Holz, N.E.; Banaschewski, T.; Brandeis, D. Earlier versus later cognitive event-related potentials (ERPs) in attention-deficit/hyperactivity disorder (ADHD): A meta-analysis. Neurosci. Biobehav. Rev. 2020, 112, 117–134. [Google Scholar] [CrossRef]
- Barry, R.J.; Clarke, A.R.; McCarthy, R.; Selikowitz, M.; Brown, C.R.; Heaven, P.C. Event-related potentials in adults with Attention-Deficit/Hyperactivity Disorder: An investigation using an inter-modal auditory/visual oddball task. Int. J. Psychophysiol. 2009, 71, 124–131. [Google Scholar] [CrossRef]
- Prox, V.; Dietrich, D.E.; Zhang, Y.; Emrich, H.M.; Ohlmeier, M.D. Attentional processing in adults with ADHD as reflected by event-related potentials. Neurosci. Lett. 2007, 419, 236–241. [Google Scholar] [CrossRef]
- Sable, J.J.; Knopf, K.L.; Kyle, M.R.; Schully, L.T.; Brooks, M.M.; Parry, K.H.; Thompson, I.A.; Suna, E.B.; Stowe, R.; Flink, L.A.; et al. Attention-deficit hyperactivity disorder reduces automatic attention in young adults. Psychophysiology 2013, 50, 308–313. [Google Scholar] [CrossRef]
- Budd, T.W.; Nakamura, T.; Fulham, W.R.; Todd, J.; Schall, U.; Hunter, M.; Hodgson, D.M.; Michie, P.T. Repetition suppression of the rat auditory evoked potential at brief stimulus intervals. Brain Res. 2013, 1498, 59–68. [Google Scholar] [CrossRef]
- de Bruin, N.M.; Ellenbroek, B.A.; Van Schaijk, W.J.; Cools, A.R.; Coenen, A.M.; Van Luijtelaar, E.L. Sensory gating of auditory evoked potentials in rats: Effects of repetitive stimulation and the interstimulus interval. Biol. Psychol. 2001, 55, 195–213. [Google Scholar] [CrossRef]
- Boutros, N.N.; Gjini, K.; Urbach, H.; Pflieger, M.E. Mapping repetition suppression of the N100 evoked response to the human cerebral cortex. Biol. Psychiatry 2011, 69, 883–889. [Google Scholar] [CrossRef]
- Okamoto, K.A. Development of a strain of spontaneously hypertensive rats. Jpn. Circ. J. 1963, 27, 282–293. [Google Scholar] [CrossRef]
- Regan, S.L.; Williams, M.T.; Vorhees, C.V. Review of rodent models of attention deficit hyperactivity disorder. Neurosci. Biobehav. Rev. 2022, 132, 621–637. [Google Scholar] [CrossRef] [PubMed]
- Sagvolden, T. Behavioral validation of the spontaneously hypertensive rat (SHR) as an animal model of attention-deficit/hyperactivity disorder (AD/HD). Neurosci. Biobehav. Rev. 2000, 24, 31–39. [Google Scholar] [CrossRef] [PubMed]
- Sagvolden, T.; Johansen, E.B.; Wøien, G.; Walaas, S.I.; Storm-Mathisen, J.; Bergersen, L.H.; Hvalby, O.; Jensen, V.; Aase, H.; Russell, V.A.; et al. The spontaneously hypertensive rat model of ADHD–The importance of selecting the approprite reference strain. Neuropharmacology 2009, 57, 619–626. [Google Scholar] [CrossRef]
- Moridera, A.; Shinba, T.; Yoshi, M.; Inoue, M.; Azuma, K.; Saka, N.; Kubo, H.; Mugishima, G. Auditory event-related potentials to paired stimulation in spontaneously hypertensive rat (SHR) show difference of undulation: Relation to dysfunction of sensory gating in an animal model of attention deficit hyperactivity disorder (ADHD). Jpn. J. Physiol. Psychol. Psychophysiol. 2020, 38, 4–11. [Google Scholar] [CrossRef]
- NIH. Public Health Service Policy on Humane Care and Use of Laboratory Animals; NIH: Bethesda, MD, USA, 2015. [Google Scholar]
- Brewer, L.M.; Holdford, M.M.; Holloway, Z.R.; Sable, J.J.; Andrasik, F.; Sable, H.J.K. Isoflurane effects on the N1 and other long-latency auditory evoked potentials in Wistar rats. Neurosci. Res. 2021, 173, 71–79. [Google Scholar] [CrossRef]
- Faul, F.; Erdfelder, E.; Lang, A.-G.; Buchner, A. G*Power 3: A flexible statistical power analysis program for the social, behavioral, and biomedical sciences. Behav. Res. Methods 2007, 39, 175–191. [Google Scholar] [CrossRef]
- Fabiani, M.; Low, K.A.; Wee, E.; Sable, J.J.; Gratton, G. Reduced suppression or labile memory? Mechanisms of inefficient filtering of irrelevant information in older adults. J. Cogn. Neurosci. 2006, 18, 637–650. [Google Scholar] [CrossRef]
- Sable, J.J.; Low, K.A.; Maclin, E.L.; Fabiani, M. Latent inhibition mediates N1 attenuation to repeating sounds. Psychophysiology 2004, 41, 636–642. [Google Scholar] [CrossRef]
- Posner, M.I.; Petersen, S.E. The attention system of the human brain. Annu. Rev. Neurosci. 1990, 13, 25–42. [Google Scholar] [CrossRef]
- Petersen, S.E.; Posner, M.I. The attention system of the human brain: 20 years after. Annu. Rev. Neurosci. 2012, 35, 73–89. [Google Scholar] [CrossRef]
- Johnson, K.A.; Robertson, I.H.; Barry, E.; Mulligan, A.; Dáibhis, A.; Daly, M.; Watchorn, A.; Gill, M.; Bellgrove, M.A. Impaired conflict resolution and alerting in children with ADHD: Evidence from the Attention Network Task (ANT). J. Child Psychol. Psychiatry 2008, 49, 1339–1347. [Google Scholar] [CrossRef] [PubMed]
- Maness, E.B.; Burk, J.A.; McKenna, J.T.; Schiffino, F.L.; Strecker, R.E.; McCoy, J.G. Role of the locus coeruleus and basal forebrain in arousal and attention. Brain Res. Bull. 2022, 188, 47–58. [Google Scholar] [CrossRef] [PubMed]
- Halperin, J.M.; Schulz, K.P. Revisiting the role of the prefrontal cortex in the pathophysiology of attention-deficit/hyperactivity disorder. Psychol. Bull. 2006, 132, 560. [Google Scholar] [CrossRef] [PubMed]
- Aston-Jones, G.; Rajkowski, J.; Cohen, J. Locus coeruleus and regulation of behavioral flexibility and attention. Prog. Brain Res. 2000, 126, 165–182. [Google Scholar] [CrossRef] [PubMed]
- Chandler, D.J.; Gao, W.J.; Waterhouse, B.D. Heterogeneous organization of the locus coeruleus projections to prefrontal and motor cortices. Proc. Natl. Acad. Sci. USA 2014, 111, 6816–6821. [Google Scholar] [CrossRef]
- Berridge, C.W.; Waterhouse, B.D. The locus coeruleus–noradrenergic system: Modulation of behavioral state and state-dependent cognitive processes. Brain Res. Rev. 2003, 42, 33–84. [Google Scholar] [CrossRef]
- Sara, S.J. The locus coeruleus and noradrenergic modulation of cognition. Nat. Rev. Neurosci. 2009, 10, 211–223. [Google Scholar] [CrossRef]
- Sara, S.J.; Bouret, S. Orienting and reorienting: The locus coeruleus mediates cognition through arousal. Neuron 2012, 76, 130–141. [Google Scholar] [CrossRef]
- Waterhouse, B.D.; Navarra, R.L. The locus coeruleus-norepinephrine system and sensory signal processing: A historical review and current perspectives. Brain Res. 2019, 1709, 1–15. [Google Scholar] [CrossRef]
- Aston-Jones, G.; Cohen, J.D. Adaptive gain and the role of the locus coeruleus–norepinephrine system in optimal performance. J. Comp. Neurol. 2005, 493, 99–110. [Google Scholar] [CrossRef]
- Vazey, E.M.; Moorman, D.E.; Aston-Jones, G. Phasic locus coeruleus activity regulates cortical encoding of salience information. Proc. Natl. Acad. Sci. USA 2018, 115, E9439–E9448. [Google Scholar] [CrossRef] [PubMed]
- Aston-Jones, G.; Iba, M.; Clayton, E.; Rajkowski, J.; Cohen, J. The locus coeruleus and regulation of behavioral flexibility and attention: Clinical implications. In Brain Norepinephrine: Neurobiology and Therapeutics; Ordway, G.A., Schwartz, M.A., Frazer, A., Eds.; Cambridge University Press: Cambridge, UK, 2007; pp. 196–235. [Google Scholar] [CrossRef]
- Aboitiz, F.; Ossandón, T.; Zamorano, F.; Palma, B.; Carrasco, X. Irrelevant stimulus processing in ADHD: Catecholamine dynamics and attentional networks. Front. Psychol. 2014, 5, 60632. [Google Scholar] [CrossRef] [PubMed]
- Sergeant, J. The cognitive-energetic model: An empirical approach to attention-deficit hyperactivity disorder. Neurosci. Biobehav. Rev. 2000, 24, 7–12. [Google Scholar] [CrossRef]
- Sergeant, J. Modeling attention-deficit/hyperactivity disorder: A critical appraisal of the cognitive-energetic model. Biol. Psychiatry 2005, 57, 1248–1255. [Google Scholar] [CrossRef]
- Sanders, A. Towards a model of stress and human performance. Acta Psychol. 1983, 53, 61–97. [Google Scholar] [CrossRef]
- de Villiers, A.S.; Russell, V.A.; Sagvolden, T.; Searson, A.; Jaffer, A.; Taljaard, J.J. β 2 Mediated inhibition of [3H] dopamine release from nucleus accumbens slices and monoamine levels in a rat model for attention-deficit hyperactivity disorder. Neurochem. Res. 1995, 20, 427–433. [Google Scholar] [CrossRef]
- Russell, V.A. Hypodopaminergic and hypernoradrenergic activity in prefrontal cortex slices of an animal model for attention-deficit hyperactivity disorder—The spontaneously hypertensive rat. Behav. Brain Res. 2002, 130, 191–196. [Google Scholar] [CrossRef]
- Igata, S.; Hayashi, T.; Itoh, M.; Akasu, T.; Takano, M.; Ishimatsu, M. Persistent α1-adrenergic receptor function in the nucleus locus coeruleus causes hyperexcitability in AD/HD model rats. J. Neurophysiol. 2014, 111, 777–786. [Google Scholar] [CrossRef]
- Qi RLi, M.; Ma, Y.; Chen, N. State-dependent changes in auditory sensory gating in different cortical areas in rats. PLoS ONE 2015, 10, e0126684. [Google Scholar] [CrossRef]
- Rajkowski, J.; Kubiak, P.; Aston-Jones, G. Locus coeruleus activity in monkey: Phasic and tonic changes are associated with altered vigilance. Brain Res. Bull. 1994, 35, 607–616. [Google Scholar] [CrossRef]
- Yang, M.; Logothetis, N.K.; Eschenko, O. Phasic activation of the locus coeruleus attenuates the acoustic startle response by increasing cortical arousal. Sci. Rep. 2021, 11, 1409. [Google Scholar] [CrossRef] [PubMed]
- Ichtchenko, K.; Bittner, M.A.; Krasnoperov, V.; Little, A.R.; Chepurny, O.; Holz, R.W.; Petrenko, A.G. A novel ubiquitously expressed α-latrotoxin receptor is a member of the CIRL family of G-protein-coupled receptors. J. Biol. Chem. 1999, 274, 5491–5498. [Google Scholar] [CrossRef] [PubMed]
- Sugita, S.; Ichtchenko, K.; Khvotchev, M.; Südhof, T.C. α-Latrotoxin receptor CIRL/latrophilin 1 (CL1) defines an unusual family of ubiquitous G-protein-linked receptors: G-protein coupling not required for triggering exocytosis. J. Biol. Chem. 1998, 273, 32715–32724. [Google Scholar] [CrossRef] [PubMed]
- Martinez, A.F.; Muenke, M.; Arcos-Burgos, M. From the black widow spider to human behavior: Latrophilins, a relatively unknown class of G protein-coupled receptors, are implicated in psychiatric disorders. Am. J. Med. Genet. Part B Neuropsychiatr. Genet. 2010, 156, 1–10. [Google Scholar] [CrossRef]
- Moreno-Salinas, A.L.; Avila-Zozaya, M.; Ugalde-Silva, P.; Hernández-Guzmán, D.A.; Missirlis, F.; Boucard, A.A. Latrophilins: A neuro-centric view of an evolutionary conserved adhesion G protein-coupled receptor subfamily. Front. Neurosci. 2019, 13, 465743. [Google Scholar] [CrossRef]
- Sando, R.; Jiang, X.; Südhof, T.C. Latrophilin GPCRs direct synapse specificity by coincident binding of FLRTs and teneurins. Science 2019, 363, eaav7969. [Google Scholar] [CrossRef]
- Regan, S.L.; Cryan, M.T.; Williams, M.T.; Vorhees, C.V.; Ross, A.E. Enhanced transient striatal dopamine release and reuptake in Lphn3 knockout rats. ACS Chem. Neurosci. 2020, 11, 1171–1177. [Google Scholar] [CrossRef]
- Sable, H.J.; Paige, N.B.; Nalan, P.A.; Pace, R.L.; Hicks, C.B.; Regan, S.L.; Williams, M.T.; Vorhees, C.V.; Lester, D.B. Phasic dopamine release in two different rat models of attention-deficit/hyperactivity disorder: Spontaneously hypertensive rats (SHR) versus Lphn3 knockout rats. Neuroscience 2025, 567, 150–162. [Google Scholar] [CrossRef]
- Tachibana, M.; Yamamichi, I.; Nakae, S.; Hirasugi, Y.M.; Mizukoshi, O. The site of involvement of hypertension within the cochlea: A comparative study of normotensive and spontaneously hypertensive rats. Acta Oto-Laryngol. 1984, 97, 257–265. [Google Scholar] [CrossRef]
- Sui, L.; Shusheng, G.; Yanzhen, Y.; Qingsong, Y. Effect of hypertension on hearing function, LDH and ChE of the cochlea in older rats. Curr. Med. Sci. 2003, 23, 306–309. [Google Scholar] [CrossRef]
- Brace, L.R.; Kraev, I.; Rostron, C.L.; Stewart, M.G.; Overton, P.G.; Dommett, E.J. Auditory responses in a rodent model of attention deficit hyperactivity disorder. Brain Res. 2015, 1629, 10–25. [Google Scholar] [CrossRef] [PubMed]
- Simpson, G.V.; Knight, R.T. Multiple brain systems generating the rat auditory evoked potential. II. Dissociation of auditory cortex and non-lemniscal generator systems. Brain Res. 1993, 602, 251–262. [Google Scholar] [CrossRef]
- Russell, W.M.; Burch, R.L. The Principles of Humane Experimental Technique; Universities Federation for Animal Welfare: St Albans, UK, 1959. [Google Scholar]
- ThiNational Institute for Health and Care Excellence. Attention Deficit Hyperactivity Disorder: Diagnosis and Management. 13 September 2019. Available online: https://www.nice.org.uk/guidance/ng87 (accessed on 23 May 2025).
- Madras, B.K.; Miller, G.M.; Fischman, A.J. The dopamine transporter and attention deficit/hyperactivity disorder. Biol. Psychiatry 2005, 57, 1397–1409. [Google Scholar] [CrossRef] [PubMed]
- Leffa, D.T.; Panzenhagen, A.C.; Salvi, A.A.; Bau, C.H.; Pires, G.N.; Torres, I.L.; Rohde, L.A.; Rovaris, D.L.; Grevet, E.H. Systematic review and meta-analysis of the behavioral effects of methylphenidate in the spontaneously hypertensive rat model of attention-deficit/hyperactivity disorder. Neurosci. Biobehav. Rev. 2019, 100, 166–179. [Google Scholar] [CrossRef]
- Dommett, E.J. Using the five-choice serial reaction time task to examine the effects of atomoxetine and methylphenidate in the male spontaneously hypertensive rat. Pharmacol. Biochem. Behav. 2014, 124, 196–203. [Google Scholar] [CrossRef]
- Turner, M.; Wilding, E.; Cassidy, E.; Dommett, E.J. Effects of atomoxetine on locomotor activity and impulsivity in the spontaneously hypertensive rat. Behav. Brain Res. 2013, 243, 28–37. [Google Scholar] [CrossRef]


Disclaimer/Publisher’s Note: The statements, opinions and data contained in all publications are solely those of the individual author(s) and contributor(s) and not of MDPI and/or the editor(s). MDPI and/or the editor(s) disclaim responsibility for any injury to people or property resulting from any ideas, methods, instructions or products referred to in the content. |
© 2025 by the authors. Licensee MDPI, Basel, Switzerland. This article is an open access article distributed under the terms and conditions of the Creative Commons Attribution (CC BY) license (https://creativecommons.org/licenses/by/4.0/).
Share and Cite
Brewer, L.M.; Patel, J.; Andrasik, F.; Sable, J.J.; Williams, M.T.; Vorhees, C.V.; Sable, H.J.K. Auditory Event-Related Potentials in Two Rat Models of Attention-Deficit Hyperactivity Disorder: Evidence of Automatic Attention Deficits in Spontaneously Hypertensive Rats but Not in Latrophilin-3 Knockout Rats. Genes 2025, 16, 672. https://doi.org/10.3390/genes16060672
Brewer LM, Patel J, Andrasik F, Sable JJ, Williams MT, Vorhees CV, Sable HJK. Auditory Event-Related Potentials in Two Rat Models of Attention-Deficit Hyperactivity Disorder: Evidence of Automatic Attention Deficits in Spontaneously Hypertensive Rats but Not in Latrophilin-3 Knockout Rats. Genes. 2025; 16(6):672. https://doi.org/10.3390/genes16060672
Chicago/Turabian StyleBrewer, Logan M., Jankiben Patel, Frank Andrasik, Jeffrey J. Sable, Michael T. Williams, Charles V. Vorhees, and Helen J. K. Sable. 2025. "Auditory Event-Related Potentials in Two Rat Models of Attention-Deficit Hyperactivity Disorder: Evidence of Automatic Attention Deficits in Spontaneously Hypertensive Rats but Not in Latrophilin-3 Knockout Rats" Genes 16, no. 6: 672. https://doi.org/10.3390/genes16060672
APA StyleBrewer, L. M., Patel, J., Andrasik, F., Sable, J. J., Williams, M. T., Vorhees, C. V., & Sable, H. J. K. (2025). Auditory Event-Related Potentials in Two Rat Models of Attention-Deficit Hyperactivity Disorder: Evidence of Automatic Attention Deficits in Spontaneously Hypertensive Rats but Not in Latrophilin-3 Knockout Rats. Genes, 16(6), 672. https://doi.org/10.3390/genes16060672