Article

Genetic Diversity and Metabolic Profile of Tibetan Medicinal Plant Saussurea obvallata

1
Key Laboratory of Biodiversity and Environment on the Qinghai-Tibetan Plateau, Ministry of Education, Lhasa 850000, China
2
School of Ecology and Environment, Xizang University, Lhasa 850000, China
*
Author to whom correspondence should be addressed.
Genes 2025, 16(5), 593; https://doi.org/10.3390/genes16050593
Submission received: 2 April 2025 / Revised: 14 May 2025 / Accepted: 15 May 2025 / Published: 17 May 2025
(This article belongs to the Section Plant Genetics and Genomics)

Abstract

:
Background/Objectives: Saussurea obvallata (DC.) Edgew., Asteraceae, is a traditional medicinal herbnative to the Qinghai–Tibet Plateau (QTP). Pharmacological investigationshave validated its pharmacological effects in anti-tumor, anti-inflammatory, heat-clearing, detoxifying, and analgesia. S. obv is presently facing habitat fragmentation and population decline. Therefore, we analyzed its genetic and chemical diversity to provide a scientific basis for the conservation and sustainable use of S. obv. Methods: Seven populations of S. obv were sampled from Xizang, China. The genetic diversity was analyzed using inter-simple sequence repeat (ISSR) markers, and metabolites were identified by ultra-high-performance liquid chromatography-tandem-quadrupole-time-of-flight mass spectrometry (UPLC-Q-TOF-MS/MS). Correlation analysis among genetic diversity, differential metabolites, and climatic factors were performed by R. Results: The genetic diversity among and within populations were both lowly and significantly correlated with geographical distance, showing a decreasing trend from east to west of the QTP. A total of 110 compounds were identified, including flavonoids, phenylpropanoids, lipids, fatty acids, terpenoids, alkaloids, etc. The metabolite contents among populations varied greatly and were related to environmental factors, mainly annual mean temperature and temperature fluctuation. The genetic diversity had little effect on the metabolic differences. Conclusions: These findings provided valuable baseline information for the conservation and pharmacological utilization of S. obv. Meanwhile, further research is necessary for the efficacy evaluation of anti-inflammatory, anti-tumor, radiation protection, and scar removal both in vitro and in vivo.

1. Introduction

Saussurea DC. is one of the largest genera in the Asteraceae family, with more than 500 species found in the northern hemisphere [1]. S. obvallata (DC.) Edgew., a perennial hermaphrodite herb of the Asteraceae family, is endemic to the Qinghai–Tibet Plateau (QTP), thriving at altitudes between 3200 and 4700 masl. S. obv is commonly found in alpine screes, alpine meadows, rocky slopes, shrubs, and near streams [2,3]. The stones and shrubs can shield S. obv from strong wind, allowing it to achieve an average height of 50–80 cm. 
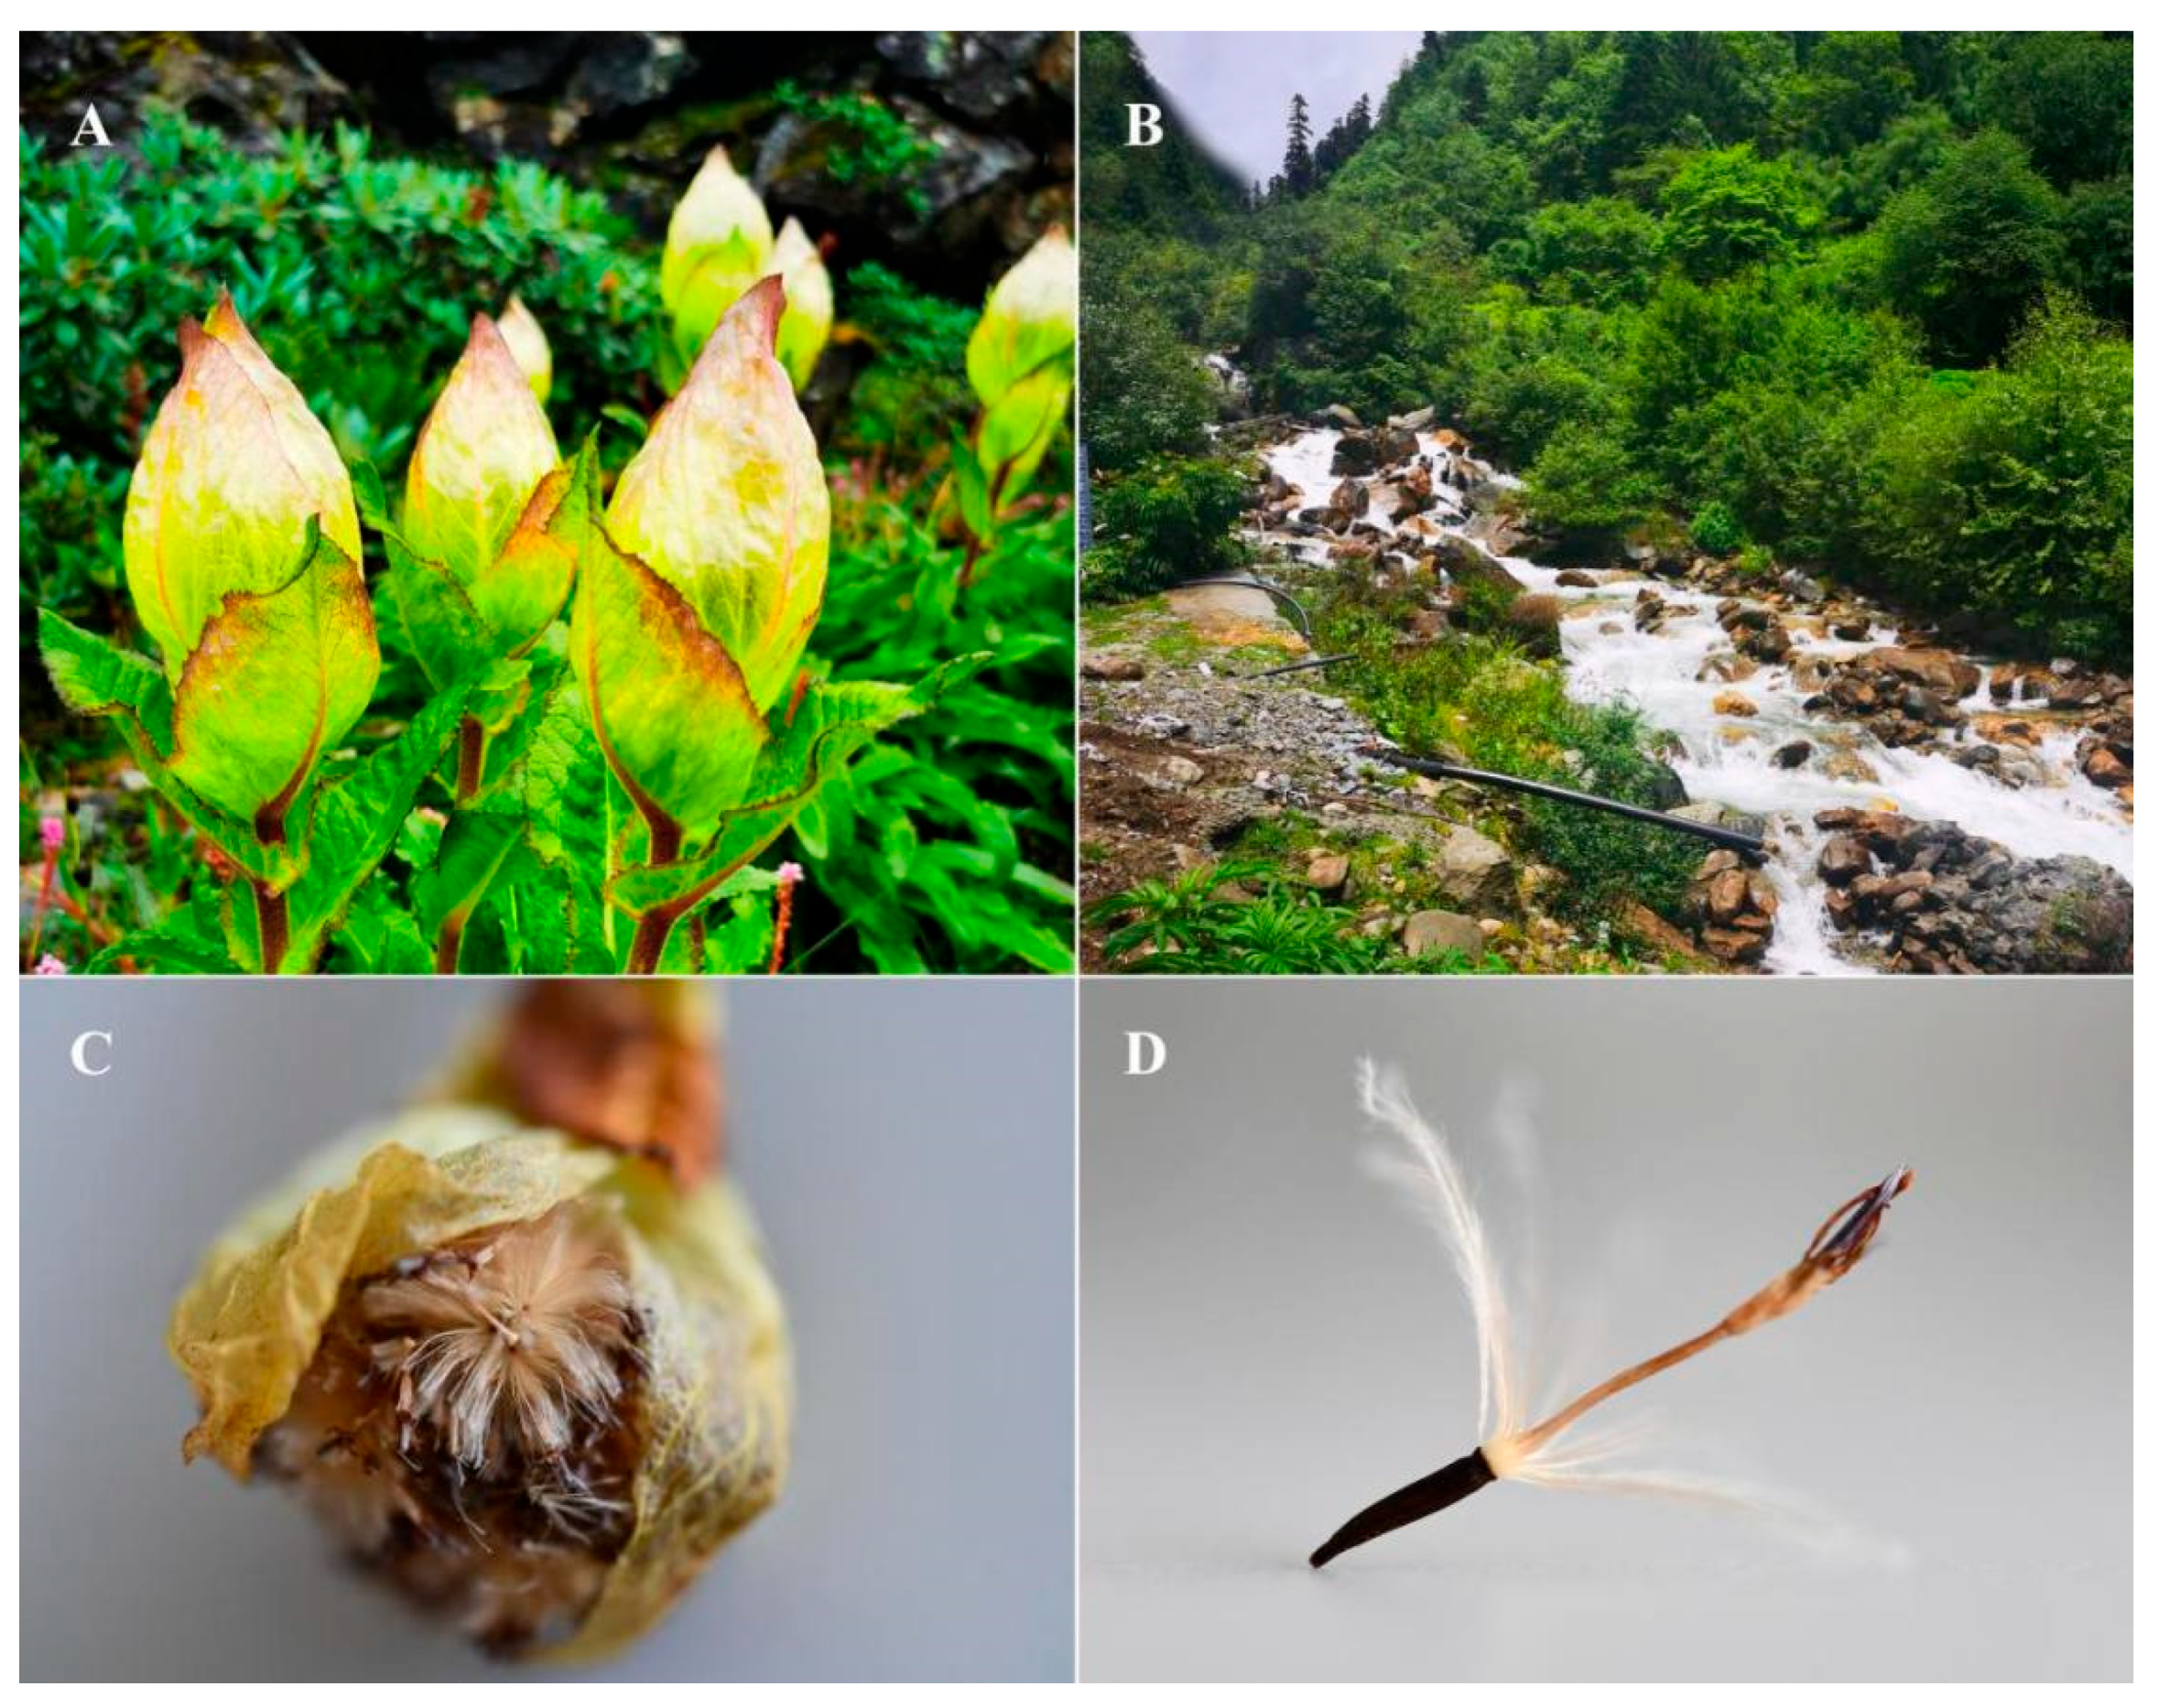
S. obv blooms from July to September. It is a typical “greenhouse plant”. The light-yellow bracts envelop flowers, thus protecting them from UV light and retaining heat at night (Figure 1A), attracting insects for cross-pollination. By September and October, the fruits will gradually mature, and the bracts will open (Figure 1C). The fruits with pappi (Figure 1D) are dispersed by wind and grow in suitable habitats [4]. During winter, the above-ground parts wither, and the roots will regenerate in the following spring [5].
Over the past years, global climate change and human alterations have causedhabitat fragmentation and a dramatic decline in distribution. In 2009, the Science and Technology Department of Xizang Autonomous Region classified it as a Class III endangered medicinal plant [6]. In 2017, Fei et al. investigated the medicinal plant resources of Sejira Mountain, and S. obv was suggested as a Class II endangered species [7]. In India, because of its wide application in medicine, decoration, and social economy [8], coupled with the weak ecological awareness of residents and tourists, S. obv is facing over-harvesting and, therefore, has been listed as an endangered species and one of the highest priorities for conservation programs by the Conservation Assessment Management Plan (CAMP) and Convention of International Trade in Endangered Species of Wild Fauna and Flora (CITES).
More than 40 S. species have been used as traditional medicinal plants in China [9,10,11], and their phytochemicals and pharmacological activities havealso been investigated for many years [12,13]. The main compounds identified from S. species are terpenoids, flavonoids, lignans phenylpropanoids, and polysaccharides, and they were mainly used for anti-tumor, antibacterial, anti-inflammatory, and anti-ulcer properties. S. medusa, containing neoechinulin A, arctigenin, epigenin, and luteolin, has been used to protect patients from inflammation, ultraviolet radiation, cold, hypoxia, and skin photo-aging [14,15,16]. S. costus is an endangered species, traditionally used for a variety of diseases, showing potent effects on carminative, expectorant, anti-arthritic, and antiseptic [17]. S. involucrata, mainly distributed in Xinjiang, China, was found to have neuroprotection effect, ischemia/reperfusion injury protection, adipogenesis suppression, anti-tumor effect, anti-inflammation, cardio-protective effect, and other pharmaceutical values [18,19].
Due to its antipyretic, antidotal, anti-inflammatory, and analgesic effects, S. obv has been used as a traditional medical plant in China, India, and Pakistan [20,21,22,23,24]. It is recorded in ancient Tibetan medicine books “The Four Medical Tantras”, “Crystal Materia Medica”, “The Stainless Crystal Mirror: A Tibetan Materia Medica”, and so on. Over 130 phytochemicals have been reported in S. obv, including flavonoids, terpenoids, fatty acids, and alkaloids [25,26,27,28,29,30,31,32,33]. These metabolites not only play an important role in plant response to environmental stressbut also are the pharmacological basis of medicinal plants.
Metabolomics studies all metabolites in the biological body. Compared with genomics and proteomics, it reflects the immediate biochemical state in the biological body. In addition, metabolomics can provide comprehensive information about the types and contents of various metabolites and quickly obtain the changes of metabolites and their change rules in different environments, different growth periods, different parts, or under certain specific stimuli [34,35]. Metabolomics technology has been widely used because of its relatively low price and labor-saving [36].
The primary metabolites of plants, such as proteins, lipids, and polysaccharides, are essential substances to maintain basic life activities. Secondary metabolites, including flavonoids, terpenes, alkaloids, coumarins, and other small-molecule compounds, not only play a key role in plant stress responses, such as UV protection, antibacterial, and resistance to pests and diseases, but also have important value for human health [37].
UPLC-Q-TOF-MS/MS is a liquid chromatography-mass spectrometry combined technology, which has high sensitivity, good separation effect, fast detection speed, and relatively accurate mass charge ratio for detected ions.Therefore, it is widely used in natural product analysis and metabolomics research [38,39].
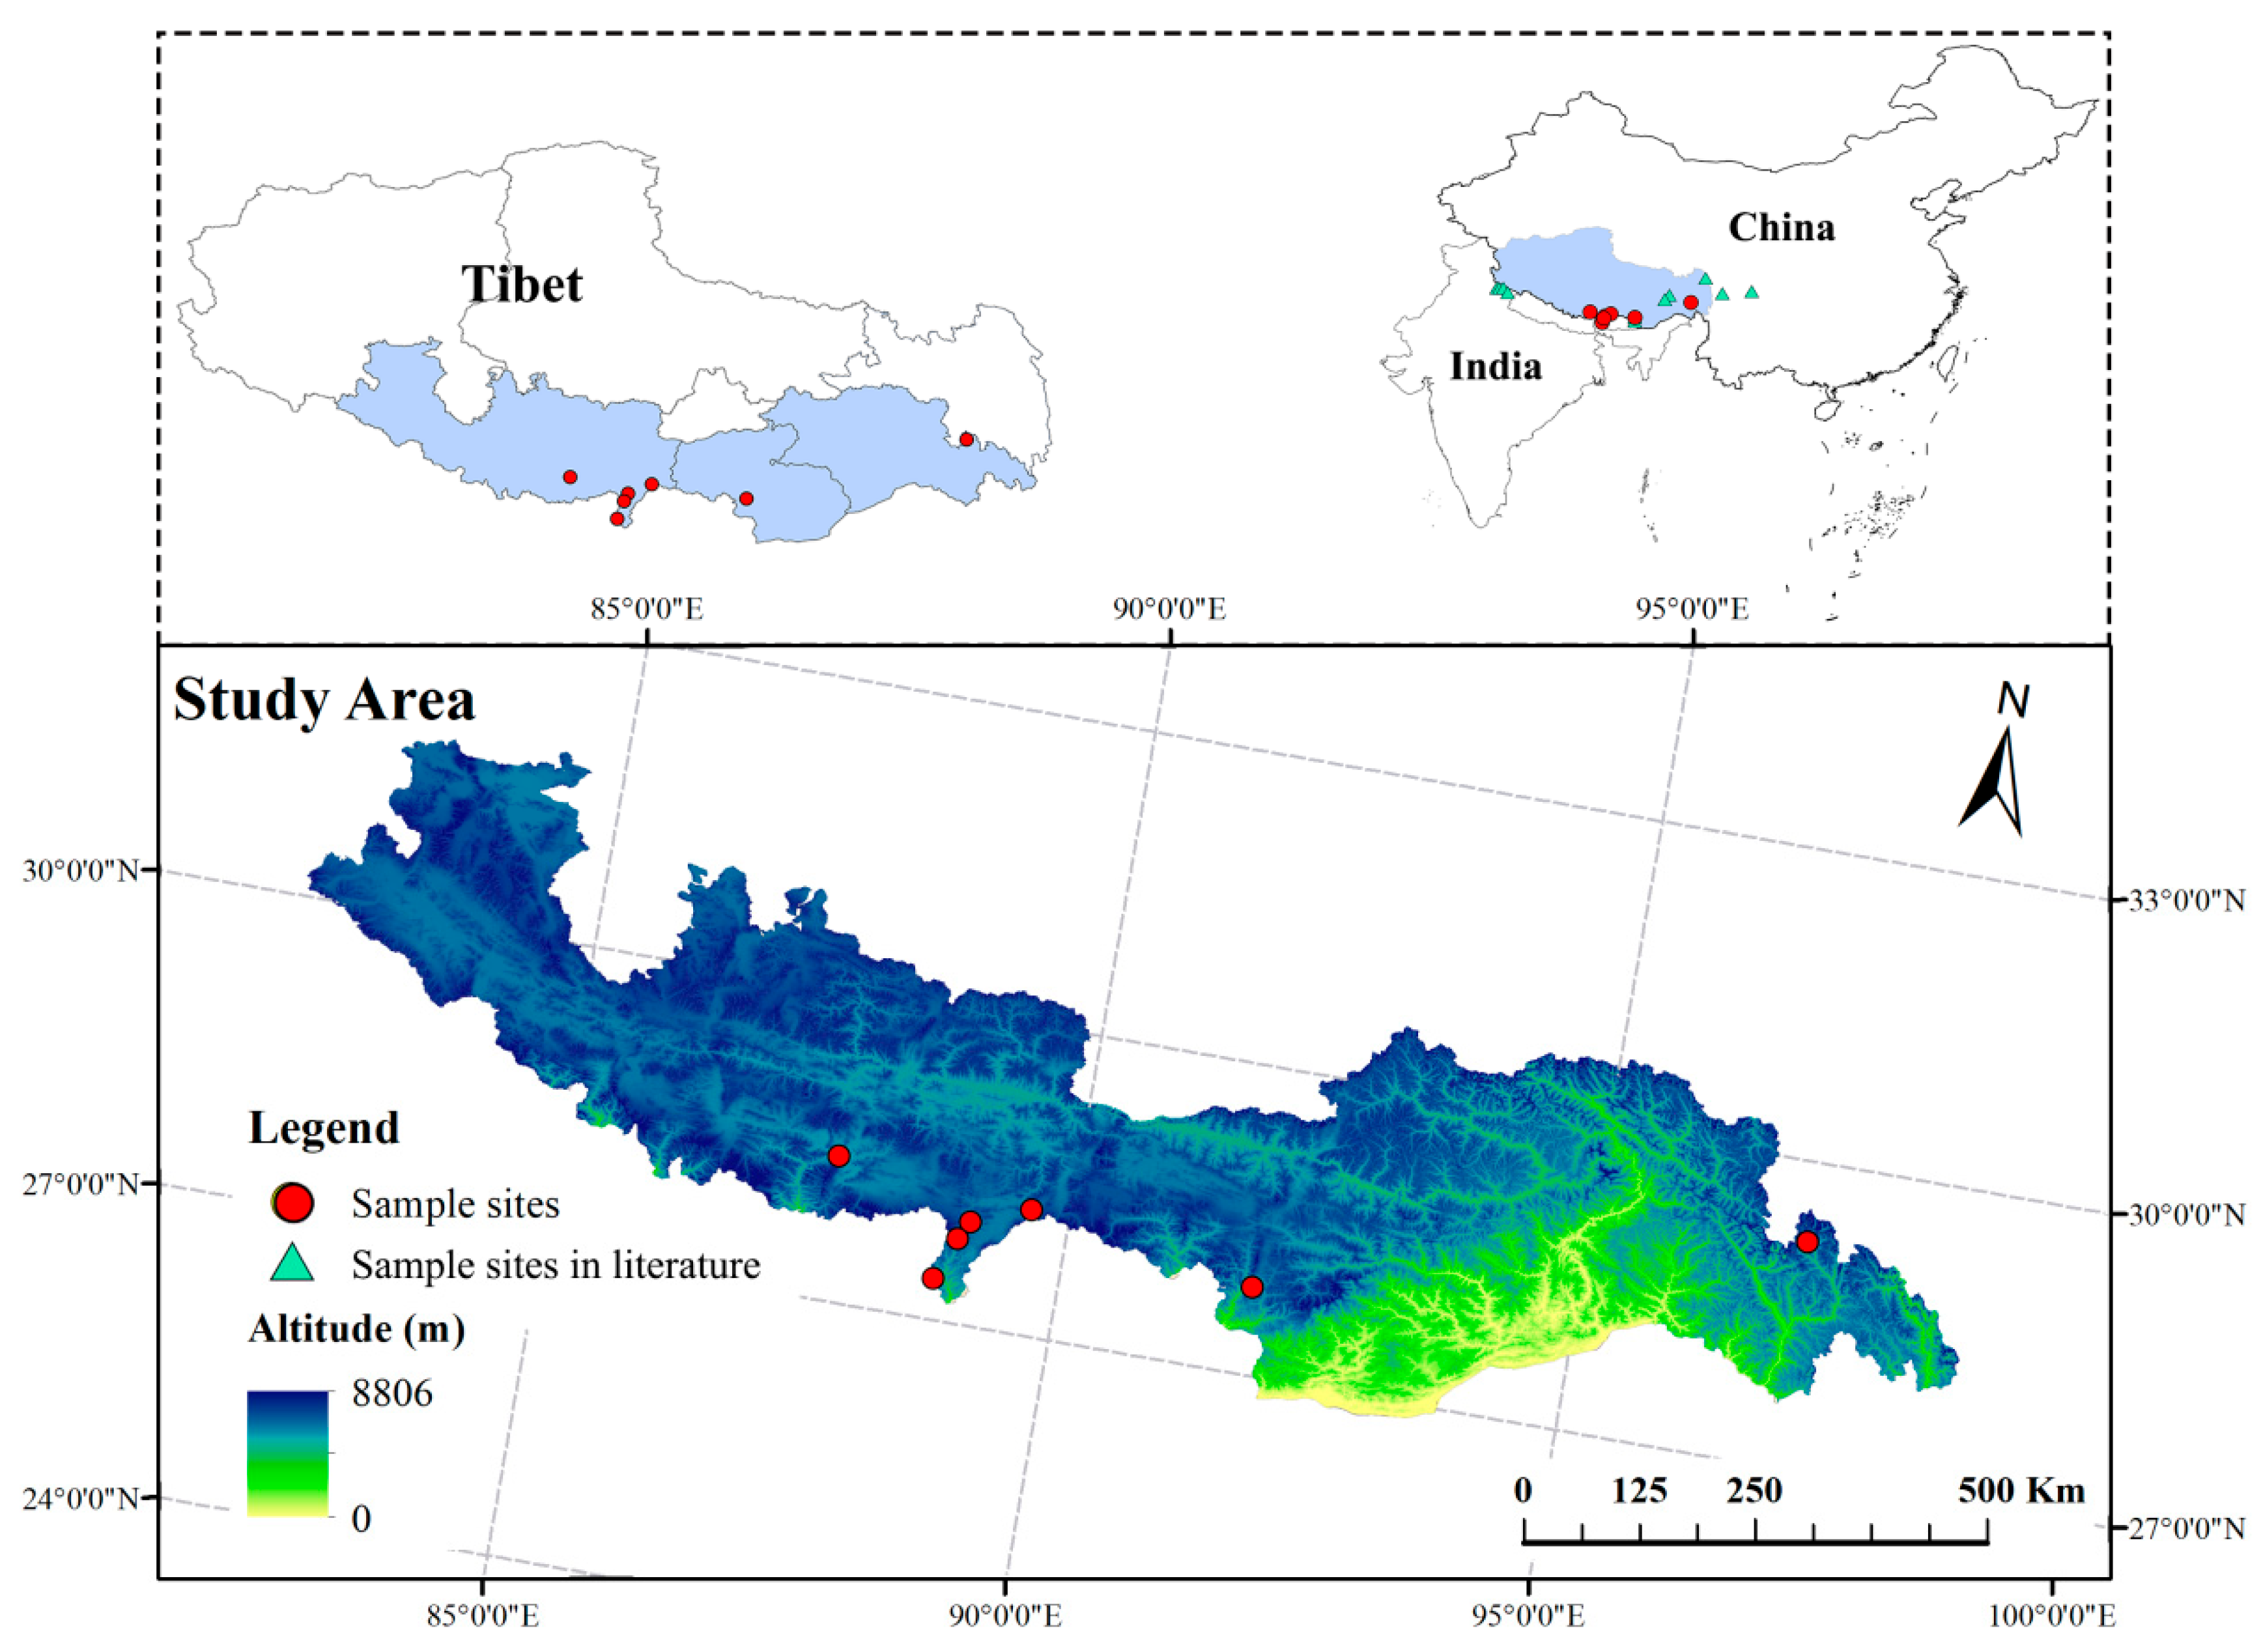
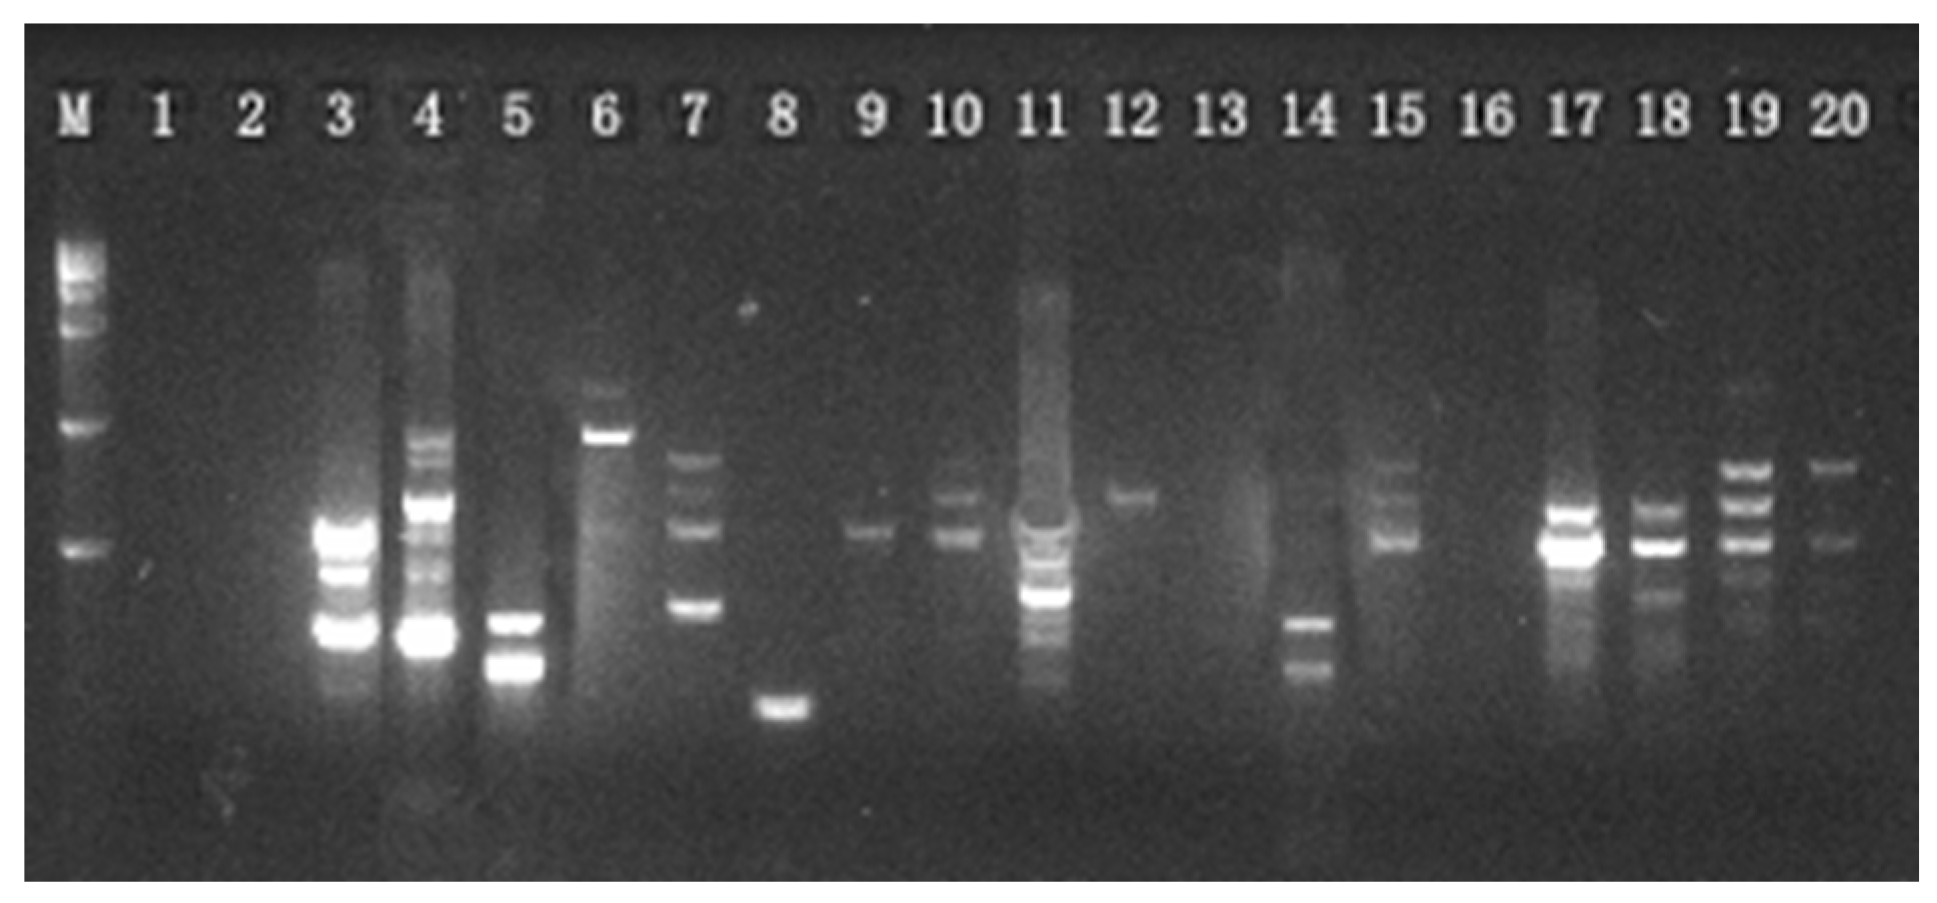
In this study, the ISSR marker was used to assesspopulation genetic variation, and UPLC-Q-TOF-MS/MS was used to determinethe metabolism. Analyzing the genetic diversity and differential metabolites of different populationsprovidesbaseline data for the conservation, development, and utilization of S. obv.

2. Materials and Methods

2.1. Population Sampling and Specimen

Seven genetically distinctpopulations of S. obv were sampled across the Xizang Autonomous Region from July–August 2022, maintaining minimum interpopulation distances >50 km andintrapopulation sampling intervals > 20 m to minimize kinship bias, as illustrated in Figure 2. Figure 2 also indicatesthe locations of S. obv sampling sites reported in the previous literature [40,41,42,43]. Detailed geographical characteristics were described in Table 1. Compared with Lhasa, the habitats of S. obv are much more humid. There are streams flowing near the habitats. The communities of all seven sapling sites are similar, mainly composed of Rhododendron spp., Rhodiola rosea, Dasiphorafruticosa, MeconopsisVig., Bistorta macrophylla, and other plants.
For genetic diversity analyses, 20 tender leaf samplesper population underwentsilica gel-mediated rapid desiccation. Concurrently, six phenotypically representative aerial modules (stems, leaves, inflorescence) per site were collected for metabolomic studies andshade-dried. At each site, a complete individual plant was collected and preserved as a voucher specimen. The corresponding specimen numbers are listed in Table 1. All specimens are deposited in the School of Ecology and Environment, Xizang University, Lasa, Xizang Autonomous Region, China.

2.2. Climatic Data

Climatic data were obtained from National Tibetan Plateau Data Center/Third Pole Environment Data Center [44] and National Earth System Science Data Center [45].

2.3. DNA Extraction and PCR Amplification

Cryogrinding of dried leaf tissues was performed using Sample Preparation System (FastPrep-24TM, MP Biomedicals, Santa Ana, CA, USA), and total genomic DNA was extracted using Plant Genomic DNA Extraction Kit (D1500, Solarbio, Beijing, China). A hundred universal ISSR primers published by the University of British Columbia (Table S1) were synthesized by Sangon Biotech Co., Ltd. (Shanghai, China). All primers were screened, and those with high polymorphism were selected for genetic diversity analysis.
The polymerase chain reaction (PCR) was conducted on all 140 samples in thermal cyclers (T100TM, BIO-RAD, Hercules, CA, USA), in a total volume of 25 μL containing 1 μL of DNA template, 2 μL of primer, 9.5 μL of ddH2O, and 12.5 μL of Taq PCR Mastermix (PC1150, Solarbio, Beijing, China). The PCR amplification procedures were set as Table S2.
All PCR products were checked using 2% agarose gel containing 0.1% nucleic acid dye (G5560, Solarbio, Beijing, China), and photos were taken under UV light (ChemiDoc XRS System, BIO-RAD, Hercules, CA, USA).

2.4. Data Analysis

Boolean matrix was used to analyze genetic diversity. According to the migration of PCR products, each band was considered as a DNA marker and scored across all samples. The present and clear bands were recorded as 1, and the absent or faint bands were recorded as 0. The percentage of polymorphic bands (PPL), number of observed alleles (Na), number of effective alleles (Ne), Nei’s gene diversity (H), and Shannon’s information index (I) were calculated using POPGENE32 v1.32 programme. Analysis of molecular variance (AMOVA) and Mantel test were calculated using GenAlEx 6.503 programme. The correlation analysis between genetic diversity and climatic factors was performed with R4.3.3programme [46].

2.5. Preparation of Extract

The dried aerial parts of S. obv were powdered using a grinder (FSJ-A03D1, Bear, Foshan, China) and sieved. A half a gram of powder was weighed (ME204E, METTLER TOLEDO, Greifensee, Switzerland) and ultrasound-treated separately with 10 mL of 80% ethanol for 30 min (KQ3200E, Supmile, Shanghai, China). The supernatant was filtered with a 0.22 μm filter membrane (JTSF Nylon66, JINTENG, Zhangjiagang, China) and stored at 4 °C. Twenty-five microliters of each sample were mixed as Quality Control (QC) solution.

2.6. Identification of Metabolites

The metabolites of ethanol extracts were identified and analyzed using ultra-high-performance liquid chromatography-tandem quadrupole-time-of-flight mass spectrometry system (UPLC-Q-TOF-MS/MS) (Exion LC, Shimadzu, Kyoto, Japan; X500R, SCIEX, Framingham, MA, USA) and a C18 column (2.1 × 100 mm, 1.7 µm, ACQUITY UPLC® BEH, Waters, Milford, MA, USA). The oven temperature was set at 30 °C; the mobile phase A was acetonitrile, and the mobile phase B was 0.1% formic acid aqueous solution; the flow rate was 0.3 mL/min, and the injection volume was 5 µL. The eluent gradient was set at Table S3. The mass parameters were set as Table S4.

2.7. Analysis of Metabolites

The extraction samples and QC solution were analyzed in accordance with the conditions of 2.6. The data-acquisition and processing software was SCIEX OS v3.3.1.43 software and was delivered with the instrument. According to primary and secondary mass spectrometry information, metabolites were identified using the natural product database of SCIEX OS software and the GNPS natural product database of MS-DIAL v2.64 software. Differential metabolite analysis was performed using the MetaboAnalyst platform (https://www.metaboanalyst.ca, accessed on 18 March 2025), and correlation analyses were conducted using R4.3.3.
Principal Component Analysis (PCA) is an unsupervised analysis method that visualizes complex data through dimensional reduction. Therefore, PCA was used to show the metabolic differences amongthe seven populations of S. obv.
p values of t-test < 0.05, fold change > 2 or <0.5, and PLS-DA VIP > 1 were used as criteria for differential metabolites screening. Foldchange (FC) analysis was used to compare the absolute value of metabolic change between two group means. Partial Least-Squares Discriminant Analysis (PLS-DA) is a supervised dimensional reduction method that incorporates class labels in the analysis. It captures the variance and correlation structure in the data most relevant to group differentiation. Variable Importance in Projection (VIP) is a feature that ranks the metabolites based on their significance in the PLS-DA model’s ability to discriminate between different groups.
Differential metabolites were annotated using the HMDB database (https://hmdb.ca/, accessed on 18 March 2025), KEGG database (https://www.genome.jp/kegg/, accessed on 18 March 2025), and LIPID MAPS database (https://lipidmaps.org/, accessed on 18 March 2025).
KEGG pathway enrichment and topology analysis were conducted on the differential metabolites of all comparable groups of S. obv. The p value indicates the extentof pathway enrichment;the smaller the p value, the greater the difference inenrichment. Pathway Impact refers to the role of metabolites in the pathway, and the greater the pathway impact, the greater the role of metabolites in the pathway. Therefore, the pathway with the larger −log10(p) value and the larger pathway impact would be selected as the significantly enriched pathway.

3. Results

3.1. Primer Screening and PCR Products

A total of 20 primers were selected and further used for the genetic analysis of S. obv. The characteristics of the 20 primers are listed in Table 2. Agarose electrophoresis revealed 185 ISSR loci across 140 samples exhibitingcomplete polymorphism (Rate of Polymorphic Bands = 100%).Representative electropherogram profiles of primer 808 in Population 6 (Figure 3) demonstrate banding patterns.

3.2. Genetic Diversity Analysis of 7 Populations of S. obv

Analyses of genetic diversity within each population of S. obv were reported in Table 3. The highest level of polymorphism was observed in Population 7 (PPL = 90.3%) and the lowest in Population 5 (PPL = 45.6%). The highest number of observed alleles was found in Population 7 (Na = 1.9029) and the lowest in Population 5 (Na = 1.4563). The highest number of effective alleles was found in Population 6 (Ne = 1.4439), and the lowest in Population 5 (Ne = 1.1122). Population 6 showed the maximum Nei’s gene diversity (H = 0.2698) and the maximum Shannon’s information index (I = 0.4145), while Population 5 showed the minimum Nei’s gene diversity (H = 0.0834) and the minimum Shannon’s information index (I = 0.1454). Generally, Populations 6 and 7 showed the highest genetic diversity, and Population 5 showed the lowest genetic diversity.
Among seven populations of S. obv, the number of observed alleles (Na) was 1.8333, and the number of effective alleles (Ne) was 1.5093. Nei’s gene diversity (H = 0.3027) and Shannon’s information index (I = 0.4535) indicated certain genetic variability among populations.
AMOVA showed that the genetic differentiation index (Fst) of seven populations was 0.114 (p < 0.001). The mean inter-population variation was 0.913, accounting for 11% of the total genetic variation in the sample. The mean within-populationvariation was 7.704, accounting for 89% of the total genetic variation, indicating that only 11% of all genetic variation was caused by inter-population differences, further confirming that the genetic differentiation among populations was relatively small, and the level of genetic variation within populations was much larger. The results were shown in Table 4.
The values of seven populations of S. obv ranged from 0.4583 to 0.8167 (Table 5), only one of which was below 0.5, indicating low genetic differentiation among S. obv populations. Mantel test showed that there was a significant correlation between genetic distance and geographical distance (Figure 4).

3.3. Correlation Analysis Between Genetic Diversity and Climatic Factors

The climatic factors of the seven sampling sites were recorded in Table 6. According to the sampling loci information (Table 1), the altitudes are between 4000–4500 m.
The climate of the QTP is relatively stable, and the higher temperature and precipitation mostly appear from June to September, which is also an important period for the growth and propagation of S. obvallata. The average annual temperature of the seven sampling sites was in the range of 0 ± 2 °C. The average annual moisture content was in the range of 4–8‰. The average annual precipitation was in the range of 400–830 mm. The short-wave radiation was in the range of 174.22–236.87 W/m2. The long-wave radiation was in the range of 232.37–283.36 W/m2. Correlation analysis showed that there was no significant correlation between genetic diversity and the above climatic factors (Figure 5).

3.4. Identification of Ethanol Extracts of S. obv

Mass Error < 5%, Difference Isotope Ratio < 5%, and Library Hit Score > 70 were used as criteria for screening, and 110 compounds were identified from the ethanol extracts of S. obv (Table S5), including 25 flavonoids, 15 phenylpropanoids, 12 lipids, 10 fatty acids, 7 terpenoids, 5 alkaloids, and other components. Figure 6 shows the total ion chromatograms in positive and negative ion modes.

3.5. Differential Metabolites Among 7 Populations of S. obv

Metabolites of different populations of S. obv were analyzed by PCA, and the results areshown in Figure 7. All QC samples were gathered together, indicating the reliability of the results. The samples within the population showed good reproducibility, while most inter-population samples demonstrated clear separation in metabolite profiles, except for a minor overlap between Population 2 and Population 6.
p values < 0.05, Fold change > 2 or <0.5, and PLS-DA VIP > 1 were used as criteria for differential metabolites screening. Of all 21 comparable groups, 85 metabolites were significantly different in at least one comparable group (Table S6). Arctiin, curdionolide B, resedine, and querciturone differed significantly in 17 comparable groups; arctigenin, betaine and 8-hydroxycadalene differed significantly in 16 comparable groups; isoalantolactone and dehydrocostus lactone differed significantly in 15 comparable groups. The differential metabolites between all comparable groups are shown in Figure 8. The upregulated differential metabolites ranged from 8 to 23, and the downregulated differential metabolites ranged from 8 to 26. The upregulation of arctiin was the highest (log2FC = 11.559, Population 1 vs. Population 5), and the downregulation of curdionolide B was the highest (log2FC = −12.486, Population 2 vs. Population 5).

3.6. Annotation of Differential Metabolites

All screened differential metabolites were annotated to the HMDB database (Figure 9). The metabolites were divided into nine categories, including phenylpropanoids and polyketides, lipids and lipid-like molecules, organic oxygen compounds, organic acids and derivative, benzenoids, organoheterocyclic compounds, lignans, neolignans and related compounds, organic nitrogen compounds, alkaloids, and derivatives. The largest number of metabolites is flavonoids (14 in total).
All screened differential metabolites were annotated to the KEGG database (Figure 10). The metabolites were divided into nine categories, including polyketides, phenylpropanoids, terpenoids, glycerophospholipids, peptides, fatty acyls, alkaloids, carbohydrates, and nucleic acids. The largest number of metabolites is flavonoids (12 in total).
All screened differential metabolites were annotated to the LIPID MAPS database (Figure 11). The metabolites were divided into three categories, including polyketides, glycerophospholipids, and fatty acyls. The largest number of metabolites is flavonoids (22 in total).

3.7. KEGG Enrichment Analysis of Differential Metabolites

The results of KEGG pathway-enrichment analysis are shown in Figure 12. The comparison groups with too little annotation information to enrich the pathways or those that did not meet the conditions of significantly enriched pathways were eliminated. In the effective comparison groups, flavone and flavonol biosynthesis and phenylpropanoid biosynthesis were the most significantly enriched pathways. These results indicated that the differential metabolites were mainly related to these two pathways (Figure 13).

3.8. Correlation Analysis Between Differential Metabolites and Climatic Factors

A total of 11 differential metabolites associated with the two significantly enriched pathways were screened, including syringin, sinapaldehyde, apigenin, luteolin, cinnamaldehyde, quercetin, quercitrin, isoquercetin, 5-O-caffeoylshikimic acid, chlorogenic acid, and 4-hydroxycoumarin. Correlation analysis (Figure 14) showed that the expression levels of syringin, cinnamaldehyde, quercetin, quercitrin, isoquercetin, 5-O-caffeoylshikimic acid, chlorogenic acid, and 4-hydroxycoumarin were significantly correlated with average annual temperature, apigenin was significantly correlated with average annual rainfall, and syringin, luteolin, 5-O-caffeoylshikimic acid, chlorogenic acid, and 4-hydroxycoumarin were significantly correlated with the annual mean long-wave radiation. There was no significant correlation between the expression levels and genetic diversity.

4. Discussion

Genetic diversity is a critical indicator of a species’ ability to survive, reproduce, and evolve. Species with higher genetic diversity would better adapt to environmental changes [47,48,49,50,51]. Wild species of the QTP are threatened by extreme environments, global warming, and inadequate conservation [52,53]. Moreover, the habitats of S. obv are relatively moist and densely vegetated, which makes it easy to attract herbivores. Understanding the genetic diversity of S. obv is essential for its survival, reproduction, development, and utilization, and it can also play a good role in umbrella protection for other species within the habitats.
Genetic diversity assessments are crucial for designing effective conservation strategies. Nei’s gene diversity (H) among seven populations was 0.3027, and Shannon’s information index (I) was 0.4535. At the population level, these values were lower (H: 0.0834–0.2698; I: 0.1454–0.4145). The genetic differentiation index (Fst) of seven populations was 0.114. Comparatively, studies on S. species using different molecular markers revealed divergent patterns. Hu et al. [54] investigated the genetic diversity of S. involucrata using simple sequence repeat (SSR) molecular markers, revealing high genetic diversity (H = 0.470 and I = 0.837) among 11 populations in Xinjiang, China. Another genetic diversity analysis of S. involucrata using ITS and chloroplast fragments sequences found higher total nucleotide diversity in ITS1-4 region (π = 6.13) than that of cpDNA (π = 1.26), while the total haplotype diversity in the ITS1-4 region (Hd = 0.813) was similar to that of cpDNA (Hd = 0.895) [55]. Twenty S. medusa populations in the Qilian Mountains, China, also showed similar genetic diversity (H = 0.2757 and I = 0.4237) yet strong genetic differentiation (Gst = 0.4926), as sequence-related amplified polymorphism (SRAP) markerswere used [56]. The ISSR marker was used to study the genetic diversity of S. dorogostaiskii, a globally threatened species, and the results show low genetic diversity (H = 0.17, I = 0.25) but high genetic differentiation (Gst = 0.49) [57]. Semwal et al. [40] studied the genetic diversity of five populations of S. obv using an ISSR marker in India, revealing low genetic diversity (H = 0.27 and I = 0.38) due to habitat fragmentation. A broad review [58] comprising 108 entries revealed mean within-population H = 0.214 ± 0.117 and mean Gst = 0.29 ± 0.21. Generally, the genetic diversity and differentiation of S. obv were relatively low.
There was no significant correlation between genetic diversity and environmental factors, but this does not necessarily mean that the growth and reproduction of S. obv are not restricted by the environment. Instead, it may reflect its adaptation to specific microhabitats. The habitats of different populations are similar, with altitudes between 4000–4500 m, the presence of streams, diurnal temperature variation from June to September, and bushes or boulders to withstand strong winds. Therefore, this species may have strict environmental requirements, which further limit distribution. Moreover, genetic diversity is also associated with life history traits (life form, geographical range, breeding system, seed dispersal, and successional status) and sampling strategies [58]. The genetic diversity of S. obv may be shaped by the combined effects of several factors: short-lived perennial life form, endemic to the QTP, mixed breeding system, and seed dispersal by wind. Therefore, further study should incorporate a broader range of sampling sites and life history traits, which would provide valuable insights into the conservation strategies of S. obv.
However, the ISSR marker relies on PCR products to analyze genetic diversity. Thus, it cannot obtain information such as gene mutation, and it is difficult to distinguish different bands with very small base number differences. Therefore, the genetic differentiation between different populations remains to be further explored. Chloroplast genome sequencing has been widely applied in phylogenetic studies of the Asteraceae family. According to GenBank (https://www.ncbi.nlm.nih.gov/, accessed on 18 March 2025), the chloroplast genomes of more than 100 S. species have been sequenced, and several highly variable regions have been identified [59,60]. This provides new insights into investigating the genetic diversity of S. obv.
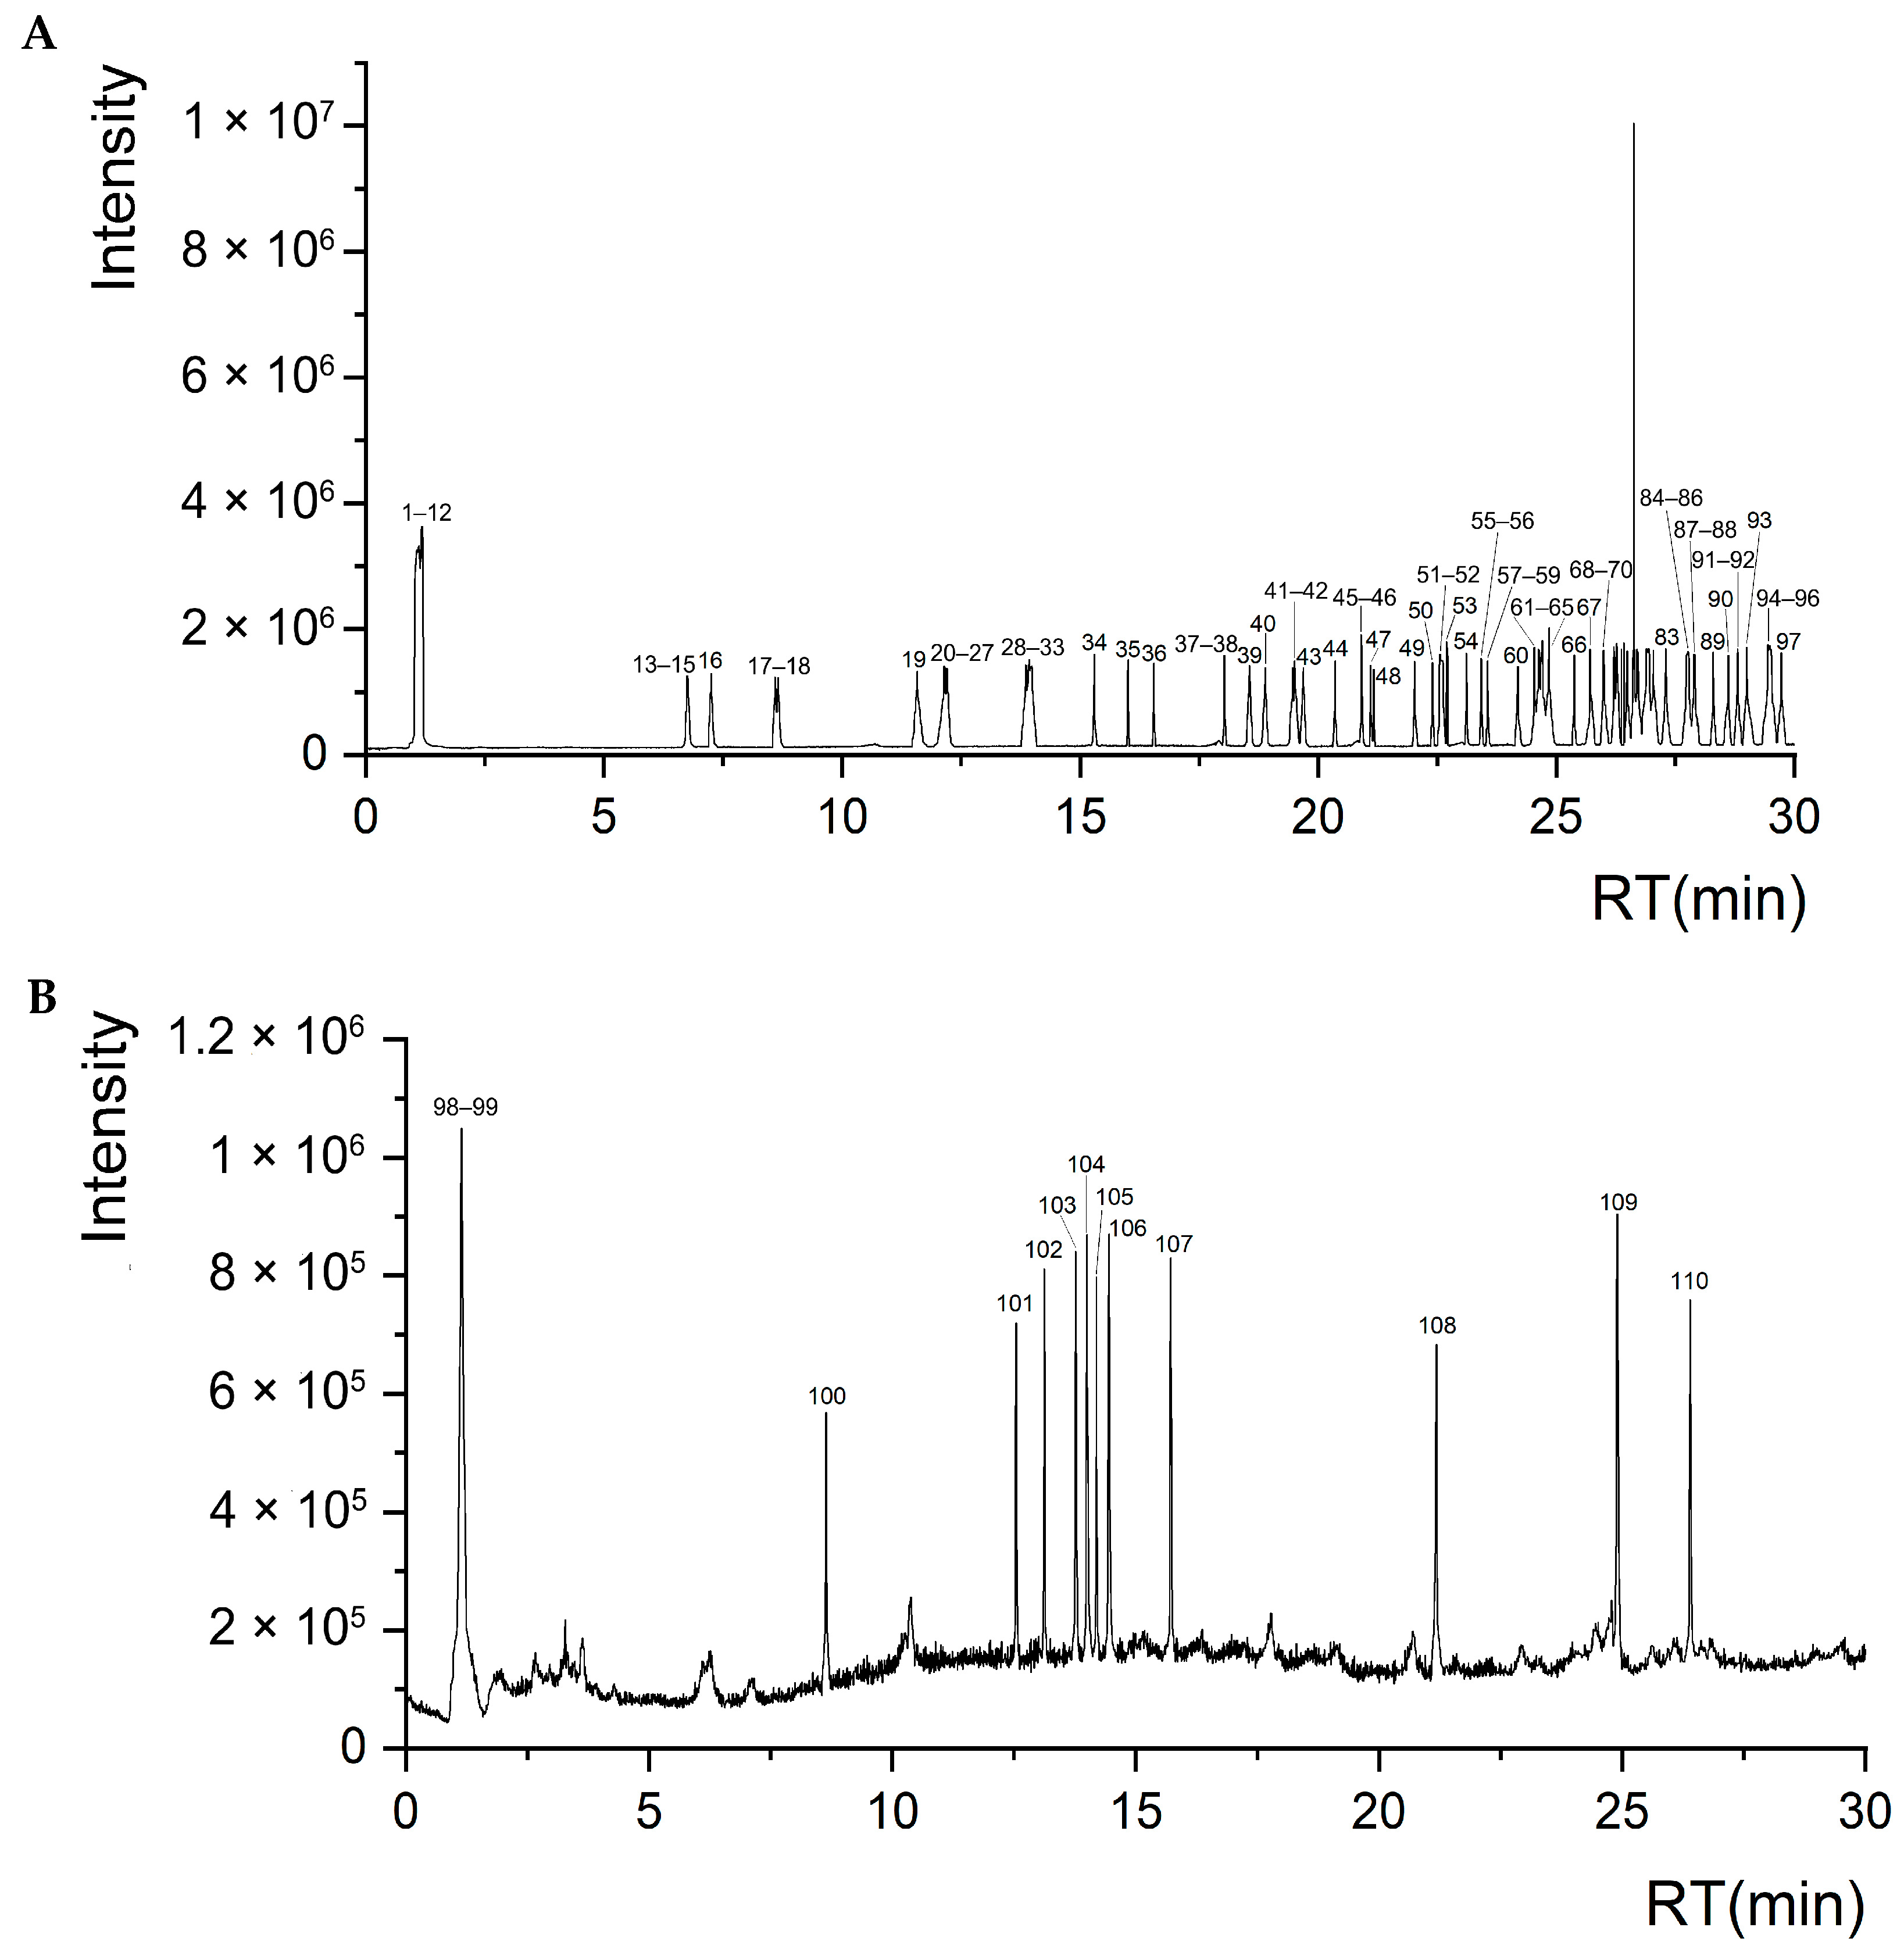
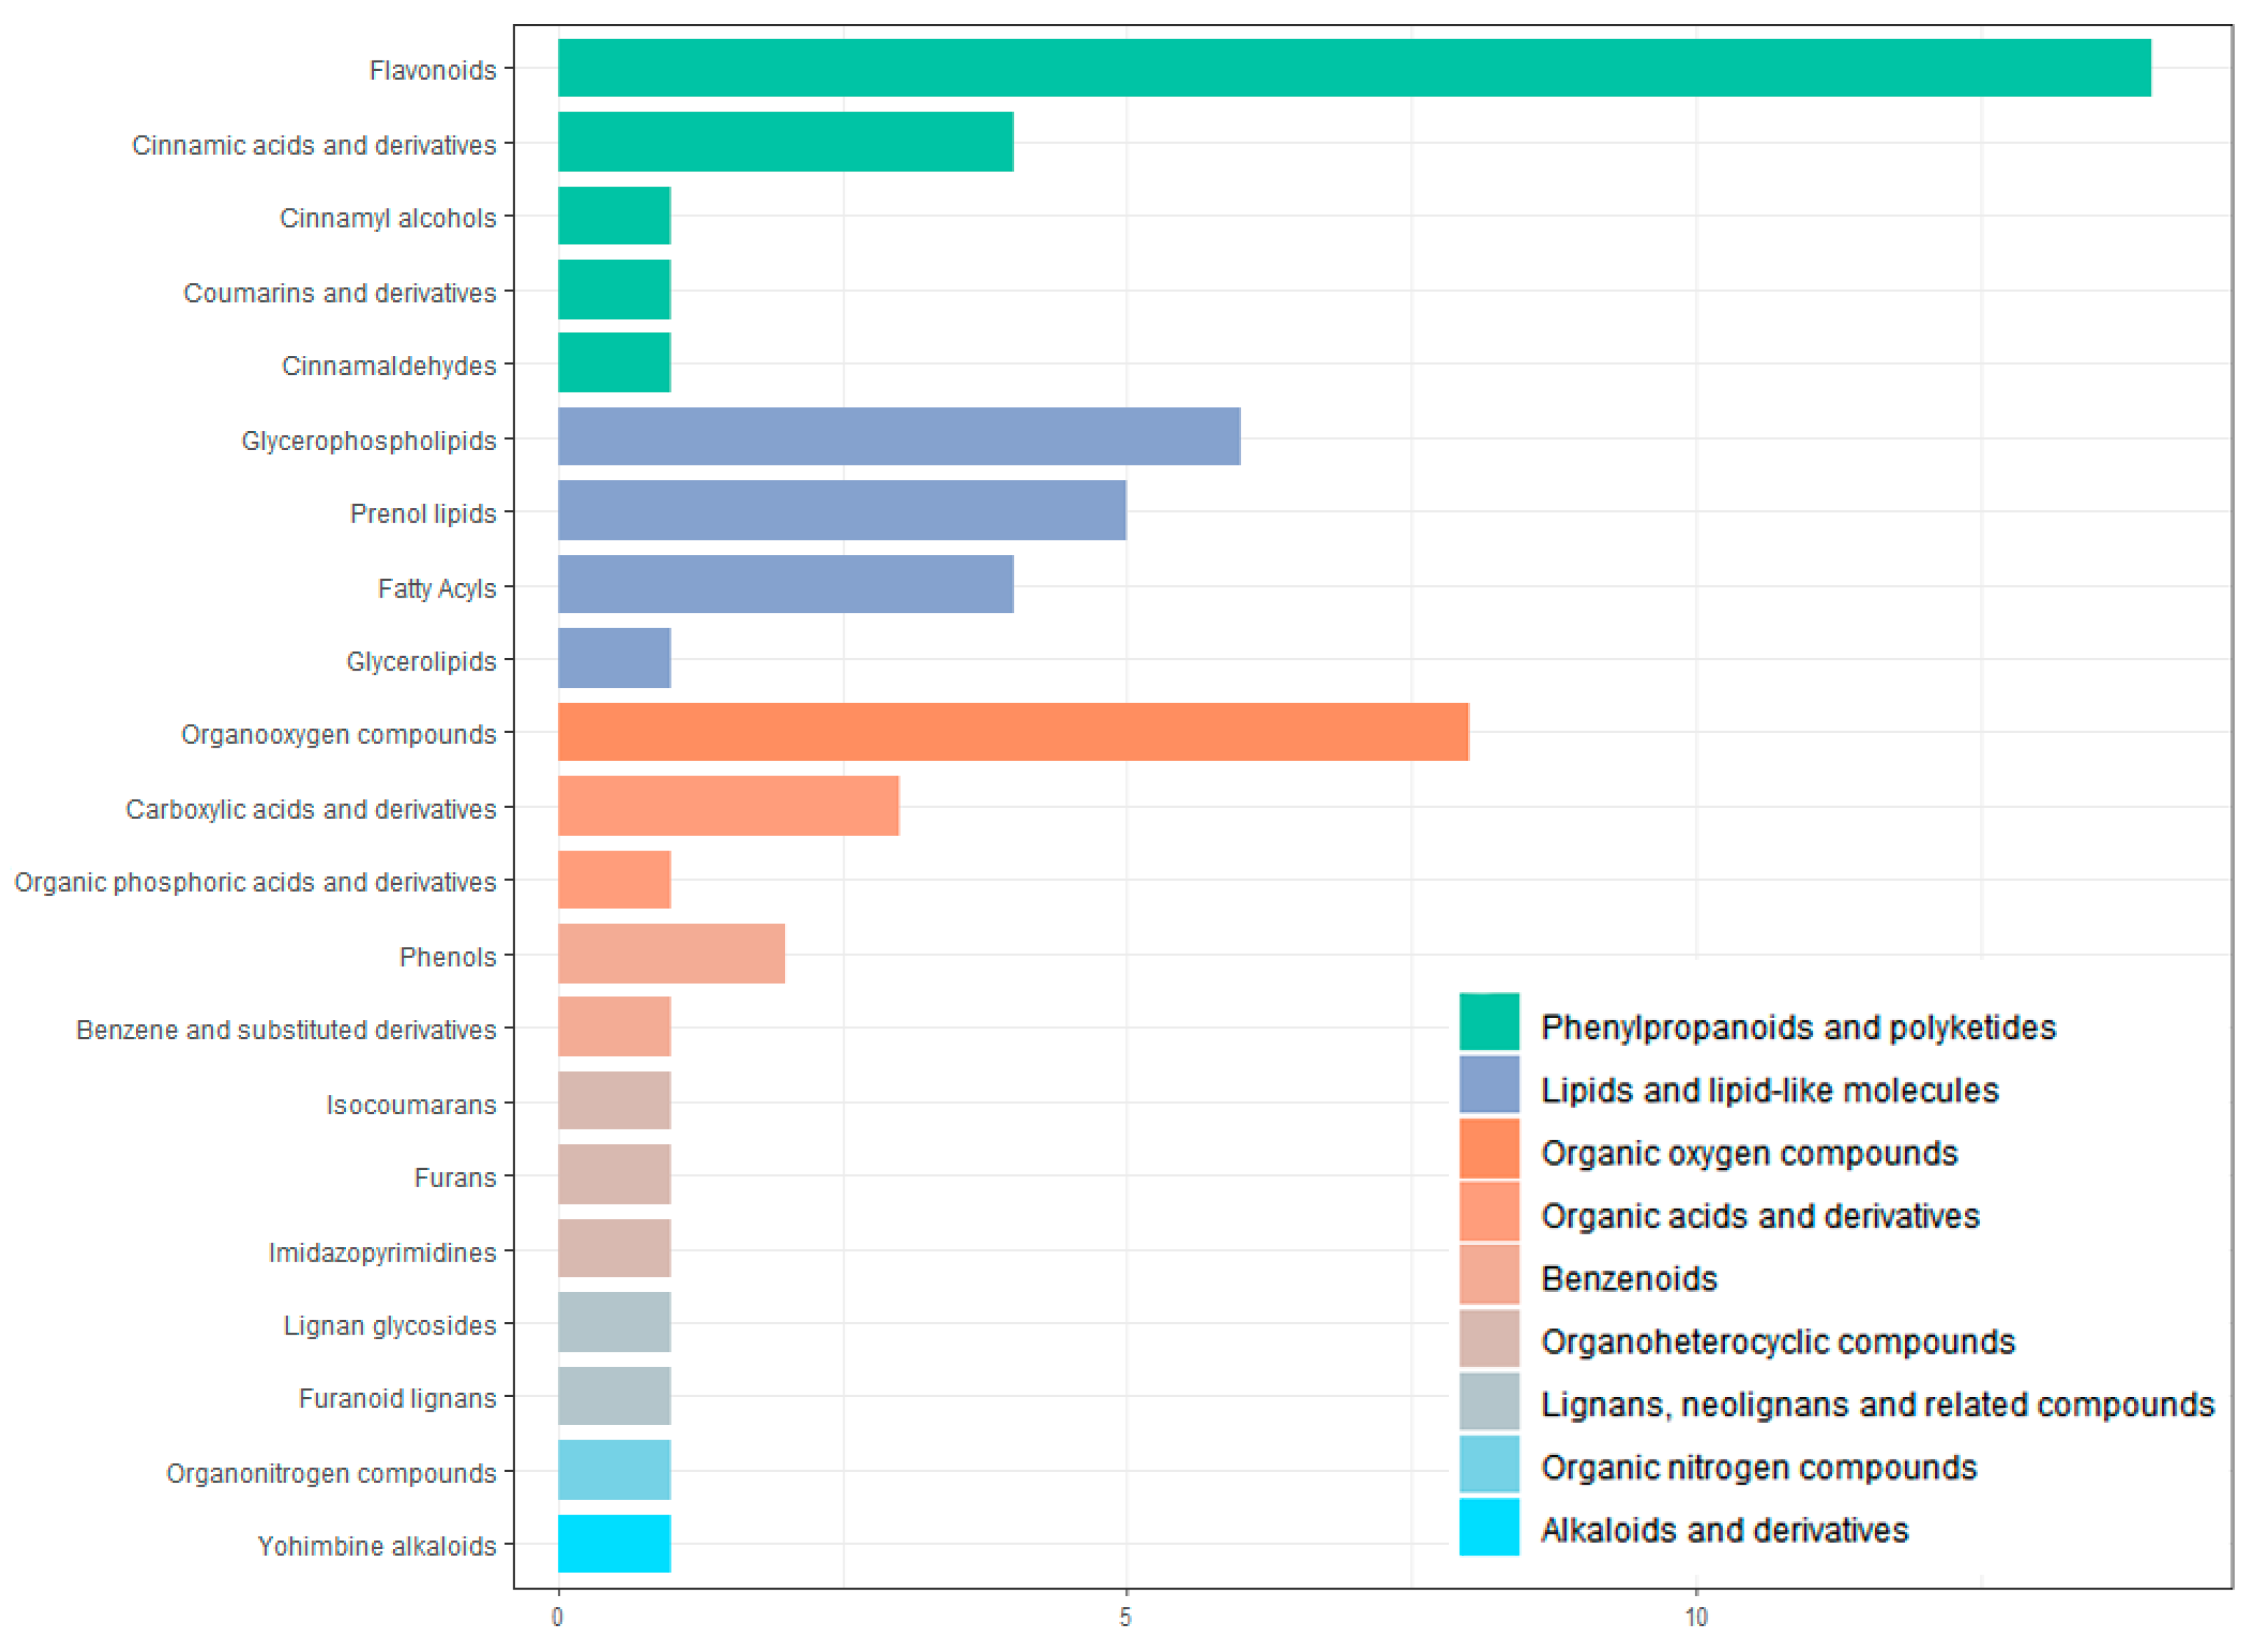
In this study, UPLC-Q-TOF-MS/MS was used, and 110 components were identified from the ethanol extract of S. obv, among which flavonoids and phenylpropanoids were the two most abundant categories.
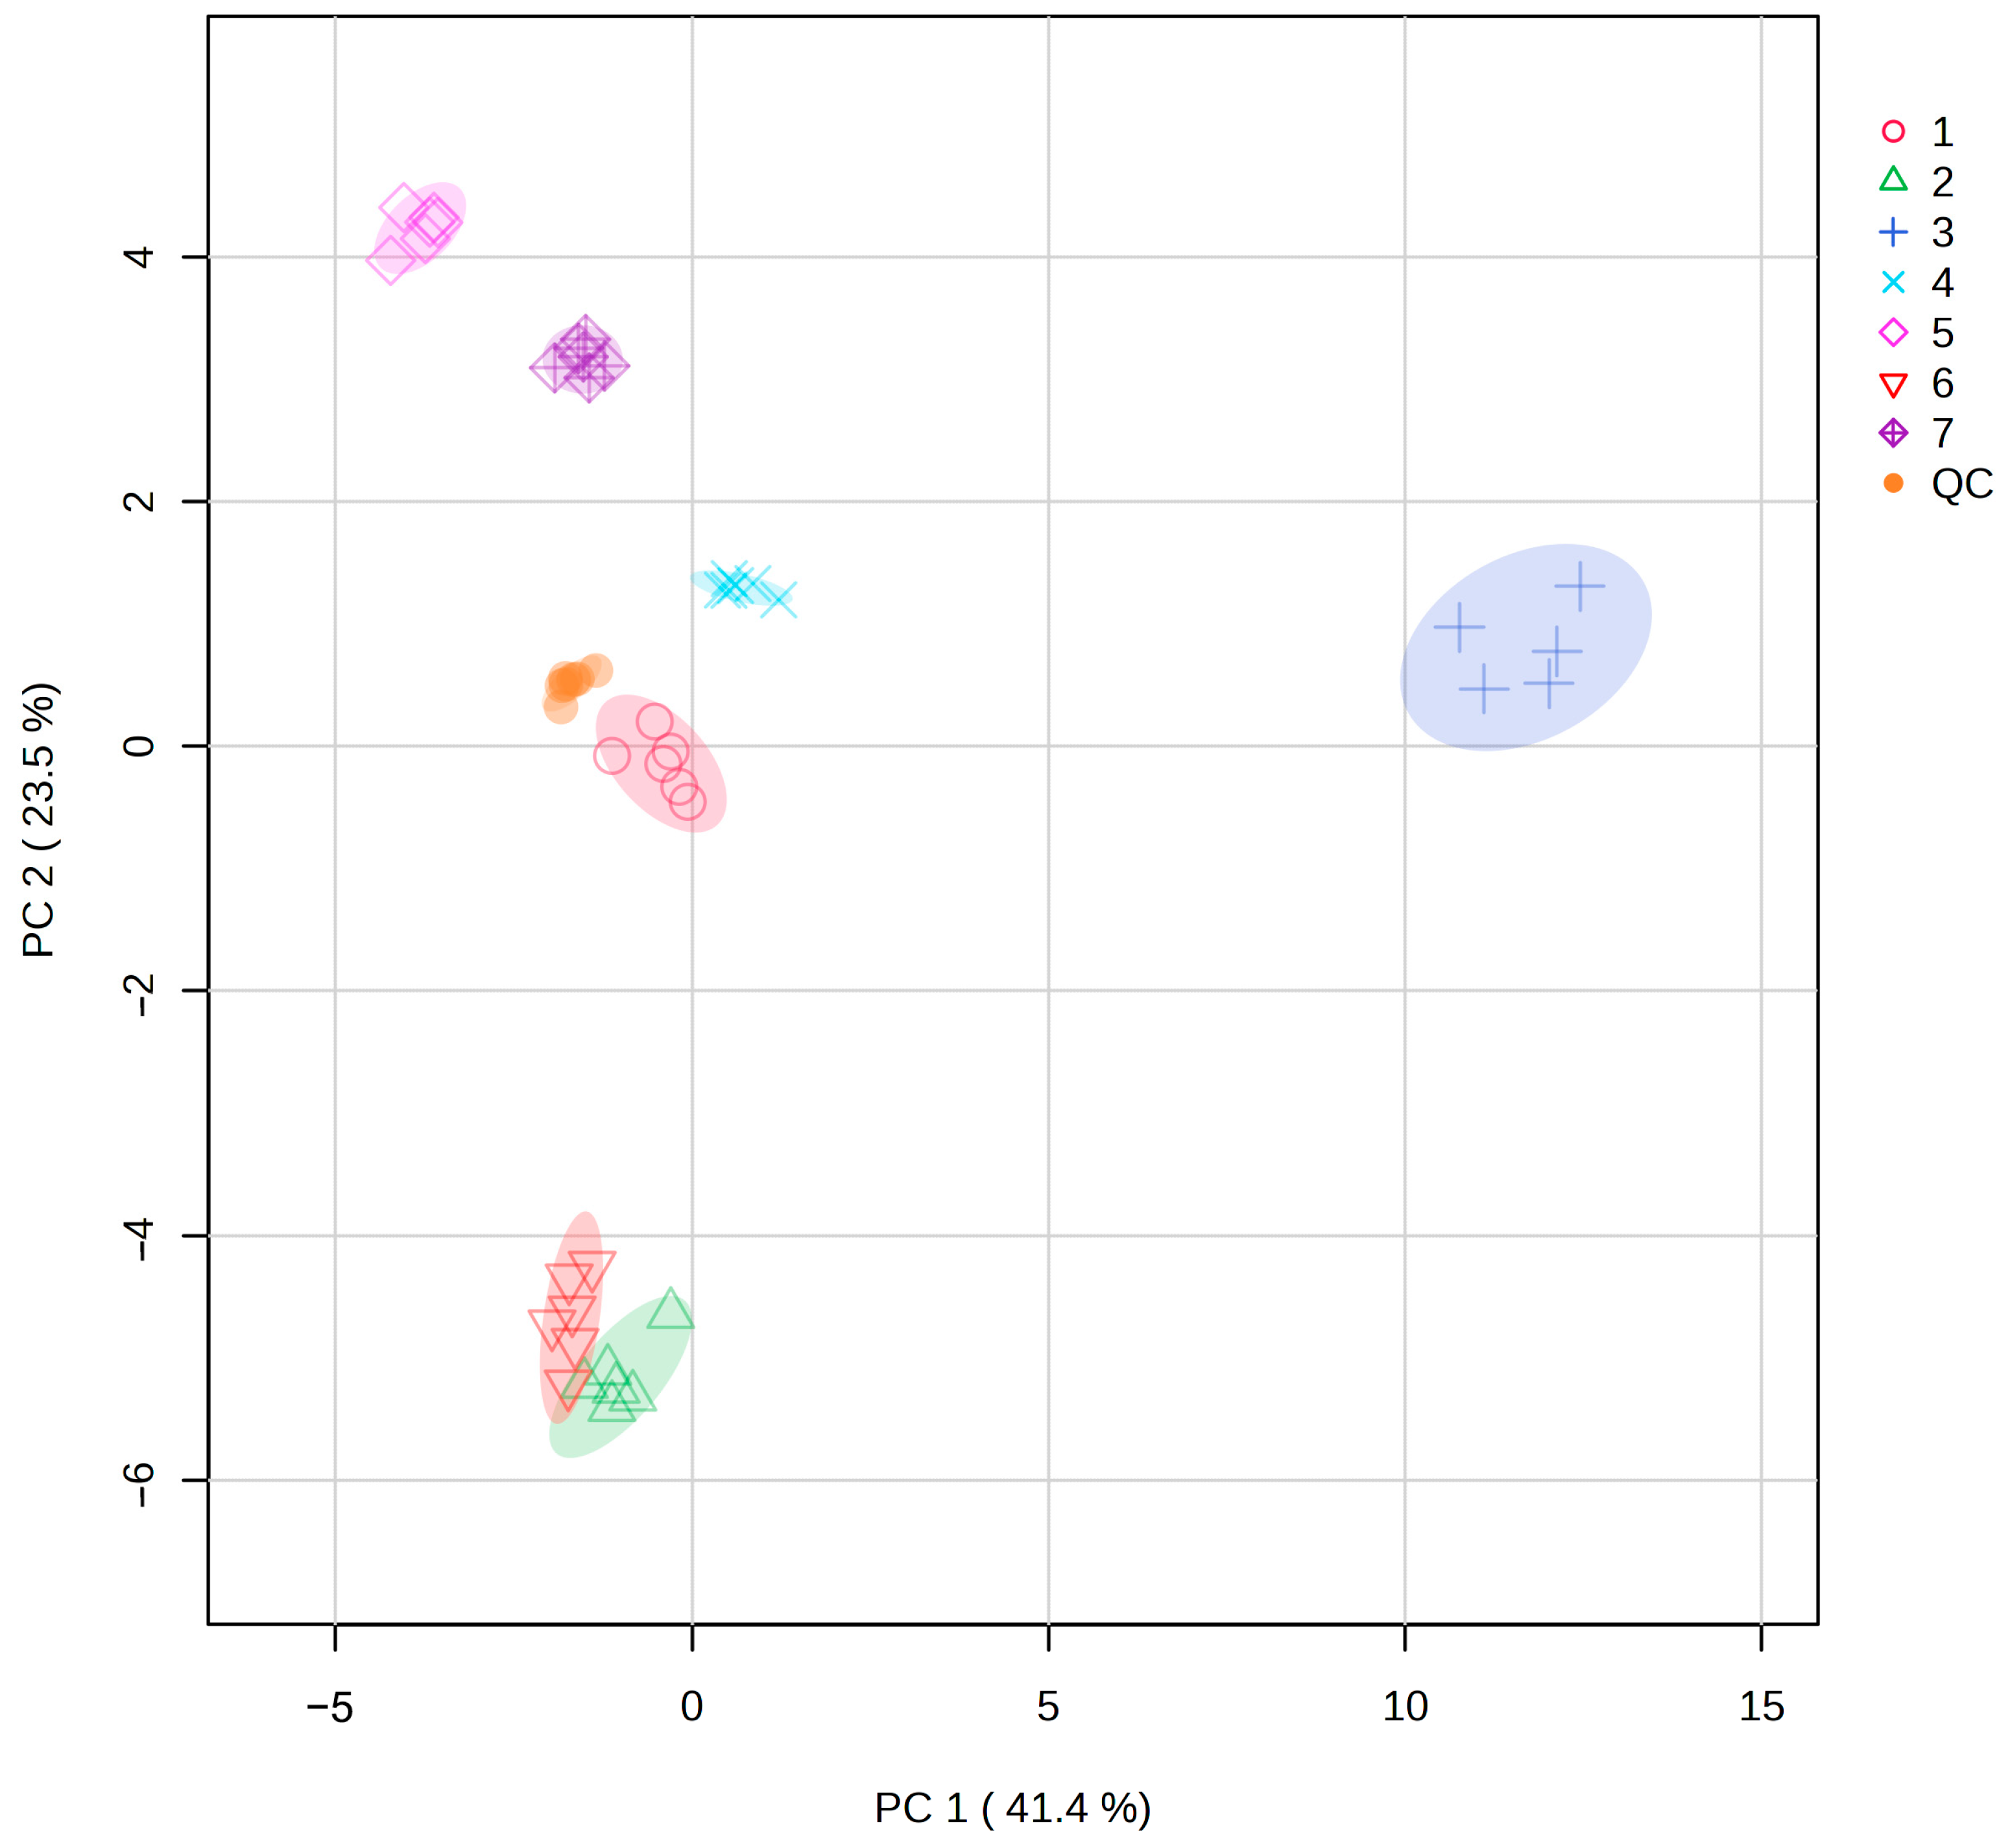
According to the PCA analysis, there were significant differences in metabolites among different populations. Correlation analysis with environmental factors and genetic diversity showed that the differences in metabolites among populations were not significantly related to geographical distance or genetic diversity. The metabolites of Population 2 and Population 6 were the most similar. In terms of geographical distance, Sample 2 was close to Sample 1, Sample 3, and Sample 4 but far from Sample 6, which further proved that there was no significant correlation between metabolic differences among populations and geographical distance.
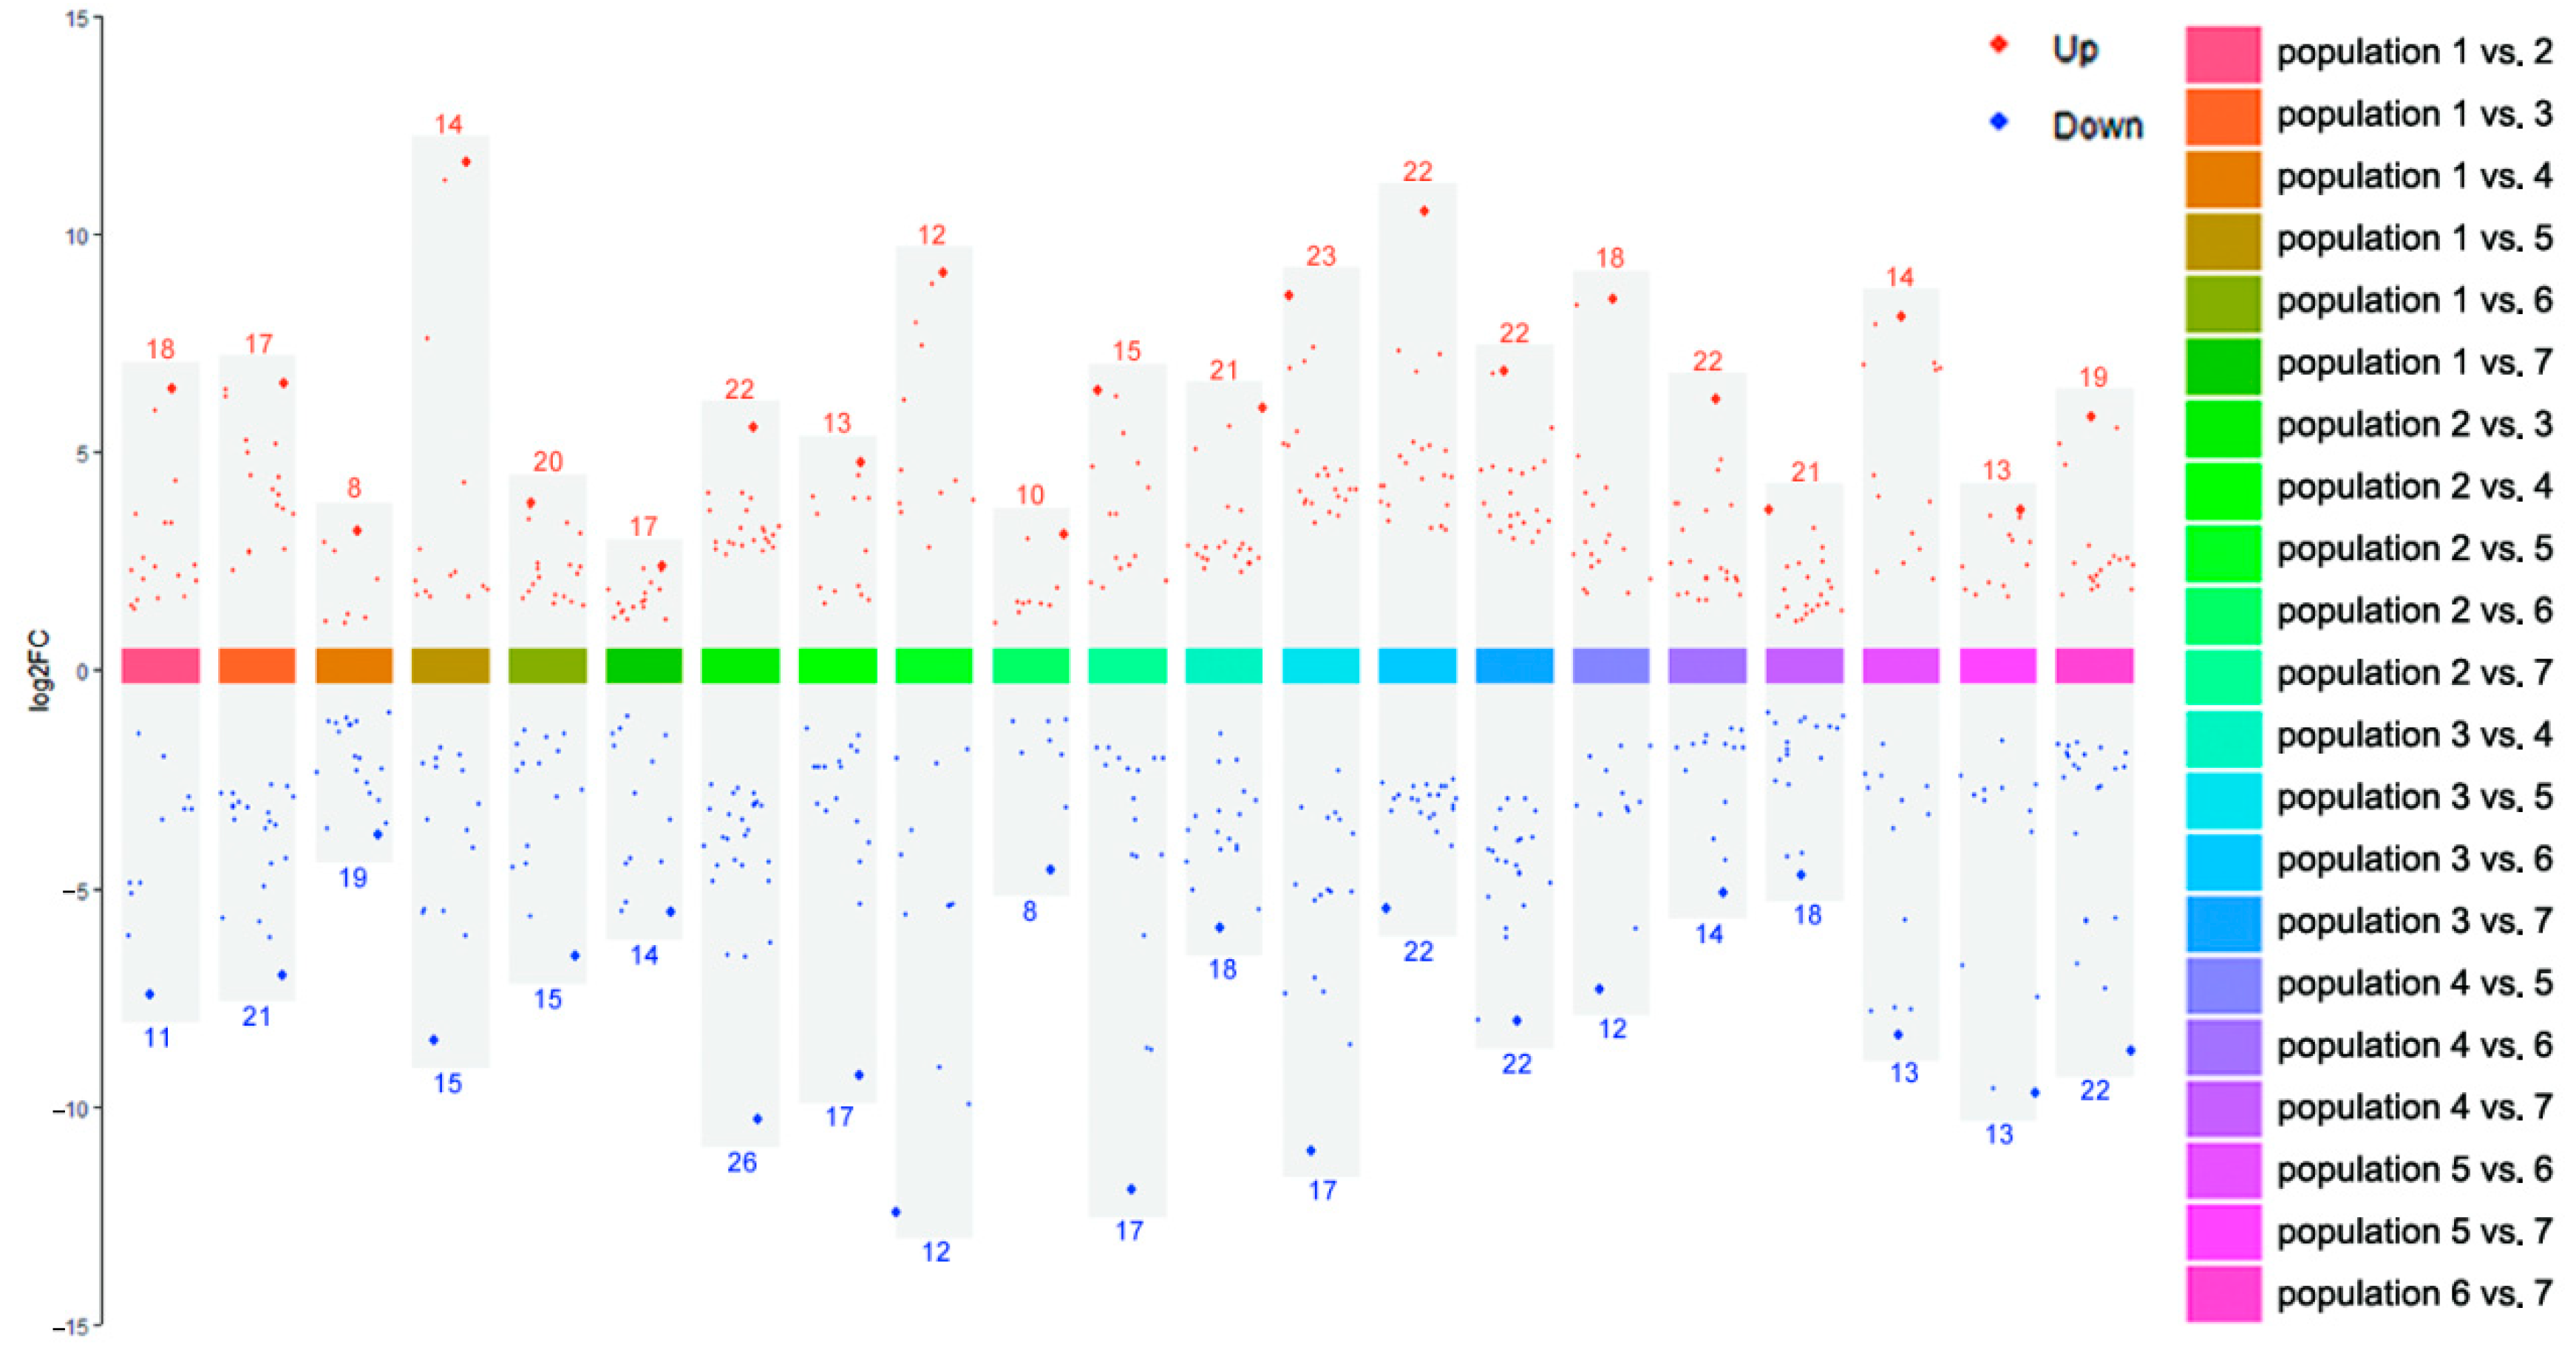
Pairwise comparison of metabolites showed that the number of upregulated differential metabolites ranged from 8 to 23, and downregulated differential metabolites ranged from 8 to 26. There was no significant difference in the number of differentiated metabolites between upregulated and downregulated groups, but the magnitude of variation was different. Interestingly, Population 5, which exhibited the lowest genetic diversity, also showed the most pronounced metabolic differentiation compared to other populations. Among all the differential metabolites, the upregulation of arctiin was the highest (Population 1 vs. Population 5, log2FC = 11.559), and the downregulation of Curdionolide B was the highest (Population 2 vs. Population 5, log2FC = −12.486). Among the environmental factors, Sample 5 had the highest annual mean temperature, lower annual mean precipitation and annual mean moisture content, and stronger short-wave radiation and weaker long-wave radiation, indicating that Sample 5 had greater degrees of high temperature, drought, and temperature fluctuation than other sample sites, which likely contributed to its distinct metabolic profile. In follow-up studies, we should pay more attention to Population 5.
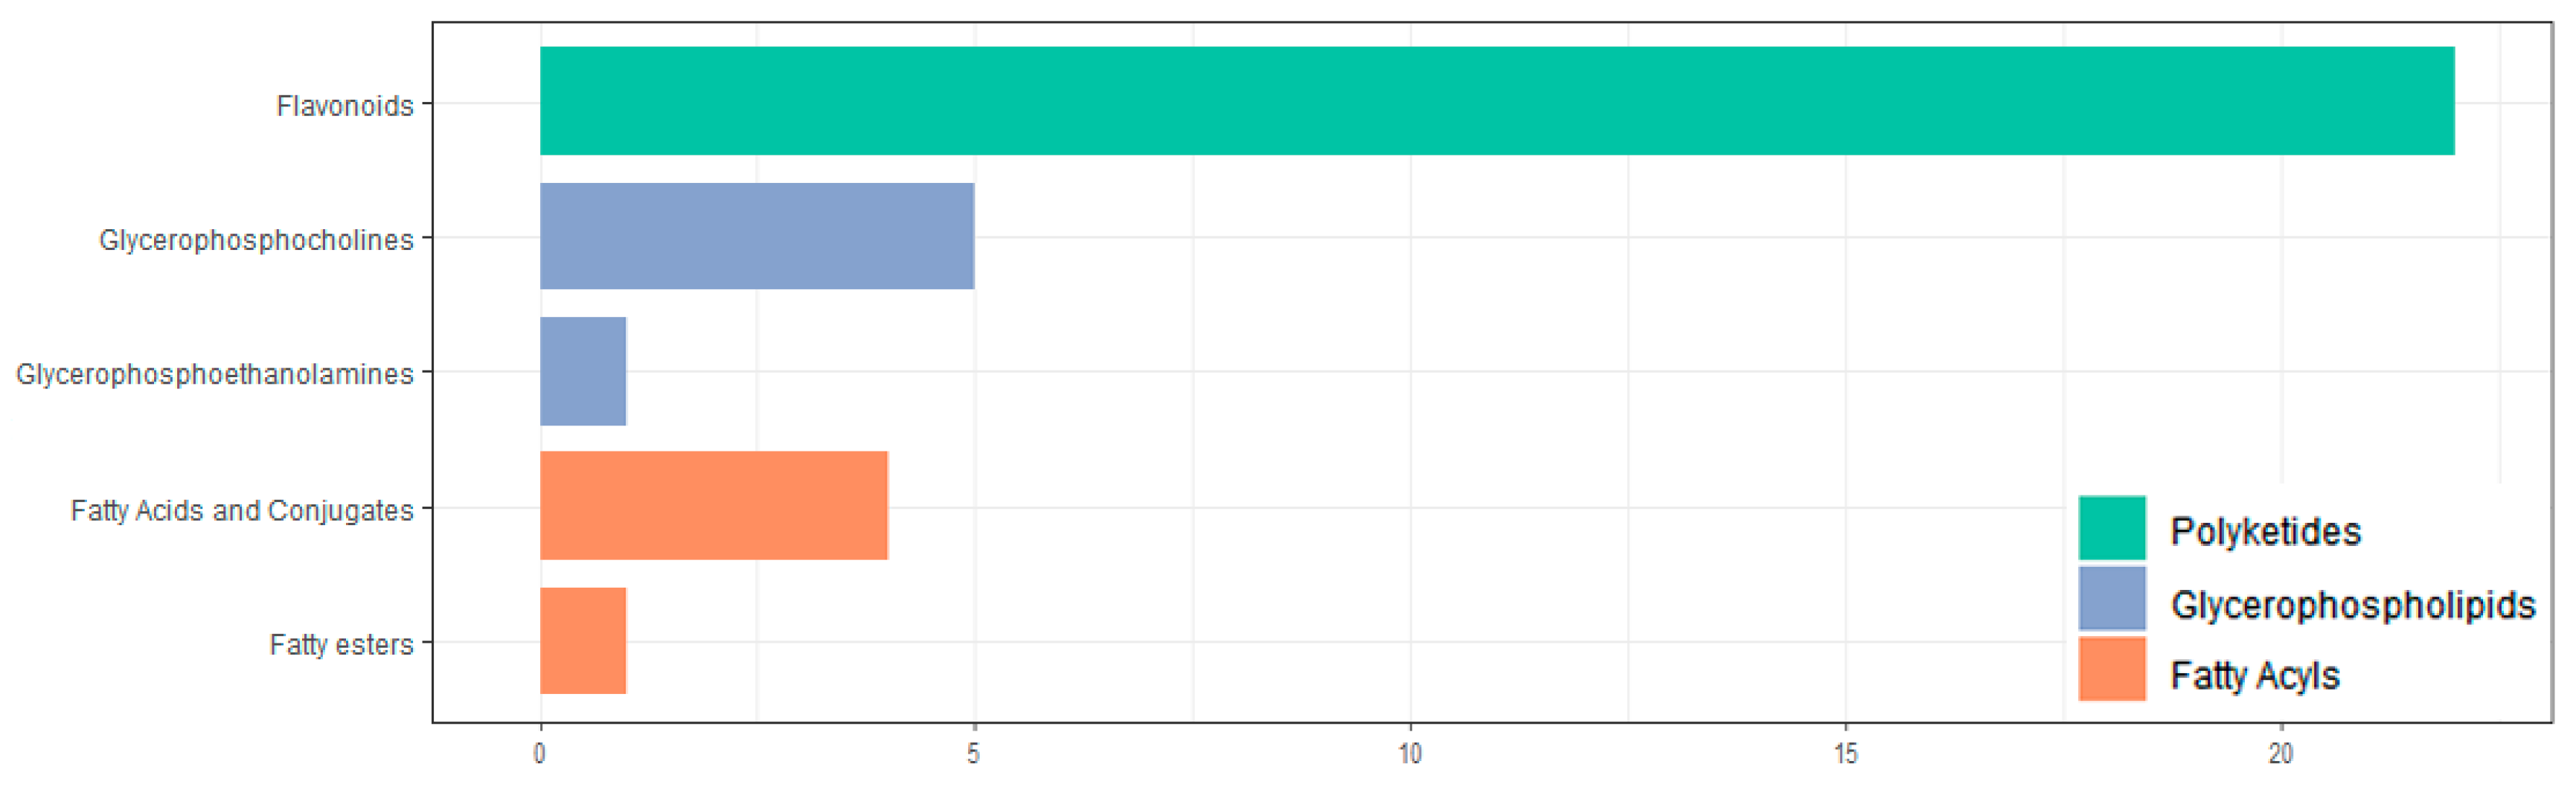
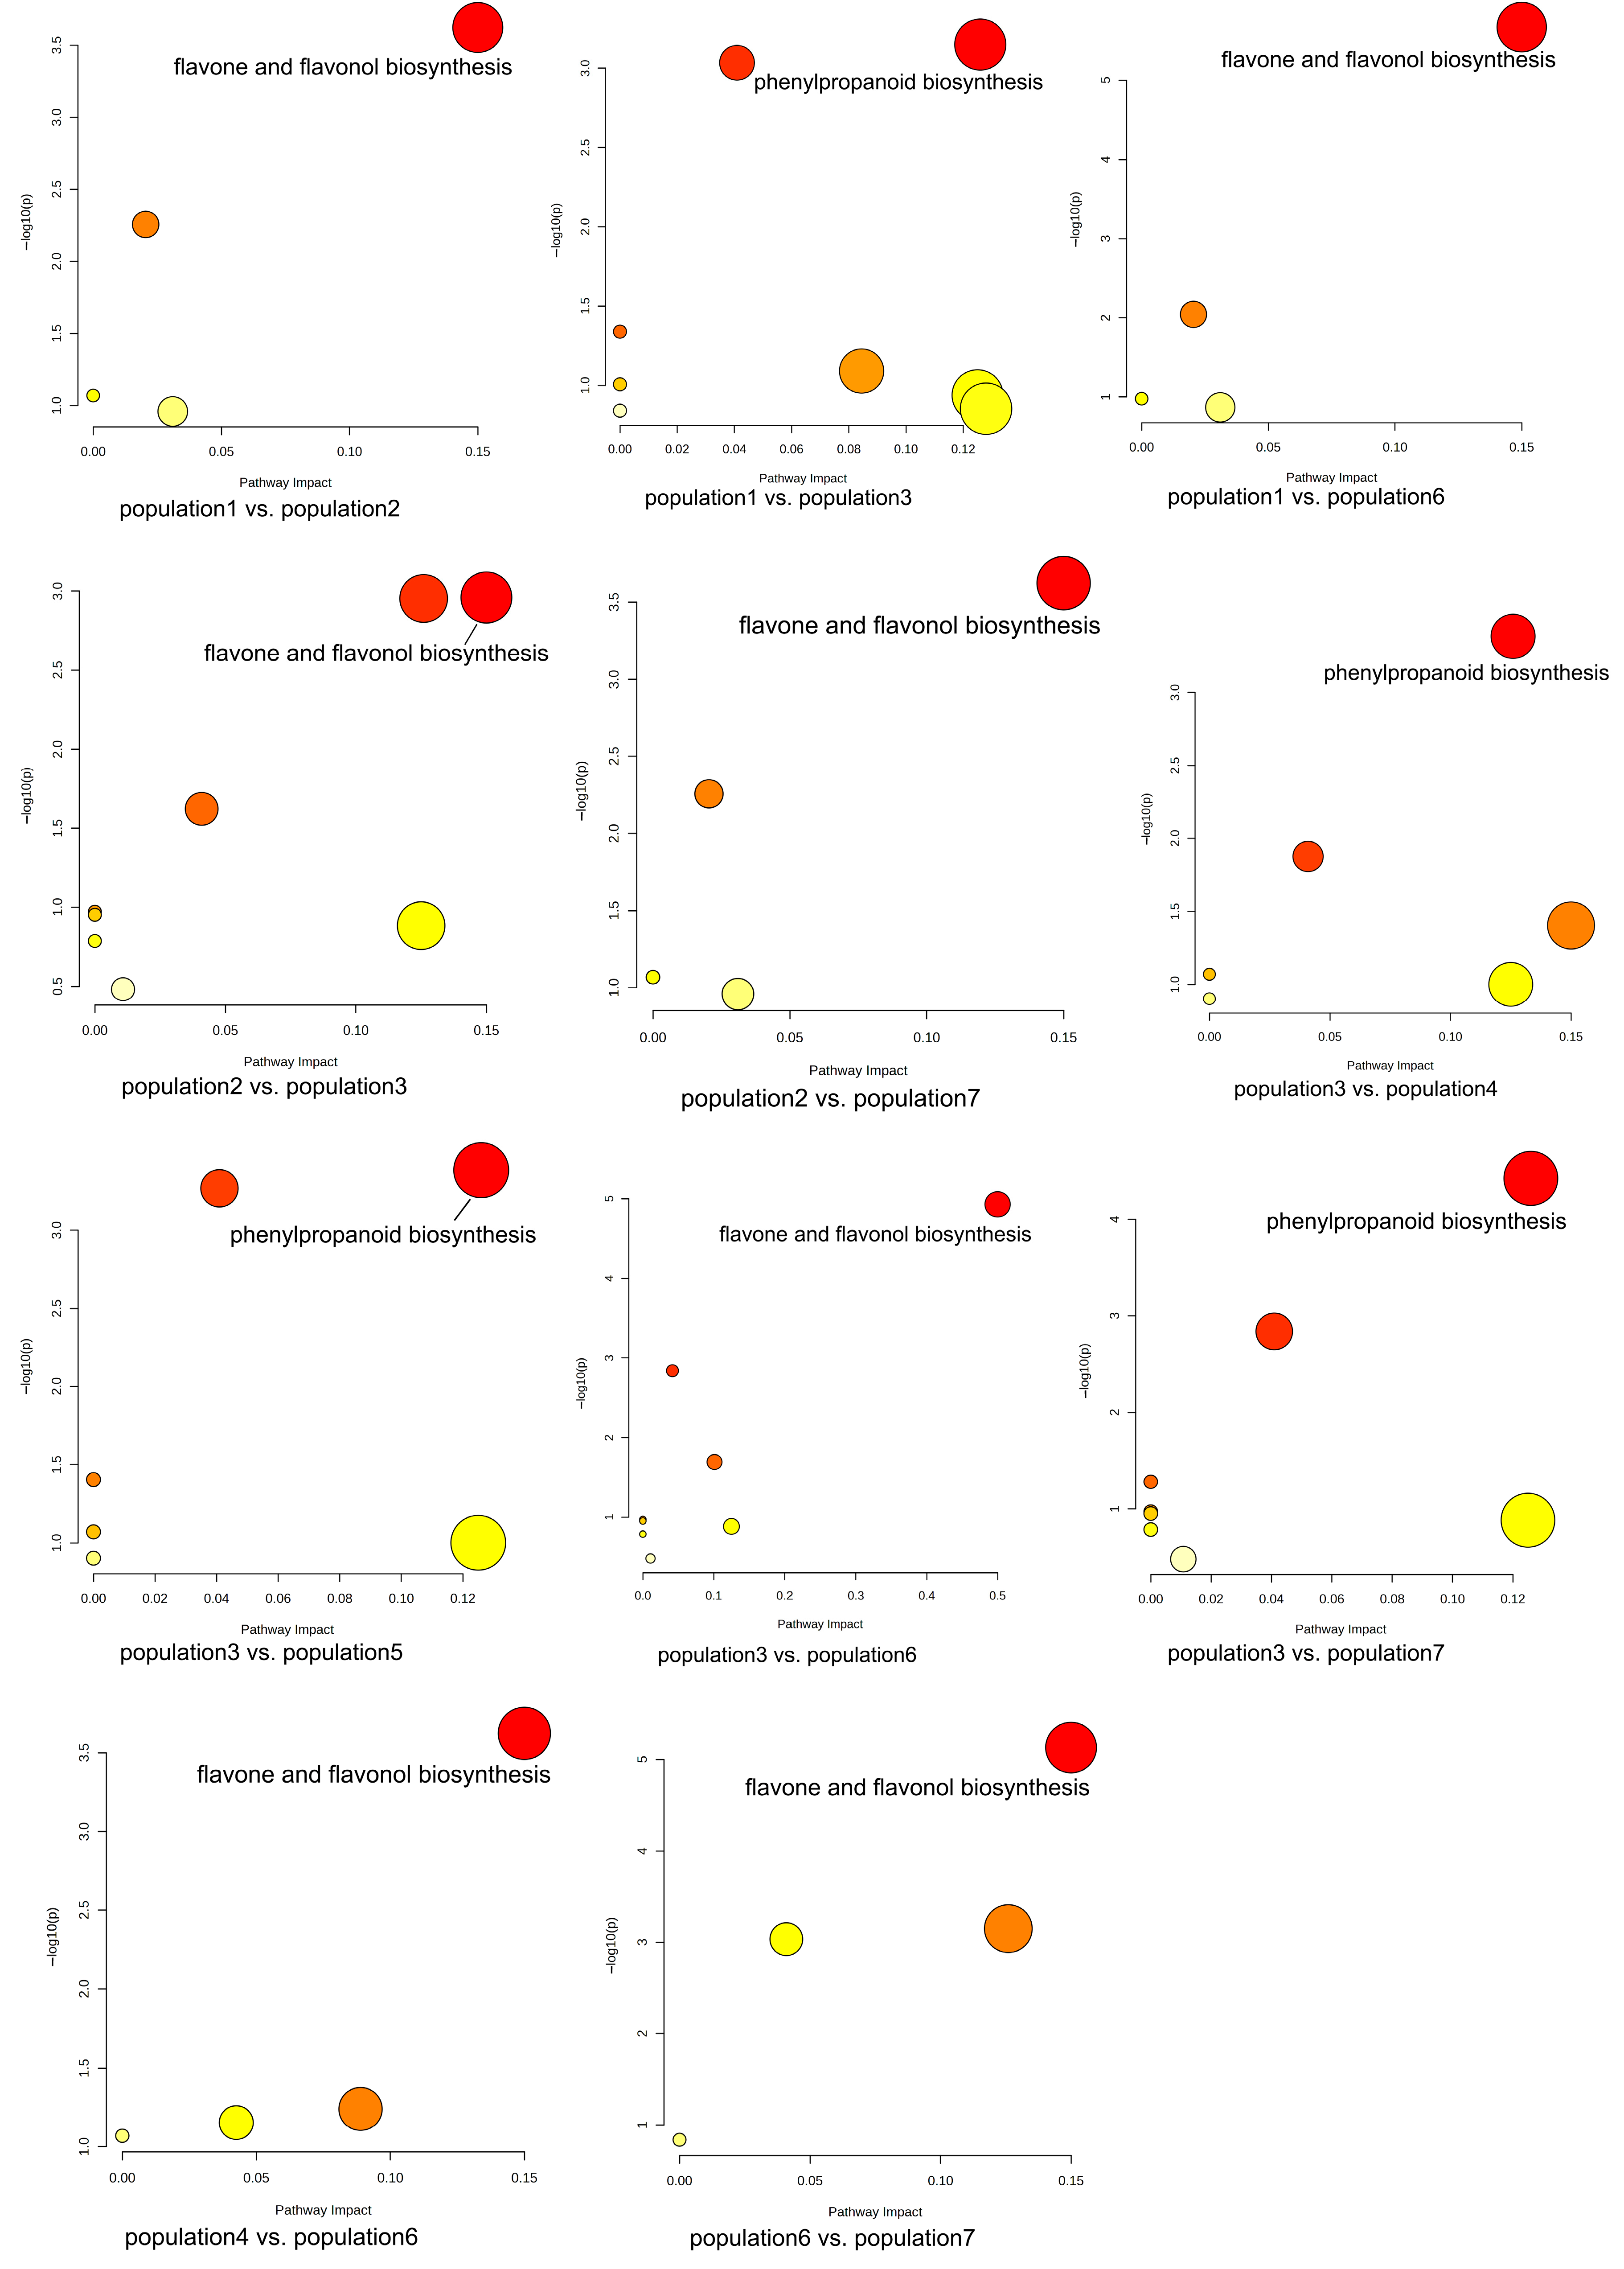
During the growth of plants, a metabolite does not exist independently but interacts with a variety of other metabolites and is regulated by the environment, genes, transcription, and other factors, thus forming a complex metabolic network. Annotation and KEGG pathway enrichment showed that the differential metabolites were mostly flavonoids and related to two pathways: flavone and flavonol biosynthesis and phenylpropanoid biosynthesis. Flavonoids are secondary metabolites commonly foundin plants, and they are also important medicinal substances in medicinal plants, usually with anti-inflammatory, antibacterial, antioxidant, anti-tumor, cardiovascular protection, and other effects [61,62,63,64]. Flavonoids are also important substances for plants to cope with environmental stress, and low temperature and ultraviolet radiation can promote the accumulation of flavonoids [65,66]. Phenylpropanoids are a class of natural products with one or more C6-C3 groups, which have good potential in anti-oxidation, anti-tumor, anti-virus, regulation of blood sugar, and protection of ultraviolet radiation damage [67,68]. Phenylpropanoids can enhance plant resistance to insect pests, cold resistance, oxidation resistance, and mechanical damage [69,70]. Some volatile phenylpropanoids, such as benzyl alcohol, benzyl acetate, methyl benzoate, and phenylacetaldehyde, can attract pollinating insects and play an important role in plant reproduction [71]. The biosynthesis of phenylpropanoids is regulated by biological and abiotic factors. Studies have shown that low temperature can promote the accumulation of lignin and anthocyanins in the phenylpropanoids biosynthesis pathway [72,73,74], and lignin can enhance the toughness of the plant cell wall to cope with the mechanical damage caused by low temperature. Anthocyanins have good antioxidant capacity, which can reduce ROS accumulation and alleviate oxidative damage caused by low-temperature stress on plants. In addition, syringin and other phenylpropanoids were also affected by drought stress [75]. Metal ion concentration (including copper, iron, zinc, manganese, and sodium) [76] and salt stress [77] can also affect the pathways related to flavonoids and phenylpropanoids and then promote or inhibit the expression of flavonoids and phenylpropanoids.
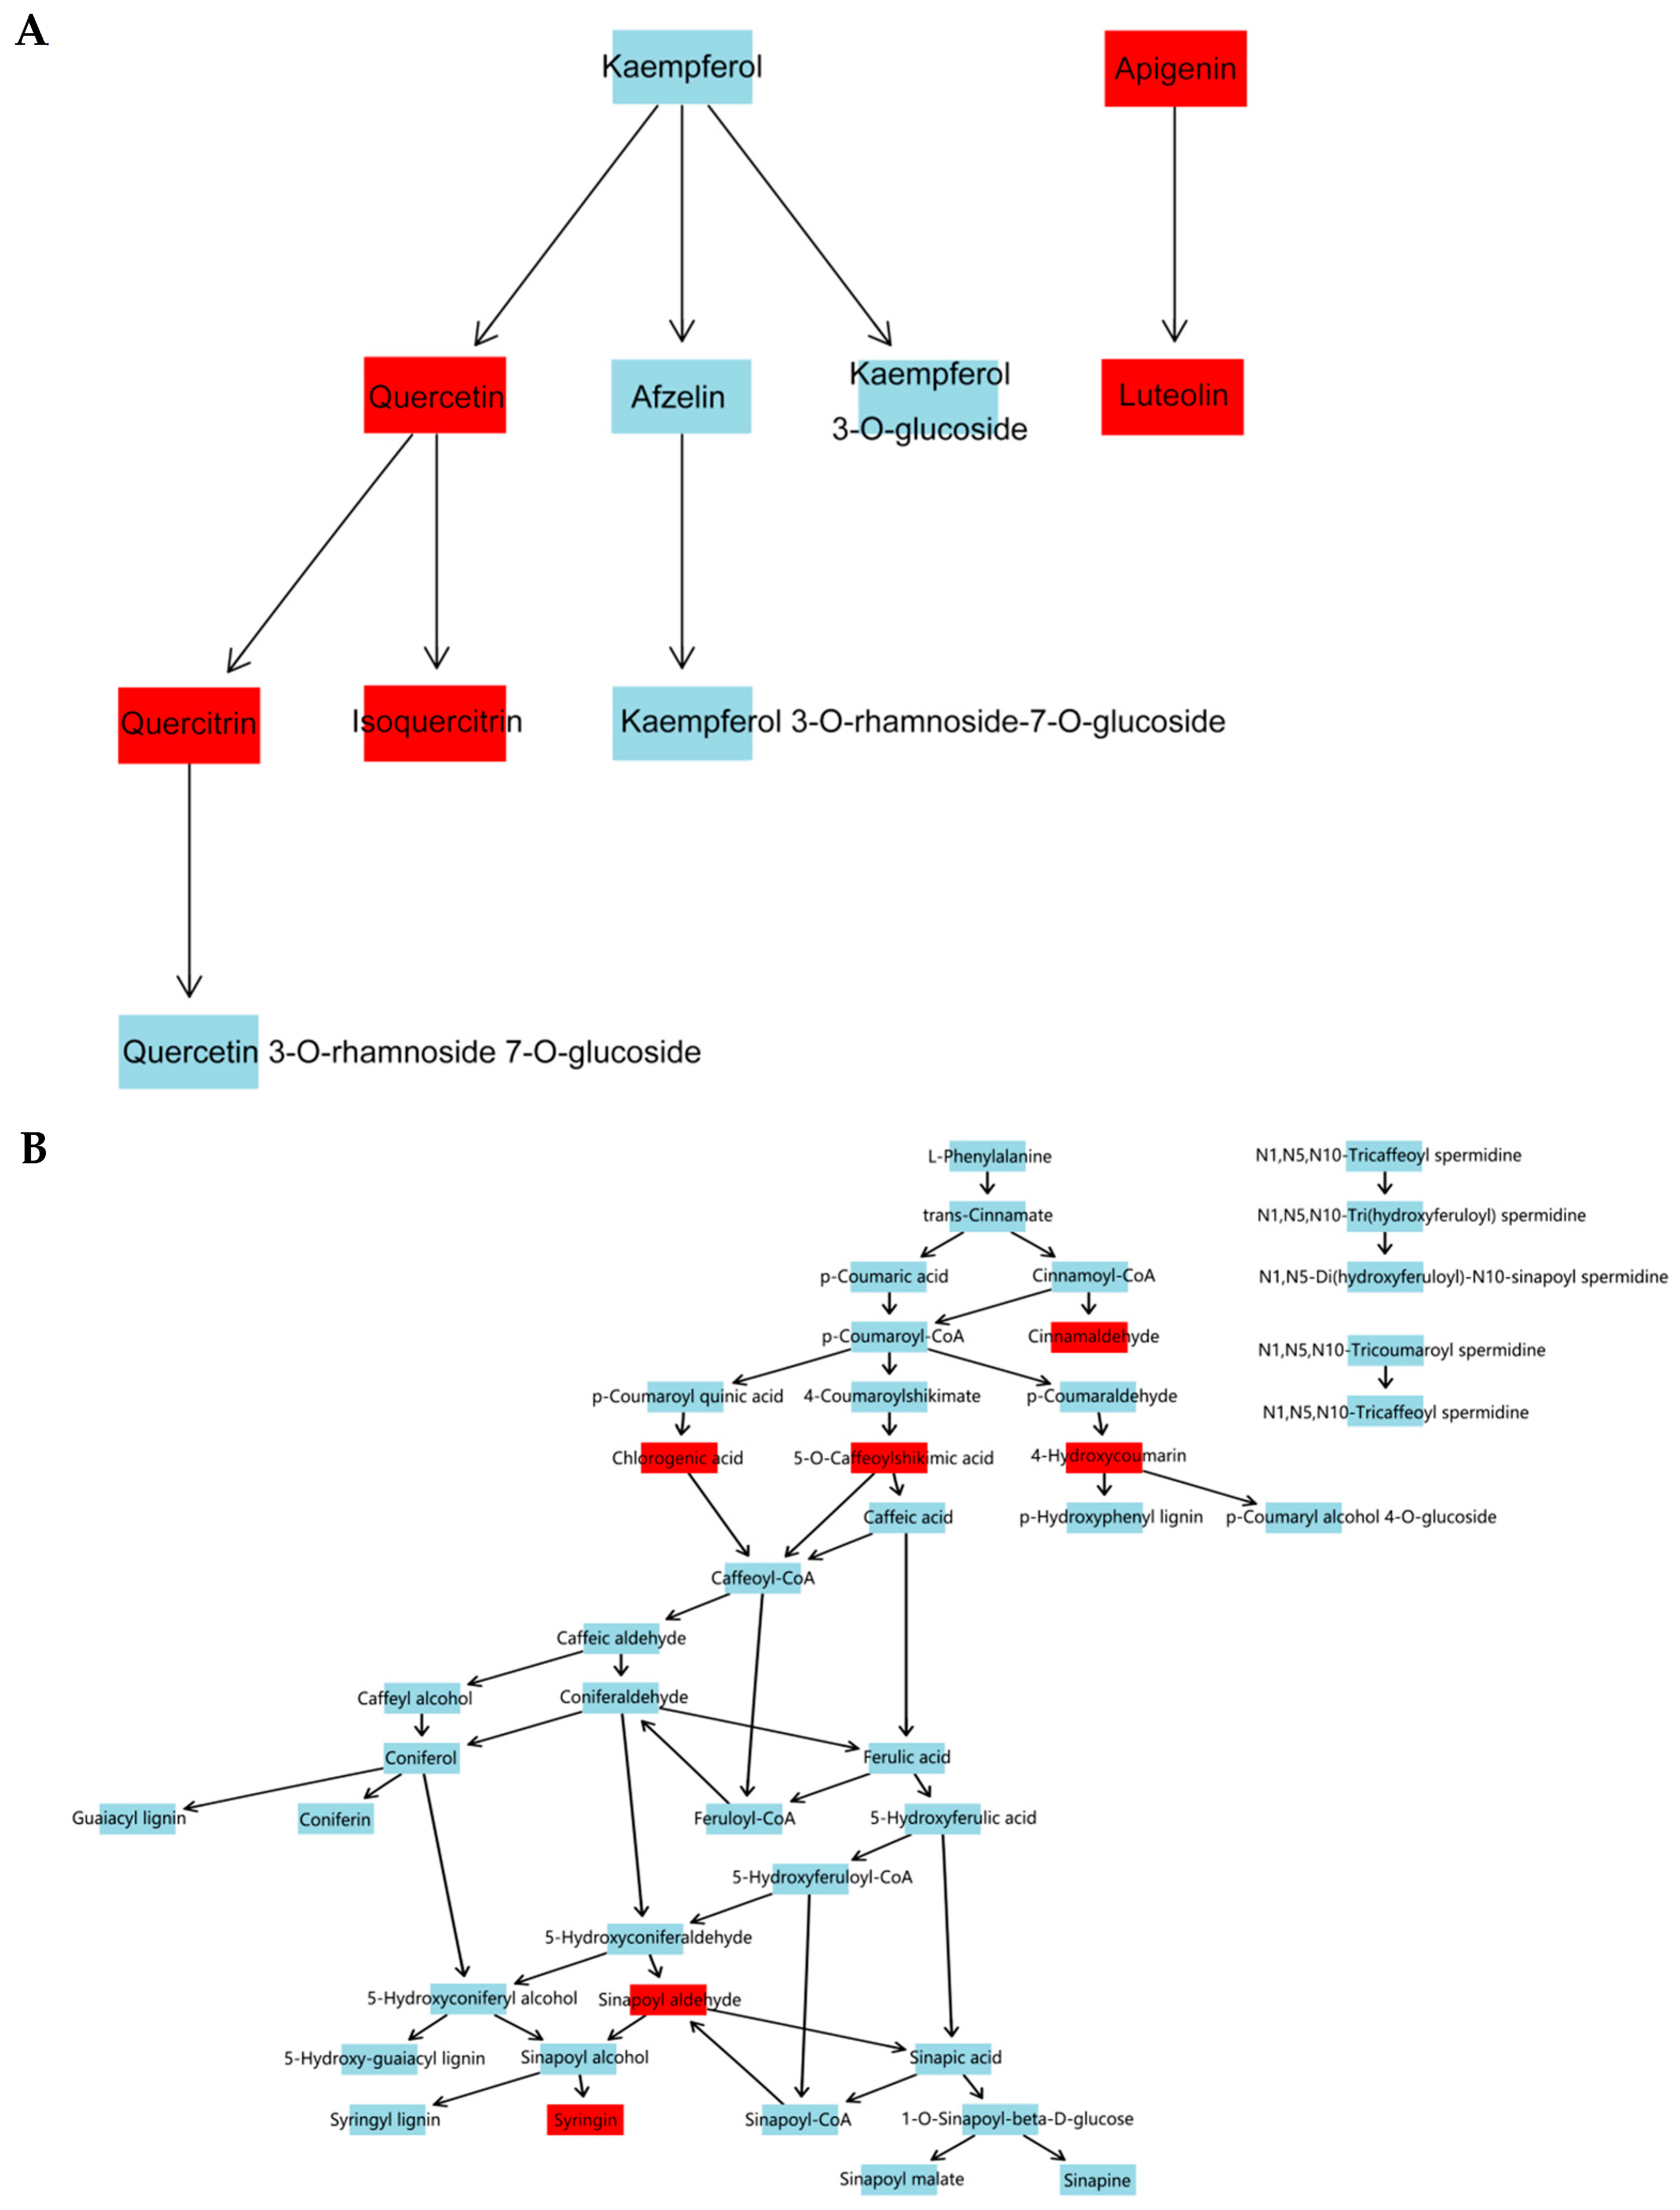
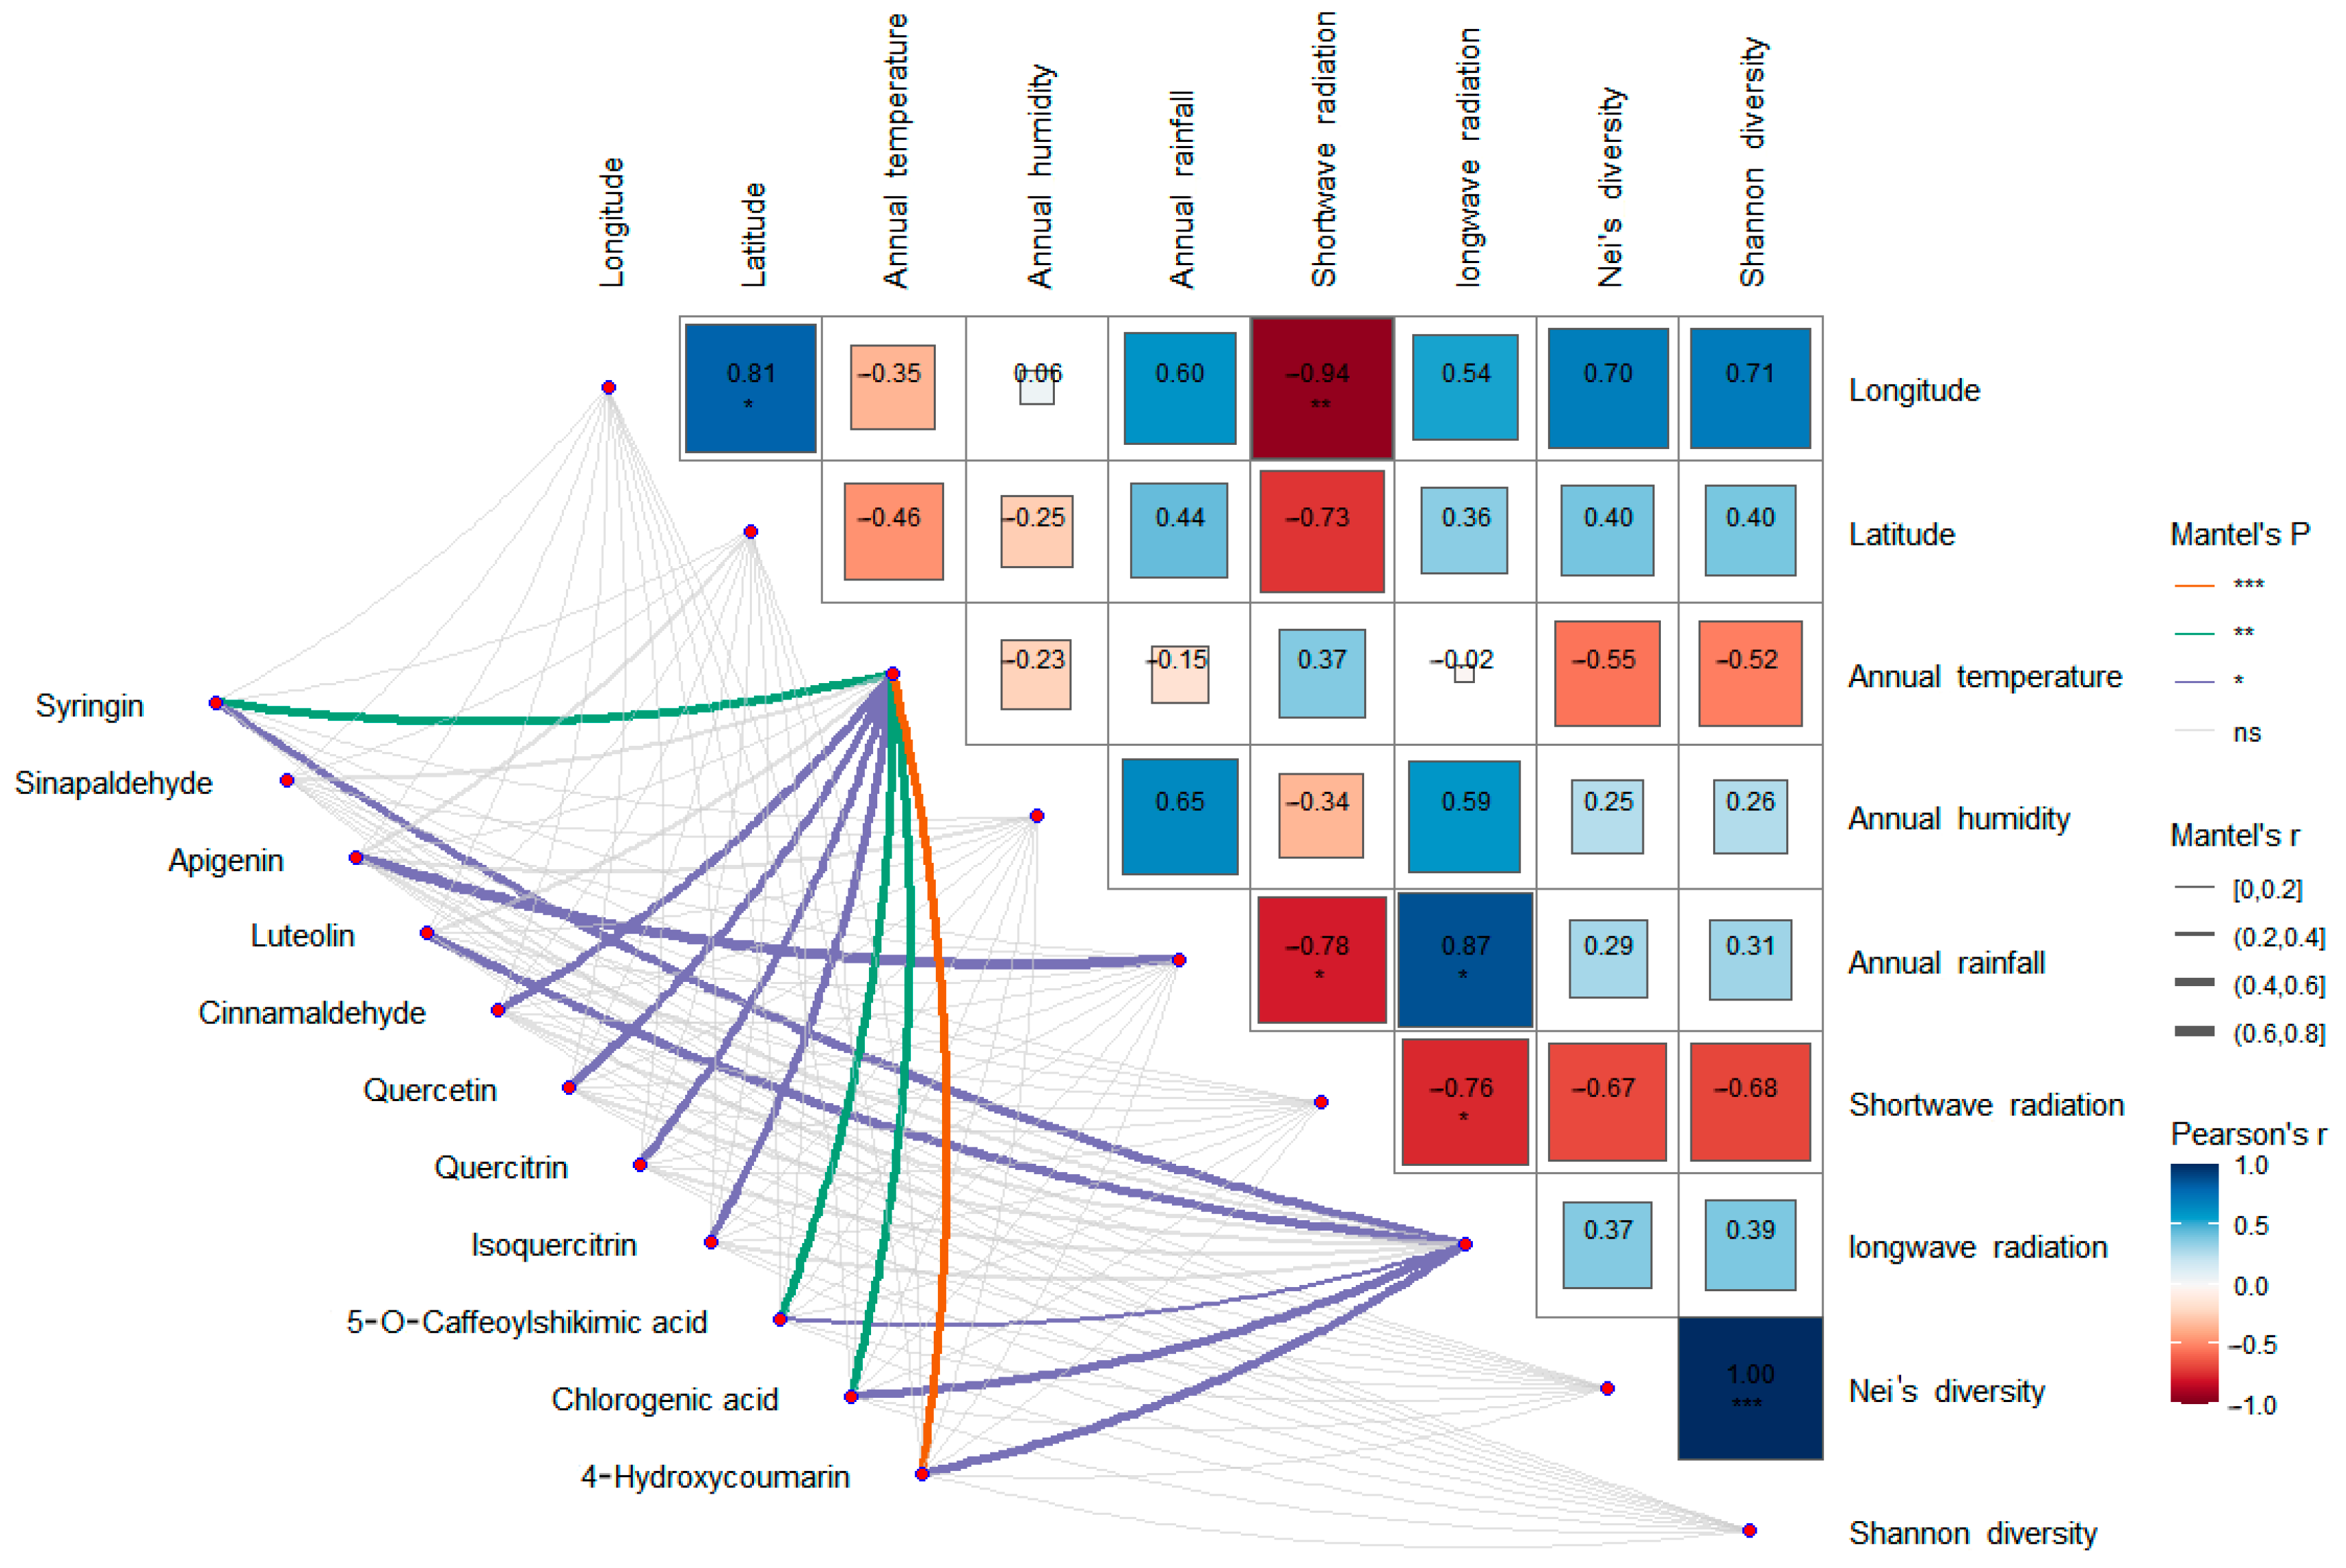
Among the differential metabolites of different populations, 11 differential metabolites related to these two pathways were screened out, including syringin, sinapaldehyde, apigenin, luteolin, cinnamaldehyde, quercetin, quercitrin, isoquercetin, 5-O-caffeoylshikimic acid, chlorogenic acid, and 4-hydroxycoumarin. Correlation analysis of these 11 differential metabolites with environmental factors and genetic diversity showed that there was no significant correlation between the expression levels of these 11 differential metabolites and genetic diversity, latitude, and longitude, indicating that the metabolites of S. obv were mainly affected by environmental factors rather than genetic factors. Also, there is no obvious spatial structure on a large scale. Among the environmental factors, the annual mean temperature had the greatest influence on the differential metabolites. There were eight differential metabolites (syringin, cinnamaldehyde, quercetin, quercetin, isoquercetin, 5-O-cafeoylshikimic acid, chlorogenic acid, and 4-hydroxycoumarin) that were significantly correlated with the annual mean temperature, followed by the annual mean long-wave radiation. Five different metabolites (syringin, luteolin, 5-O-caffeoylshikimic acid, chlorogenic acid, and 4-hydroxycoumarin) were significantly correlated with the annual mean long-wave radiation amount, suggesting that the different metabolites were mainly related to temperature and diurnal temperature variation. The responses of plant secondary metabolite accumulation to temperature have been proven [78], while the mechanisms, which are how temperature and diurnal temperature variation affect the above metabolites, remain to be studied.
Although the mean annual precipitation and mean annual moisture content of each sample site were significantly different, there was almost no significant correlation between the two factors and the expression levels of different metabolites, except for apigenin. This may be due to the fact that S. obv grows near waterfalls or streams. Even when precipitation is low, the water flow can also make up for the lack of precipitation. S. obv mainly grows in summer and autumn. During this period, the QTP has higher temperature and precipitation, leading to abundant river water, so S. obv may not be susceptible to drought stress.

5. Conclusions

In conclusion, this study provides valuable insights into the genetic and metabolic diversity of S. obv, emphasizing the importance of environmental factors in shaping its adaptive responses. The low genetic diversity and limited gene flow among populations underscore the need for conservation strategies. Furthermore, the identification of key metabolites and their associated pathways offers a foundation for future research into the pharmacological potential of S. obv. By integrating genetic and metabolomic approaches, this study contributes to a deeper understanding of the ecological and medicinal significance of this endangered species, paving the way for its sustainable utilization and conservation.

Supplementary Materials

The following supporting information can be downloaded at: https://www.mdpi.com/article/10.3390/genes16050593/s1, Table S1: Sequences of 100 ISSR universal primers; Table S2: PCR amplification procedures; Table S3: The eluent gradient; Table S4: Mass parameters; Table S5: Compounds identified from S. obv ethanol extract by UPLC-Q-TOF-MS/MS; Table S6: List of the 85 differential metabolites.

Author Contributions

Conceptualization, S.Z.; Data curation, S.Z. and S.W. (Sujuan Wang); Formal analysis, S.Z.; Funding acquisition, J.D.; Investigation, S.Z., S.W. (Shiyan Wang) and H.S.; Methodology, S.Z.; Project administration, S.Z. and J.D.; Resources, S.Z., S.W. (Shiyan Wang), and H.S.; Software, S.Z.; Supervision, J.D.; Validation, S.W. (Sujuan Wang); Visualization, S.Z., S.W. (Sujuan Wang), and S.W. (Shiyan Wang); Writing—original draft, S.Z.; Writing—review and editing, S.W. (Sujuan Wang).All authors have read and agreed to the published version of the manuscript.

Funding

This research was funded by the Project for Sustainable Utilization of Valuable Traditional Chinese Medicine Resources (2060302-2303-08) to Ji De; High-level Ecological Team Building Project of Xizang University (XMK25-000842) to Ji De.

Institutional Review Board Statement

Not applicable.

Informed Consent Statement

Not applicable.

Data Availability Statement

The original contributions presented in this study are included in the article/Supplementary Material. Further inquiries can be directed at the corresponding author.

Conflicts of Interest

The authors declare no conflicts of interest.

Abbreviations

The following abbreviations are used in this manuscript:
AMOVAAnalysis of molecular variance
AFLPAmplified fragment length polymorphism
CAMPConservation Assessment Management Plan
CITESConvention of International Trade in Endangered Species of Wild Fauna and Flora
dfDegree of freedom
Est. VarEstimated variance
FstGenetic differentiation index
HNei’s gene diversity
IShannon’s information index
ISSRInter-simple sequence repeat
MSMean of standard deviation
NaNumber of observed alleles
NeNumber of effective alleles
NpNumber of polymorphic loci
PCAPrincipal component analysis
PCRPolymerase chain reaction
PPLPercentage of polymorphic bands
QCQuality control
QTPQinghai-Tibet Plateau
SRAPSequence-related amplified polymorphism
SSSum of standard deviation
SSRSimple sequence repeat
UPLC-Q-TOF-MS/MSUltra-high-performance liquid chromatography-tandem quadrupole-time-of-flight mass spectrometry

References

  1. Zhang, Y.Z.; Chen, J.G.; Sun, H. Alpine speciation and morphological innovations: Revelation from a species-rich genus in the Northern Hemisphere. Aob. Plants 2021, 13, plab018. [Google Scholar] [CrossRef] [PubMed]
  2. Editorial Committee of Flora of China, Chinese Academy of Sciences. Flora of China; Science Press: Beijing, China, 1999. [Google Scholar]
  3. Ghosh, D. Brahma Kamal: The Himalayan beauty. Resonance 2017, 22, 377–387. [Google Scholar] [CrossRef]
  4. Dai, P.F. The Reproductive Ecology on Saussurea involucrata. Master’s Thesis, Xinjiang Agricultural University, Urumqi, China, 2008. [Google Scholar]
  5. Liu, B. The cabbage-like room of Saussurea obvallata. For. Humankind 2017, 1, 54–55. [Google Scholar]
  6. Lan, X.Z.; Lu, J.; Luo, J. Investigation and evaluation of the rare and endangered Tibetan medicinal plants in the Linzhiregion. Resour. Sci. 2011, 33, 2362–2369. [Google Scholar]
  7. Fei, W.Q.; Rao, Y.; Luo, J.; Lan, X.Z. Protection priority of rare and endangered wild medicinal plants in Shegyla Mountains, Tibet. J. Northwest A F Univ. 2017, 45, 180–188. [Google Scholar] [CrossRef]
  8. Gopal, R.; Rawat, N. Brahma Kamal—The legendary, mythological and therapeutic flower from the hills of Uttarakhand. Pac. Hosp. Rev. 2018, 6, 22–27. [Google Scholar]
  9. Yang, Y. Northwest institute of plateau biology, Chinese Academy of Sciences. In Tibetan Medicine Records; Qinghai People’s Publishing House: Xining, China, 1991. [Google Scholar]
  10. Zhonghua Bencao Committee of the State Administration of Traditional Chinese Medicine of the People’s Republic of China. Zhonghua Bencao; Shanghai Scientific and Technical Publisher: Shanghai, China, 1999. [Google Scholar]
  11. Liu, Y.C.; Liu, H.Q. A preliminary survey of medicinal Saussurea species in Qinghai province, China. Chin. J. Ethnomed. Ethnopharm. 2001, 5, 289–294. [Google Scholar]
  12. Yang, J.L.; Wang, R.; Liu, L.L.; Shi, Y.P. Phytochemicals and biological activities of Saussurea species. J. Asian Nat. Prod. Res. 2010, 12, 162–175. [Google Scholar] [CrossRef]
  13. Zhao, T.; Li, S.J.; Zhang, Z.X.; Zhang, M.L.; Shi, Q.W.; Gu, Y.C.; Dong, M.; Kiyota, H. Chemical constituents from the genus Saussurea and their biological activities. Heterocycl. Comm. 2017, 23, 331–358. [Google Scholar] [CrossRef]
  14. Wu, N.; Liu, Y.F.; Liang, X.M.; Mei, L.J.; Tao, Y.D.; Yu, R.T. Phytochemical and chemotaxonomic study on Saussurea medusa Maxim. (Compositae). Biochem. Syst. Ecol. 2020, 93, 104171. [Google Scholar] [CrossRef]
  15. Guo, Y.; Kong, Y.; Sun, J.; Jiao, Y.; Hong, Y.; Wang, Y. Alleviation of ultraviolet-B radiation-induced photoaging using Saussurea medusa Maxim polysaccharide. Photochem. Photobiol. 2024, 100, 622–632. [Google Scholar] [CrossRef]
  16. Cao, J.Y.; Dong, Q.; Wang, Z.Y.; Zhao, Y.; Ren, Y.; Mei, L.J.; Tao, Y.D.; Yu, R.T. Megastigmane sesquiterpenoids from Saussurea medusa and their anti-inflammatory activities. Nat. Prod. Res. 2022, 37, 3074–3082. [Google Scholar] [CrossRef] [PubMed]
  17. Ali, S.I.; Venkatesalu, V. Botany, traditional uses, phytochemistry and pharmacological properties of Saussurea costus—An endangered plant from Himalaya—A review. Phytochem. Lett. 2022, 47, 140–155. [Google Scholar] [CrossRef]
  18. Gong, G.W.; Huang, J.; Yang, Y.; Qi, B.H.; Han, G.Y.; Zheng, Y.Z.; He, H.; Chan, K.; Tsim, K.W.; Dong, T.T. Saussurea Involucrata Herba (Snow Lotus): Review of chemical compositions and pharmacological properties. Front. Pharmacol. 2020, 10, 1549. [Google Scholar] [CrossRef]
  19. Wang, D.; Jin, Y.; Yang, M.Y.; Xue, Y.J.; Zhang, X.T.; Guo, Y.L.; Li, X.Z.; Ma, K.T. Cardioprotective effect of Saussurea involucrata injection against Doxorubicin-induced cardiotoxicity by network pharmacology analysis and experimental verification. Acta Biochim. Biophys. Sin. 2024; epub ahead of print. [Google Scholar] [CrossRef]
  20. Wu, Z.Y. Flora of Tibet; Science Press: Beijing, China, 1985; pp. 868–869. [Google Scholar]
  21. Di Mar Danzeng Pengcuo. Jing Zhu Ben Cao; Qinghai Nationalities Publishing House: Xining, China, 2017. [Google Scholar]
  22. Luo, D.S. Chinese Tibetan Materia Medica; Nationalities Publishing House: Beijing, China, 1997. [Google Scholar]
  23. Negi, K.; Gaur, R.; Tiwari, J. Ethnobotanical notes on the flora of Har Ki Doon (District Uttarkashi) Garhwal Himalaya, UP India. Ethnobotany 1999, 2, 15. [Google Scholar]
  24. Pant, M.; Semwal, P. Brahma Kamal—The spiritually revered, scientifically ignored medicinal plant. Curr. Sci. 2013, 104, 685–686. [Google Scholar]
  25. Lu, Y.C.; Xin, Q.X.; Li, X.; Ren, M.J.; Zhao, Y.; Li, H.L. Chemical constituents from Saussurea obvallata. Chin. Tradit. Pat. Med. 2019, 41, 1065–1069. [Google Scholar]
  26. Semwal, P.; Painuli, S. Antioxidant, antimicrobial, and GC-MS profiling of Saussurea obvallata (Brahma Kamal) from Uttarakhand Himalaya. Clin. Phytosci. 2019, 5, 12–22. [Google Scholar] [CrossRef]
  27. Zhu, K.D.; Bai, X.; Zhao, Y.; Lu, Y.C.; Li, H.L. Optimization of supercritical CO2 extraction process of Saussurea obvallata (DC.) Edgew by Orthogonal test and GC-MS Analysis of Extracts. Acta Agric. Shanghai 2016, 32, 80–84. [Google Scholar] [CrossRef]
  28. Mishra, P.; Saklani, S.; Sharifi-Rad, M.; Iriti, M.; Salehi, B.; Maurya, V.K.; Rauf, A.; Milella, L.; Rajabi, S.; Baghalpour, N.; et al. Antibacterial potential of Saussurea obvallata petroleum ether extract: A spiritually revered medicinal plant. Cell Mol. Biol. 2018, 64, 65–70. [Google Scholar] [CrossRef] [PubMed]
  29. Wang, W.D.; Zhu, Y.H.; Jiang, L.; Mei, L.J.; Tao, Y.D.; Liu, Z.G. Enrichment and separation of high-polar compounds from Saussurea obvallata using solid-phase extraction combining with offline two-dimensional liquid chromatography. J. Sep. Sci. 2021, 44, 3967–3975. [Google Scholar] [CrossRef]
  30. Tiwari, V.K.; Rajwar, G.S.; Rawat, G.S. Chemical composition of Saussurea obvallata Wall. ex Clarke, Part I. Indian. J. For. 1986, 9, 312–314. [Google Scholar]
  31. Wang, W.D.; Mei, L.J.; Yue, H.L.; Tao, Y.D.; Liu, Z.G. Targeted isolation of cyclooxygenase-2 inhibitors from Saussurea obvallata using affinity ultrafiltration combined with preparative liquid chromatography. J. Chromatogr. BAnal. Technol. Biomed. Life Sci. 2023, 1217, 123620. [Google Scholar] [CrossRef] [PubMed]
  32. Wang, W.D.; Zhang, J.; Liu, Z.G.; Zhu, Y.H.; Mei, L.J.; Tao, Y.D.; Jiang, L. Xanthotoxol from Saussurea obvallata attenuates LPS-induced RAW 264. 7 cells inflammatory responses through NF-κB pathway. Russ. J. Bioorg. Chem. 2022, 48, 300–309. [Google Scholar] [CrossRef]
  33. Wang, W.D.; Jiang, L.; Zhu, Y.H.; Mei, L.J.; Tao, Y.D.; Liu, Z.G. Bioactivity-guided isolation of cyclooxygenase-2 inhibitors from Saussurea obvallata (DC.) Edgew. using affinity solid phase extraction assay. J. Ethnopharmacol. 2022, 284, 114785. [Google Scholar] [CrossRef]
  34. Zeng, T.; Fang, B.H.; Huang, F.L.; Dai, L.; Tang, Z.; Tian, J.L.; Cao, G.D.; Meng, X.L.; Liu, Y.C.; Lei, B.; et al. Mass spectrometry-based metabolomics investigation on two different indica rice grains (Oryza sativa L.) under cadmium stress. Food Chem. 2021, 343, 128472. [Google Scholar] [CrossRef]
  35. Yang, Y.Y.; Miao, S.; Li, W.T.; Ji, S. Research progress on plant metabolomics in root and rhizome traditional Chinese medicine. Chin. Tradit. Herb. Drugs 2023, 54, 6856–6865. [Google Scholar]
  36. Nicholson, J.K.; Lindon, J.C.; Holmes, E. “Metabonomics”: Understanding the metabolic responses of living systems to pathophysiological stimuli via multivariate statistical analysis of biological NMR spectroscopic data. Xenobiotica 1999, 29, 1181–1189. [Google Scholar] [CrossRef]
  37. Liang, H.; Sun, H.; Qian, J.Q.; Zhang, Y.Y. Advances in omics research on metabolic regulation of medicinal plants. J. Chin. Med. Mater. 2023, 46, 2085–2092. [Google Scholar] [CrossRef]
  38. Gu, R.H.; Rybalov, L.; Negrin, A.; Morcol, T.; Long, W.W.; Myers, A.K.; Isaac, G.; Yuk, J.; Kennelly, E.J.; Long, C.L. Metabolic profiling of different parts of Acer truncatum from the Mongolian Plateau using UPLC-Q-TOF-MS with comparative bioactivity assays. J. Agric. Food Chem. 2019, 67, 1585–1597. [Google Scholar] [CrossRef] [PubMed]
  39. Bai, D.H.; Jia, Y.R.; Bai, C.M.; Wu, L.M.; Yang, Q.Y. Application of UPLC-Q-TOF-MS in fingerprint and quality evaluation of traditional Chinese medicine. Yunnan Chem. Technol. 2022, 49, 12–16. [Google Scholar]
  40. Semwal, P.; Painuli, S.; Jugran, A.; Palni, L.M.S.; Verma, S.; Thapliyal, A.; Tewari, D. Genetic diversity of scanty available Himalayan Saussurea obvallata (DC.) Edgew. Iran. J. Sci. Technol. A 2020, 44, 587–594. [Google Scholar] [CrossRef]
  41. Yang, H.X. Studies on the chromosome evolution and nuclear DNA content of Saussurea Subg. Eriocoryne and Subg. Amphilaena. Master’s Thesis, Yunnan University, Kunming, China, 2020. [Google Scholar]
  42. Narah, J.; Chakravorty, J.; Brockmann, A.; Megu, K. Bumble bee visitation of Brahma Kamal (Saussurea obvallata, Asteraceae) in the Tawang District of Arunachal Pradesh, India. Curr. Sci. 2024, 127, 96–97. [Google Scholar] [CrossRef]
  43. Zhang, X.; Kuang, T.H.; Dong, W.L.; Qian, Q.H.; Zhang, H.J.; Landis, J.B.; Feng, T.; Li, L.J.; Sun, Y.X.; Huang, J.L.; et al. Genomic convergence underlying high-altitude adaptation in alpine plants. J. Integr. Plant Biol. 2023, 65, 1620–1635. [Google Scholar] [CrossRef]
  44. Yang, K.; He, J.; Tang, W.; Lu, H.; Qin, J.; Chen, Y.; Li, X. China Meteorological Forcing Dataset (1979–2018); National Tibetan Plateau/Third Pole Environment Data Center: Beijing, China, 2019. [Google Scholar] [CrossRef]
  45. Peng, S.Z.; Ding, Y.X.; Liu, W.Z.; Li, Z. 1km monthly temperature and precipitation dataset for China from 1901 to 2017. Natl. Earth Syst. Sci. Data 2019, 11, 1931–1946. [Google Scholar] [CrossRef]
  46. R Core Team. R: A Language and Environment for Statistical Computing; R Foundation for Statistical Computing: Vienna, Austria, 2024. [Google Scholar]
  47. Kitano, J.; Ishikawa, A.; Ravinet, M.; Courtier-Orgogozo, V. Genetic basis of speciation and adaptation: From loci to causative mutations. Philos. Trans. R. Soc. Lond. B Biol. Sci. 2022, 377, 20200503. [Google Scholar] [CrossRef]
  48. Fuhrmann, N.; Prakash, C.; Kaiser, T.S. Polygenic adaptation from standing genetic variation allows rapid ecotype formation. Elife 2023, 12, e82824. [Google Scholar] [CrossRef] [PubMed]
  49. Schaal, S.M.; Haller, B.C.; Lotterhos, K.E. Inversion invasions: When the genetic basis of local adaptation is concentrated within inversions in the face of gene flow. Philos. Trans. R. Soc. Lond. B Biol. Sci. 2022, 377, 20210200. [Google Scholar] [CrossRef]
  50. Blanco-Pastor, J.L.; Fernández-Mazuecos, M.; Coello, A.J.; Pastor, J.; Vargas, P. Topography explains the distribution of genetic diversity in one of the most fragile European hotspots. Divers. Distrib. 2019, 25, 74–89. [Google Scholar] [CrossRef]
  51. Frankham, R. Genetic adaptation to captivity in species conservation programs. Mol. Ecol. 2008, 17, 325–333. [Google Scholar] [CrossRef] [PubMed]
  52. Li, J.; Zhang, C.B.; Mipam, T.D.; Zhou, Q.P.; Chen, S.Y. Effects of climatic change on phylogeography and ecological niche of the endemic herb Elymus breviaristatus on the Qinghai-Tibet Plateau. Plants 2023, 12, 3326. [Google Scholar] [CrossRef] [PubMed]
  53. Yu, H.; Favre, A.; Sui, X.; Chen, Z.; Qi, W.; Xie, G.; van Kleunen, M. Mapping the genetic patterns of plants in the region of the Qinghai-Tibet Plateau: Implications for conservation strategies. Divers. Distrib. 2019, 25, 310–324. [Google Scholar] [CrossRef]
  54. Hu, L.; Wang, J.; Wang, X.; Zhang, D.; Sun, Y.; Lu, T.; Shi, W. Development of SSR markers and evaluation of genetic diversity of endangered plant Saussurea involucrata. Biomolecules 2024, 14, 1010. [Google Scholar] [CrossRef]
  55. Hu, L.; Lu, T.; Wang, X.; Wang, J.; Shi, W. Conservation priorities and demographic history of Saussurea involucrata in the Tianshan Mountains and Altai Mountains. Life 2023, 13, 2209. [Google Scholar] [CrossRef]
  56. Wang, J.; Dai, W.; Chen, J.; Ye, K.; Lai, Q.; Zhao, D. Assessment of genetic diversity and genetic structure of Saussurea medusa (Asteraceae), a “sky island” plant in the Qinghai–Tibet Plateau, using SRAP markers. Plants 2023, 12, 2463. [Google Scholar] [CrossRef] [PubMed]
  57. Nyamgerel, N.; Baasanmunkh, S.; Oyuntsetseg, B.; Oyuntsetseg, D.; Norris, J.; Choi, H.J.; Bayarmaa, G. Genetic diversity of the threatened Saussurea dorogostaiskii (Asteraceae) in the Khuvsgul region, Mongolia. Korean J. Plant Taxon. 2023, 53, 14–24. [Google Scholar] [CrossRef]
  58. Nybom, H.; Bartish, I.V. Effects of life history traits and sampling strategies on genetic diversity estimates obtained with RAPD markers in plants. Perspect. Plant Ecol. Evol. Syst. 2000, 3, 93–114. [Google Scholar] [CrossRef]
  59. He, H.; Wang, T.; Tang, C.Y.; Cao, Z.F.; Pu, X.J.; Li, Y.L.; Li, X.Z. Complete chloroplast genomes of Saussurea katochaete, Saussurea superba, and Saussurea stella: Genome structures and comparative and phylogenetic analyses. Genes 2023, 14, 2002. [Google Scholar] [CrossRef]
  60. Zhang, X.; Deng, T.; Moore, M.J.; Ji, Y.H.; Lin, N.; Zhang, H.J.; Meng, A.P.; Wang, H.C.; Sun, Y.X.; Sun, H. Plastome phylogenomics of Saussurea (Asteraceae: Cardueae). BMC Plant Biol. 2019, 19, 290. [Google Scholar] [CrossRef]
  61. Yue, L.; Zhou, T.B.; Yan, X.L.; Miao, M.S.; Li, Y.; Bai, M. Role of flavonoids in traditional Chinese medicine to improve cerebral ischaemia-reperfusion injury and its mechanism: A review. Chin. J. Exp. Tradit. Med. Formulae 2024, 30, 269–279. [Google Scholar] [CrossRef]
  62. Zou, B.; Zhong, S.Y.; Lin, J.B.; Yu, Y.S.; Fu, M.Q.; Zhuo, X.Q.; Li, J.; Bu, Z.B.; Xu, Y.J. Research progress of the structure and biological activity of flavonoids in Wampee. China Fruit Veg. 2024, 44, 47–53. [Google Scholar] [CrossRef]
  63. Xue, Y.F.; Yang, L.X.; Fan, Q.; Bai, Y.; Jiang, L.E. Review on anti-diabetic mechanism of herbs flavonoids. J. Li-ShizhenTradit. Chin. Med. 2017, 28, 1967–1970. Available online: http://www.shizhenchina.com/thesisDetails?columnId=82832402&Fpath=home&index=0&lang=zh (accessed on 18 March 2025).
  64. Lu, M.; Su, G.; Cheng, J.; Chen, J.J.; Zhou, T.; Zhao, J.L.; Wang, J.; Zhang, S.S.; Ma, Q.L.; Xie, X.D. Research progress on anti-tumor activity and mechanism of flavonoids. West China J. Pharm. Sci. 2023, 38, 236–240. [Google Scholar] [CrossRef]
  65. Wang, G.B.; Guo, X.Q.; Chang, L.; Cao, F.L. Effects of air temperature and soil moisture on flavonoids accumulation in Ginkgo biloba leaves. Chin. J. Appl. Ecol. 2013, 24, 3077–3083. [Google Scholar] [CrossRef]
  66. Agati, G.; Biricolti, S.; Guidi, L.; Ferrini, F.; Fini, A.; Tattini, M. The biosynthesis of flavonoids is enhanced similarly by UV radiation and rootzone salinity in L. vulgare leaves. J. Plant Physiol. 2011, 168, 204–212. [Google Scholar] [CrossRef]
  67. Li, J.; Qin, C.F.; Chen, N.D. Evaluation of antioxidant, antidiabetic and antiobesity potential of phenylpropanoids (PPs): Structure-activity relationship and insight into action mechanisms against dual digestive enzymes by comprehensive technologies. Bioorg. Chem. 2024, 146, 107290. [Google Scholar] [CrossRef] [PubMed]
  68. Liu, X.Q.; Xie, Z.Y.; Xin, J.J.; Yuan, S.Q.; Liu, S.; Sun, Y.Y.; Zhang, Y.Y.; Jin, C. OsbZIP18 is a positive regulator of phenylpropanoid and flavonoid biosynthesis under UV-B radiation in rice. Plants 2024, 13, 498. [Google Scholar] [CrossRef]
  69. Dong, B.Y.; Tang, H.M.; Zhu, D.Q.; Yao, Q.P.; Han, H.Q.; He, K.Q.; Ding, X.C. Benzothiazole treatment regulates the reactive oxygen species metabolism and phenylpropanoid pathway of Rosa roxburghii fruit to delay senescence during low temperature storage. Front. Plant Sci. 2021, 12, 753261. [Google Scholar] [CrossRef]
  70. Vogt, T. Phenylpropanoid biosynthesis. Mol. Plant 2010, 3, 2–20. [Google Scholar] [CrossRef]
  71. Schiestl, F.P. The evolution of floral scent and insect chemical communication. Ecol. Lett. 2010, 13, 643–656. [Google Scholar] [CrossRef] [PubMed]
  72. Lai, R.L.; Feng, X.; Chen, J.; Zhang, Y.Y.; Wei, X.X.; Chen, Y.T.; Cheng, C.Z.; Wu, R.J. De novo transcriptome assembly and comparative transcriptomic analysis provide molecular insights into low temperature stress response of Canarium album. Sci. Rep. 2021, 11, 1–17. [Google Scholar] [CrossRef] [PubMed]
  73. Zhang, L.Y.; Jiang, X.C.; Liu, Q.Y.; Ahammed, G.J.; Lin, R.; Wang, L.Y.; Shao, S.J.; Yu, J.Q.; Zhou, Y.H. The HY5 andMYB15 transcription factors positively regulate cold tolerance in tomato via the CBF pathway. Plant Cell Environ. 2020, 43, 2712–2726. [Google Scholar] [CrossRef] [PubMed]
  74. Qu, J.Q.; Li, L.; Liu, Y.N.; Lin, J.Y.; Li, B.; Xu, H.R.; Zeng, S.J.; Yuan, Z.N. Mining and analysis of key enzyme genes in phenylpropanoid synthesis pathway of lavender. Mol. Plant Breed. 2022, 1–14. Available online: http://kns.cnki.net/kcms/detail/46.1068.S.20221116.1549.022.html (accessed on 18 March 2025).
  75. Sun, X.C.; Yuan, J.J.; Li, J.P.; Chen, Y.H.; Zhang, B.Y.; Wang, H.Z. Genetic adaptation under drought stress for the synthesis of phenylpropanoid, sesquiterpenoids and triterpenoids in Codonopsispilosula. Chin. Tradit. Pat. Med. 2022, 44, 3902–3909. [Google Scholar] [CrossRef]
  76. Zeng, Z.; Chen, W.S.; Xiao, Y. The effects of essential metal ions on the biosynthesis of secondary metabolites in medicinal plants. Plant Physiol. J. 2022, 58, 597–606. [Google Scholar] [CrossRef]
  77. Chen, C.H. Studies on the Quality Formation Mechanism of Salt-Tolerant Medicinal Apocyni Veneti Folium Based on Multi-omics. Ph.D. Thesis, Nanjing University of Chinese Medicine, Nanjing, China, 2020. [Google Scholar] [CrossRef]
  78. Yang, L.; Wen, K.S.; Ruan, X.; Zhao, Y.X.; Wei, F.; Wang, Q. Response of Plant Secondary Metabolites to Environmental Factors. Molecules 2018, 23, 762. [Google Scholar] [CrossRef]
Figure 1. Morphology and habitat of S. obvallata. (A) The bracts forming a “greenhouse”. (B) Typical habitat of S. obv. (C) Bracts opening as fruits ripen. (D) Tubular floret, pappi, and fruit.
Genes 16 00593 g001
Figure 2. Sampling sites map of seven populations of S. obv.
Genes 16 00593 g002
Figure 3. Amplification of Primer 808 from 20 samples of Population 6.
Genes 16 00593 g003
Figure 4. Mantel test on genetic distance and geographic distance of seven populations of S. obv.
Genes 16 00593 g004
Figure 5. Correlation analysis between genetic diversity and climatic factors of seven populations of S. obv. * p < 0.05, ** p < 0.01.
Genes 16 00593 g005
Figure 6. Total ion chromatograms of S. obv ethanol extract. (A) Positive ion mode. (B) Negative ion mode.
Genes 16 00593 g006
Figure 7. PCA of metabolites from seven populations of S. obv.
Genes 16 00593 g007
Figure 8. Differential metabolites between every two populations of S. obv. Note: The red/blue numbers are the number of upregulated/downregulated differential metabolites in each comparable group.
Genes 16 00593 g008
Figure 9. Classification of differential metabolites by HMDB database annotation.
Genes 16 00593 g009
Figure 10. Classification of differential metabolites by KEGG database annotation.
Genes 16 00593 g010
Figure 11. Classification of differential metabolites by LIPID MAPS database annotation.
Genes 16 00593 g011
Figure 12. KEGG pathway enrichment of differential metabolites of S. obv.
Genes 16 00593 g012aGenes 16 00593 g012b
Figure 13. Pathway diagram. (A) Flavone and flavonol biosynthesis pathway. (B) Phenylpropanoid biosynthesis pathway. Note: The compounds with red label are those identified in S. obv.
Genes 16 00593 g013
Figure 14. Correlation analysis between differential metabolites, environmental factors, and genetic diversity. * p < 0.05, ** p < 0.01. *** p < 0.001.
Genes 16 00593 g014
Table 1. Geographical characteristics of seven populations of S. obv.
Site No.LocationLongitude (E)Latitude (N)Altitude (m)Specimen No.
1Duoda village, Xiayadong town, Yadong county, Xigaze City, Xizang89°04′21″28°02′21″4150542334220721001
2Zhuola mountain, Xiayadong town, Yadong county, Xigaze City, Xizang88°48′55″27°26′09″4300542334220722001
3Shangyadong town, Yadong county, Xigaze City, Xizang89°38′01″28°15′46″4020542334220722004
4Kangbu town, Yadong county, Xigaze City, Xizang88°58′44″27°51′23″4210542334220723001
5Chentang town, Dingjie county, Xigaze City, Xizang87°42′02″28°26′06″4050540231220724001
6Sejila Mountain, Bayi District, Nyingchi City, Xizang95°05′09″30°01′58″4598540402220727001
7Lebugou, Cuona county, Shannan City, Xizang91°51′10″27°55′15″4020540530220807001
Table 2. Annealing temperature, bands, and polymorphism.
PrimerBest Annealing Temperature (°C)BandsPolymorphic Bands
808521010
8095277
811521010
8125299
8144899
817481010
8185299
8195288
8295299
8424888
8504866
8514888
8524899
8624866
8654877
8674899
884481111
886481515
889481515
890481010
Table 3. Intra-population genetic diversity of seven populations of S. obv.
PopulationNpPPLNaNeHI
16058.25%1.58251.24780.16070.2549
26462.14%1.62141.22430.15050.2443
37875.73%1.75731.39090.23750.3641
48279.61%1.79611.39760.24360.3751
54745.63%1.45631.11220.08340.1454
68986.41%1.86411.44390.26980.4145
79390.29%1.90291.38340.24340.3852
Average73.2971.15%1.71151.31430.19840.3119
Np: No. of polymorphic loci; PPL: percentage of polymorphic loci; Na: No. of observed alleles; Ne: No. of effective alleles; H: Nei’s gene diversity; I: Shannon’s information index.
Table 4. AMOVA analysis of seven populations of S. obv.
Source of DifferentiationdfSSMSEst. VarProportionFstp
Inter-population6152.05025.3420.91311%0.1140.001
Within population133940.8507.0747.07489%
Total1391092.900 7.987100%
df: degree of freedom; SS: sum of standard deviation; MS: mean of standard deviation; Est. Var: estimated variance; Fst: genetic differentiation index.
Table 5. Genetic identity and genetic distance among seven populations of S. obv.
Population1234567
1-0.32160.56800.35670.36870.78020.3808
20.7250-0.32160.44370.20250.56800.3216
30.56670.7250-0.26570.36870.55340.5978
40.70000.64170.7667-0.39300.58280.5680
50.69170.81670.69170.6750-0.51080.3448
60.45830.56670.57500.55830.6000-0.5248
70.68330.72500.55000.56670.70830.5917-
Note: Below diagonal is genetic identity, and above diagonal is genetic distance.
Table 6. Climatic factors of seven sampling sites.
Site No.Temperature (°C)Moisture Content (‰)Rainfall (mm)Short-Wave Radiation (W/m2)Long-Wave Radiation (W/m2)
10.794.94421.58219.48247.21
20.178.04799.36210.51275.18
3−2.045.60445.67224.91232.37
40.376.29572.15216.67273.95
52.014.21504.26236.87244.89
6−1.435.74830.57174.22283.36
71.985.93648.25204.3263.56
Disclaimer/Publisher’s Note: The statements, opinions and data contained in all publications are solely those of the individual author(s) and contributor(s) and not of MDPI and/or the editor(s). MDPI and/or the editor(s) disclaim responsibility for any injury to people or property resulting from any ideas, methods, instructions or products referred to in the content.

