Abstract
Background: Chalcone synthase (CHS) functions as a pivotal and initiating enzyme in the flavonoid biosynthesis pathway within plants, playing a crucial role in the accumulation and metabolic processes of flavonoids. Despite its importance, there has been no comprehensive analysis or detailed description of the CHS gene family members specifically in Tartary buckwheat. Methods: Based on a comprehensive analysis using multiple bioinformatics approaches and quantitative real−time PCR (qRT−PCR) technology, this study systematically identified and characterized the CHS gene family members from the complete genome sequence of Tartary buckwheat. Results: In this study, we identified a total of 14 FtCHS genes (FtCHS1−FtCHS14) in Tartary buckwheat. Analysis of gene structure and protein motifs showed that most FtCHS genes consist of two exons and a single intron, featuring conserved Chal−sti−synt_N and Chal−sti−synt_C domains. Phylogenetic studies suggested that FtCHS genes can be categorized into four primary groups: Groups I, II, III, and IV. Further analysis of the promoter regions revealed that the FtCHS family genes contain multiple cis−acting elements that respond to light, plant hormones, stress, and developmental cues. By combining phylogenetic analysis with gene expression data, we found that the genes in Group II (FtCHS3, FtCHS4, FtCHS5, and FtCHS6) exhibit significantly elevated expression levels specifically in flowers. Conclusions: Our study indicated that FtCHS is a gene superfamily comprising at least four functional members. The expression patterns of these FtCHS genes suggest their probable involvement in flower−related biological processes in Tartary buckwheat. This work provides fundamental insights into the comprehensive understanding of the functional roles of the CHS gene family in Tartary buckwheat.
1. Introduction
Flavonoids, a diverse class of important secondary metabolites, are ubiquitously present in vegetables, fruits, cereals, herbs, tea, and other plants [1,2,3]. As of now, over 10,000 flavonoid compounds have been extracted and chemically identified [2]. These compounds fulfill essential functions in various aspects of plant physiology, including seed development, fruit ripening, flower pigmentation, pollination, auxin transport, and as signaling molecules in plant–microorganism interactions [4]. Plants also employ flavonoids to alleviate both biotic and abiotic stresses [5]. For instance, specific flavonoids function as pigments in fruits and flowers, which not only attract pollinators but also offer protection against herbivores, bacterial and fungal pathogens, and environmental stressors such as UV radiation [5]. The synthesis of these compounds takes place at the convergence of the shikimate and acetate pathways. The shikimate pathway provides precursors for coumarin CoA synthesis, while the acetate pathway supplies malonyl−CoA units that are critical for C2 elongation catalyzed by chalcone synthase [6].
Chalcone synthase (CHS, E.C. 2.3.1.74), a key enzyme within the type III polyketide synthase (PKS) superfamily, is crucial for the flavonoid biosynthesis pathway [7]. This enzyme facilitates the condensation of one molecule of p−coumaroyl-CoA with three molecules of malonyl−CoA, resulting in the formation of naringenin chalcone (Figure 1). Naringenin chalcone acts as a precursor for a variety of flavonoid compounds [6]. Thus far, numerous CHS genes have been identified across different plant species [8,9,10,11]. These genes generally show high nucleotide similarities and encode proteins with molecular weights between 20 and 62 kDa [8,9,10,11]. The encoded proteins feature a catalytic triad of Cys−His−Asn (CHN) at their active sites [12]. Additionally, CHS genes exhibit diverse expression patterns and are characterized by specific tissue distribution. For example, in Cassia alata, three CHS genes (CalCHS1, CalCHS2, and CalCHS3) are predominantly expressed in young roots [13]. In Pisum sativum, PsCHS1, PsCHS2 and PsCHS8 are expressed in both roots and flowers, while PsCHS3, PsCHS4 and PsCHS5 exhibit root−specific expression [14]. Given their critical roles in multiple biological processes, the regulatory and functional aspects of CHS genes have been extensively studied in various plant species, including Arabidopsis thaliana [15], Oryza sativa [16], Zea mays [17], Gossypium barbadense [8], Solanum lycopersicum [18], Salvia miltiorrhiza [19], Rhododendron delavayi [20], and Zostera marina [21]. Therefore, a comprehensive analysis of the CHS gene family is necessary for further elucidating its function and regulatory mechanisms in plant flavonoid biosynthesis.
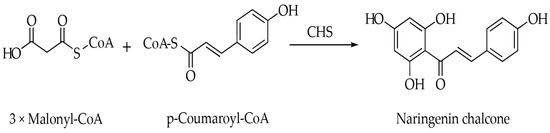
Figure 1.
Reaction scheme shows CHS catalyzing the condensation of three malonyl−CoA molecules with p−coumaroyl−CoA to produce naringenin chalcone.
Tartary buckwheat (Fagopyrum tataricum), belonging to the eudicot family Polygonaceae, is a significant minor cereal crop noted for its rich flavonoid content, especially rutin and quercetin, both of which are renowned for their health−promoting properties [22]. To date, multiple genes associated with flavonoid biosynthesis have been identified and functionally characterized in this crop. These include the UDP−glycosyltransferase gene FtUGT79A15 [23] and transcription factor genes such as FtMYB3 [24], FtMYB6 [25], FtMYB8 [26], FtMYB102 [27], FtbHLH4 [27], FtbZIP85 [28], FtBPM3 [29,30], FtERF-EAR3 [30], and FtTT8 [31]. Previous transcriptome studies have identified 11 putative homologous CHS genes in Tartary buckwheat [32], of which only three have been successfully cloned [33]. The completion of the whole genome assembly of Tartary buckwheat in 2017 has facilitated comprehensive investigations into various flavonoid synthesis−related gene families [34]. Hence, conducting a genome−wide identification and comprehensive analysis of the CHS gene family in Tartary buckwheat is valuable for gaining deeper insights into its essential characteristics and roles within the flavonoid synthesis pathway.
In this study, we discovered a total of 14 CHS genes within the Tartary buckwheat genome. We performed a comprehensive analysis of these CHS gene family members, examining various aspects such as their protein physicochemical characteristics, chromosomal positions, gene duplication occurrences, phylogenetic relationships, gene structures, conserved motifs, protein sequence features, and promoter elements. Furthermore, we investigated their tissue−specific expression patterns using qRT−PCR. This work offers a crucial foundation for understanding the roles of CHS gene family members in regulating flavonoid biosynthesis in Tartary buckwheat. Also, it may provide promising candidate genes for accelerating the development of high-flavonoid varieties through molecular breeding in future research.
2. Materials and Methods
2.1. Plant Materials and Sample Collection
The experiment utilized Tartary buckwheat (cv. Xiqiao 2) as the plant material, which was cultivated in flower pots under natural conditions with ambient temperatures ranging from approximately 18 to 30 °C. After eight weeks, different plant tissues, including roots, stems, leaves, flowers, and seeds, were harvested for subsequent analysis. All samples were immediately submerged in the RNAsafer II reagent (Omega Bio−Tek, Norcross, GA, USA) and rapidly frozen in liquid nitrogen for 30 s. They were subsequently stored at −80 °C until RNA extraction was conducted. To ensure RNA integrity and reliable gene expression results, the entire workflow, from sampling to RNA extraction, should be completed within two weeks.
2.2. Genome−Wide Identification of the CHS Family Members in Tartary Buckwheat
Firstly, we retrieved the complete genome data, encompassing genome sequences, protein sequences, and genome annotation files from the Tartary buckwheat genome database, MBKbase (https://www.mbkbase.org/Pinku1/ (accessed on 8 January 2025)) [34]. To identify CHS proteins in Tartary buckwheat, we conducted BLASTP searches against the Tartary buckwheat protein dataset using previously reported CHS protein sequences from O. sativa [16], G. barbadense [8], Chrysanthemum nankingense [9], and Vaccinium corymbosum [11] as queries, with an e−value threshold of less than 1.0 × 10⁻¹⁰. The putative CHS proteins were validated by screening for Hidden Markov Model (HMM) domain profiles (PF00195 and PF02797) using HMMER 3.2.1 software [35]. To further validate the candidate FtCHS proteins, we cross−referenced them using the InterPro database (http://www.ebi.ac.uk/interpro/ (accessed on 10 January 2025)) [36] and the NCBI−CDD search tool (https://www.ncbi.nlm.nih.gov/Structure/cdd/wrpsb.cgi (accessed on 10 January 2025)) [37]. This process confirmed the presence of both the Chal−sti−synt_N domain (PF00195) and the Chal−sti−synt_C domain (PF02797). Only those sequences that included these two domains were considered as members of the FtCHS gene family for further analysis. Moreover, we utilized the ExPASy website (https://web.expasy.org/protparam/ (accessed on 14 January 2025)) [38] to determine the fundamental physicochemical properties of each FtCHS protein. Additionally, the subcellular localization of these proteins was predicted using the Cell−PLoc online tool (http://www.csbio.sjtu.edu.cn/bioinf/Cell-PLoc/ (accessed on 14 January 2025)) [39].
2.3. Chromosomal Location and Gene Duplication Analysis of FtCHS Genes
The analysis presented in this section was conducted using TBtools−II software [40]. The chromosomal position information for the FtCHS genes was derived from the genome annotation file of Tartary buckwheat. To visualize chromosomal localization, we employed the “Gene Location Visualize from GTF/GFF” tool within TBtools−II [40]. Gene duplication analysis was performed using the “Quick Run MCScanX” tool, and the Ka and Ks values for duplicated genes were calculated using the “Simple Ka/Ks Calculator” tool.
2.4. Phylogenetic Analysis of FtCHS Genes
The phylogenetic analysis of FtCHS proteins was constructed using MEGA 11 software [41]. Homologous CHS proteins from various plant species were obtained from GenBank (Table S1). The protein sequences were aligned utilizing the MUSCLE algorithm, and an unrooted phylogenetic tree was constructed employing the neighbor−joining (NJ) method. The tree was based on a bootstrap analysis of 1500 replicates under the JTT amino acid substitution model. Visualization and editing of the final phylogenetic tree were performed using FigTree v1.4.4 software (http://tree.bio.ed.ac.uk/software/figtree/ (accessed on 15 January 2025)).
2.5. Gene Structures, Conserved Motifs, and Sequence Features of FtCHS Genes
The exon−intron architecture of the FtCHS genes was examined utilizing the “Visualize Gene Structure” tool in TBtools−II [40]. To detect conserved motifs within each FtCHS protein, we employed the MEME Suite (https://meme-suite.org/meme/ (accessed on 16 January 2025)) [42] with the following settings: a maximum of 20 motifs, motif width ranging from 6 to 200 amino acids (aa), and an e−value threshold of less than 1.0 × 10⁻¹⁰. The detected conserved motifs were subsequently visualized using the “Visualize MEME/MAST Motif Pattern” function in TBtools−II [40].
Drawing from the crystal structure analysis of MsCHS2 protein from Medicago sativa [43], we adopted its secondary structure as a reference model to investigate the secondary structures of the FtCHS proteins. This investigation was carried out using two web−based platforms: RCSB PDB (https://www.rcsb.org/ (accessed on 16 January 2025)) [44] and ESPript 3.0 (https://espript.ibcp.fr/ESPript/cgi-bin/ESPript.cgi (accessed on 16 January 2025)) [45]. Furthermore, a multiple sequence alignment involving MsCHS2, FtCHSs, and additional plant CHS proteins was executed using the MUSCLE program within MEGA 11 [41].
2.6. Promoter Element Analysis of FtCHS Genes
For promoter analysis, the 2000 base pair (bp) region upstream of the start codon (ATG) for all FtCHS genes was extracted. To identify cis−acting elements, the online tool PlantCARE (http://bioinformatics.psb.ugent.be/webtools/plantcare/html/ (accessed on 20 January 2025)) [46] was employed. Following this, the identified elements were counted and subjected to further analysis using Excel 2019.
2.7. Tissue Expression Analysis of FtCHS Genes
To isolate total RNA from the plant samples, the E.Z.N.A. ® Plant RNA Kit supplied by Omega Bio−Tek (Norcross, GA, USA) was utilized. Following this, 1 μg of the extracted total RNA from every sample underwent reverse transcription into single−stranded cDNA templates using the PrimeScriptTM RT reagent Kit with gDNA Eraser from TaKaRa (Dalian, China), adhering to the protocol provided by the manufacturer. The design of gene−specific primers for qRT−PCR was accomplished through Primer Premier 5.0 software (Table S2). For normalization purposes, Histone 3 (H3, HM628903.1) functioned as the reference gene. Each PCR reaction mixture was prepared to a final volume of 25 µL, including 12.5 µL of TB Green® Premix Ex Taq II (2X) (TaKaRa, Dalian, China), 1.0 µL forward primer at a concentration of 10 µM, 1.0 µL reverse primer at 10 µM, 2.0 µL of cDNA template (with a total amount not exceeding 100 ng), and 8.5 µL of sterile distilled water. The amplification conditions for qRT−PCR involved an initial denaturation step at 95 °C for 30 s, succeeded by 40 cycles of denaturation at 95 °C for 5 s and annealing/extension at 60 °C for 30 s. Each sample was subjected to three independent biological replicates, and the relative expression levels of genes were calculated using the 2−∆∆Ct method [47].
3. Results
3.1. Identification of the CHS Gene Family Members in Tartary Buckwheat
Through protein homology alignment and conserved domain identification, a total of 14 CHS gene family members were identified in the Tartary buckwheat genome. These genes were designated as FtCHS1 to FtCHS14 based on their chromosomal positions (Table 1). The open reading frames (ORFs) of the FtCHS genes ranged from 1035 to 1188 bp, with corresponding coding sequences (CDSs) ranging from 1032 to 1185 bp. The physicochemical characteristics of the FtCHS proteins are outlined in Table 2. The length of FtCHS proteins varied from 344 to 395 aa, corresponding to molecular weights (Mw) between 37,702.24 and 43,728.64 Da. The isoelectric points (pI) ranged from 5.38 to 7.58, with the majority (13/14) being below 7.0 (except for FtCHS6), indicating that these proteins were predominantly acidic. Instability index analysis revealed that most (11/14) were stable proteins, with an instability index below 40.0 (except for FtCHS2, FtCHS11, and FtCHS12). Grand average of hydropathicity (GRAVY) analysis indicated that, except for FtCHS7, the other 13 FtCHS proteins exhibited hydrophilic properties (GRAVY values < 0). Subcellular localization analysis predicted that all FtCHS proteins were located within the cytoplasm.

Table 1.
Identification of the CHS gene family members in Tartary buckwheat.
Table 2.
The physicochemical properties of the FtCHS proteins.
3.2. Chromosomal Location and Gene Duplication
Chromosome localization analysis demonstrated that the 14 FtCHS genes were unevenly distributed across five chromosomes: Chr1, Chr2, Chr4, Chr5, and Chr7 (Figure 2a). Chr7 contained the highest number of FtCHS genes (five), followed by Chr2 with four genes. Chr4 and Chr5 each had two genes, while Chr1 harbored only one. Gene family expansion can result from gene duplication events such as tandem and segmental duplications, which are crucial for driving gene family diversification during evolution [48]. In our investigation of duplication events within the FtCHS gene family, we identified a tandem duplication involving the gene pair FtCHS3 and FtCHS4 on Chr2 (Figure 2a). Notably, no segmental duplications were detected in this gene family. Furthermore, the Ka/Ks ratio for the duplicated gene pair FtCHS3 and FtCHS4 was less than 1.0 (Figure 2b), indicating purifying selection and suggesting a high level of conservation within this gene family.
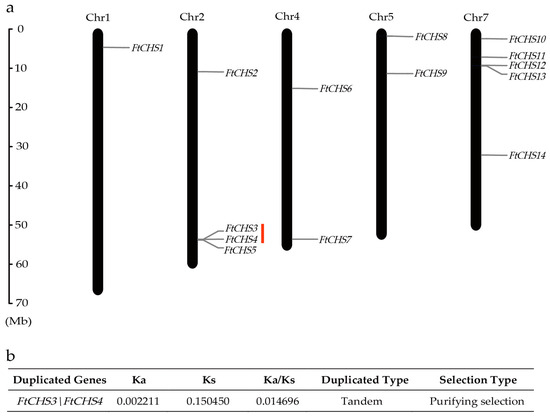
Figure 2.
Analysis of chromosome location and gene duplication for FtCHS genes. (a) Distribution of FtCHS genes across chromosomes. The “Chr” label above each bar denotes the chromosome number in Tartary buckwheat. (b) Analysis of the Ka/Ks ratio for duplicated FtCHS genes. Tandemly repeated genes are indicated with a red line.
3.3. Phylogenetic Analysis and Classification of FtCHS Genes
To investigate the phylogenetic relationships of CHS genes in plants, a neighbor−joining (NJ) approach was utilized to construct a phylogenetic tree using 51 protein sequences derived from various plant species (Figure 3). The resulting analysis categorized plant CHS proteins into five distinct groups: Groups I, II, III, IV, and V. Remarkably, 14 FtCHS proteins were distributed among four of these groups (I−IV). Group I consisted of FtCHS1 and FtCHS10, which grouped closely with characterized CHS−like proteins from other plants, such as A. thaliana AtCHSL and Nicotiana sylvestris NsCHSL. Notably, NsCHSL has been confirmed as an anther−specific CHS−like (ASCL) enzyme [49], suggesting that FtCHS1 and FtCHS10 may also possess ASCL functionality. Group II consisted of FtCHS3, FtCHS4, FtCHS5, and FtCHS6, which clustered with CHS proteins from Petunia hybrida (PhCHSB), Antirrhinum majus (AmCHS), Psilotum nudum (PnCHS), and Physcomitrella patens (PpCHS). PpCHS is recognized as one of the earliest identified CHS enzymes [50]. In contrast, the remaining eight FtCHS proteins in Groups III and IV did not cluster with any homologous CHS proteins from other plants, indicating a more distant evolutionary relationship relative to other plant CHS proteins.
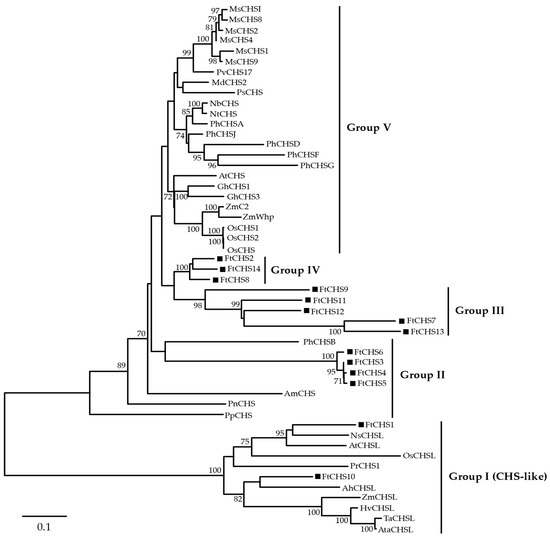
Figure 3.
Molecular phylogenetic analysis of chalcone synthases (CHSs) from multiple plant species. CHS proteins from additional plants are detailed in Table S2. FtCHS proteins are highlighted with black squares. Bootstrap values ≥ 70% are indicated.
3.4. Gene Structures of FtCHS Genes
The exon−intron organization of FtCHS genes was determined by aligning the mRNA sequences with their respective genomic sequences. The number of exons in the FtCHS gene family varied from two to eight. Notably, members belonging to the same subfamily displayed highly similar exon−intron structures (Figure 4). Groups I and II consistently displayed a two−exon structure, while Group IV contained either two or three exons. Genes in Group III generally possessed a greater number of exons and longer introns compared to other groups. For instance, the FtCHS9 gene, spanning over 10 kb and comprising 8 exons and 7 introns, was identified as the longest gene in the FtCHS gene family. Its first four exons encoded the coding sequence (CDS), while the last four exons entirely constituted the 3’ untranslated region (UTR). Overall, the analysis of the gene structure showed that most members (8/14) of the CHS gene family in Tartary buckwheat shared a common gene architecture, featuring two exons and a single intron.
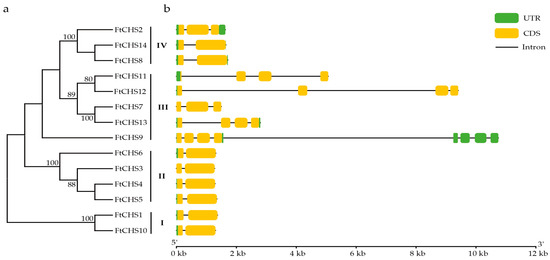
Figure 4.
Phylogenetic analysis and gene structures of FtCHS genes. (a) Phylogenetic analysis of FtCHS genes, showing bootstrap support values of ≥70%. (b) Exon and intron organization of FtCHS genes.
3.5. Conserved Motifs and Sequence Features of FtCHS Proteins
In the FtCHS proteins, a total of fifteen conserved motifs (motifs 1−15) were identified (Figure 5). The number of conserved motifs varied among proteins, ranging from 4 to 10. Proteins belonging to the same phylogenetic group showed comparable motif compositions and arrangements. Notably, motifs 1 and 3−6 were found within the Chal−sti−synt_N domain, whereas motifs 2, 7, and 8 were positioned within the Chal−sti−synt_C domain (Table 3). Apart from FtCHS11, which was missing part of its Chal−sti−synt_N domain, all other FtCHS proteins exhibited well-conserved Chal−sti−synt_N and Chal−sti−synt_C domains (Figure 5). These motifs, particularly those containing the Chal−sti−synt_N and Chal−sti−synt_C domains, suggested their potential significance in CHS protein function. Additionally, three active site residues, Cys164, His303, and Asn336, were, respectively, located in motifs 1, 2, and 7 (Figure 5 and Figure 6 and Table 3). The Cys−His−Asn (CHN) catalytic triad, inherited from ancestral type III polyketide synthases (PKS III) [7,51], remained highly conserved among all FtCHS proteins (Figure 6). Notably, some short motifs (motifs 11−15) were predominantly found in either Group I or Group III (Figure 5), indicating high variability in the N-terminal motifs of FtCHS proteins.
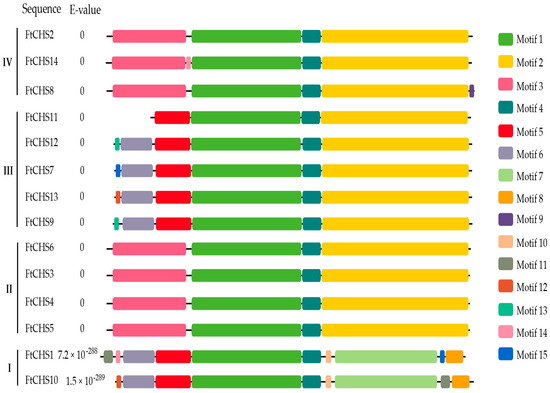
Figure 5.
Conserved motif analysis of FtCHS proteins. Various conserved motifs are indicated by distinct colors. The labels I, II, III, and IV on the left side of the image correspond to FtCHS proteins in phylogenetic groups I, II, III, and IV, respectively.
Table 3.
Detailed information of the 15 conserved motifs in FtCHS proteins.
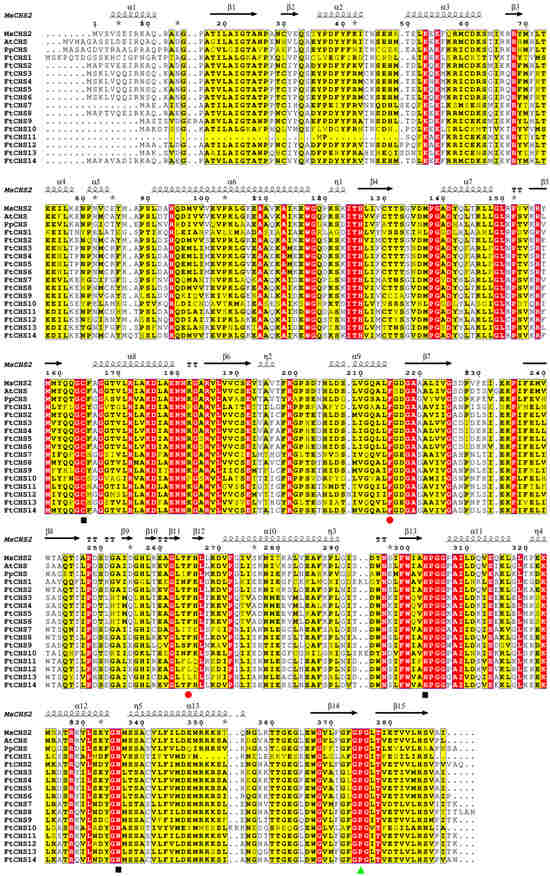
Figure 6.
Multiple sequence alignment of FtCHS proteins in comparison with CHSs from other plants. The secondary structure of MsCHS2 is depicted in the top line, where red segments highlight strictly conserved sequences. α−helices are indicated by black wavy lines, while β−sheets are denoted by black arrows. At the bottom, black squares highlight the Cys−His−Asn (CHN) catalytic triad, while red dots indicate CoA−binding residues, and green triangles emphasize the CHS family−specific Pro375 residue. Protein sequences for M. sativa MsCHS2 (AAA02824.1), A. thaliana AtCHS (AAA32771.1), and P. patens PpCHS (ABB84527.1) were obtained from the GenBank.
The well-characterized “gatekeeper” phenylalanine residues at positions 215 and 265 of CHS proteins, which are critical for CoA−binding [51], are also conserved. Position 215 was strictly conserved in all FtCHS proteins, while position 265 was highly conserved in most (10/14) FtCHS proteins, with the exception of FtCHS7, FtCHS11, FtCHS12, and FtCHS13 (Figure 6). Notably, FtCHS7 exhibited an amino acid substitution from phenylalanine to threonine (F265T), whereas FtCHS11, FtCHS12, and FtCHS13 displayed a substitution from phenylalanine to leucine (F265L). These substitutions likely resulted in remarkable functional alterations that could influence substrate specificity. Furthermore, the Pro375 residues, which are specific to the CHS family [51], were consistently conserved in all FtCHS proteins (Figure 6). These results suggested strong sequence similarity between FtCHSs and MsCHS2, as well as other plant CHSs, indicating that the CHS family remains evolutionarily conserved.
3.6. Analysis of Promoter Cis-Regulatory Elements in FtCHS Genes
The analysis of the FtCHS gene promoters involved evaluating the 2 kb upstream regions from the ATG start codon for each gene. Besides identifying core promoter elements like the TATA−box and CAAT−box, four types of cis−regulatory elements were detected: those responsive to light, hormones, stress, and developmental factors (Figure 7). A total of 22 unique light−responsive elements were observed across the FtCHS genes, with each gene containing between 8 and 9 different types (Figure 7a). Notably, the G−box element was present in nearly all FtCHS genes except FtCHS2, acting as a key regulatory factor in plant responses to environmental changes. Previous research indicated that mutations in the G−box led to the loss of UV−B induction responsiveness for the cytochrome c oxidase gene COX5b−2 in A. thaliana [52]. Additionally, Box 4 and GT1−motif were frequently identified in 9 and 10 FtCHS genes, respectively (Figure 7a). These three elements, G−box, Box 4, and GT1−motif, are the most prevalent light−responsive elements in the FtCHS genes (Figure 7a,b). Nine hormone−related elements were also identified, including those associated with abscisic acid (ABA) (ABRE), auxin (AUX) (AuxRR−core and TGA−element), methyl jasmonate (MeJA) (CGTCA−motif and TGACG−motif), gibberellin (GA) (GARE−motif, P−box, and TATC−box), and salicylic acid (SA) (TCA−element) (Figure 7a). The ABRE element was found in all FtCHS genes, while seven genes contained both the CGTCA−motif and the TGACG−motif. These three elements (ABRE, CGTCA−motif, and TGACG−motif) are the most abundant hormone−responsive elements in the FtCHS genes (Figure 7b), indicating that AUX and MeJA significantly influence the expression of FtCHS genes. Moreover, anaerobic conditions activated the ARE element, and low temperatures triggered the LTR element. Both ARE and LTR elements were present in over 60% of FtCHS genes (Figure 7a). The fourth category primarily comprised development−related elements such as the CAT−box, Circadian, and O2−site, which regulated meristem expression, cell cycle progression, and zein metabolism, respectively. Collectively, these FtCHS genes could play a role in light responses, hormone signaling pathways, stress responses, and development−related processes.
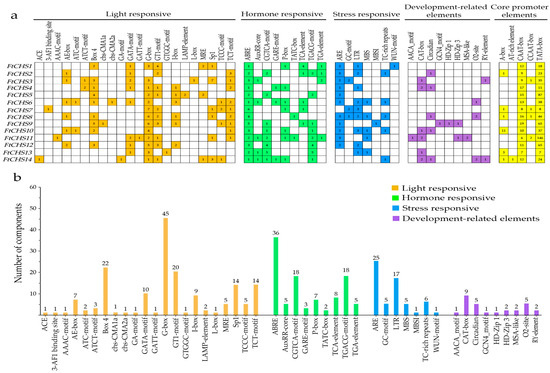
Figure 7.
Examination of cis−regulatory elements within the promoters of FtCHS genes. (a) Types and distribution of various cis−regulatory elements across each FtCHS gene promoter. (b) Numbers of different types of cis−regulatory elements.
3.7. Tissue Expression Patterns of FtCHS Genes
In this study, qRT−PCR analysis of FtCHS gene expression across various tissues of Tartary buckwheat, including roots, stems, leaves, flowers, and seeds, revealed distinct tissue−specific patterns among different FtCHS genes (Figure 8). Notably, five FtCHS genes, FtCHS3, FtCHS4, FtCHS5, FtCHS6, and FtCHS14, showed significantly elevated expression levels specifically in floral organs. Likewise, FtCHS7 and FtCHS13 exhibited the greatest expression levels in stems. Typically, the expression patterns of genes can provide insight into their specific functions; thus, the observed similarities in expression patterns among these FtCHS genes may suggest potential shared biological roles. Additionally, FtCHS8 demonstrated consistently high expression levels in both flowers and seeds. Conversely, other FtCHS genes (FtCHS1, FtCHS2, FtCHS9, FtCHS10, and FtCHS11) displayed variable expression levels across different tissues. Finally, the expression of FtCHS12 was nearly undetectable in all examined tissues, indicating its likely non−functional role or limited involvement in the growth and development of Tartary buckwheat.
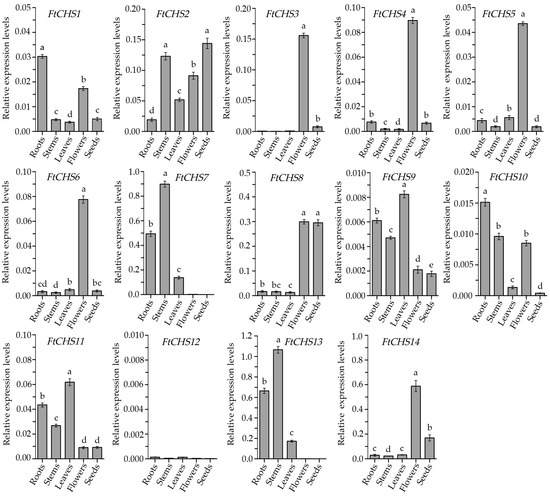
Figure 8.
Expression levels of FtCHS genes in different tissues. Tissues labeled with different lowercase letters show significant differences (p < 0.05) in expression levels.
4. Discussion
Members of the CHS gene family are recognized for their essential roles in regulating the growth and development of plants [53,54]. The number of CHS genes differs markedly among various plant species. For example, A. thaliana has a single CHS gene [55], whereas Prunus avium [54], Brassica rapa [10], C. nankingense [9], G. barbadense [8], V. corymbosum [11], and Triticum aestivum [56] possess 3, 10, 16, 20, 22, and 87 CHS genes, respectively. This diversity underscores the considerable variation in the number of CHS genes across different plant species. In Tartary buckwheat, a prior study identified 12 CHS genes [34]. Nevertheless, our thorough genome−wide analysis uncovered a total of 14 CHS genes in Tartary buckwheat. Among these, nine genes have been previously reported [34], whereas five novel members were identified: FtCHS1, FtCHS7, FtCHS10, FtCHS11, and FtCHS13 (Table 1). Furthermore, an earlier study reported 10 CHS genes in Tartary buckwheat [57]. However, only seven of these were found in our analyses. The discrepancy may be attributed to the updated version of the Tartary buckwheat genome annotation file, which has improved annotation accuracy and more precise gene family identification (https://www.mbkbase.org/Pinku1/ (accessed on 8 January 2025)). In large plant genomes, multi−gene families typically arise as a result of whole−genome duplication and domestication processes [58]. The genome of Tartary buckwheat has undergone an independent whole−genome duplication event after its divergence from a common ancestor [34]. Among the 14 FtCHS genes identified, one pair of tandemly duplicated genes (FtCHS3\FtCHS4) was observed, sharing 99.49% similarity in their amino acid sequences. The estimated Ka/Ks ratio for this duplicated FtCHS gene pair was found to be below 1.0 (Figure 2), indicating that these genes have experienced purifying selection. This process has led to the removal of deleterious mutations and the preservation of functional stability throughout their evolutionary history [59,60]. Therefore, it can be inferred that the expansion of the CHS gene family has likely contributed to the high flavonoid content characteristic of Tartary buckwheat.
Based on molecular evolution analysis, the majority of CHS genes can be grouped into two or more subfamilies [54]. In our study, all identified FtCHS genes were classified into four primary categories: Groups I, II, III, and IV, according to their phylogenetic relationships (Figure 3). In addition, FtCHS members within the same subgroup exhibited highly similar motif distributions and comparable exon−intron structures, suggesting they share similar fundamental functions (Figure 4 and Figure 5). Conserved motifs 1 and 3−6 were identified within the Chal−sti−synt_N domain, whereas motifs 2, 7, and 8 were localized in the Chal−sti−synt_C domain (Table 3). These two domains encompass a buried active site comprising several amino acid residues, including Cys164, Phe215, His303, and Asn336, which constitute the catalytic machinery [43,51]. The presence of these two structural domains across all FtCHS proteins suggested their conserved role in catalyzing chalcone compound formation (Table 3, Figure 5). Moreover, the catalytic triad composed of Cys−His−Asn (CHN), situated within motifs 1, 2, and 7, plays an essential role in catalytic activity and was identified in all FtCHS proteins (Table 3). This suggests that this catalytic triad, which has been inherited from the PKS III ancestor [51], exhibits high conservation. All FtCHS proteins contained the CHS family−specific Pro375 and CoA−binding residues (Phe215 and Phe265) (Figure 6), further supporting their conserved evolution, although some substitutions at position Phe265 probably resulted in different substrate preferences. Importantly, multiple sequence alignment of the identified FtCHS proteins with MsCHS2, AtCHS, and PpCHS revealed high similarity, suggesting conservation of the CHS family proteins across different plant species. Additionally, the analysis of gene structure and conserved motif corroborated the phylogenetic analysis and supported the hypothesis that FtCHS genes have remained highly conserved throughout evolution. Notably, most FtCHS genes (9/14) contained two exons and one intron (Figure 4), which is consistent with the previously proposed structure that is composed of two exons and one intron in other plants [8,9,10].
Gene expression patterns serve as a critical reflection of gene function, with genes sharing common evolutionary origins or regulated by the same transcription factors often exhibiting similar expression profiles [61,62]. Considering the varied roles of CHS genes, their expression levels can change in response to particular environmental conditions or may be specific to certain organs or developmental stages. In this investigation, we examined the expression levels of all 14 FtCHS genes across different tissues (Figure 8). Notably, several FtCHS genes exhibited variable expression patterns depending on the tissue type. For example, FtCHS1, FtCHS2, FtCHS9, FtCHS10, and FtCHS11 showed distinct expression levels across various tissues. Conversely, some FtCHS genes displayed highly similar expression patterns. Specifically, FtCHS3, FtCHS4, FtCHS5, and FtCHS6 were highly and specifically expressed in Tartary buckwheat flower organs (Figure 8). Furthermore, these four genes were clustered within the same subgroup (Group II) in the phylogenetic analysis (Figure 3), suggesting they may play analogous roles in the same biochemical pathway related to flowers. Previous studies have shown that rutin accumulation in Tartary buckwheat flowers is significantly higher compared to roots, stems, leaves and seeds [33,34]. Therefore, it is plausible that the specific expression of these four FtCHS genes in Tartary buckwheat flowers is associated with rutin synthesis and accumulation. Additional functional validation is required for these important FtCHS genes, as they are potentially implicated in the flavonoid synthesis pathway within Tartary buckwheat.
5. Conclusions
In this study, we identified and analyzed the fundamental characteristics of 14 FtCHS genes (FtCHS1−FtCHS14) from tartary buckwheat to explore their potential functions. Our analysis of gene architectures, conserved motifs, evolutionary patterns, and tissue−specific expression profiles revealed that the CHS gene family in tartary buckwheat has remained relatively conserved during evolution. By integrating tissue−specific expression data with phylogenetic relationships, we proposed that four FtCHS genes, FtCHS3, FtCHS4, FtCHS5, and FtCHS6, are likely to play analogous biological roles in tartary buckwheat flowers. This research enhances our understanding of FtCHS genes and contributes to the exploration of their molecular evolution, expression, and regulation. Moreover, it provides promising candidates for future functional studies.
Supplementary Materials
The following supporting information can be downloaded at https://www.mdpi.com/article/10.3390/genes16040451/s1, Table S1: CHS proteins from different plants for phylogenetic analysis; Table S2: Specific primers of FtCHS genes for qRT−PCR analysis.
Author Contributions
Conceptualization, Q.W.; methodology, Q.W. and Y.J.; software, Q.W. and Y.J.; validation, Q.W. and X.L.; formal analysis, Q.W., Y.J. and X.L.; investigation, Q.W., L.T. and H.D.; resources, A.W.; data curation, Q.W. and Y.J.; writing—original draft preparation, Q.W.; writing—review and editing, Q.W. and Y.J.; visualization, Q.W., Y.J. and X.L.; supervision, Q.W.; project administration, Q.W.; funding acquisition, Q.W. All authors have read and agreed to the published version of the manuscript.
Funding
This research was funded by the Open Project Program of Panxi Crops Research and Utilization Key Laboratory of Sichuan Province (No. XNFZ2201), the Ph.D. Programs Foundation of Xichang University (No. YBZ202311), and the Class D Talent Programs Foundation of Xichang University (No. D202409).
Institutional Review Board Statement
Not applicable.
Informed Consent Statement
Not applicable.
Data Availability Statement
The genome data utilized in this study were obtained from the Tartary buckwheat database (https://www.mbkbase.org/Pinku1/ (accessed on 8 January 2025)).
Conflicts of Interest
The authors declare no conflicts of interest.
References
- Shen, N.; Wang, T.; Gan, Q.; Liu, S.; Wang, L.; Jin, B. Plant flavonoids: Classification, distribution, biosynthesis, and antioxidant activity. Food Chem. 2022, 383, 132531. [Google Scholar]
- Chen, S.; Wang, X.; Cheng, Y.; Gao, H.; Chen, X. A review of classification, biosynthesis, biological activities and potential applications of flavonoids. Molecules 2023, 28, 4982. [Google Scholar] [CrossRef] [PubMed]
- Hussain, A.; Azam, S.; Maqsood, R.; Anwar, R.; Akash, M.S.H.; Hussain, H.; Wang, D.; Imran, M.; Kotwica-Mojzych, K.; Khan, S.; et al. Chemistry, biosynthesis, and theranostics of antioxidant flavonoids and polyphenolics of genus Rhododendron: An overview. N-S Arch. Pharmacol. 2025, 398, 1171–1214. [Google Scholar]
- Vicente, O.; Boscaiu, M. Flavonoids: Antioxidant compounds for plant defence and for a healthy human diet. Not. Bot. Horti Agrobot. Cluj. 2018, 46, 14–21. [Google Scholar] [CrossRef]
- Zhuang, W.B.; Li, Y.H.; Shu, X.C.; Pu, Y.T.; Wang, X.J.; Wang, T.; Wang, Z. The classification, molecular structure and biological biosynthesis of flavonoids, and their roles in biotic and abiotic stresses. Molecules 2023, 28, 3599. [Google Scholar] [CrossRef]
- Liu, W.; Feng, Y.; Yu, S.; Fan, Z.; Li, X.; Li, J.; Yin, H. The flavonoid biosynthesis network in plants. Int. J. Mol. Sci. 2021, 22, 12824. [Google Scholar] [CrossRef]
- Guo, D.; Wang, H.; Zhang, S.; Lan, T. The type III polyketide synthase supergene family in plants: Complex evolutionary history and functional divergence. Plant J. 2022, 112, 414–428. [Google Scholar] [CrossRef] [PubMed]
- Kong, X.; Khan, A.; Li, Z.; You, J.; Munsif, F.; Kang, H.; Zhou, R. Identification of chalcone synthase genes and their expression patterns reveal pollen abortion in cotton. Saudi J. Biol. Sci. 2020, 27, 3691–3699. [Google Scholar] [CrossRef] [PubMed]
- Zhu, L.; Ding, Y.; Wang, S.; Wang, Z.; Dai, L. Genome-wide identification, characterization, and expression analysis of CHS gene family members in Chrysanthemum nankingense. Genes 2022, 13, 2145. [Google Scholar] [CrossRef]
- Xie, Z.; Yang, L.; Fan, M.; Xuan, S.; Jia, X.; Zhang, Z.; Li, N.; Liu, M.; Zhao, J.; Li, J. Genome-wide identification, characterization and expression analysis of the chalcone synthase gene family in Chinese cabbage. BMC Genom. 2025, 26, 168. [Google Scholar] [CrossRef]
- Zhang, Z.; Qu, P.; Hao, S.; Li, R.; Zhang, Y.; Zhao, Q.; Wen, P.; Cheng, C. Characterization and functional analysis of chalcone synthase genes in highbush blueberry (Vaccinium corymbosum). Int. J. Mol. Sci. 2023, 24, 13882. [Google Scholar] [CrossRef] [PubMed]
- Imaizumi, R.; Mameda, R.; Takeshita, K.; Kubo, H.; Sakai, N.; Nakata, S.; Takahashi, S.; Kataoka, K.; Yamamoto, M.; Nakayama, T.; et al. Crystal structure of chalcone synthase, a key enzyme for isoflavonoid biosynthesis in soybean. Proteins Struct. Funct. Bioinform. 2021, 89, 126–131. [Google Scholar] [CrossRef] [PubMed]
- Samappito, S.; Page, J.; Schmidt, J.; De-Eknamkul, W.; Kutchan, T.M. Molecular characterization of root-specific chalcone synthases from Cassia alata. Planta 2002, 216, 64–71. [Google Scholar] [CrossRef]
- Ito, M.; Ichinose, Y.; Kato, H.; Shiraishi, T.; Yamada, T. Molecular evolution and functional relevance of the chalcone synthase genes of pea. Mol. Gen. Genet. 1997, 255, 28–37. [Google Scholar] [CrossRef]
- Nityagovsky, N.N.; Kiselev, K.V.; Suprun, A.R.; Dubrovina, A.S. Exogenous dsRNA induces RNA interference of a chalcone synthase gene in Arabidopsis thaliana. Int. J. Mol. Sci. 2022, 23, 5325. [Google Scholar] [CrossRef] [PubMed]
- Park, H.L.; Yoo, Y.; Bhoo, S.H.; Lee, T.H.; Lee, S.W.; Cho, M.H. Two chalcone synthase isozymes participate redundantly in UV-induced sakuranetin synthesis in rice. Int. J. Mol. Sci. 2020, 21, 3777. [Google Scholar] [CrossRef]
- Dong, H.; Li, H.; Xue, Y.; Su, S.; Li, S.; Shan, X.; Liu, H.; Jiang, N.; Wu, X.; Zhang, Z.; et al. E183K mutation in chalcone synthase C2 causes protein aggregation and maize colorless. Front. Plant Sci. 2021, 12, 679654. [Google Scholar] [CrossRef] [PubMed]
- Colanero, S.; Perata, P.; Gonzali, S. What’s behind purple tomatoes? Insight into the mechanisms of anthocyanin synthesis in tomato fruits. Plant Physiol. 2020, 182, 1841–1853. [Google Scholar] [CrossRef]
- Yu, Y.; Li, Z.; Wu, Y.; Xie, G.; Guo, Y.; Yang, Z. QTL mapping and identification of candidate genes for anthocyanidin accumulation in Salvia miltiorrhiza flowers. J. Hered. 2025, esaf004. [Google Scholar] [CrossRef]
- Huang, J.; Zhao, X.; Zhang, Y.; Chen, Y.; Zhang, X.; Yi, Y.; Ju, Z.; Sun, W. Chalcone-synthase-encoding RdCHS1 is involved in flavonoid biosynthesis in Rhododendron delavayi. Molecules 2024, 29, 1822. [Google Scholar] [CrossRef]
- Ma, M.; Zhong, M.; Zhang, Q.; Zhao, W.; Wang, M.; Luo, C. Phylogenetic implications and functional disparity in the chalcone synthase gene family of common sea grass Zostera marina. Front. Mar. Sci. 2021, 8, 760902. [Google Scholar] [CrossRef]
- Zou, L.; Wu, D.; Ren, G.; Hu, Y.; Peng, L.; Zhao, J.; Garcia-Perez, P.; Carpena, M.; Prieto, M.A.; Cao, H.; et al. Bioactive compounds, health benefits, and industrial applications of Tartary buckwheat (Fagopyrum tataricum). Crit. Rev. Food Sci. Nutr. 2023, 63, 657–673. [Google Scholar] [CrossRef]
- Xu, H.; Jiang, Z.; Lin, Z.; Yu, Q.; Song, R.; Wang, B. FtUGT79A15 is responsible for rutinosylation in flavonoid diglycoside biosynthesis in Fagopyrum tataricum. Plant Physiol. Biochem. 2022, 181, 33–41. [Google Scholar] [CrossRef]
- Wang, L.; Deng, R.; Bai, Y.; Wu, H.; Li, C.; Wu, Q.; Zhao, H. Tartary buckwheat R2R3-MYB gene FtMYB3 negatively regulates anthocyanin and proanthocyanin biosynthesis. Int. J. Mol. Sci. 2022, 23, 2775. [Google Scholar] [CrossRef] [PubMed]
- Yao, P.; Huang, Y.; Dong, Q.; Wan, M.; Wang, A.; Chen, Y.; Li, C.; Wu, Q.; Chen, H.; Zhao, H. FtMYB6, a light-induced SG7 R2R3-MYB transcription factor, promotes flavonol biosynthesis in tartary buckwheat (Fagopyrum tataricum). J. Agric. Food Chem. 2020, 68, 13685–13696. [Google Scholar] [CrossRef] [PubMed]
- Huang, Y.; Wu, Q.; Wang, S.; Shi, J.; Dong, Q.; Yao, P.; Shi, G.; Xu, S.; Deng, R.; Li, C.; et al. FtMYB8 from Tartary buckwheat inhibits both anthocyanin/Proanthocyanidin accumulation and marginal Trichome initiation. BMC Plant Biol. 2019, 19, 263. [Google Scholar]
- Mi, Y.; Li, Y.; Qian, G.; Vanhaelewyn, L.; Meng, X.; Liu, T.; Yang, W.; Shi, Y.; Ma, P.; Tul-Wahab, A.; et al. A transcriptional complex of FtMYB102 and FtbHLH4 coordinately regulates the accumulation of rutin in Fagopyrum tataricum. Plant Physiol. Biochem. 2023, 194, 696–707. [Google Scholar] [CrossRef]
- Liu, S.; Wang, J.; Liu, Z.; Yang, Y.; Li, X. FtbZIP85 is involved in the accumulation of proanthocyanidin by regulating the transcription of FtDFR in tartary buckwheat. Curr. Issues Mol. Biol. 2023, 45, 3375–3390. [Google Scholar] [CrossRef]
- Ding, M.; Zhang, K.; He, Y.; Zuo, Q.; Zhao, H.; He, M.; Georgiev, M.I.; Park, S.U.; Zhou, M. FtBPM3 modulates the orchestration of FtMYB11-mediated flavonoids biosynthesis in Tartary buckwheat. Plant Biotechnol. J. 2021, 19, 1285–1287. [Google Scholar] [CrossRef]
- Ding, M.; He, Y.; Zhang, K.; Li, J.; Shi, Y.; Zhao, M.; Meng, Y.; Georgiev, M.I.; Zhou, M. JA-induced FtBPM3 accumulation promotes FtERF-EAR3 degradation and rutin biosynthesis in Tartary buckwheat. Plant J. 2022, 111, 323–334. [Google Scholar] [CrossRef]
- Deng, J.; Wang, L.; Zhang, L.; Yang, C.; Huang, J.; Zhu, L.; Chen, Q.; Meng, Z.; Cai, F.; Shi, T. Tartary buckwheat (Fagopyrum tataricum) FtTT8 inhibits anthocyanin biosynthesis and promotes proanthocyanidin biosynthesis. Int. J. Mol. Sci. 2023, 24, 17368. [Google Scholar] [CrossRef]
- Yao, H.; Li, C.; Zhao, H.; Zhao, J.; Chen, H.; Bu, T.; Anhu, W.; Wu, Q. Deep sequencing of the transcriptome reveals distinct flavonoid metabolism features of black tartary buckwheat (Fagopyrum tataricum Garetn.). Prog. Biophys. Mol. Biol. 2017, 124, 49–60. [Google Scholar] [CrossRef] [PubMed]
- Yao, P.; Zhao, H.; Luo, X.; Gao, F.; Yao, H.; Li, C.; Chen, H.; Wu, Q. Chalcone synthase homologous genes cloning and expression pattern in flowering Fagopyrum tataricum Gaertn. Russ. J. Plant Phys. 2016, 63, 790–799. [Google Scholar] [CrossRef]
- Zhang, L.; Li, X.; Ma, B.; Gao, Q.; Du, H.; Han, Y.; Li, Y.; Cao, Y.; Qi, M.; Zhu, Y.; et al. The tartary buckwheat genome provides insights into rutin biosynthesis and abiotic stress tolerance. Mol. Plant 2017, 10, 1224–1237. [Google Scholar] [CrossRef]
- Potter, S.C.; Luciani, A.; Eddy, S.R.; Park, Y.; Lopez, R.; Finn, R.D. HMMER web server: 2018 update. Nucleic Acids Res. 2018, 46, W200–W204. [Google Scholar] [CrossRef] [PubMed]
- Blum, M.; Andreeva, A.; Florentino, L.C.; Chuguransky, S.R.; Grego, T.; Hobbs, E.; Pinto, B.L.; Orr, A.; Paysan-Lafosse, T.; Ponamareva, I.; et al. InterPro: The protein sequence classification resource in 2025. Nucleic Acids Res. 2025, 53, D444–D456. [Google Scholar] [CrossRef]
- Wang, J.; Chitsaz, F.; Derbyshire, M.K.; Gonzales, N.R.; Gwadz, M.; Lu, S.; Marchler, G.H.; Song, J.S.; Thanki, N.; Yamashita, R.A.; et al. The conserved domain database in 2023. Nucleic Acids Res. 2023, 51, D384–D388. [Google Scholar] [CrossRef]
- Gasteiger, E.; Hoogland, C.; Gattiker, A.; Duvaud, S.; Wilkins, M.R.; Appel, R.D.; Bairoch, A. Protein identification and analysis tools on the Expasy server. In The Proteomics Protocols Handbook; Walker, J.M., Ed.; Humana Press: Hatfield, UK, 2005; pp. 571–607. [Google Scholar]
- Chou, K.C.; Shen, H.B. Cell-PLoc: A package of Web servers for predicting subcellular localization of proteins in various organisms. Nat. Protoc. 2008, 3, 153–162. [Google Scholar] [CrossRef]
- Chen, C.; Wu, Y.; Li, J.; Wang, X.; Zeng, Z.; Xu, J.; Liu, Y.; Feng, J.; Chen, H.; He, Y.; et al. TBtools-II: A “one for all, all for one” bioinformatics platform for biological big-data mining. Mol. Plant 2023, 16, 1733–1742. [Google Scholar] [CrossRef]
- Tamura, K.; Stecher, G.; Kumar, S. MEGA11: Molecular evolutionary genetics analysis version 11. Mol. Biol. Evol. 2021, 38, 3022–3027. [Google Scholar] [CrossRef]
- Bailey, T.L.; Johnson, J.; Grant, C.E.; Noble, W.S. The MEME Suite. Nucleic Acids Res. 2015, 43, W39–W49. [Google Scholar] [CrossRef]
- Ferrer, J.L.; Jez, J.M.; Bowman, M.E.; Dixon, R.A.; Noel, J.P. Structure of chalcone synthase and the molecular basis of plant polyketide biosynthesis. Nat. Struct. Biol. 1999, 6, 775–784. [Google Scholar]
- Choudhary, P.; Feng, Z.; Berrisford, J.; Chao, H.; Ikegawa, Y.; Peisach, E.; Piehl, D.W.; Smith, J.; Tanweer, A.; Varadi, M.; et al. PDB NextGen Archive: Centralizing access to integrated annotations and enriched structural information by the Worldwide Protein Data Bank. Database 2024, 2024, baae041. [Google Scholar] [CrossRef]
- Robert, X.; Gouet, P. Deciphering key features in protein structures with the new ENDscript server. Nucleic Acids Res. 2014, 42, W320–W324. [Google Scholar] [CrossRef] [PubMed]
- Lescot, M.; Déhais, P.; Thijs, G.; Marchal, K.; Moreau, Y.; Van de Peer, Y.; Rouzé, P.; Rombauts, S. PlantCARE, a database of plant cis-acting regulatory elements and a portal to tools for in silico analysis of promoter sequences. Nucleic Acids Res. 2002, 30, 325–327. [Google Scholar] [CrossRef] [PubMed]
- Pfaffl, M.W. A new mathematical model for relative quantification in real-time RT-PCR. Nucleic Acids Res. 2001, 29, e45. [Google Scholar] [CrossRef] [PubMed]
- Das Laha, S.; Dutta, S.; Schäffner, A.R.; Das, M. Gene duplication and stress genomics in Brassicas: Current understanding and future prospects. J. Plant. Physiol. 2020, 255, 153293. [Google Scholar] [CrossRef]
- Atanassov, I.; Russinova, E.; Antonov, L.; Atanassov, A. Expression of an anther-specific chalcone synthase-like gene is correlated with uninucleate microspore development in Nicotiana sylvestris. Plant Mol. Biol. 1998, 38, 1169–1178. [Google Scholar] [CrossRef]
- Jiang, C.; Schommer, C.K.; Kim, S.Y.; Suh, D.Y. Cloning and characterization of chalcone synthase from the moss, Physcomitrella patens. Phytochemistry 2006, 67, 2531–2540. [Google Scholar] [CrossRef]
- Pandith, S.A.; Ramazan, S.; Khan, M.I.; Reshi, Z.A.; Shah, M.A. Chalcone synthases (CHSs): The symbolic type III polyketide synthases. Planta 2019, 251, 15. [Google Scholar] [CrossRef]
- Comelli, R.N.; Gonzalez, D.H. Identification of regulatory elements involved in expression and induction by sucrose and UV-B light of the Arabidopsis thaliana COX5b-2 gene, encoding an isoform of cytochrome c oxidase subunit 5b. Physiol. Plant 2009, 137, 213–224. [Google Scholar] [CrossRef]
- Hemleben, V.; Dressel, A.; Epping, B.; Lukacin, R.; Martens, S.; Austin, M. Characterization and structural features of a chalcone synthase mutation in a white-flowering line of Matthiola incana R. Br. (Brassicaceae). Plant Mol. Biol. 2004, 55, 455–465. [Google Scholar] [CrossRef]
- Hou, Q.; Li, S.; Shang, C.; Wen, Z.; Cai, X.; Hong, Y.; Qiao, G. Genome-wide characterization of chalcone synthase genes in sweet cherry and functional characterization of CpCHS1 under drought stress. Front. Plant Sci. 2022, 13, 989959. [Google Scholar] [CrossRef] [PubMed]
- Burbulis, I.E.; Iacobucci, M.; Shirley, B.W. A null mutation in the first enzyme of flavonoid biosynthesis does not affect male fertility in Arabidopsis. Plant Cell 1996, 8, 1013–1025. [Google Scholar] [PubMed]
- Liu, Y.; Bai, J.; Yuan, S.; Gao, S.; Liu, Z.; Li, Y.; Zhang, F.; Zhao, C.; Zhang, L. Characterization and expression analysis of chalcone synthase gene family members suggested their roles in the male sterility of a wheat temperature-sensitive genic male sterile (TGMS) line. Gene 2023, 888, 147740. [Google Scholar] [CrossRef]
- Yao, Y.; Sun, L.; Wu, W.; Wang, S.; Xiao, X.; Hu, M.; Li, C.; Zhao, H.; Chen, H.; Wu, Q. Genome-wide investigation of major enzyme-encoding genes in the flavonoid metabolic pathway in tartary buckwheat (Fagopyrum tataricum). J. Mol. Evol. 2021, 89, 269–286. [Google Scholar] [CrossRef]
- Wang, Y.; Chen, F.; Ma, Y.; Zhang, T.; Sun, P.; Lan, M.; Li, F.; Fang, W. An ancient whole-genome duplication event and its contribution to flavor compounds in the tea plant (Camellia sinensis). Hortic. Res. 2021, 8, 176. [Google Scholar] [CrossRef] [PubMed]
- Juretic, N.; Hoen, D.R.; Huynh, M.L.; Harrison, P.M.; Bureau, T.E. The evolutionary fate of MULE-mediated duplications of host gene fragments in rice. Genome Res. 2005, 15, 1292–1297. [Google Scholar] [CrossRef]
- Faraji, S.; Filiz, E.; Kazemitabar, S.K.; Vannozzi, A.; Palumbo, F.; Barcaccia, G.; Heidari, P. The AP2/ERF gene family in Triticum durum: Genome-wide identification and expression analysis under drought and salinity stresses. Genes 2020, 11, 1464. [Google Scholar] [CrossRef]
- Oakley, T.H.; Ostman, B.; Wilson, A.C. Repression and loss of gene expression outpaces activation and gain in recently duplicated fly genes. Proc. Natl. Acad. Sci. USA 2006, 103, 11637–11641. [Google Scholar] [CrossRef]
- Gu, X. Statistical framework for phylogenomic analysis of gene family expression profiles. Genetics 2004, 167, 531–542. [Google Scholar] [CrossRef]
Disclaimer/Publisher’s Note: The statements, opinions and data contained in all publications are solely those of the individual author(s) and contributor(s) and not of MDPI and/or the editor(s). MDPI and/or the editor(s) disclaim responsibility for any injury to people or property resulting from any ideas, methods, instructions or products referred to in the content. |
© 2025 by the authors. Licensee MDPI, Basel, Switzerland. This article is an open access article distributed under the terms and conditions of the Creative Commons Attribution (CC BY) license (https://creativecommons.org/licenses/by/4.0/).