Article

Reduction in Liver Cancer Risk by Quercetin via Modulation of Urate Levels: Insights from Drug-Target Mendelian Randomization

1
School of Pharmacy, Chengdu University, 2025 Chengluo Avenue, Chengdu 610106, China
2
Cell Biology-Inspired Tissue Engineering, Institute for Technology-Inspired, Regenerative Medicine, Maastricht University, 6200 MD Maastricht, The Netherlands
3
Precision Medicine, Faculty of Health, Medicine and Life Sciences, Maastricht University, 6200 MD Maastricht, The Netherlands
4
College of Food Science and Engineering, Hainan University, 58 Renmin Road, Haikou 570228, China
*
Authors to whom correspondence should be addressed.
These authors contributed equally to this work.
Genes 2025, 16(4), 449; https://doi.org/10.3390/genes16040449
Submission received: 18 February 2025 / Revised: 2 April 2025 / Accepted: 10 April 2025 / Published: 13 April 2025
(This article belongs to the Section Bioinformatics)

Abstract

:
Background: Quercetin, a dietary flavonoid and a widely used supplement, has hepatoprotective properties. Given its urate-lowering effects and epidemiological evidence linking elevated serum urate levels to liver cancer risk, we tested whether quercetin reduces liver cancer risk via modulation of urate levels by bioinformatics methods. Methods: We employed drug-target Mendelian randomization using genome-wide association study summary statistics from public databases (e.g., MRC-IEU) to assess genetic associations, and integrated these findings with GEO datasets (such as GSE138709 and GSE179443) and immune infiltration analyses using tools like xCell, TIMER. Results: Our analyses identified ABCG2-mediated urate elevation as a causal risk factor for hepatocellular carcinoma (OR = 1.001, p < 0.01), cholangiocarcinoma (OR = 3.424, p < 0.01), and liver fibrosis (OR = 2.528, p < 0.01). Single-cell transcriptomics revealed elevated ABCG2 expression in cholangiocarcinoma endothelial cells, while immune infiltration analysis showed significant associations between ABCG2 expression and both endothelial cell and macrophage infiltration. Survival analysis further indicated that ABCG2 was not associated with poor prognosis in cholangiocarcinoma or hepatocellular carcinoma. Conclusions: Considering quercetin’s multifaceted interactions with BCRP/ABCG2, our findings support its potential use as a preventive dietary supplement for hepatic diseases rather than as an adjunctive therapy for established liver cancer.

1. Introduction

Quercetin is ubiquitously distributed across multiple botanical species, including traditional Chinese medicinal herbs such as Ligusticum chuanxiong, Ophiopogon japonicus and Fritillaria cirrhosa [1,2], It is also present in our diet and widely marketed as supplement, has anti-inflammatory, antioxidant, and anticancer properties [3]. However, the rationale for the various health claims of quercetin, the molecular mechanisms underlying its health benefits, remain unclear.
The primary liver cancers are hepatocellular carcinoma (HCC), cholangiocarcinoma (CCA), mixed hepatocellular-cholangiocarcinoma, and pediatric types [4,5]. They are strongly associated with chronic liver diseases. HCC, the most common type of liver cancer (~75–85%), is the third leading cause of cancer-related mortality, primarily due to late-stage diagnosis, limited therapeutic options, and complex pathogenesis [6,7,8]. Investigations by Toru Hisaka et al. [9], have demonstrated that quercetin suppresses HCC, indicating that quercetin might be used for the prevention or treatment of HCC. Additionally, as a therapeutic adjuvant quercetin enhances the efficacy of chemotherapeutic agents such as 5-fluorouracil [10].
Emerging evidence links elevated serum uric acid (SUA) levels to hepatocarcinogenesis [11,12]. Elevated SUA levels may contribute to cancer by inducing oxidative stress, DNA damage, and NLRP3 inflammasome activation, creating a tumor-promoting microenvironment [13,14,15]. Cohort studies further suggest that hyperuricemia is associated with reduced overall survival and increased recurrence in liver cancer patients [16,17]. Quercetin has demonstrated urate-lowering properties via multiple mechanisms. Preclinical models show that it downregulates urate transporter 1 (URAT1) and glucose transporter 9 (GLUT9), leading to reduced SUA levels [18]. Clinical studies also confirm that quercetin supplementation significantly lowers SUA without affecting glycemic control or renal urate excretion [19]. Moreover, epidemiological data from NHANES and FNDDS reveal an inverse correlation between flavonoid intake and both HCC incidence and hepatic fibrosis progression [20].
Given these findings, the hypothesis emerges that quercetin may influence liver cancer progression through urate regulatory mechanisms. To empirically validate this hypothesis, we employed Mendelian randomization (MR) integrated with genomic data on liver diseases from the GEO database.
MR, a genetic epidemiological approach, can be used to establish causal relationships between exposures and disease outcomes using instrumental variables (IVs) derived from single nucleotide polymorphisms (SNPs) [21]. However, conventional MR analyses have largely found no direct causal relationship between SUA levels and cancer, including liver cancer [22]. This may be due to pleiotropy, where SNPs influence multiple traits, confounding causal inference in multi-SNP MR analyses. To address this, we applied drug-target MR, focusing on gene-protein interactions relevant to quercetin’s mechanism of action. Drug-target MR utilizes protein quantitative trait loci (pQTLs) or upstream genetic markers, such as expression quantitative trait loci (eQTLs), to refine causal inference [23]. For instance, studies have successfully used this method to investigate oncogenesis-related drug targets, such as proprotein convertase subtilisin/kexin type 9 (PCSK9) inhibitors and antihypertensive medications [24]. In our study, SUA levels—modulated by quercetin—serve as the exposure phenotype, with cis-acting genetic variants (±100 kb from target loci) selected as IVs, following the target gene identification.
Our study aimed to elucidate the causal role of ABCG2 genetic variants in modulating urate levels and their impact on liver diseases, including HCC, CCA, and liver fibrosis. We found that these variants mediate elevated SUA levels and significantly increase the risk of these conditions.

2. Materials and Methods

2.1. Data Source and Preprocessing

The protein targets of quercetin were obtained from the report by Zu et al. [25]. These targets were manually collected or derived from Swiss Target Prediction [26]. The transcriptomic data for liver cancer were downloaded from the HCCDB (http://lifeome.net/database/hccdb2, accessed on 1 January 2025, HCCDB25, HCCDB30) and subjected to a differential expression analysis. By computationally overlaying differentially expressed genes (DEGs) with quercetin-target encoding genes, we identified 11 upregulated and 10 downregulated consensus genes (Supplementary Table S1), including two urate-associated downregulated regulators, ATP-binding cassette subfamily G member 2 (ABCG2) and XDH. For MR analyses, genome-wide association study (GWAS) summary statistics for hepatic pathologies were retrieved from the MRC-IEU consortium portal (https://gwas.mrcieu.ac.uk/; accessed 1 January 2025), with detailed dataset specifications provided in Table 1.

2.2. Drug-Target Mendelian Randomization Analysis

We utilized SNPs located within 100 kilobases of ABCG2 that are associated with urate, sourced from the GWAS datasets. We selected SNPs with genome-wide significances (p < 5 × 10⁻⁸) and clumped them at linkage disequilibrium (LD) R2 < 0.3. This process identified multiple genome-wide significantly associated SNPs based on different results. The selective SNPs can be found in Tables S2–S6. IVW (Inverse Variance Weighted) method [27] was used as the primary analytical method to determine causality. In the MR analysis, we used weighted median (WM) [28] and MR-PRESSO [29] methods to confirm the robustness and reliability of IVW MR estimates. Sensitivity analyses, including a heterogeneity analysis and pleiotropy testing, were conducted using Cochran’s Q test and the MR-Egger method [30], where a p-value > 0.05 indicated no heterogeneity. In cases where heterogeneity was detected, a random-effect model was used to replace the IVW results. A p-value exceeding the adjusted threshold but remaining below 0.05 was considered to indicate a suggestive association. The MR analysis and sensitivity analysis were performed using the “TwoSampleMR” and “MRPRESSO” packages in R software (version 4.1.1).

2.3. Bioinformatics Analysis

We also performed a bioinformatics analysis on the screened upregulated and downregulated genes. Briefly, the identified genes were subjected to Gene Ontology (GO) functional enrichment analysis [31] using the “clusterProfiler” and “enrichplot” packages. The results were ranked based on enrichment thresholds, such as p-values. Gene Set Enrichment Analysis (GSEA) [32] was performed to confirm pathway alignment with the GO results. The Xcell [33] and TIMER methods [34] were used to assess the relationship between the expression of the screened genes and immune cell infiltration. The results were visualized using “ggplot2” [35].

3. Results

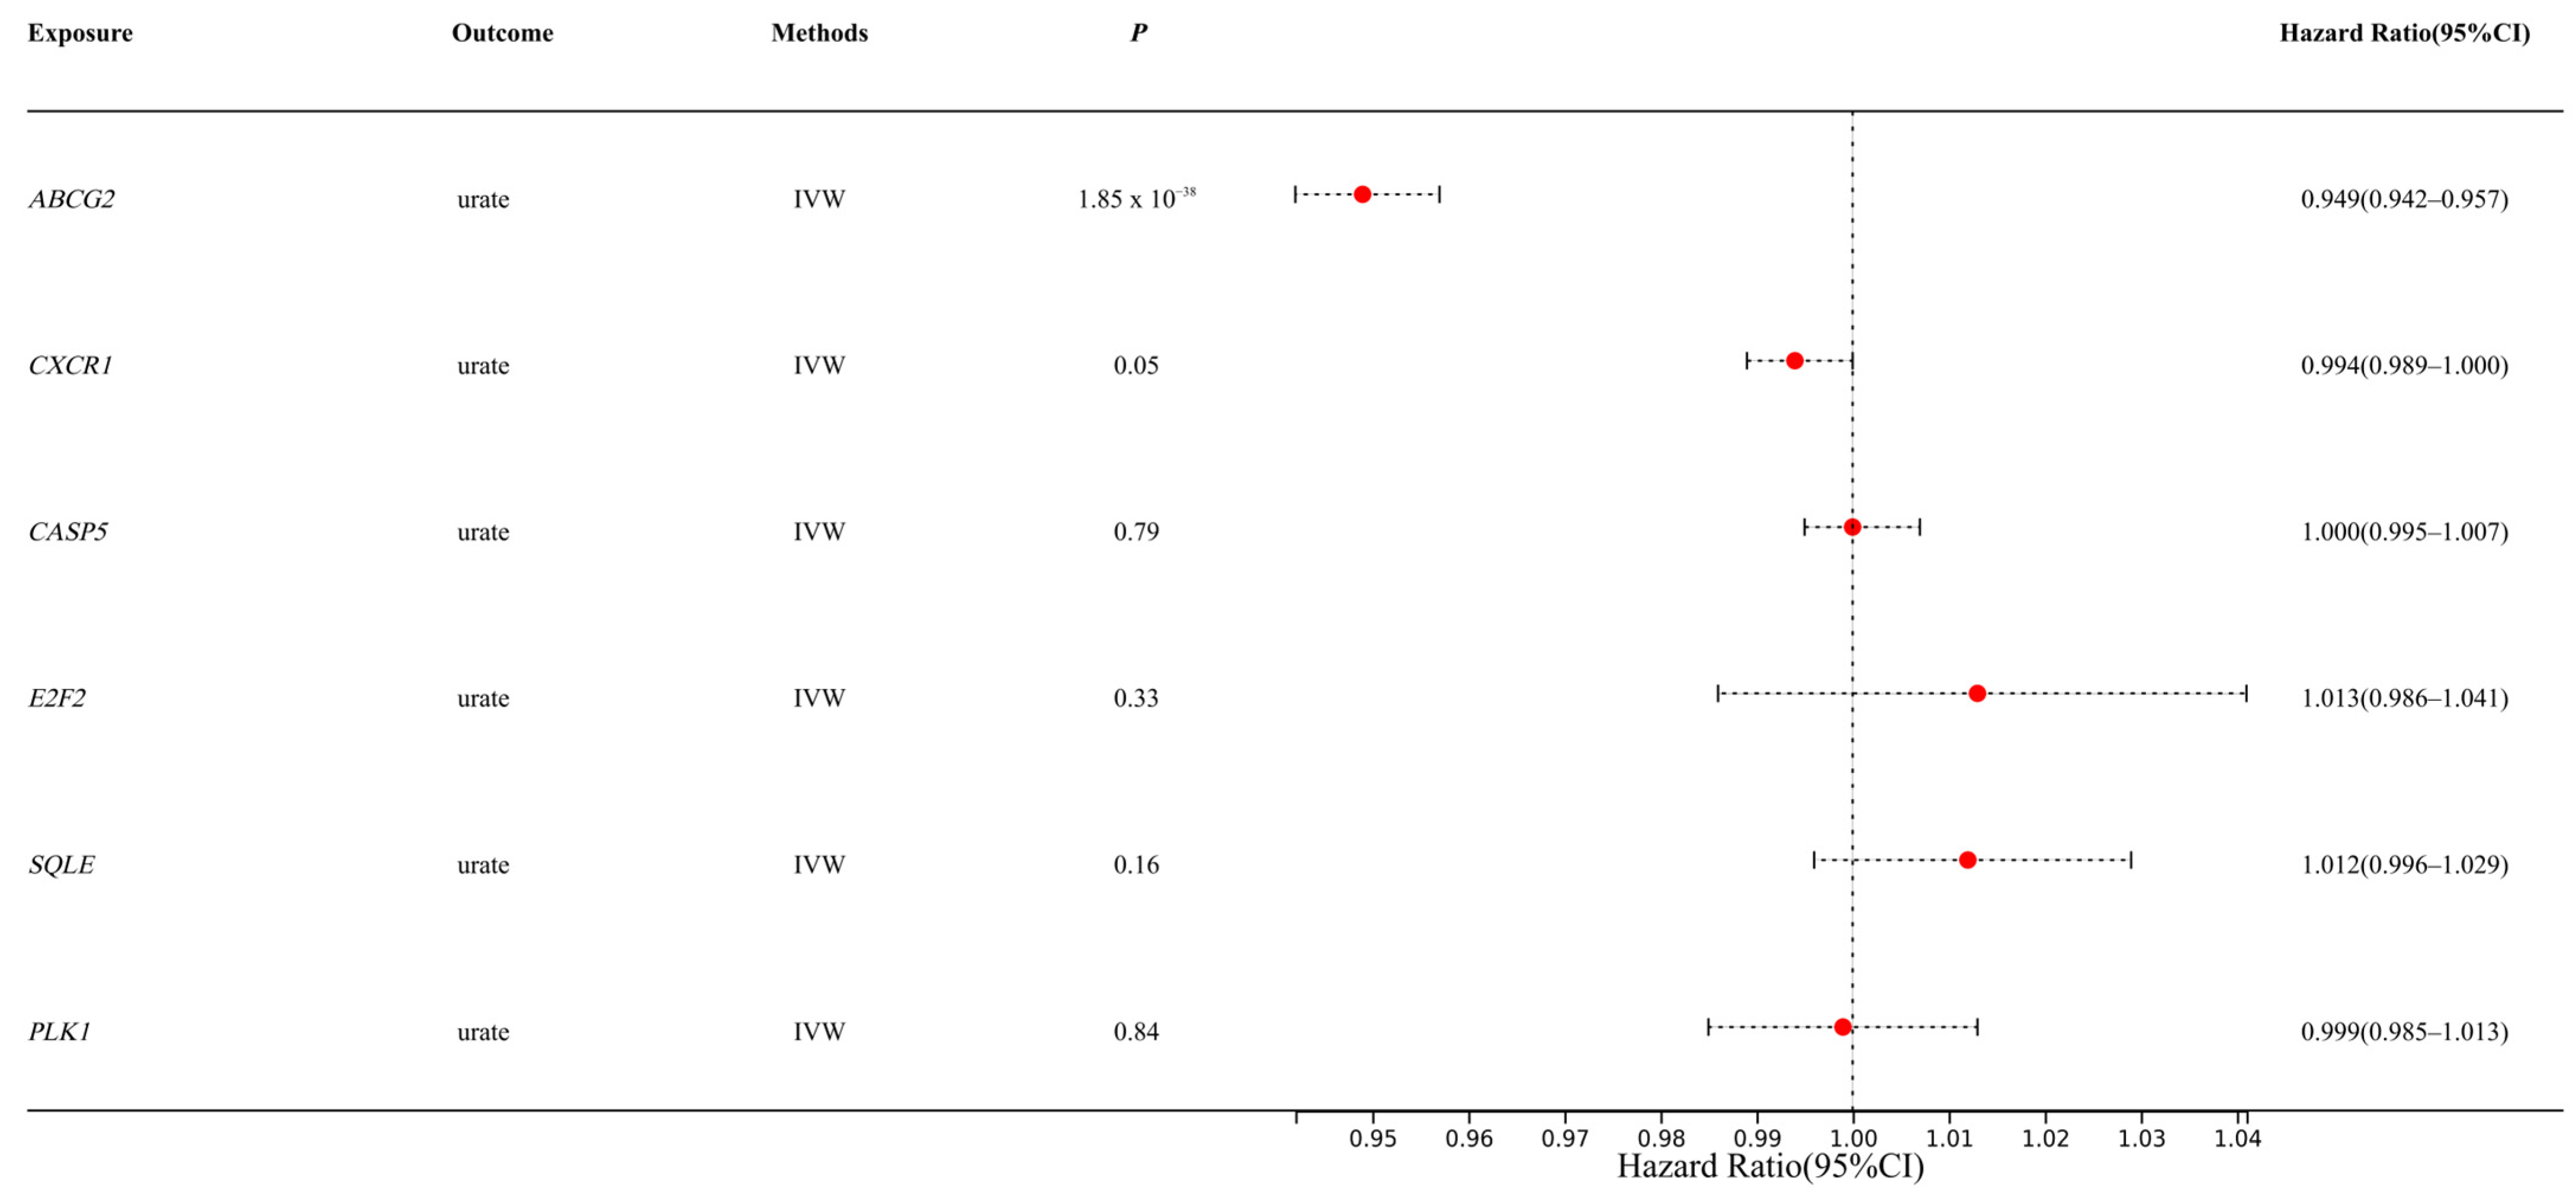
3.1. MR Analysis Results Show That ABCG2 Has a Causal Relationship with Urate

We first extracted SNPs from eQTL databases (https://www.eqtlgen.org/cis-eqtls.html, accessed on 1 January 2025) as instrumental variables to evaluate the causal relationship between the selected upregulated/downregulated genes and urate levels. Among the 21 candidate genes, we identified 6 genes with available genetic instruments. The IVW method revealed that only ABCG2 demonstrated a significant causal association with urate levels (p < 0.01) (Figure 1), consistent with the previous reports linking ABCG2 genetic variants to urate metabolism. The specific SNPs used for each gene are shown in Table S7. Subsequently, we employed a drug-target Mendelian randomization analysis to estimate the causal relationship between ABCG2 variant-mediated uric acid levels and liver diseases.

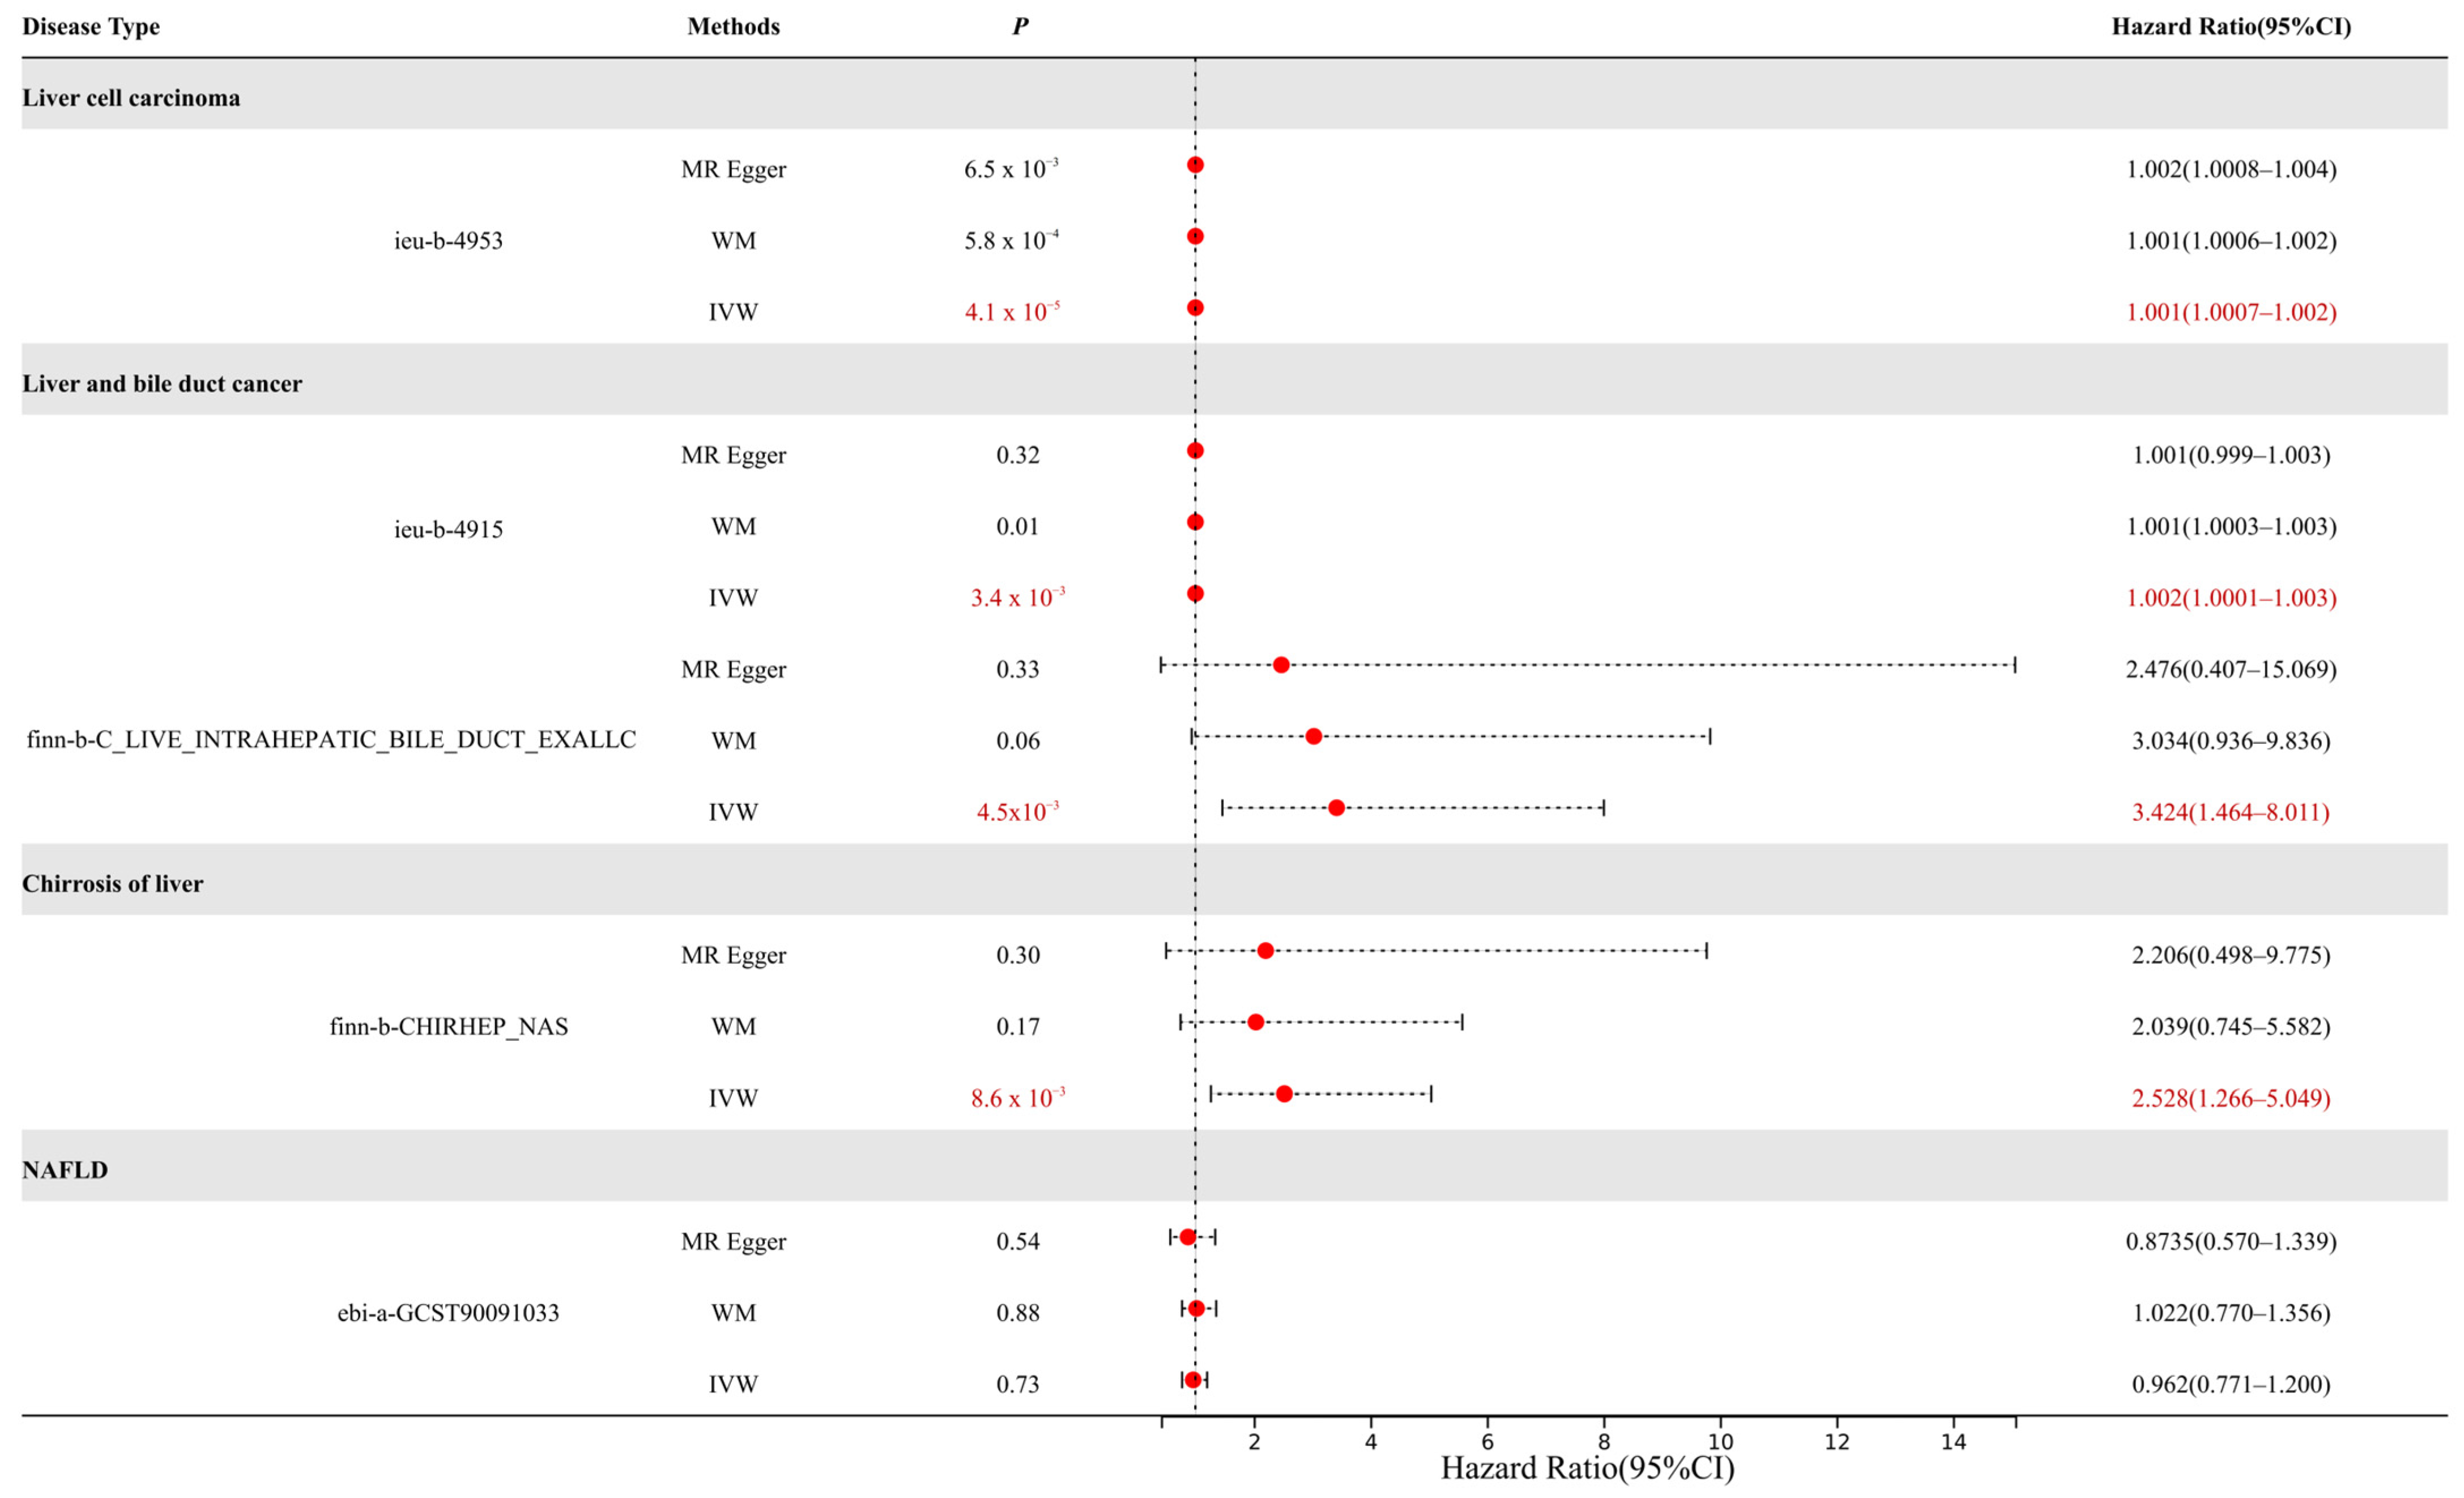
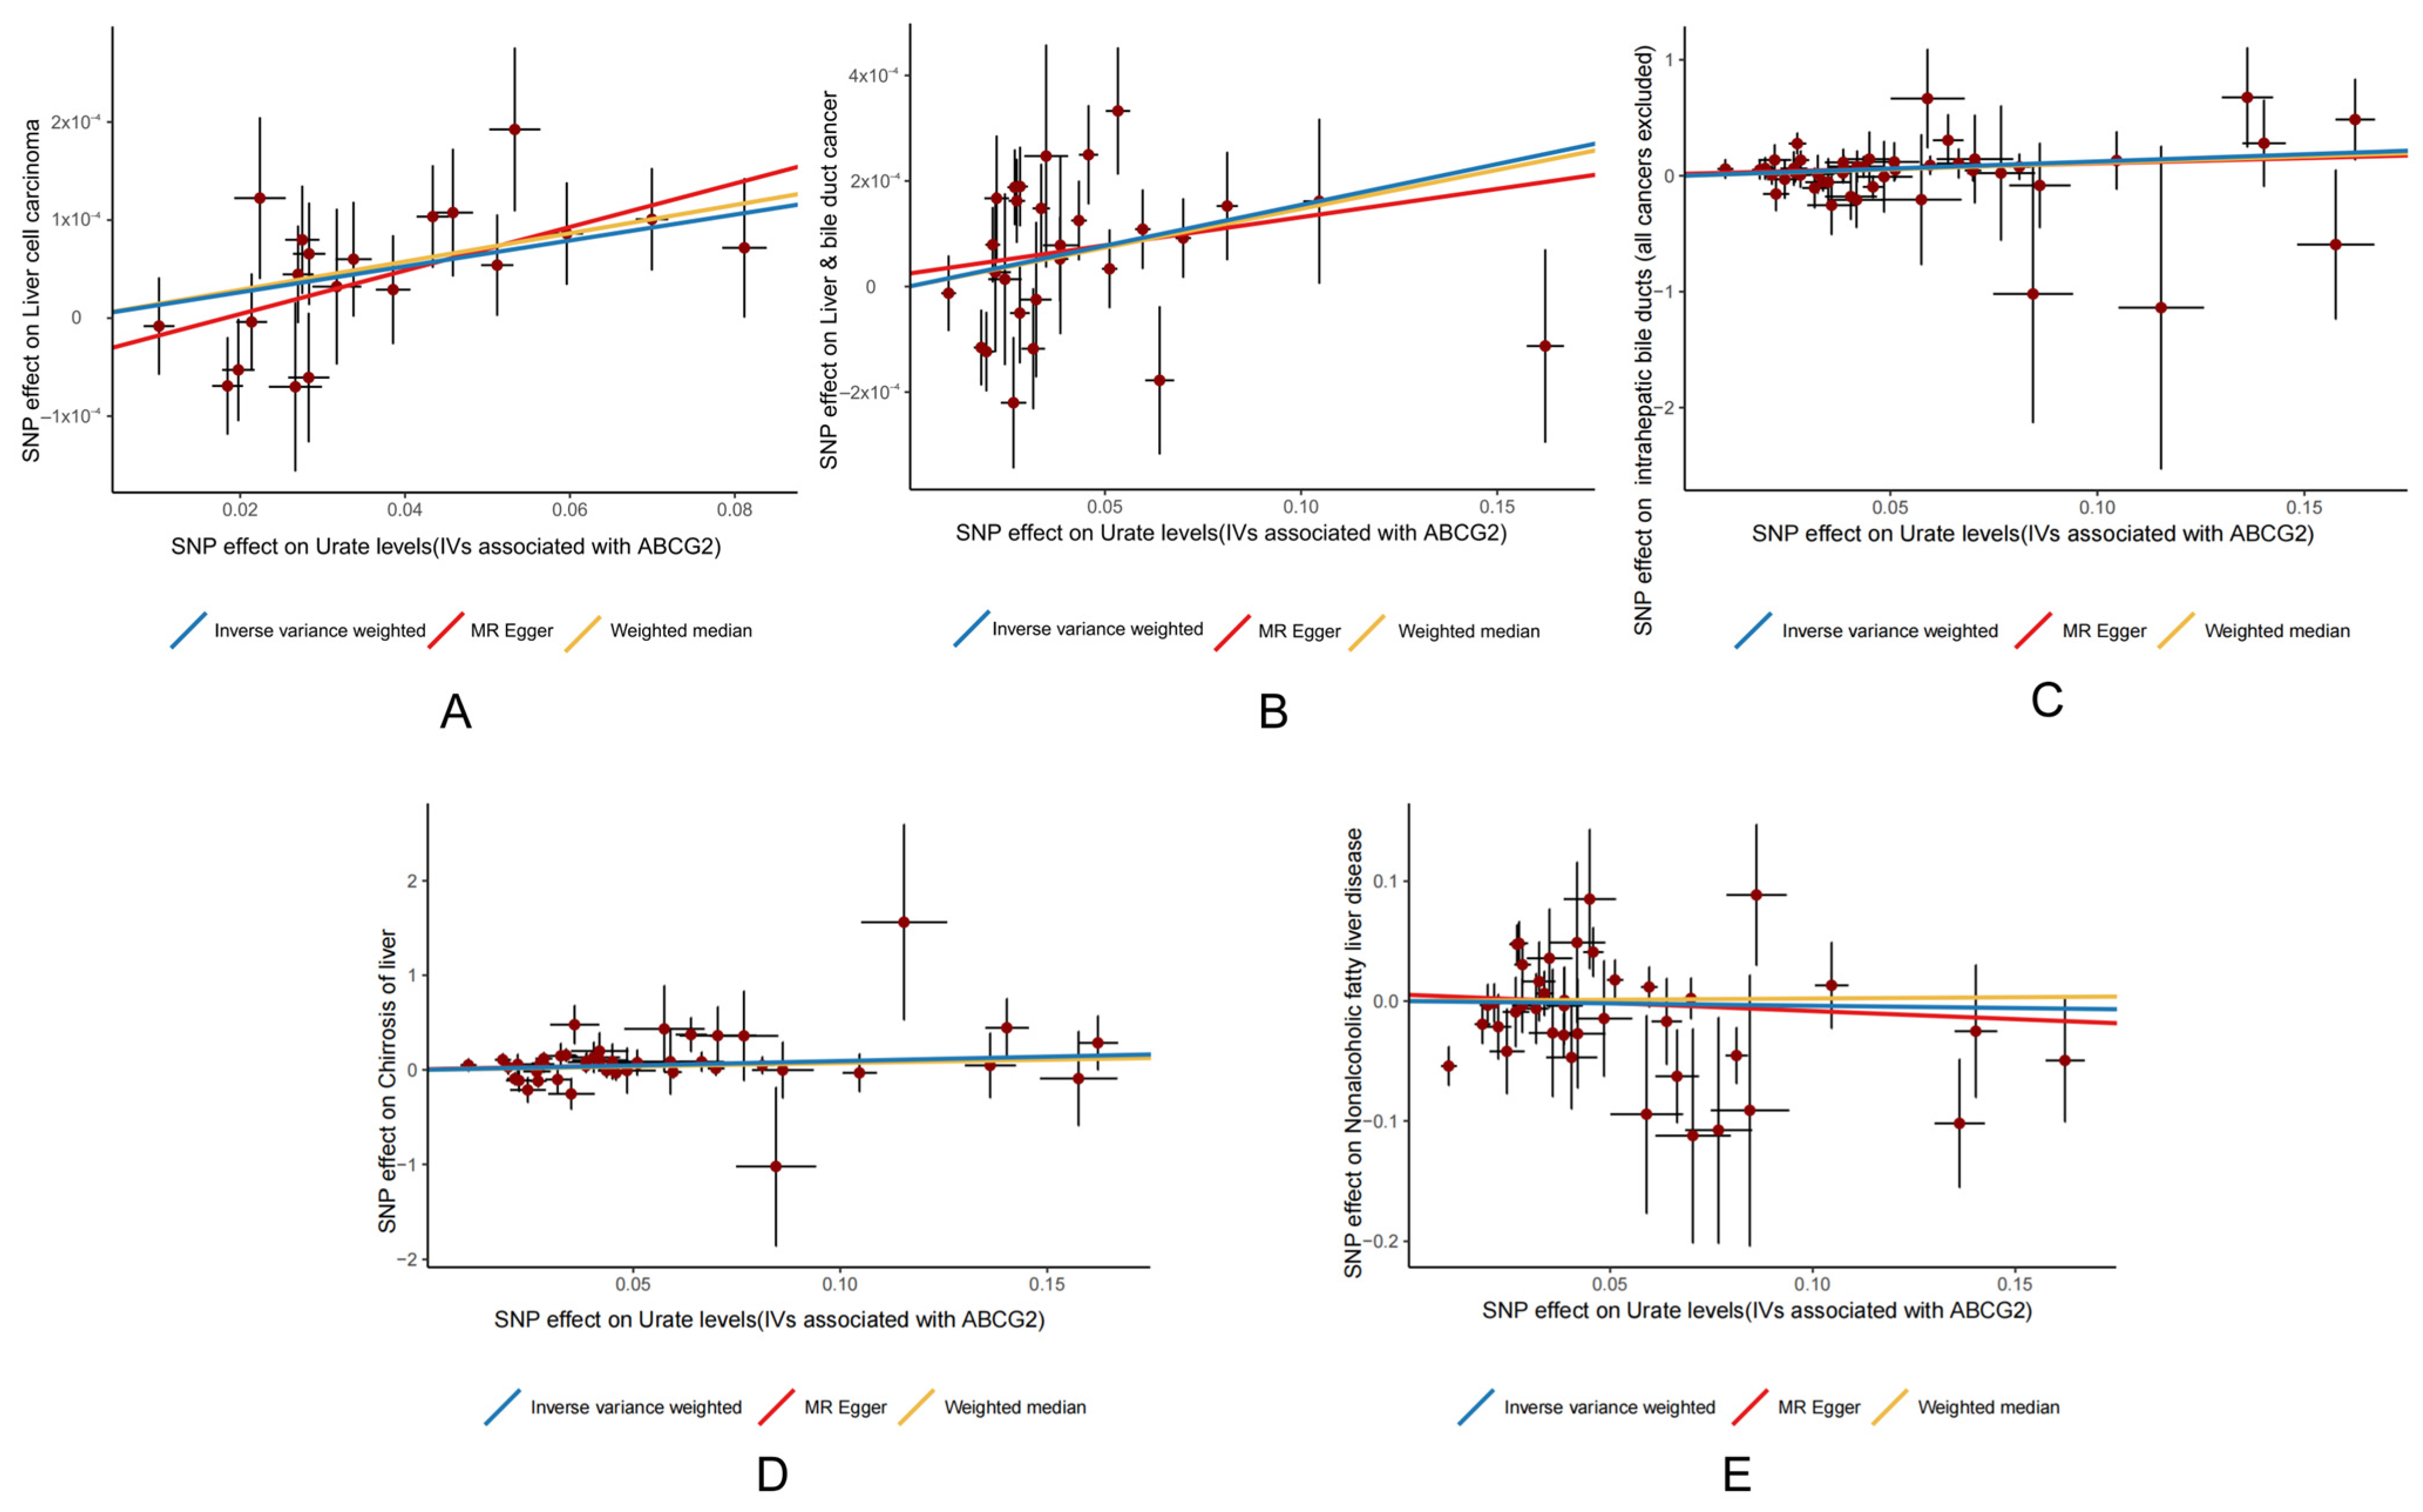
3.2. MR Analysis Results Show That ABCG2 (Urate Related) Has a Causal Relationship with Liver Cancer

We conducted an MR analysis using several types of liver diseases from the GWAS databases as outcomes, including HCC, CCA, liver fibrosis, and non-alcoholic fatty liver disease (NAFLD) (Figure 2).
The results demonstrated that urate levels mediated by ABCG2 genetic variants exhibited causal effects on multiple liver diseases. For HCC, the causal effect reached statistical significance (p < 0.01) with an odds ratio (OR) of 1.001. For cholangiocarcinoma, both datasets showed significant associations (p < 0.01) with OR values of 1.002 and 3.424, respectively. Notably, considering that the dataset (ieu-b-4915) comprised mixed samples of HCC and CCA, we propose that elevated urate levels may play a more critical role in CCA progression compared to HCC. In liver fibrosis, a significant causal relationship was observed (p < 0.01, OR = 2.528), indicating hyperuricemia as a risk factor for fibrotic progression. However, no causal association was identified between urate levels and NAFLD.
The MR scatterplots depicted the relationships between genetic variants (exposure) and outcomes (Figure 3).
All SNPs closely aligned along the IVW regression line with significant slopes, except for liver and bile duct cancer (Figure 3B) and NAFLD (Figure 3E), indicating that causal estimates were robust for most outcomes.

3.3. Heterogeneity and Pleiotropy Analysis

To assess whether the causal effect estimates from the SNPs we used were consistent and to verify whether these SNPs affected the outcomes solely through the exposure factor, we performed heterogeneity tests and horizontal pleiotropy tests (Table 2).
Heterogeneity analysis identified significant heterogeneity in the liver and bile duct cancer dataset (ieu-b-4915) and NAFLD. As a result, random-effect models were applied to these outcomes, confirming a causal relationship between ABCG2-mediated hyperuricemia and liver/bile duct cancer (ieu-b-4915), while excluding any such relationship with NAFLD.
Horizontal pleiotropy refers to a gene variant that is associated with more than one phenotype across different biological pathways. To assess this, we used the MR-Egger method to test for horizontal pleiotropy. The p-values for liver cell carcinoma, liver and bile duct cancer, cirrhosis of the liver, and NAFLD were 0.181, 0.600 (ieu-b-4915), 0.692 (finn-b-C3_LIVER_INTRAHEPATIC_BILE_DUCTS_EXALLC), 0.840, and 0.607, respectively. As all values were greater than 0.05, this indicates no significant horizontal pleiotropy. The graphical results of horizontal pleiotropy tests can be found in Figure S1.

3.4. ABCG2 Expression Is Elevated in CCA Endothelial Cells by Single-Cell Analysis

Given the significant odds ratio (OR) observed between ABCG2 expression levels and CCA, we examined the differential expression of ABCG2 in CCA by single-cell RNA sequencing analysis based on GSE138709 (Figure 4).
We found that overall ABCG2 expression was downregulated in the TCGA (CHOL/CCA) dataset. We found that single-cell analysis (GSE138709) revealed that ABCG2 expression in specific cells, such as endothelial (Figure 4D) or malignant tumor cells (Figure 4C), was increased compared to the normal group. However, that overall ABCG2 expression was downregulated in the TCGA (CHOL/CCA) datasets (Figure S2). This discrepancy may be due to different sampling approaches.

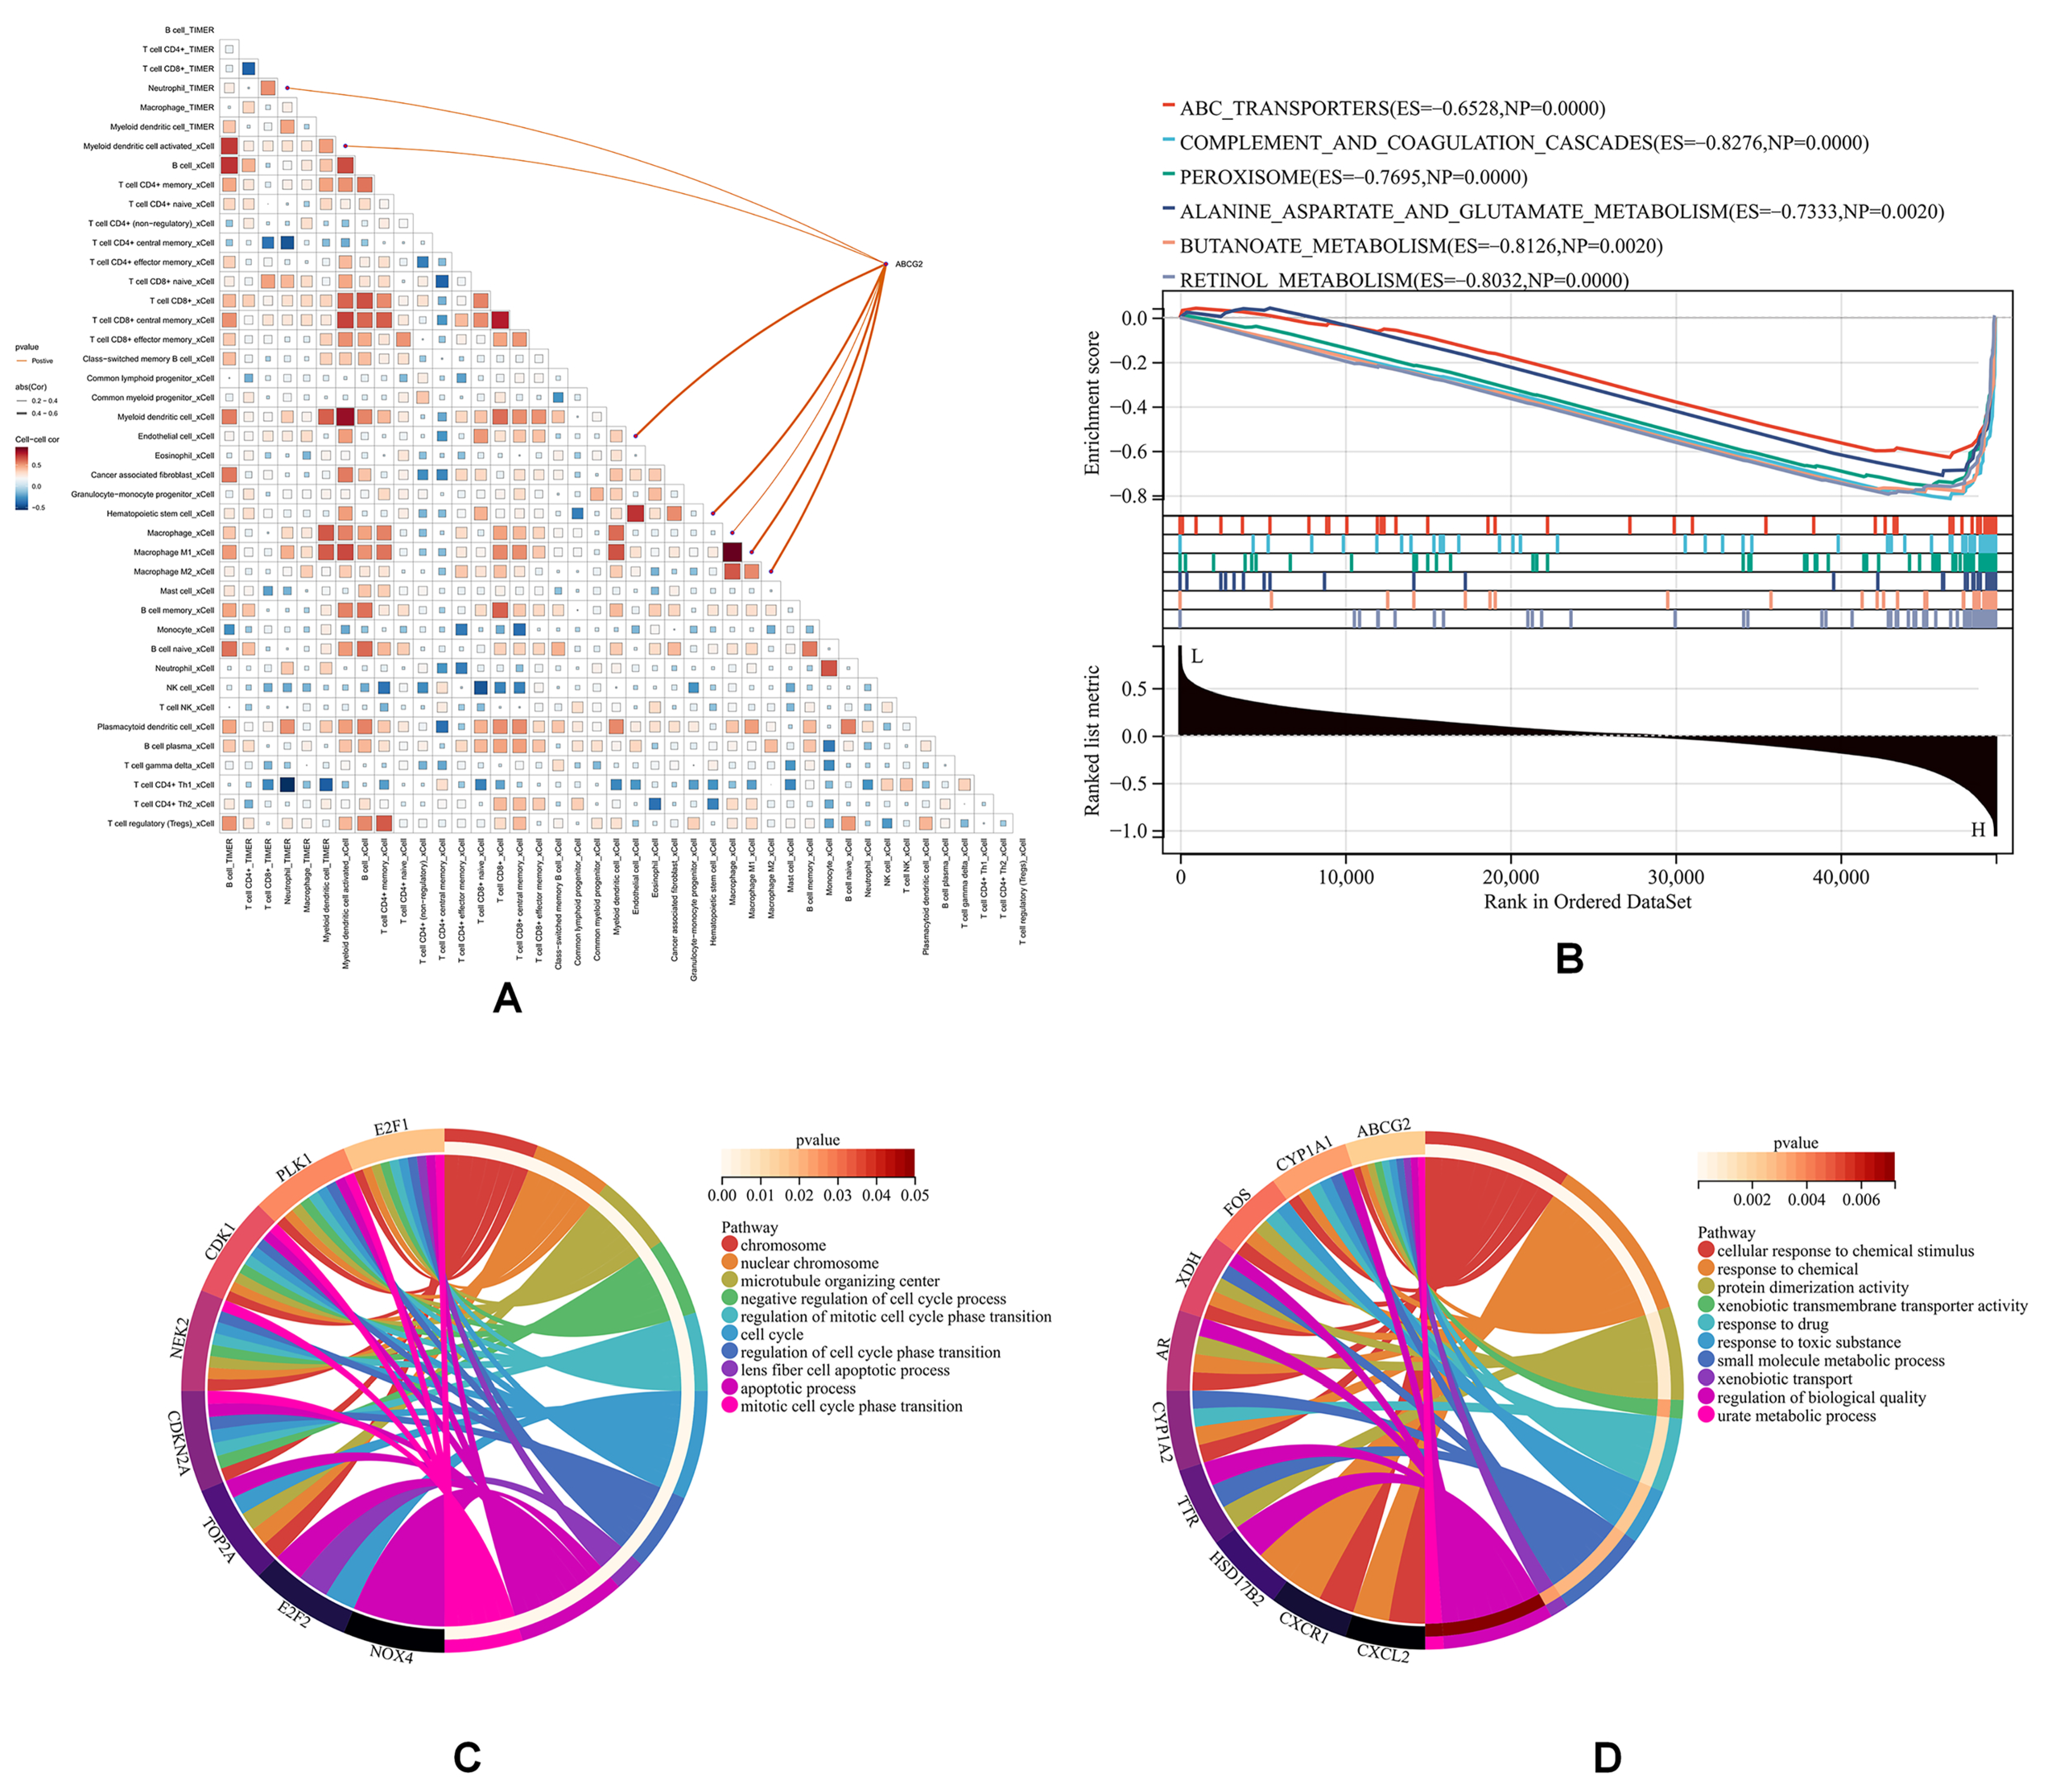
3.5. ABCG2 Is Associated with Immune Infiltration in CCA

Given the elevated ABCG2 expression in endothelial cells of CCA patients, we further investigated its association with immune infiltration (Figure 5).
As shown, ABCG2 expression exhibited positive correlations with endothelial cell infiltration and macrophage infiltration (p < 0.05) (Figure 5A), a trend corroborated by an external cohort (GSE179443, which contained 59 transcriptome profiling cases of iCCA tissue) (Figure S3). GSEA using KEGG datasets revealed that ABCG2 was particularly involved in drug metabolism and antioxidant pathways (Figure 5B). GO analysis of upregulated (Figure 5C) and downregulated (Figure 5D) genes indicated that downregulated pathways associated with ABCG2 included “cellular response to chemical stimulus”, “response to toxic substance”, “xenobiotic transmembrane transporter activity”, and “urate metabolic process”. Upregulated genes were mainly enriched in pathways related to “programmed cell death” and “negative regulation of cell cycle processes”, both of which are critically implicated in cancer progression. These findings collectively underscore the multifaceted role of ABCG2 in modulating both metabolic and immune pathways during hepatobiliary carcinogenesis.

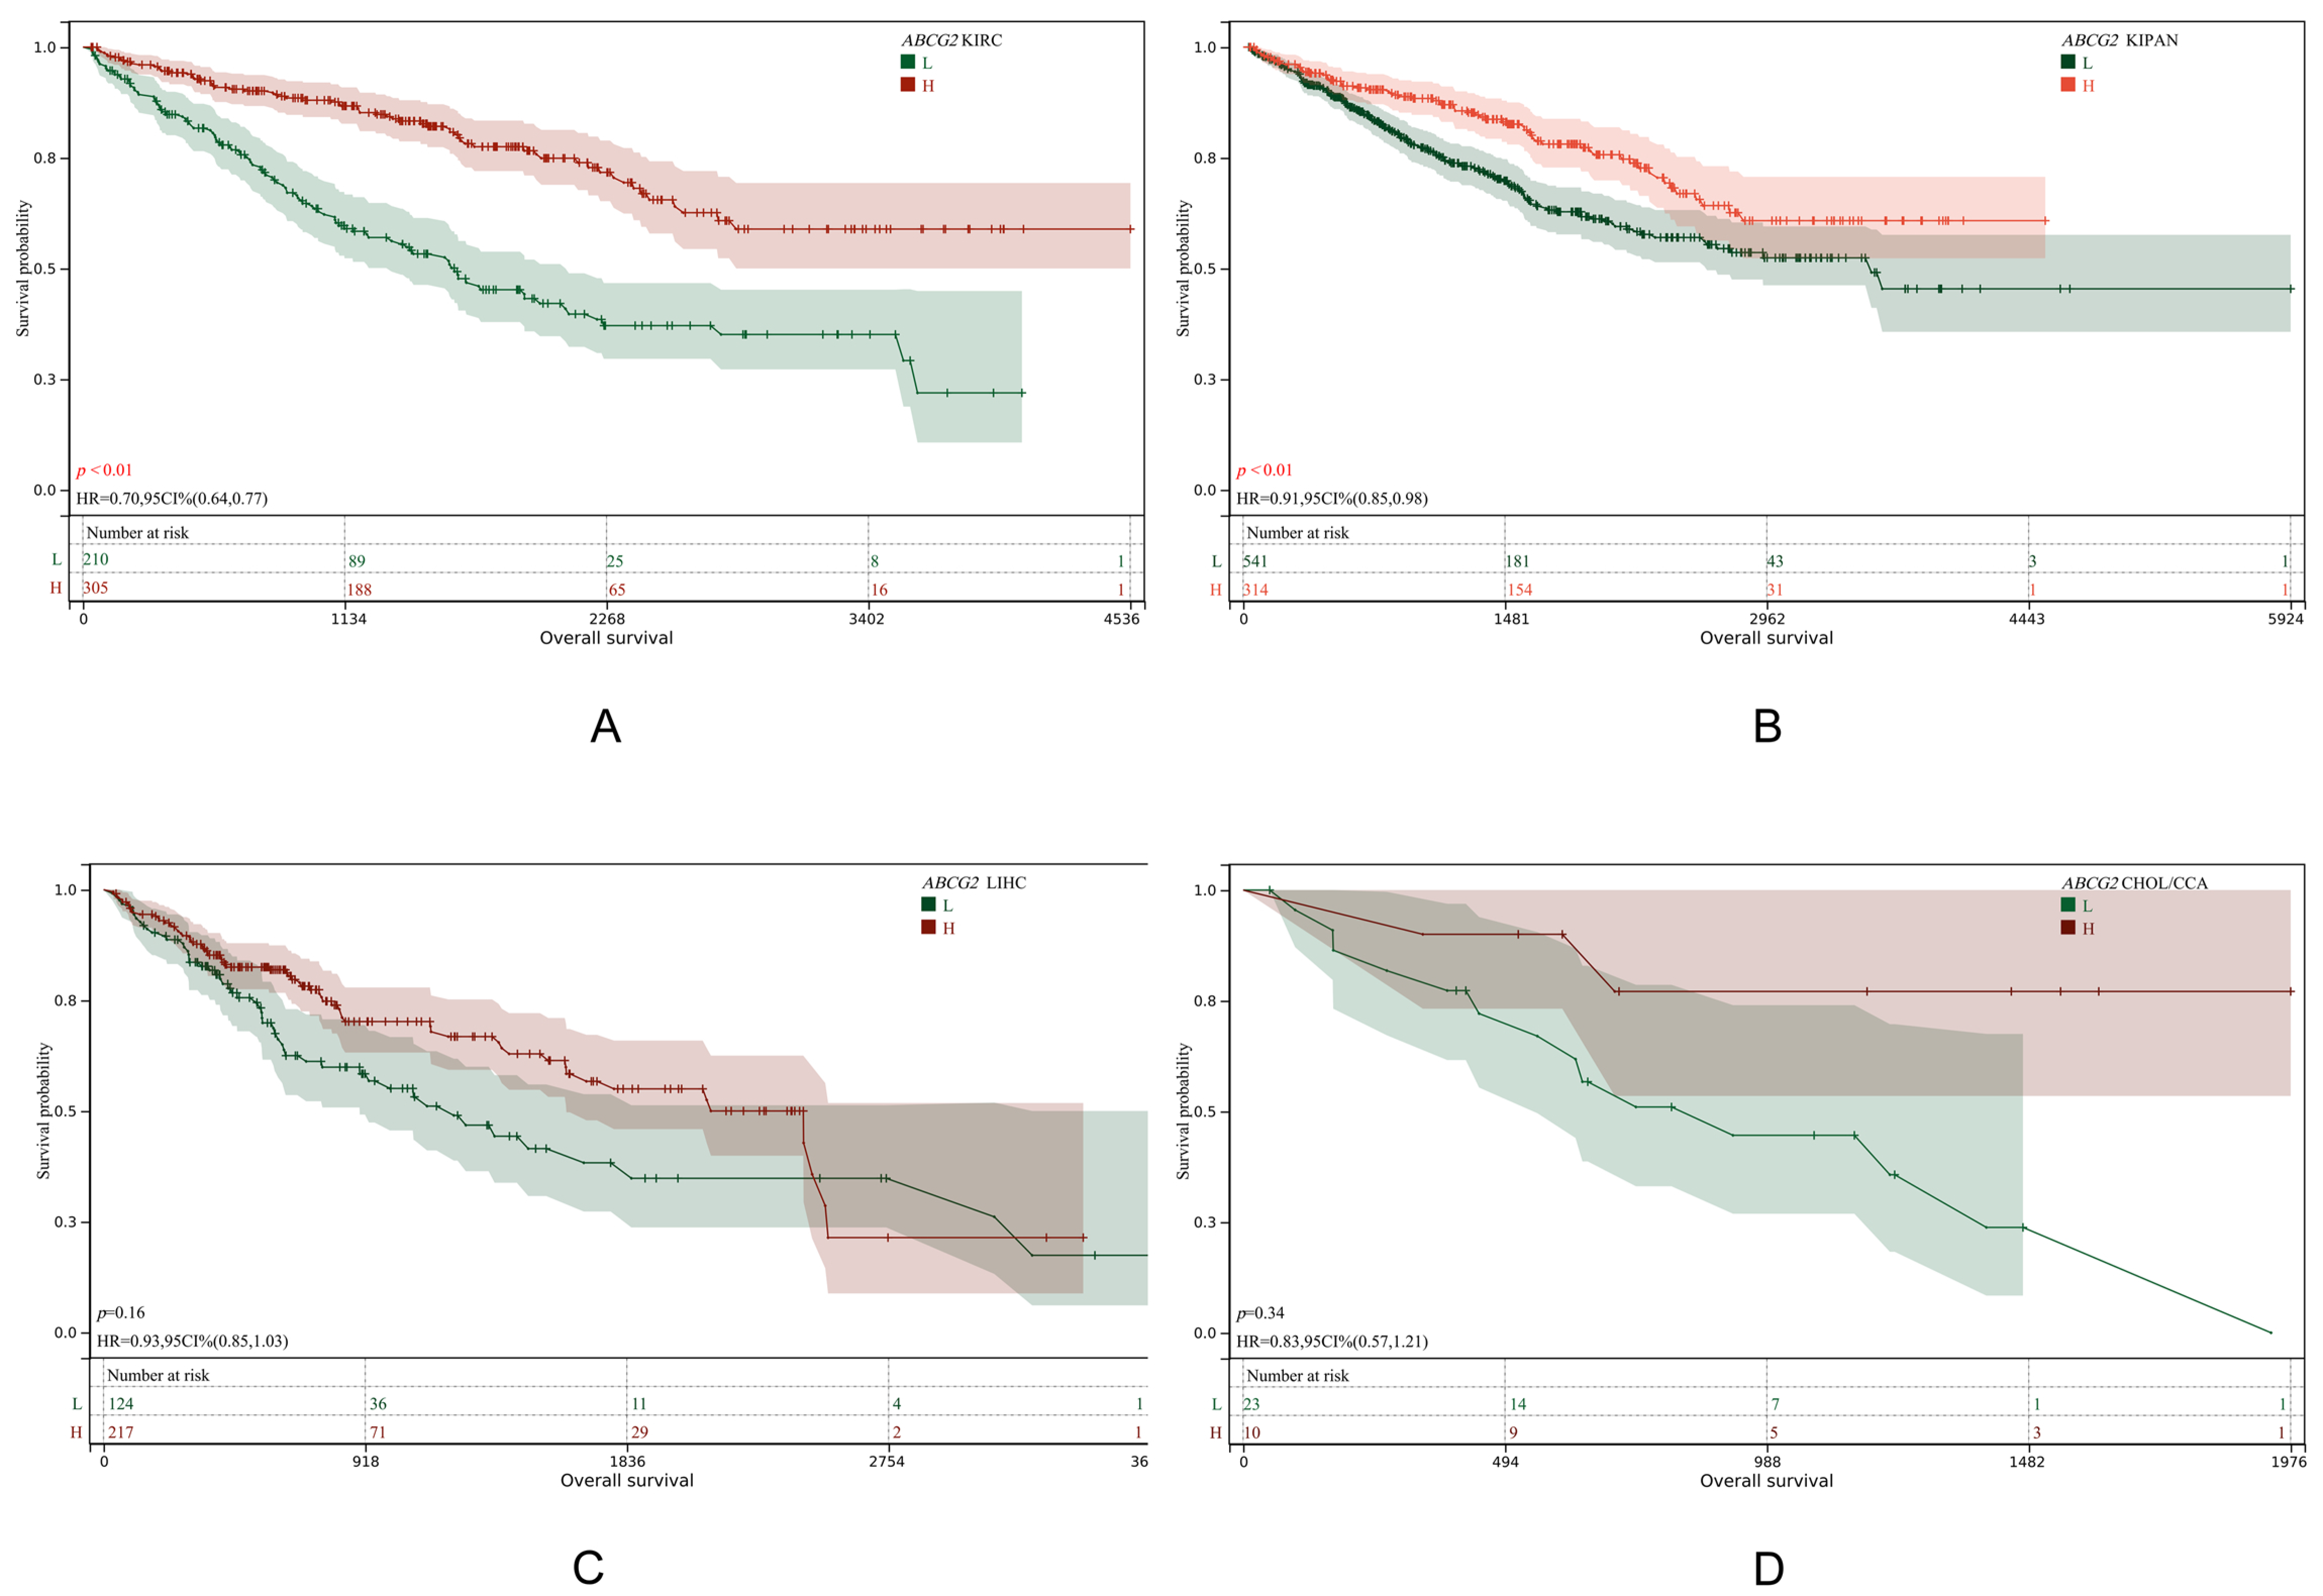
3.6. ABCG2 Is Not Associated with Poor Prognosis in CCA

We further investigated the association between its expression levels and prognosis across multiple cancers (Figure 6 and Figure S4). Data were obtained from TCGA and GTEx databases.
Results demonstrated that a low ABCG2 expression was significantly associated with poor prognosis in KIRC and KIPAN (p-values < 0.01), whereas no such association was observed for LIHC or CHOL (CCA). This suggests that ABCG2 does not directly influence liver cancer progression but may affect liver disease pathogenesis indirectly by elevating urate levels in the kidney, subsequently impacting hepatic conditions.

4. Discussion

Urate is often thought to be an antioxidant; however, its role varies depending on its concentration [36]. The literature shows that high concentrations of urate can lead to vascular inflammation by activating the NLRP3 inflammasome and promoting IL-1β synthesis [37]. Epidemiological studies have also found that hyperuricemia increases the risk of severe liver diseases such as fibrosis [38].
Our study demonstrates that genetically elevated SUA levels, mediated by ABCG2 variants, have significant causal effects on hepatocarcinogenesis, particularly on CCA. The ABCG2 gene encodes the critical transporter BCRP (breast cancer resistance protein), whose dysregulation contributes to hyperuricemia [39,40]. Clinical evidence shows that elevated SUA exacerbates treatment-related complications and impacts clinical management strategies for liver cancer patients. Early studies identified the nonsynonymous SNP rs2231142 in exon 5 of ABCG2 as being causally linked to hyperuricemia, reducing urate transport efficiency by 54% in oocytes [41]. This is consistent with our findings, which demonstrate a causal relationship between the ABCG2 gene variation and urate levels through Mendelian randomization.
Based on these findings, we selected SUA as a downstream biomarker for ABCG2. Notably, only SNPs demonstrating simultaneous associations with both SUA levels and liver diseases were included, with variants within ±100 kb of ABCG2 coding regions, prioritized to account for potential linkage disequilibrium with the neighboring genes.
Although our findings suggest that quercetin modulates SUA levels by influencing BCRP (ABCG2) activity, it should be noted that the reported effects of quercetin on ABCG2 are ambiguous and context-dependent. In vitro studies have shown that quercetin enhances the cellular accumulation and cytotoxicity of mitoxantrone (a BCRP substrate) in HeLa cells, suggesting inhibition of BCRP activity [42]. However, in mice, quercetin and its metabolite, quercetin-3-O-glucuronide, were found to upregulate renal ABCG2 expression, thereby reducing serum urate levels [43]. In the liver, quercetin may transiently inhibit BCRP activity, potentially leading to urate retention, while chronic exposure could induce compensatory upregulation of BCRP. Notably, ABCG2 overexpression in tumors confers chemoresistance by enhancing drug efflux, establishing it as a prognostic risk factor for treatment outcomes [44]. We therefore conclude that ABCG2’s role in hepatocellular carcinoma prevention by quercetin via urate modulation warrants more research.
Additionally, other mechanisms should be considered. The enzyme xanthine dehydrogenase (XDH) converts xanthine into urate [45]. Research has shown that a reduced XDH expression is associated with relatively aggressive HCC phenotypes and poor clinical outcomes, making it a potential prognostic biomarker [46]. Quercetin suppresses XDH activity, thereby reducing urate production [47]. Additionally, XDH has been implicated in modulating the tumor immune microenvironment, with early reports indicating positive correlations with CD8+ T-cell infiltration and negative associations with PD1+ immune cells [46]. However, the lack of liver disease-associated SNPs prevented the evaluation of XDH in our MR analysis framework.
Heterogeneity testing revealed significant variation in the liver and bile duct (ieu-b-4915) and NAFLD datasets. For example, in the ieu-b-4915 dataset, an MR-Egger analysis of individual SNPs demonstrated contrasting effect estimates for rs2622621 and rs2725269 (Figure S2).
Considering that heterogeneous SNPs may affect the exposure or outcome through different biological mechanisms, we retained the heterogeneous SNPs for a more comprehensive response to causal effects. Through a random-effects Inverse Variance Weighted (IVW) model, we found that heterogeneity was controllable and did not affect the causal direction. Furthermore, a leave-one-out analysis showed that excluding SNPs one by one did not lead to significant changes in the results, indicating that heterogeneous SNPs did not dominate the overall effect and that the results were robust (Figure S2).
Single-cell RNA sequencing based on GSE138709 revealed elevated ABCG2 expression in endothelial cells of cancer patients compared to normal tissues. Immune infiltration analysis further demonstrated a positive correlation between ABCG2 expression and endothelial cell infiltration (p < 0.05), a process linked to angiogenesis and enhanced tumor invasiveness. Additionally, endothelial–mesenchymal transition (EndMT) mediated by these cells may facilitate tumor cell migration and promote fibrotic microenvironments. These findings support the use of ABCG2 overexpression as a prognostic risk factor in hepatobiliary cancers and prioritize quercetin’s preventive potential over its therapeutic potential. In the pan-cancer survival analysis, ABCG2 showed that, unlike in the liver, a low expression of ABCG2 in KIRC and KIPAN was associated with a poor prognosis. Since ABCG2 is mainly expressed in the kidney, its dysregulation can increase serum urate levels, thereby affecting disease progression.
Besides urate modulation, quercetin upregulates Nrf2 protein, enhancing antioxidant enzymes (e.g., SOD, GSH), while suppressing the NF-κB pathway to mitigate oxidative stress-related pathologies such as ischemia–reperfusion injury, atherosclerosis, and cognitive impairment [48,49]. We hypothesized that quercetin or its oxidized metabolite, quercetin quinone, might bind to KEAP1 to activate Nrf2; however, no direct evidence for this was found in vitro. Early pQTL or eQTL studies also failed to identify causal links between NFE2L2 (Nrf2) and liver diseases. In our study, attempts to identify SNPs proxying NFE2L2 via downstream biomarkers were stopped due to the lack of relevant SNPs.
The Mendelian randomization method has certain limitations, such as weak instrumental variables, pleiotropy, and population stratification. These limitations can be addressed using statistical methods, such as selecting more stringent instrumental variables (p < 5 × 10⁻⁸), multiple pleiotropy evaluation methods (e.g., the Q statistic test we used), and selecting populations with the same genetic background. It should be realized that the effect estimate of exposure on the outcome obtained by MR cannot be completely equivalent to the true causal effect. It can only provide statistical clues, so further validation is critical.
For example, future studies should verify whether ABCG2 gene knockdown mice are genetically susceptible to liver cancer and further test whether quercetin can slow the progression of liver cancer or prevent its occurrence by lowering urate levels.
Overall, this underscores the complex role of quercetin in liver cancer prevention, with effects spanning from urate transport, oxidative stress modulation, to immune regulation. While quercetin anticancer potential is supported by the findings in our study, the precise molecular mechanisms underlying its therapeutic impact still warrant further investigation.

5. Conclusions

We found that genetic variants in ABCG2, which mediate elevated SUA levels, have significant causal effects on the development of HCC, CCA, and liver fibrosis. This is consistent with previous epidemiological studies and confirms the potential of quercetin in these diseases. Additionally, ABCG2 expression is strongly associated with endothelial cell infiltration, suggesting that ABCG2 may contribute to enhanced tumor invasiveness. While quercetin reduces SUA levels by modulating BCRP (ABCG2), its tissue-specific and ambiguous effects on BCRP (ABCG2) indicate that more research is needed. Tentatively, we suggest that quercetin might function as a dietary supplement for preventing liver diseases, rather than as a therapeutic agent for liver cancer.

Supplementary Materials

The following supporting information can be downloaded at: https://www.mdpi.com/article/10.3390/genes16040449/s1. Table S1: Retained up-regulated or down-regulated genes; Table S2: Final IVs generated from urate associated with ABCG2 for liver cell carcinoma (ieu4953); Table S3: Final IVs generated from urate associated with ABCG2 for liver and bile duct cancer (ieu4915); Table S4: Final IVs generated from urate associated with ABCG2 for liver and bile duct cancer (finn-b-C3_LIVER_INTRAHEPATIC_BILE_DUCTS); Table S5: Final IVs generated from urate associated with ABCG2 for cirrhosis of liver (finn-b-CHIRHEP_NAS); Table S6: Final IVs generated from urate associated with ABCG2 for NAFLD (ebi-a-GCST90091033); Table S7: The SNPs used for selected gene for MR on urate; Figure S1: The Funnel Plot, Forest Plot and Leave-One-Out of ABCG2 vs. liver cell carcinoma (A), liver and bile duct cancer (B: ieu-b-4915 & C: finn-b-C3_LIVER_INTRAHEPATIC_BILE_DUCTS_EXALLC), cirrhosis of liver (D) and NAFLD (E), respectively. Figure S2: Expression levels of selected genes in the TCGA-CHOL database. From A to S the genes were ABCG2, AR, XDH, CXCR1, UGT3A1, FOS, HSD17B2, TTR, CYP1A1, CXCL2, E2F1, CDK1, TOP2A, NOX4, NEK2, E2F2, PLK1, CDKN2A; Figure S3: Immune infiltration analysis based on GSE179433. Figure S4: Pan-cancer survival analysis of ABCG2.

Author Contributions

Conceptualization: Z.L.; methodology: Z.L. and Y.W.; writing—original draft: Z.L. and Y.W.; writing—review and editing: Z.L. and K.Y.; visualization, C.L.; supervision. M.Z.; project administration: Z.L. All authors have read and agreed to the published version of the manuscript.

Funding

This work was supported by the National Natural Science Foundation of China (32201977) and the Talent Introduction Project of Chengdu University (X2107, Y2021066).

Institutional Review Board Statement

Not applicable.

Informed Consent Statement

Patient consent was not required as the research utilized publicly available GWAS summary statistics data, which had already obtained informed consent from all participating studies in accordance with the protocols approved by their respective institutional review boards.

Data Availability Statement

All data used in this study are available in a public repository. The code involved in the data analysis process can be obtained by contacting the corresponding author.

Acknowledgments

We thank the GEO, OpenGWAS, and UK Biobank database teams for making the summary data publicly available, and we would like to acknowledge the principal investigators of the studies who made their data openly accessible for research. We also would like to thank the developers of sangerbox for making GEO data analyses easier. In addition, we are very grateful to Guido R.M.M. Haenen, for his invaluable help in this paper and his careful guidance.

Conflicts of Interest

The authors declare no conflicts of interest.

References

  1. Wang, G.; Wang, Y.; Yao, L.; Gu, W.; Zhao, S.; Shen, Z.; Lin, Z.; Liu, W.; Yan, T. Pharmacological activity of quercetin: An updated review. Evid.-Based Complement. Altern. Med. 2022, 2022, 3997190. [Google Scholar] [CrossRef] [PubMed]
  2. Chen, Y.-Q.; Chen, H.-Y.; Tang, Q.-Q.; Li, Y.-F.; Liu, X.-S.; Lu, F.-H.; Gu, Y.-Y. Protective effect of quercetin on kidney diseases: From chemistry to herbal medicines. Front. Pharmacol. 2022, 13, 968226. [Google Scholar] [CrossRef]
  3. Azeem, M.; Hanif, M.; Mahmood, K.; Ameer, N.; Chughtai, F.R.S.; Abid, U. An insight into anticancer, antioxidant, antimicrobial, antidiabetic and anti-inflammatory effects of quercetin: A review. Polym. Bull. 2023, 80, 241–262. [Google Scholar] [CrossRef] [PubMed]
  4. Petrick, J.L.; McGlynn, K.A. The changing epidemiology of primary liver cancer. Curr. Epidemiol. Rep. 2019, 6, 104–111. [Google Scholar] [CrossRef]
  5. Rumgay, H.; Arnold, M.; Ferlay, J.; Lesi, O.; Cabasag, C.J.; Vignat, J.; Laversanne, M.; McGlynn, K.A.; Soerjomataram, I. Global burden of primary liver cancer in 2020 and predictions to 2040. J. Hepatol. 2022, 77, 1598–1606. [Google Scholar] [CrossRef] [PubMed]
  6. Ladd, A.D.; Duarte, S.; Sahin, I.; Zarrinpar, A. Mechanisms of drug resistance in HCC. Hepatology 2024, 79, 926–940. [Google Scholar] [CrossRef]
  7. Sadagopan, N.; He, A.R. Recent progress in systemic therapy for advanced hepatocellular carcinoma. Int. J. Mol. Sci. 2024, 25, 1259. [Google Scholar] [CrossRef]
  8. Danpanichkul, P.; Aboona, M.B.; Sukphutanan, B.; Kongarin, S.; Duangsonk, K.; Ng, C.H.; Muthiah, M.D.; Huang, D.Q.; Seko, Y.; Díaz, L.A. Incidence of liver cancer in young adults according to the global burden of disease database 2019. Hepatology 2024, 80, 828–843. [Google Scholar] [CrossRef]
  9. Hisaka, T.; Sakai, H.; Sato, T.; Goto, Y.; Nomura, Y.; Fukutomi, S.; Fujita, F.; Mizobe, T.; Nakashima, O.; Tanigawa, M. Quercetin suppresses proliferation of liver cancer cell lines in vitro. Anticancer Res. 2020, 40, 4695–4700. [Google Scholar] [CrossRef]
  10. Sethi, G.; Rath, P.; Chauhan, A.; Ranjan, A.; Choudhary, R.; Ramniwas, S.; Sak, K.; Aggarwal, D.; Rani, I.; Tuli, H.S. Apoptotic mechanisms of quercetin in liver cancer: Recent trends and advancements. Pharmaceutics 2023, 15, 712. [Google Scholar] [CrossRef]
  11. Wu, L.; Yang, W.; Zhang, Y.; Du, X.; Jin, N.; Chen, W.; Li, H.; Zhang, S.; Xie, B. Elevated serum uric acid is associated with poor survival in advanced HCC patients and febuxostat improves prognosis in HCC rats. Front. Pharmacol. 2021, 12, 778890. [Google Scholar] [CrossRef] [PubMed]
  12. Hayashi, M.; Yamada, S.; Tanabe, H.; Takami, H.; Inokawa, Y.; Sonohara, F.; Shimizu, D.; Hattori, N.; Kanda, M.; Tanaka, C. High serum uric acid levels could be a risk factor of hepatocellular carcinoma recurrences. Nutr. Cancer 2021, 73, 996–1003. [Google Scholar] [CrossRef]
  13. Allegrini, S.; Garcia-Gil, M.; Pesi, R.; Camici, M.; Tozzi, M.G. The good, the bad and the new about uric acid in cancer. Cancers 2022, 14, 4959. [Google Scholar] [CrossRef]
  14. Mi, S.; Gong, L.; Sui, Z. Friend or foe? An unrecognized role of uric acid in cancer development and the potential anticancer effects of uric acid-lowering drugs. J. Cancer 2020, 11, 5236. [Google Scholar] [CrossRef]
  15. Bahriz, H.A.; Abdelaziz, R.R.; El-Kashef, D.H. Allopurinol abates hepatocellular carcinoma in rats via modulation of NLRP3 inflammasome and NF-κB pathway. Naunyn-Schmiedebergs Arch. Pharmacol. 2024, 398, 6043–6058. [Google Scholar] [CrossRef]
  16. Rao, H.; Wang, Q.; Zeng, X.; Wen, X.; Huang, L. Analysis of the prognostic value of uric acid on the efficacy of immunotherapy in patients with primary liver cancer. Clin. Transl. Oncol. 2024, 26, 774–785. [Google Scholar] [CrossRef] [PubMed]
  17. Zhou, Y.; Li, J.; Ma, Y.; Tang, M.; Yuan, X.; Shen, L. Elevated serum uric acid is associated with the risk of advanced staging and vascular involvement in patients with hepatoblastoma: A 14-year retrospective study. Front. Oncol. 2023, 13, 1144349. [Google Scholar] [CrossRef]
  18. Li, W.; Chen, X.; Li, F.; Huiyao, Z.; Song, Z.; Li, D. Quercetin ameliorates hyperuricemic nephropathy by repressing uric acid synthesis and reabsorption in mice and cells. eFood 2024, 5, e139. [Google Scholar] [CrossRef]
  19. Shi, Y.; Williamson, G. Quercetin lowers plasma uric acid in pre-hyperuricaemic males: A randomised, double-blinded, placebo-controlled, cross-over trial. Br. J. Nutr. 2016, 115, 800–806. [Google Scholar] [CrossRef]
  20. Xie, R.; Zhang, Y. Associations between dietary flavonoid intake with hepatic steatosis and fibrosis quantified by VCTE: Evidence from NHANES and FNDDS. Nutr. Metab. Cardiovasc. Dis. 2023, 33, 1179–1189. [Google Scholar] [CrossRef]
  21. Sanderson, E.; Glymour, M.M.; Holmes, M.V.; Kang, H.; Morrison, J.; Munafò, M.R.; Palmer, T.; Schooling, C.M.; Wallace, C.; Zhao, Q. Mendelian randomization. Nat. Rev. Methods Primers 2022, 2, 6. [Google Scholar] [CrossRef]
  22. Fatima, T.; Dehlin, M.; Burgess, S.; Mason, A.M.; Nilsson, P.M.; Melander, O.; Jacobsson, L.T.; Kapetanovic, M.C. Genetically Predicted Serum Urate and the Risk of All-Cause and Site-Specific Cancer: A Mendelian Randomization Study; eLife Sciences Publications Ltd.: Cambridge, UK, 2024. [Google Scholar]
  23. Schmidt, A.F.; Finan, C.; Gordillo-Marañón, M.; Asselbergs, F.W.; Freitag, D.F.; Patel, R.S.; Tyl, B.; Chopade, S.; Faraway, R.; Zwierzyna, M. Genetic drug target validation using Mendelian randomisation. Nat. Commun. 2020, 11, 3255. [Google Scholar] [CrossRef] [PubMed]
  24. Wang, W.; Li, W.; Zhang, D.; Mi, Y.; Zhang, J.; He, G. The causal relationship between PCSK9 inhibitors and malignant tumors: A mendelian randomization study based on drug targeting. Genes 2024, 15, 132. [Google Scholar] [CrossRef] [PubMed]
  25. Zu, G.; Sun, K.; Li, L.; Zu, X.; Han, T.; Huang, H. Mechanism of quercetin therapeutic targets for Alzheimer disease and type 2 diabetes mellitus. Sci. Rep. 2021, 11, 22959. [Google Scholar] [CrossRef] [PubMed]
  26. Daina, A.; Michielin, O.; Zoete, V. SwissTargetPrediction: Updated data and new features for efficient prediction of protein targets of small molecules. Nucleic Acids Res. 2019, 47, W357–W364. [Google Scholar] [CrossRef]
  27. Burgess, S.; Butterworth, A.; Thompson, S.G. Mendelian randomization analysis with multiple genetic variants using summarized data. Genet. Epidemiol. 2013, 37, 658–665. [Google Scholar] [CrossRef]
  28. Bowden, J.; Davey Smith, G.; Haycock, P.C.; Burgess, S. Consistent estimation in Mendelian randomization with some invalid instruments using a weighted median estimator. Genet. Epidemiol. 2016, 40, 304–314. [Google Scholar] [CrossRef]
  29. Verbanck, M.; Chen, C.-Y.; Neale, B.; Do, R. Detection of widespread horizontal pleiotropy in causal relationships inferred from Mendelian randomization between complex traits and diseases. Nat. Genet. 2018, 50, 693–698. [Google Scholar] [CrossRef]
  30. Burgess, S.; Thompson, S.G. Interpreting findings from Mendelian randomization using the MR-Egger method. Eur. J. Epidemiol. 2017, 32, 377–389. [Google Scholar] [CrossRef]
  31. Ashburner, M.; Ball, C.A.; Blake, J.A.; Botstein, D.; Butler, H.; Cherry, J.M.; Davis, A.P.; Dolinski, K.; Dwight, S.S.; Eppig, J.T. Gene ontology: Tool for the unification of biology. Nat. Genet. 2000, 25, 25–29. [Google Scholar] [CrossRef]
  32. Subramanian, A.; Tamayo, P.; Mootha, V.K.; Mukherjee, S.; Ebert, B.L.; Gillette, M.A.; Paulovich, A.; Pomeroy, S.L.; Golub, T.R.; Lander, E.S. Gene set enrichment analysis: A knowledge-based approach for interpreting genome-wide expression profiles. Proc. Natl. Acad. Sci. USA 2005, 102, 15545–15550. [Google Scholar] [CrossRef] [PubMed]
  33. Aran, D.; Hu, Z.; Butte, A.J. xCell: Digitally portraying the tissue cellular heterogeneity landscape. Genome Biol. 2017, 18, 220. [Google Scholar] [CrossRef]
  34. Li, T.; Fan, J.; Wang, B.; Traugh, N.; Chen, Q.; Liu, J.S.; Li, B.; Liu, X.S. TIMER: A web server for comprehensive analysis of tumor-infiltrating immune cells. Cancer Res. 2017, 77, e108–e110. [Google Scholar] [CrossRef] [PubMed]
  35. Wickham, H. ggplot2. WIREs Comput. Stat. 2011, 3, 180–185. [Google Scholar] [CrossRef]
  36. Kang, D.-H.; Ha, S.-K. Uric acid puzzle: Dual role as anti-oxidantand pro-oxidant. Electrolytes Blood Press. E BP 2014, 12, 1. [Google Scholar] [CrossRef]
  37. Braga, T.T.; Forni, M.F.; Correa-Costa, M.; Ramos, R.N.; Barbuto, J.A.; Branco, P.; Castoldi, A.; Hiyane, M.I.; Davanso, M.R.; Latz, E. Soluble uric acid activates the NLRP3 inflammasome. Sci. Rep. 2017, 7, 39884. [Google Scholar] [CrossRef]
  38. Yen, P.-C.; Chou, Y.-T.; Li, C.-H.; Sun, Z.-J.; Wu, C.-H.; Chang, Y.-F.; Lu, F.-H.; Yang, Y.-C.; Chang, C.-J.; Wu, J.-S. Hyperuricemia is associated with significant liver fibrosis in subjects with nonalcoholic fatty liver disease, but not in subjects without it. J. Clin. Med. 2022, 11, 1445. [Google Scholar] [CrossRef]
  39. Eckenstaler, R.; Benndorf, R.A. The role of ABCG2 in the pathogenesis of primary hyperuricemia and gout—An update. Int. J. Mol. Sci. 2021, 22, 6678. [Google Scholar] [CrossRef]
  40. Krishnamurthy, P.; Schuetz, J. Role of ABCG2/BCRP in biology and medicine. Annu. Rev. Pharmacol. Toxicol. 2006, 46, 381–410. [Google Scholar] [CrossRef]
  41. Hoque, K.M.; Dixon, E.E.; Lewis, R.M.; Allan, J.; Gamble, G.D.; Phipps-Green, A.J.; Halperin Kuhns, V.L.; Horne, A.M.; Stamp, L.K.; Merriman, T.R. The ABCG2 Q141K hyperuricemia and gout associated variant illuminates the physiology of human urate excretion. Nat. Commun. 2020, 11, 2767. [Google Scholar] [CrossRef]
  42. Song, Y.-K.; Yoon, J.-H.; Woo, J.K.; Kang, J.-H.; Lee, K.-R.; Oh, S.H.; Chung, S.-J.; Maeng, H.-J. Quercetin is a flavonoid breast cancer resistance protein inhibitor with an impact on the oral pharmacokinetics of sulfasalazine in rats. Pharmaceutics 2020, 12, 397. [Google Scholar] [CrossRef] [PubMed]
  43. Liang, S.; Xu, D.; Wu, J.; Jiang, Q.; Zeng, Y. Phyllanthi Fructus ameliorates hyperuricemia and kidney injure via inhibiting uric acid synthesis, modulating urate transporters, and alleviating inflammation. Sci. Rep. 2024, 14, 27605. [Google Scholar] [CrossRef]
  44. Mo, W.; Zhang, J.-T. Human ABCG2: Structure, function, and its role in multidrug resistance. Int. J. Biochem. Mol. Biol. 2011, 3, 1. [Google Scholar]
  45. Tan, S.; Radi, R.; Gaudier, F.; Evans, R.A.; Rivera, A.; Kirk, K.A.; Parks, D.A. Physiologic levels of uric acid inhibit xanthine oxidase in human plasma. Pediatr. Res. 1993, 34, 303–307. [Google Scholar] [CrossRef]
  46. Lin, Z.; Xie, Y.-Z.; Zhao, M.-C.; Hou, P.-P.; Tang, J.; Chen, G.-L. Xanthine dehydrogenase as a prognostic biomarker related to tumor immunology in hepatocellular carcinoma. Cancer Cell Int. 2021, 21, 1–14. [Google Scholar] [CrossRef] [PubMed]
  47. Zhu JiXiao, Z.J.; Wang Ying, W.Y.; Kong LingDong, K.L.; Yang Cheng, Y.C.; Zhang Xin, Z.X. Effects of Biota orientalis extract and its flavonoid constituents, quercetin and rutin on serum uric acid levels in oxonate-induced mice and xanthine dehydrogenase and xanthine oxidase activities in mouse liver. J. Ethnopharmacol. 2004, 93, 133–140. [Google Scholar]
  48. Cheng, M.; Yuan, C.; Ju, Y.; Liu, Y.; Shi, B.; Yang, Y.; Jin, S.; He, X.; Zhang, L.; Min, D. Quercetin Attenuates Oxidative Stress and Apoptosis in Brain Tissue of APP/PS1 Double Transgenic AD Mice by Regulating Keap1/Nrf2/HO-1 Pathway to Improve Cognitive Impairment. Behav. Neurol. 2024, 2024, 5698119. [Google Scholar] [CrossRef]
  49. Luo, X.; Weng, X.; Bao, X.; Bai, X.; Lv, Y.; Zhang, S.; Chen, Y.; Zhao, C.; Zeng, M.; Huang, J. A novel anti-atherosclerotic mechanism of quercetin: Competitive binding to KEAP1 via Arg483 to inhibit macrophage pyroptosis. Redox Biol. 2022, 57, 102511. [Google Scholar] [CrossRef]
Figure 1. Estimation of causal effects of selected genes on urate levels (IVW: Inverse Variance Weighted method; Hazard Ratio (95% CI) = OR; The Red spots represent the OR values).
Genes 16 00449 g001
Figure 2. MR results for ABCG2 expression in liver diseases. The causal relationships that have a p-value < 0.05 are marked in red (MR-Egger: Mendelian randomization-Egger; WM: weighted median).
Genes 16 00449 g002
Figure 3. Scatter plots illustrating the relationship between ABCG2 expression and (A) HCC; (B) liver and bile duct cancer; (C) intrahepatic bile duct cancer (all cancers excluded); (D) cirrhosis of the liver; and (E) NAFLD. Red spot represent SNPs.
Genes 16 00449 g003
Figure 4. Single-cell RNA sequencing analysis based on GSE138709. (A) Clustering of cells by type, (B) clustering of cells by normal versus tumor groups, (C) ABCG2 expression across different cell clusters, and (D) ABCG2 expression specifically in endothelial cells.
Genes 16 00449 g004
Figure 5. Immune infiltration and GO analysis based on TCGA-CHOL. (A) Immune infiltration analysis, (B) GSEA using KEGG datasets, (C) GO analysis of downregulated genes, and (D) GO analysis of upregulated genes.
Genes 16 00449 g005
Figure 6. KM plot of ABCG2 expression in KIRC (A), KIPAN (B), LIHC (C) and CHOL(CCA) (D).
Genes 16 00449 g006
Table 1. Characteristics of the GWAS cohorts.
CharacteristicsGWAS-IDTypeSample SizeNumber of SNPs
Uric acid (Urate)ebi-a-GCST90014015Exposure389,40410,783,684
Liver cell carcinomaieu-b-4953Outcome372,1846,304,034
Liver and bile duct cancerieu-b-4915Outcome372,3667,687,713
Malignant neoplasm of liver and intrahepatic bile ductsfinn-b-C3_LIVER_INTRAHEPATIC_BILE_DUCTS_EXALLCOutcome174,00616,380,303
Chirrosis of liverfinn-b-CHIRHEP_NASOutcome217,33416,380,465
NAFLDebi-a-GCST90091033Outcome778,1646,784,388
Table 2. Heterogeneity and pleiotropy analyses of urate (ABCG2) on liver cancer.
Disease TypeMethodsSNPsHeterogeneitypPleiotropyp
Liver cell carcinoma
(ieu-b-4953)
MR Egger2014.4740.6982.9 × 10−50.181
IVW2016.4090.630
Liver and bile duct cancer
(ieu-b-4915)
MR Egger2846.5847.8 × 10−34.6 × 10−50.600
IVW2847.0889.7 × 10−3
Liver and bile duct cancer
(finn-b-C3_LIVER_INTRAHEPATIC_BILE_DUCTS_EXALLC)
MR Egger4629.8460.9490.040 0.692
IVW4630.0040.958
Chirrosis of liver
(finn-b-CHIRHEP_NAS)
MR Egger4646.0330.3880.0330.840
IVW4646.0760.427
NAFLD
(ebi-a-GCST90091033)
MR Egger4065.0874.0 × 10−30.0100.607
IVW4065.5474.9 × 10−3
Disclaimer/Publisher’s Note: The statements, opinions and data contained in all publications are solely those of the individual author(s) and contributor(s) and not of MDPI and/or the editor(s). MDPI and/or the editor(s) disclaim responsibility for any injury to people or property resulting from any ideas, methods, instructions or products referred to in the content.

