1. Introduction
Hepatocellular carcinoma (HCC) is the most prevalent liver cancer with a high mortality rate and dismal prognosis. Although multiple treatment modalities exist for HCC, including surgical resection, loco-regional therapies, and systemic therapies, the outcomes remain suboptimal [
1]. Enhancing antitumor immunity using immune checkpoint blockade (ICB), including anti-CTLA-4, anti-PD-1 (aPD1), and anti-PD-L1 (aPD-L1) antibodies, has demonstrated the potential to transform the therapeutic landscape of many cancers including HCC. Around 50% of patients with HCC receive systemic therapies, traditionally sorafenib; Lenvatinib in the first line; and pembrolizumab, regorafenib, cabozantinib or ramucirumab in the second line. One meta-analysis showed that lenvatinib determined a longer PFS and higher response rates as compared to sorafenib, although a clear survival benefit was not observed [
2]. However, despite demonstrating promising a therapeutic potential across various cancer types, the efficacy of ICB in HCC patients remains inconsistent, with only a subset of patients deriving substantial benefits [
3]. Identifying biomarkers associated with ICB efficacy that are also easy to detect is crucial for predicting patient responses to treatment and devising personalized therapeutic regimens. This has become a key focus in the research of immunotherapy for liver cancer.
Currently, most studies have concentrated on the expression and diversity of T cell subsets in peripheral blood, such as CD8
+PD-1
+T cells and tumor-specific neoantigen T cells, whose potential as biomarkers has been validated [
4,
5]. Monocytes, as essential components of the immune system, play pivotal roles within the tumor microenvironment (TME), particularly in regulating immune responses and facilitating tumor immune escape [
6] Monocytes can differentiate into a variety of subtypes, including dendritic cells and macrophages, which control T cell activity by presenting antigens and secreting cytokines. Monocytes can differentiate into various subtypes, including macrophages and dendritic cells, participating in antigen presentation and cytokine secretion, thereby modulating T cell activity. Programmed Death-Ligand 1 (PD-L1) is a critical immunosuppressive molecule expressed on tumor cells and antigen-presenting cells. By binding to the PD-1 receptor, PD-L1 can inhibit T cell proliferation and cytotoxic functions, leading to immune escape [
7,
8]. Studies have found that high PD-L1 expression in monocytes is closely associated with resistance to ICB therapy, suggesting that monocytes may play a dual role in both the TME and peripheral immunity. However, the specific molecular mechanisms regulating PD-L1 expression in monocytes remain unclear and warrant further investigation. However, further research is desperately needed to determine the precise molecular pathways that control PD-L1 expression in monocytes.
Through the analysis of gene expression in monocytes from non-responders (NR) and responders (R) to PD-1 inhibitors, we identified that G0/G1 Switch Gene 2 (
G0S2), also known as Growth Inhibition-Specific Gene 2, is significantly upregulated in the monocytes of NR patients [
9]. G0S2 has garnered extensive attention in recent years as a regulatory factor, initially named for its role in the G0/G1 cell cycle transition. The protein encoded by the
G0S2 gene is involved in various biological processes, including cell cycle regulation, lipid metabolism, and immune modulation. Specifically, G0S2 interacts with Adipose Triglyceride Lipase, inhibiting the mobilization and oxidation of fatty acids, thereby maintaining lipid metabolic balance. Additionally, G0S2 exhibits diverse regulatory functions in apoptosis, autophagy, and energy metabolism. In the context of tumor biology, the mechanisms by which G0S2 operates are not yet fully understood. Existing studies suggest that G0S2 may have dual roles in multiple cancer types, potentially acting as a tumor suppressor by regulating the cell cycle and apoptosis, while also supporting tumor cell growth and survival through metabolic pathway modulation. Particularly in HCC, the expression levels and regulatory mechanisms of G0S2 have not been thoroughly investigated, and its potential role in immune regulation remains unreported.
This study aims to validate the regulatory role of G0S2 in promoting PD-L1 expression in monocytes, elucidate its impact on T cell function within the immunosuppressive environment, and further explore its potential as a predictive biomarker and therapeutic target for ICB efficacy. Our findings are expected to provide new insights and possible combination therapy strategies to enhance the ICB efficacy in HCC patients.
2. Materials and Methods
2.1. Exploration of the Relationship Between PD-1 Inhibitor Resistance and Gene Expression in Peripheral Blood Mononuclear Cells
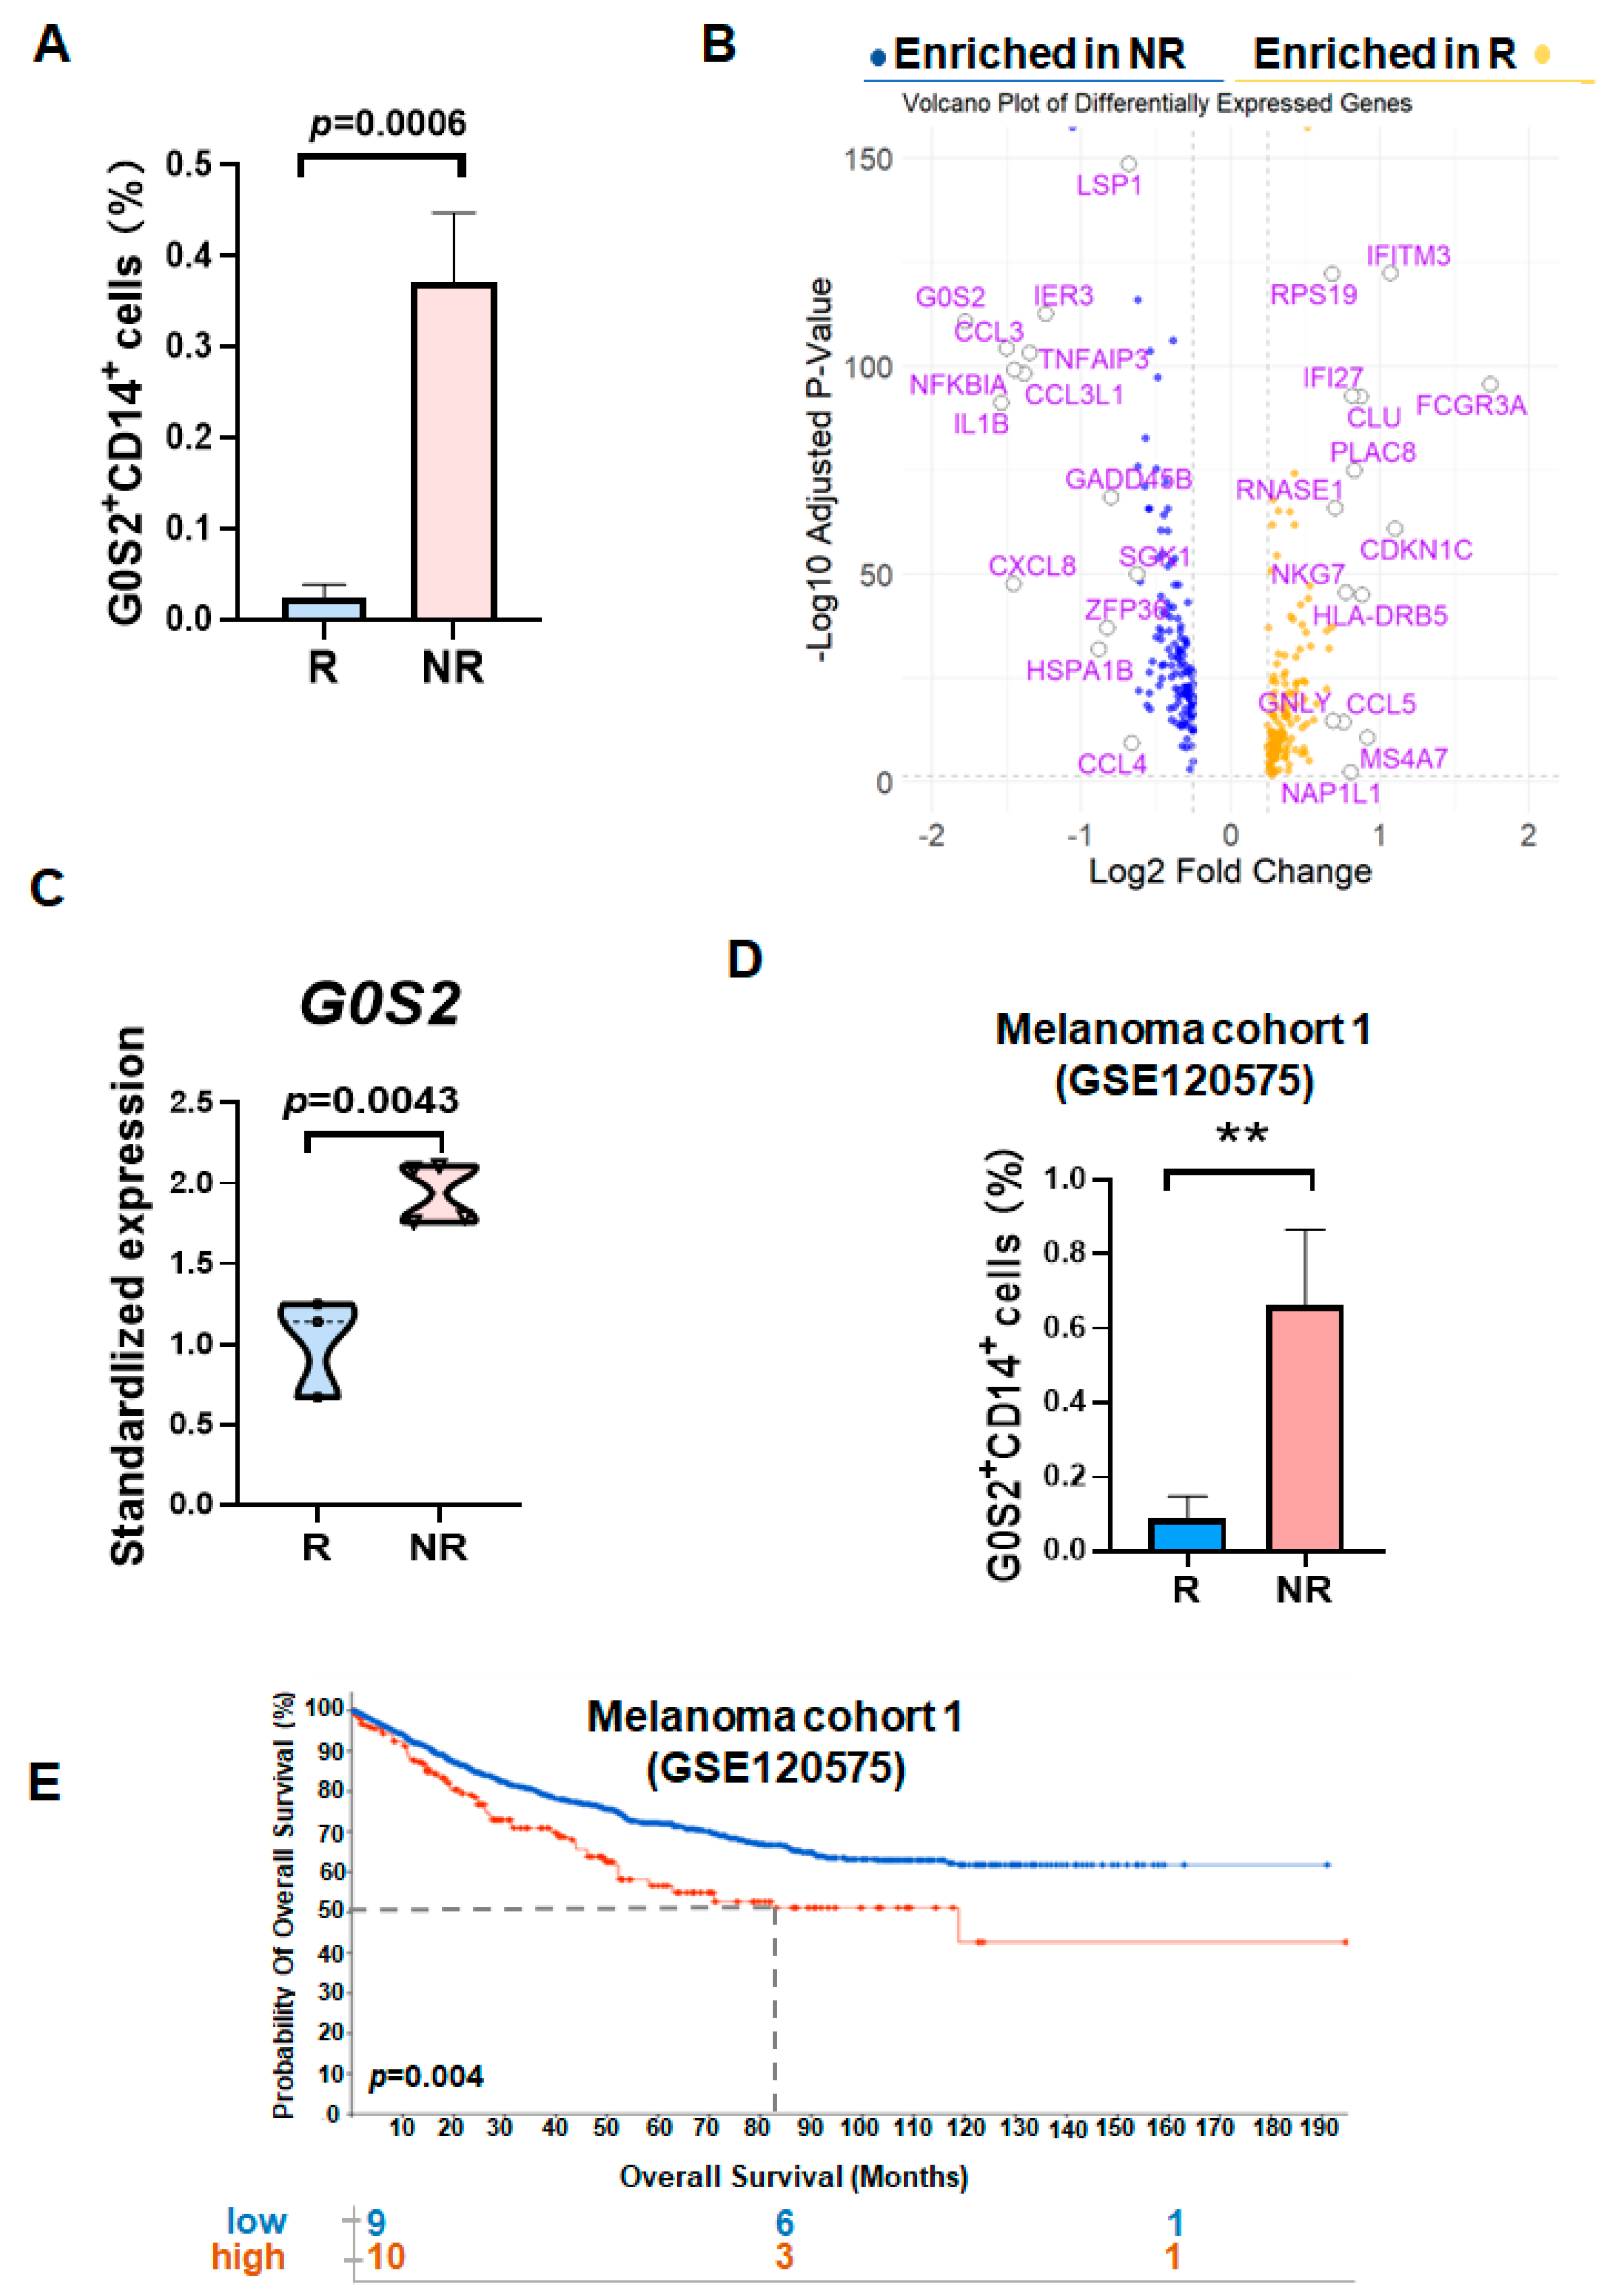
Gene expression data for NR and R among HCC patients treated with PD-1 inhibitors were obtained from the HCC single-cell sequencing database (HRA004885). The patients were derived from the KEYNOTE394 trial (ClinicalTrials.gov ID: NCT03062358) [
10], in which patients with advanced HCC received pembrolizumab via intravenous infusion on Day 1 of each 3-week cycle for up to 35 cycles, in addition to best supportive care. Patients were initially categorized into R and NR based on their treatment responses. Seven blood samples were collected prior to pembrolizumab treatment (4 from the NR group and 3 from the R group) [
11]. Data preprocessing was performed using the Seurat package (v4.0.3), including data normalization, identification of highly variable genes, and data scaling. Principal Component Analysis (PCA) was conducted for dimensionality reduction, followed by visualization clustering using UMAP or t-SNE methods. Differentially expressed genes between NR and R patients were identified using the FindMarkers function, with selection criteria set at |log
2FoldChange| > 0.25 and adjusted
p-value < 0.05. Volcano plots were generated using the ggplot2 package to highlight differentially expressed genes, with significantly upregulated and downregulated genes marked in different colors.
2.2. Validation of G0S2 Expression Using a Validation Dataset
To validate the differential expression of G0S2 in tumor patients, the melanoma validation dataset (GSE120575) from the GEO database was analyzed. The limma package was used to process the validation dataset, including data import, background correction, and normalization. Gene expression data for NR and R patients were extracted, and the differential expression of G0S2 between these two groups was calculated. Box plots were created using the ggplot2 package to display the differences in G0S2 expression levels between NR and R patients, and statistical significance was assessed using tests such as the t-test or Mann–Whitney U test. To further validate the correlation between G0S2 expression and survival prognosis, survival analysis was conducted using the survival and survminer packages. Kaplan–Meier survival curves were added to
Figure 1 to compare the survival rates of patients with high and low G0S2 expression, with p-values and hazard ratios (HR) calculated for survival differences, and confidence intervals annotated on the survival curves.
2.3. Patient Sample Collection
Blood samples from HCC patients were obtained from the Oncology Department of Renmin Hospital of Wuhan University, tissue sections were sourced from the Pathology Department of Renmin Hospital of Wuhan University, and samples from healthy volunteers were collected from the Health Examination Center of Renmin Hospital of Wuhan University (patient information in
Supplementary Table S2). All participants provided informed consent, and the study was approved by the Ethics Committee of the Life Sciences Medical Ethics Committee of Wuhan University (Approval No. 20220007). Collected peripheral blood samples were immediately stored in EDTA anticoagulant tubes and peripheral blood mononuclear cells (PBMCs) were isolated within 2 h using the Ficoll-Paque density gradient centrifugation method (Catalog No. 17-1440-02, GE Healthcare, Chicago, IL, USA) Blood samples were diluted 1:1 with PBS and gently layered over Ficoll solution, followed by centrifugation at 800×
g for 30 min without braking. The PBMC layer was collected, washed twice with PBS, and stored for subsequent experiments.
2.4. Multiplex Immunohistochemical Staining (mIHC)
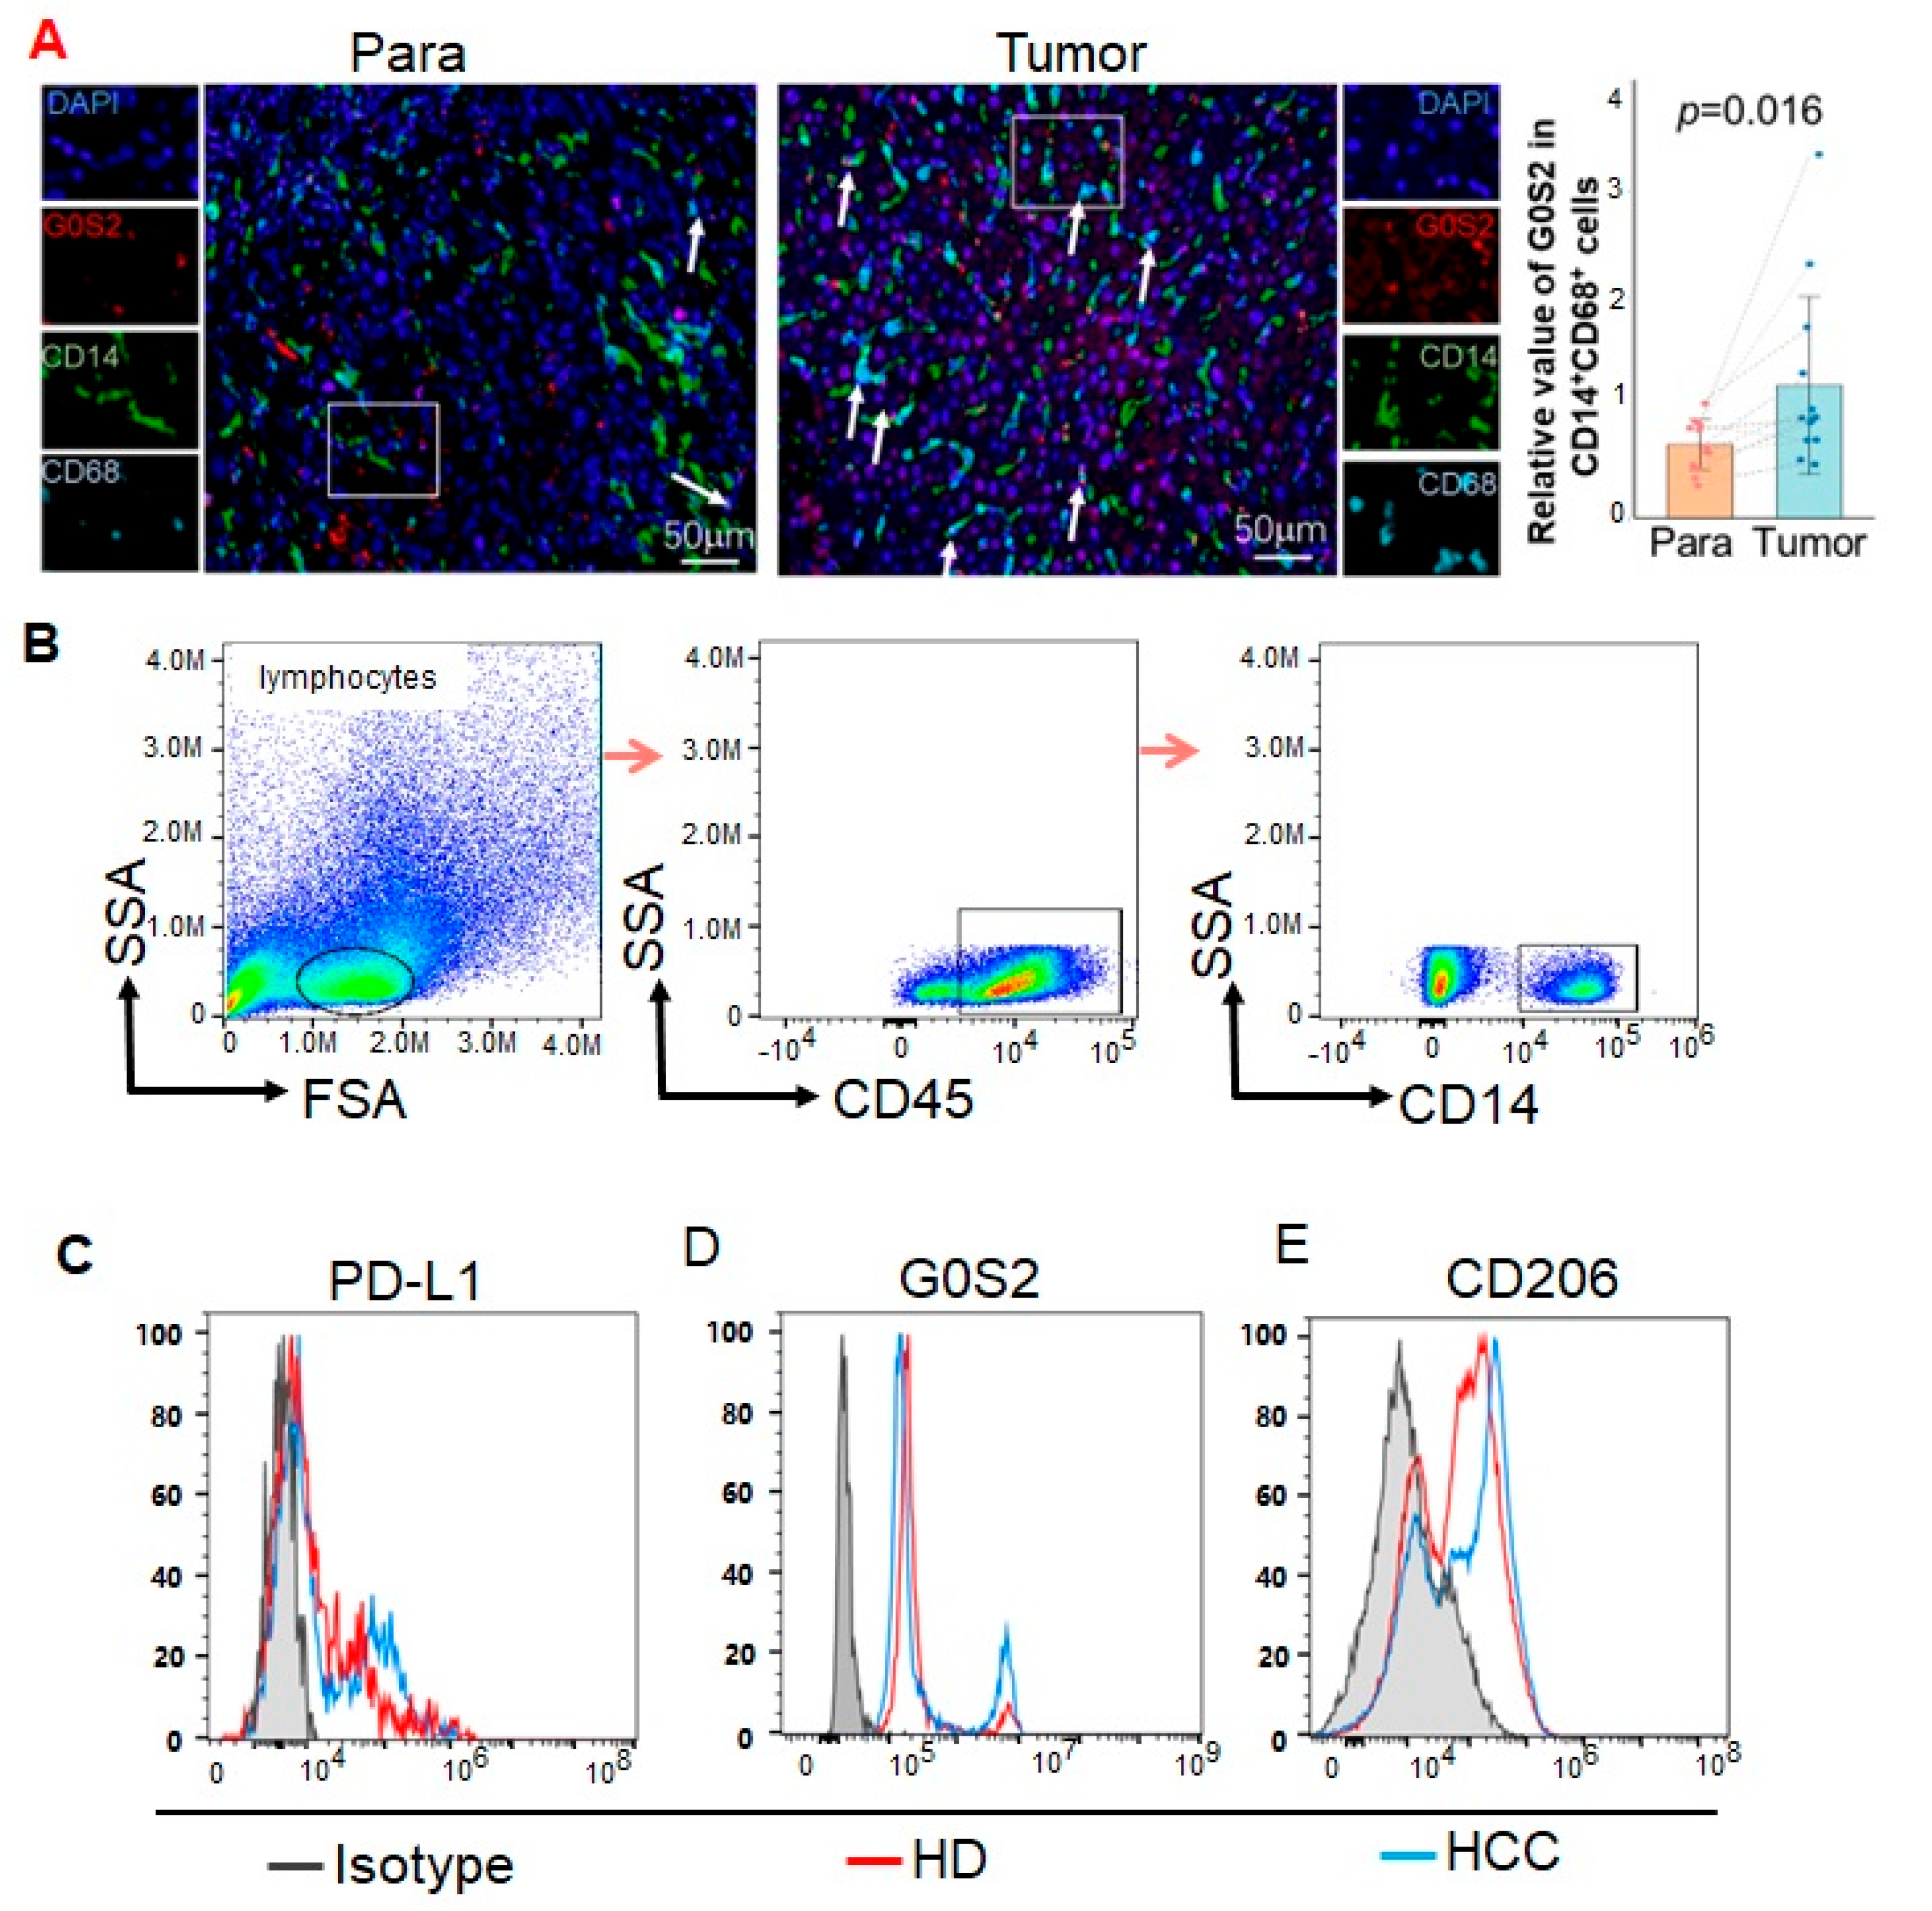
We performed mIHC staining on tissues using an Opal 7-Color IHC Kit (Catalog No. NEL811001KT, Akoya, Waltham, MA, USA). The stained slides were scanned using a Vectra 3.0 multispectral imaging system (Akoya, Waltham, MA, USA). The immunofluorescence markers used were CD14 (Catalog No. 75181T, Cell Signaling Technology, Boston, MA, USA), CD68 (Catalog No. M087601-2CN, Agilent Technologies, Santa Clara, CA, USA), and G0S2 (Catalog No.12091-1-AP, Proteintech, Chicago, IL, USA). The effects of each primary antibody were visualized via tyramide signal amplification in combination with specific fluorochromes from multiplex immunohistochemistry kits. We strictly adhered to the instructions provided by the manufacturer throughout the entire mIHC procedure. mIHC-stained slides were scanned under fluorescence illumination using a Vectra 3.0 multispectral microscope system and InForm 3.0 software. On each slide, Vectra automatically collects fluorescence spectra from 420 nm to 720 nm with an optimal exposure time interval of 20 nm. Next, the acquired images are combined into a single stacked image, preserving all IF-labeled particle spectral signatures.
2.5. Flow Cytometry Staining
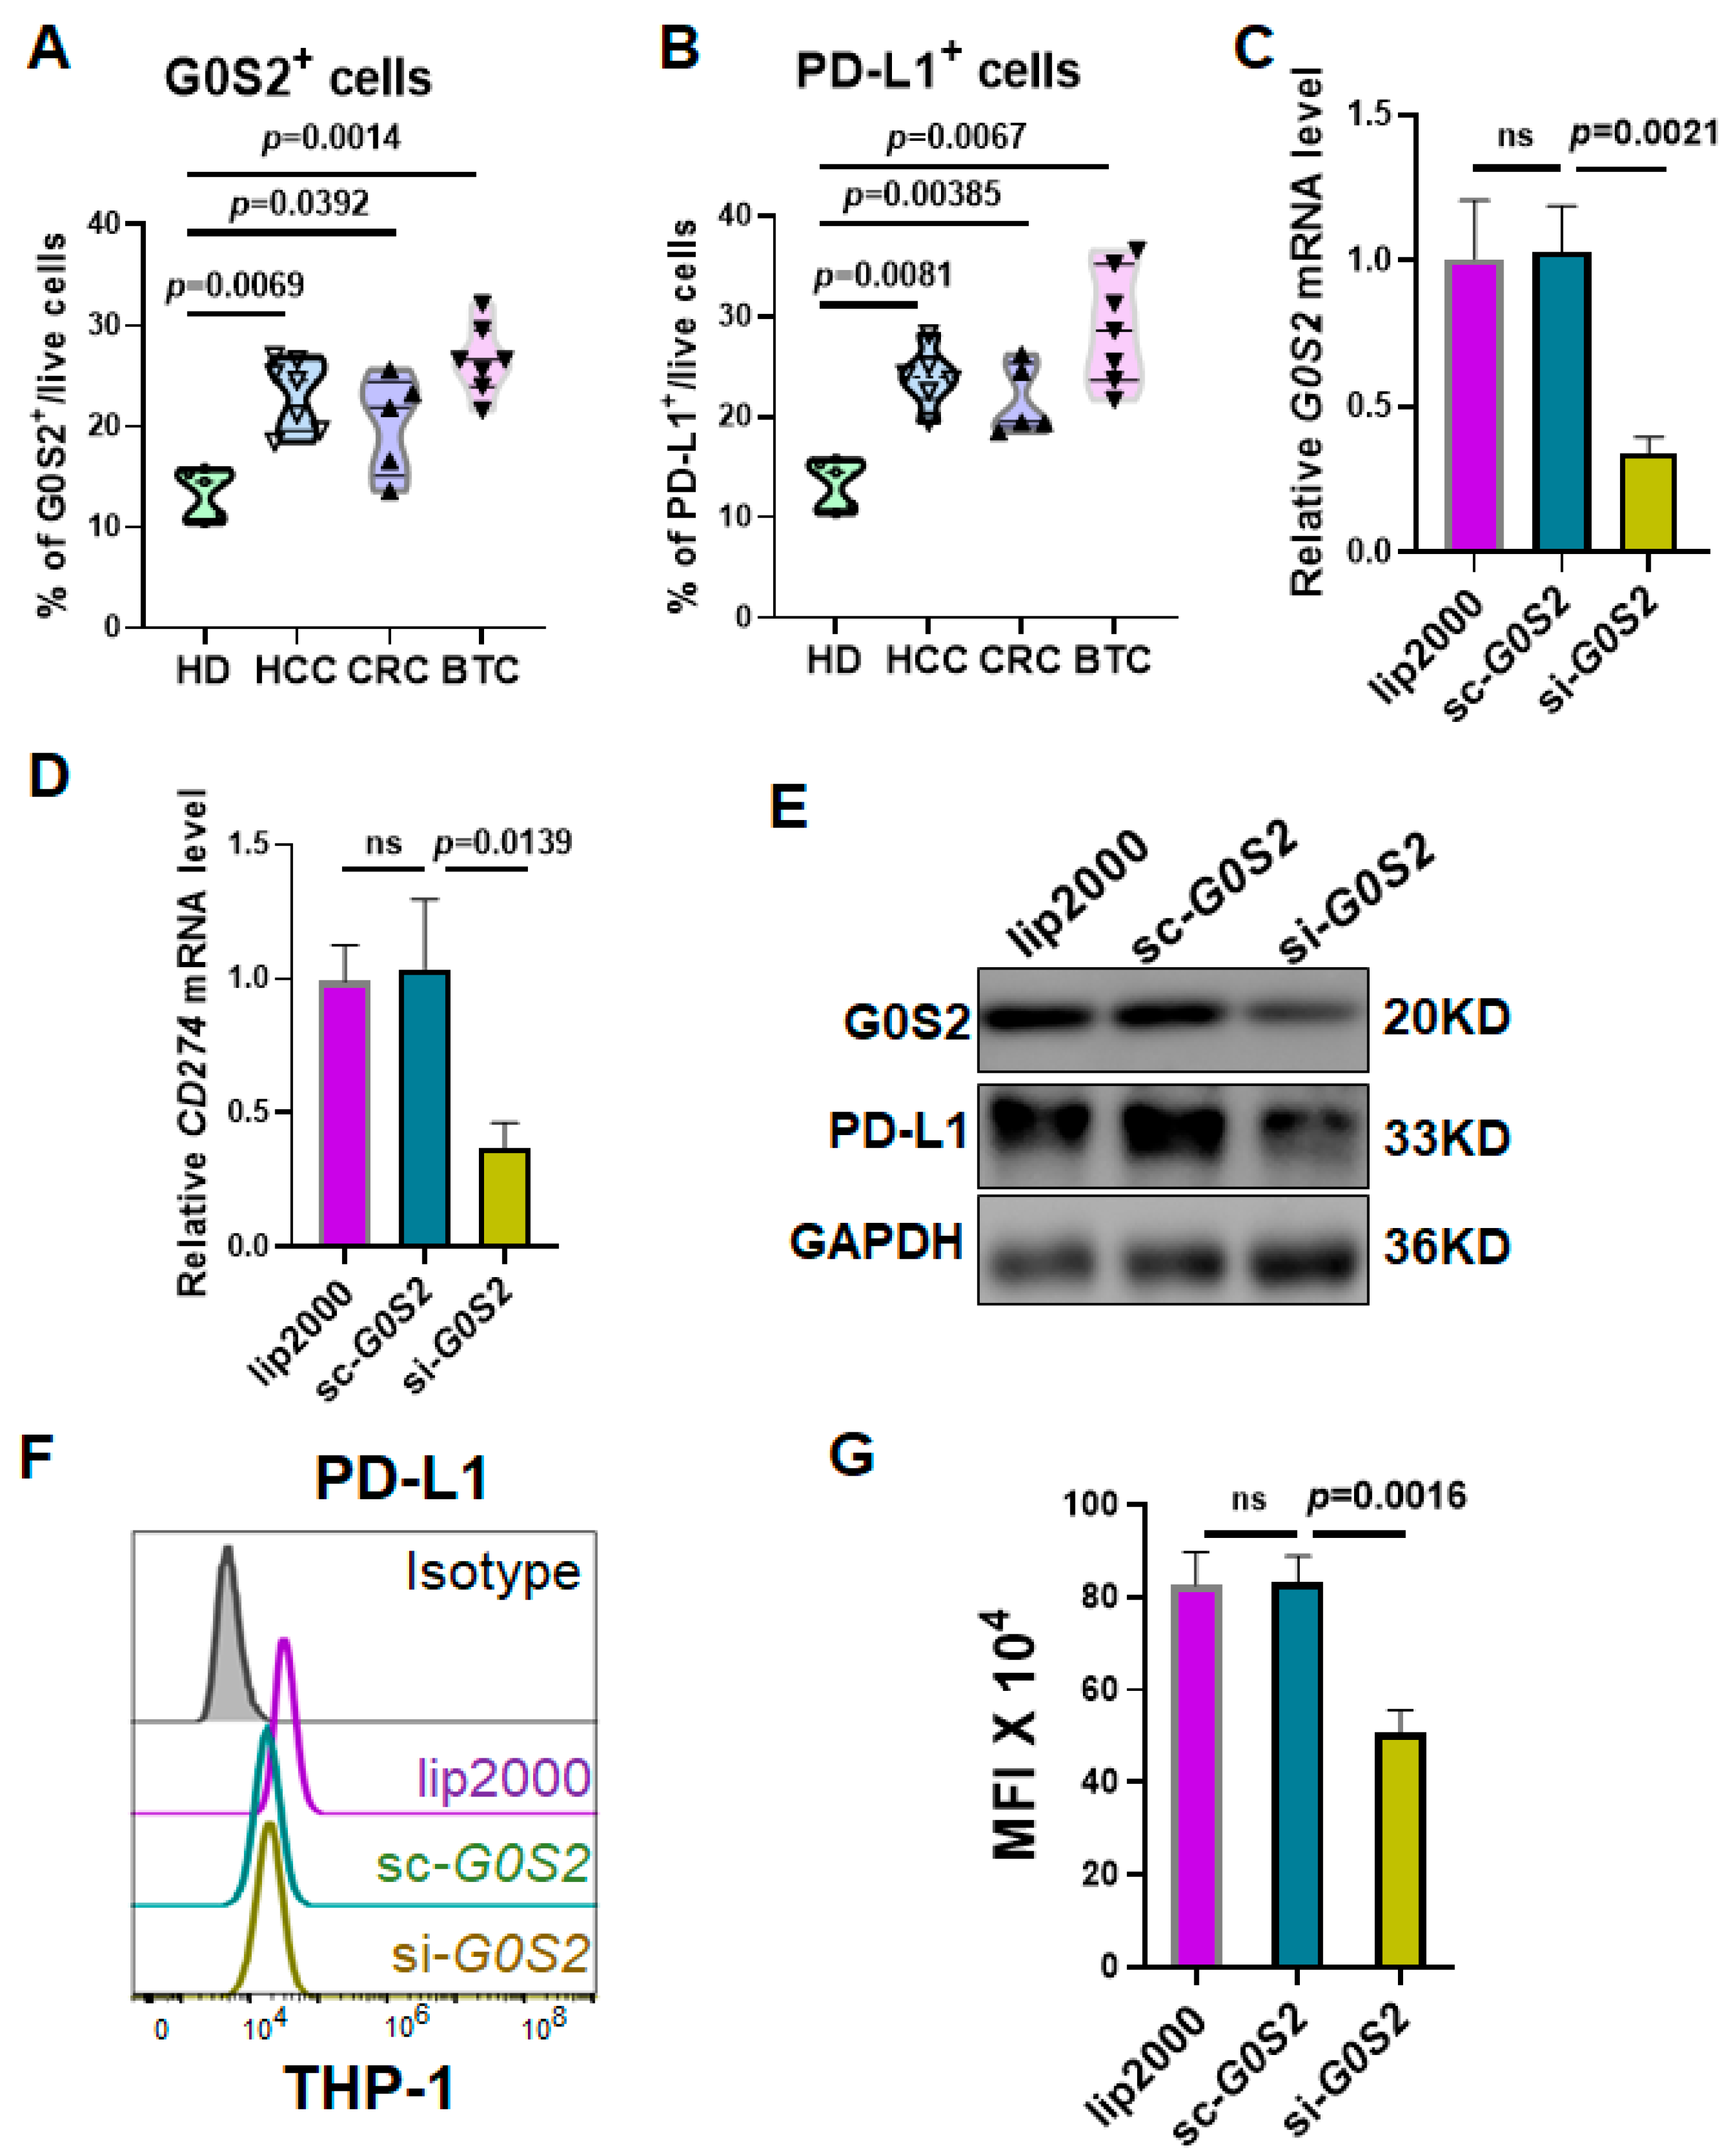
Flow cytometry was utilized to analyze the expression of G0S2, PD-L1, CD206, and CD14 in PBMCs from HCC patients. PBMCs were resuspended at a concentration of 1 × 10⁶ cells per tube in flow cytometry buffer and incubated with FcγR blocking reagent (Catalog No. 422302, BioLegend, San Diego, CA, USA) at 4 °C for 15 min to reduce non-specific binding. Subsequently, cell membrane staining was performed by adding anti-PD-L1-PE (BioLegend, Catalog No. 329706), anti-CD206-FITC (Catalog No. 321106, BioLegend), and anti-CD14-APC (Catalog No. 325608, BioLegend) antibodies, followed by incubation at 4 °C in the dark for 30 min. To detect intracellular G0S2 expression, cells underwent fixation and permeabilization using the BD Cytofix/Cytoperm kit (Catalog No. 554714, BD Biosciences, San Jose, CA, USA) after membrane staining. Following fixation and permeabilization, cells were incubated with primary anti-G0S2 antibody (Catalog No. G0S2-101AP, Thermo Fisher Scientific, Waltham, MA, USA) at 4 °C in the dark for 30 min. After washing, cells were incubated with PE-CY5-conjugated secondary antibody (Catalog No. 405207, BioLegend) at 4 °C in the dark for 30 min. Post-staining, cells were washed and resuspended in 500 μL of flow cytometry buffer. Samples were analyzed using the BD LSRFortessa flow cytometer, and data were processed with FlowJo software 10.8.1. Quantitative analysis of G0S2, PD-L1, CD206, and CD14 expression was performed, and cell subpopulations were categorized based on marker expression levels.
2.6. RT-PCR
Reverse transcription-polymerase chain reaction (RT-PCR) was employed to assess the expression levels of G0S2 and PD-L1 (CD274) in different groups of THP-1 cells. Total RNA was extracted using the Trizol method, reverse transcribed into cDNA, and subjected to quantitative PCR using the SYBR Green kit (Catalog No. RR820A, Takara, Japan). Gene expression was quantified using the delta–delta CT method (2−(Ct_Target gene − Ct_GAPDH)). The Trizol reagent was purchased from Wuhan Huiyu Biotechnology Co., Ltd. (Catalog No. RHYC01, Wuhan, China), the reverse transcription kit from Wuhan Saiwei Biotechnology Co., Ltd. (Catalog No. G3332-50, Wuhan, China), and the SYBR Green fluorescent dye from TOLOBIO (Catalog No. 22204-01, Wuxi, China). Human G0S2 and PD-L1 primers were synthesized by Wuhan Qingke Biotechnology Co., Ltd. (Wuhan, China). Primer sequences were as follows: G0S2-F: AGCAGTTGGTGACCATGTCG, G0S2-R: TGGAGATCTCCTGCTTGAGG; CD274-F: CCTTCCGTGTTCCTACCC, CD274-R: GCCTGCTTCACCACCTTC; GAPDH-F: ACCACAGTCCATGCCATC, GAPDH-R: TCCACCACCCTGTTGCTG.
2.7. Western Blot Analysis
Cells were harvested, and proteins were lysed using RIPA buffer. Proteins were separated by SDS-PAGE electrophoresis and transferred to PVDF membranes. Membranes were probed with primary antibodies against G0S2 (Catalog No. G0S2-101AP, Thermo Fisher Scientific, Waltham, MA, USA), PD-L1 (Catalog No. 66248-1-Ig Proteintech), and GAPDH (Catalog No. 60004-1-Ig, Proteintech). After incubation with secondary antibodies, signals were detected using the chemiluminescence method (ECL). Reagents used included RIPA lysis buffer (PC101), protease inhibitor (GRF101), phosphatase inhibitor (GRF102), 5× loading buffer (LT101), rapid preparation kit for 7.5% PAGE gel (PG211), protein marker (WJ102), non-protein blocking solution (PS108P), and ECL substrate (SQ202L), all purchased from Yease Company(Wuhan, China).
2.8. T Cell Proliferation and IFN-γ Detection
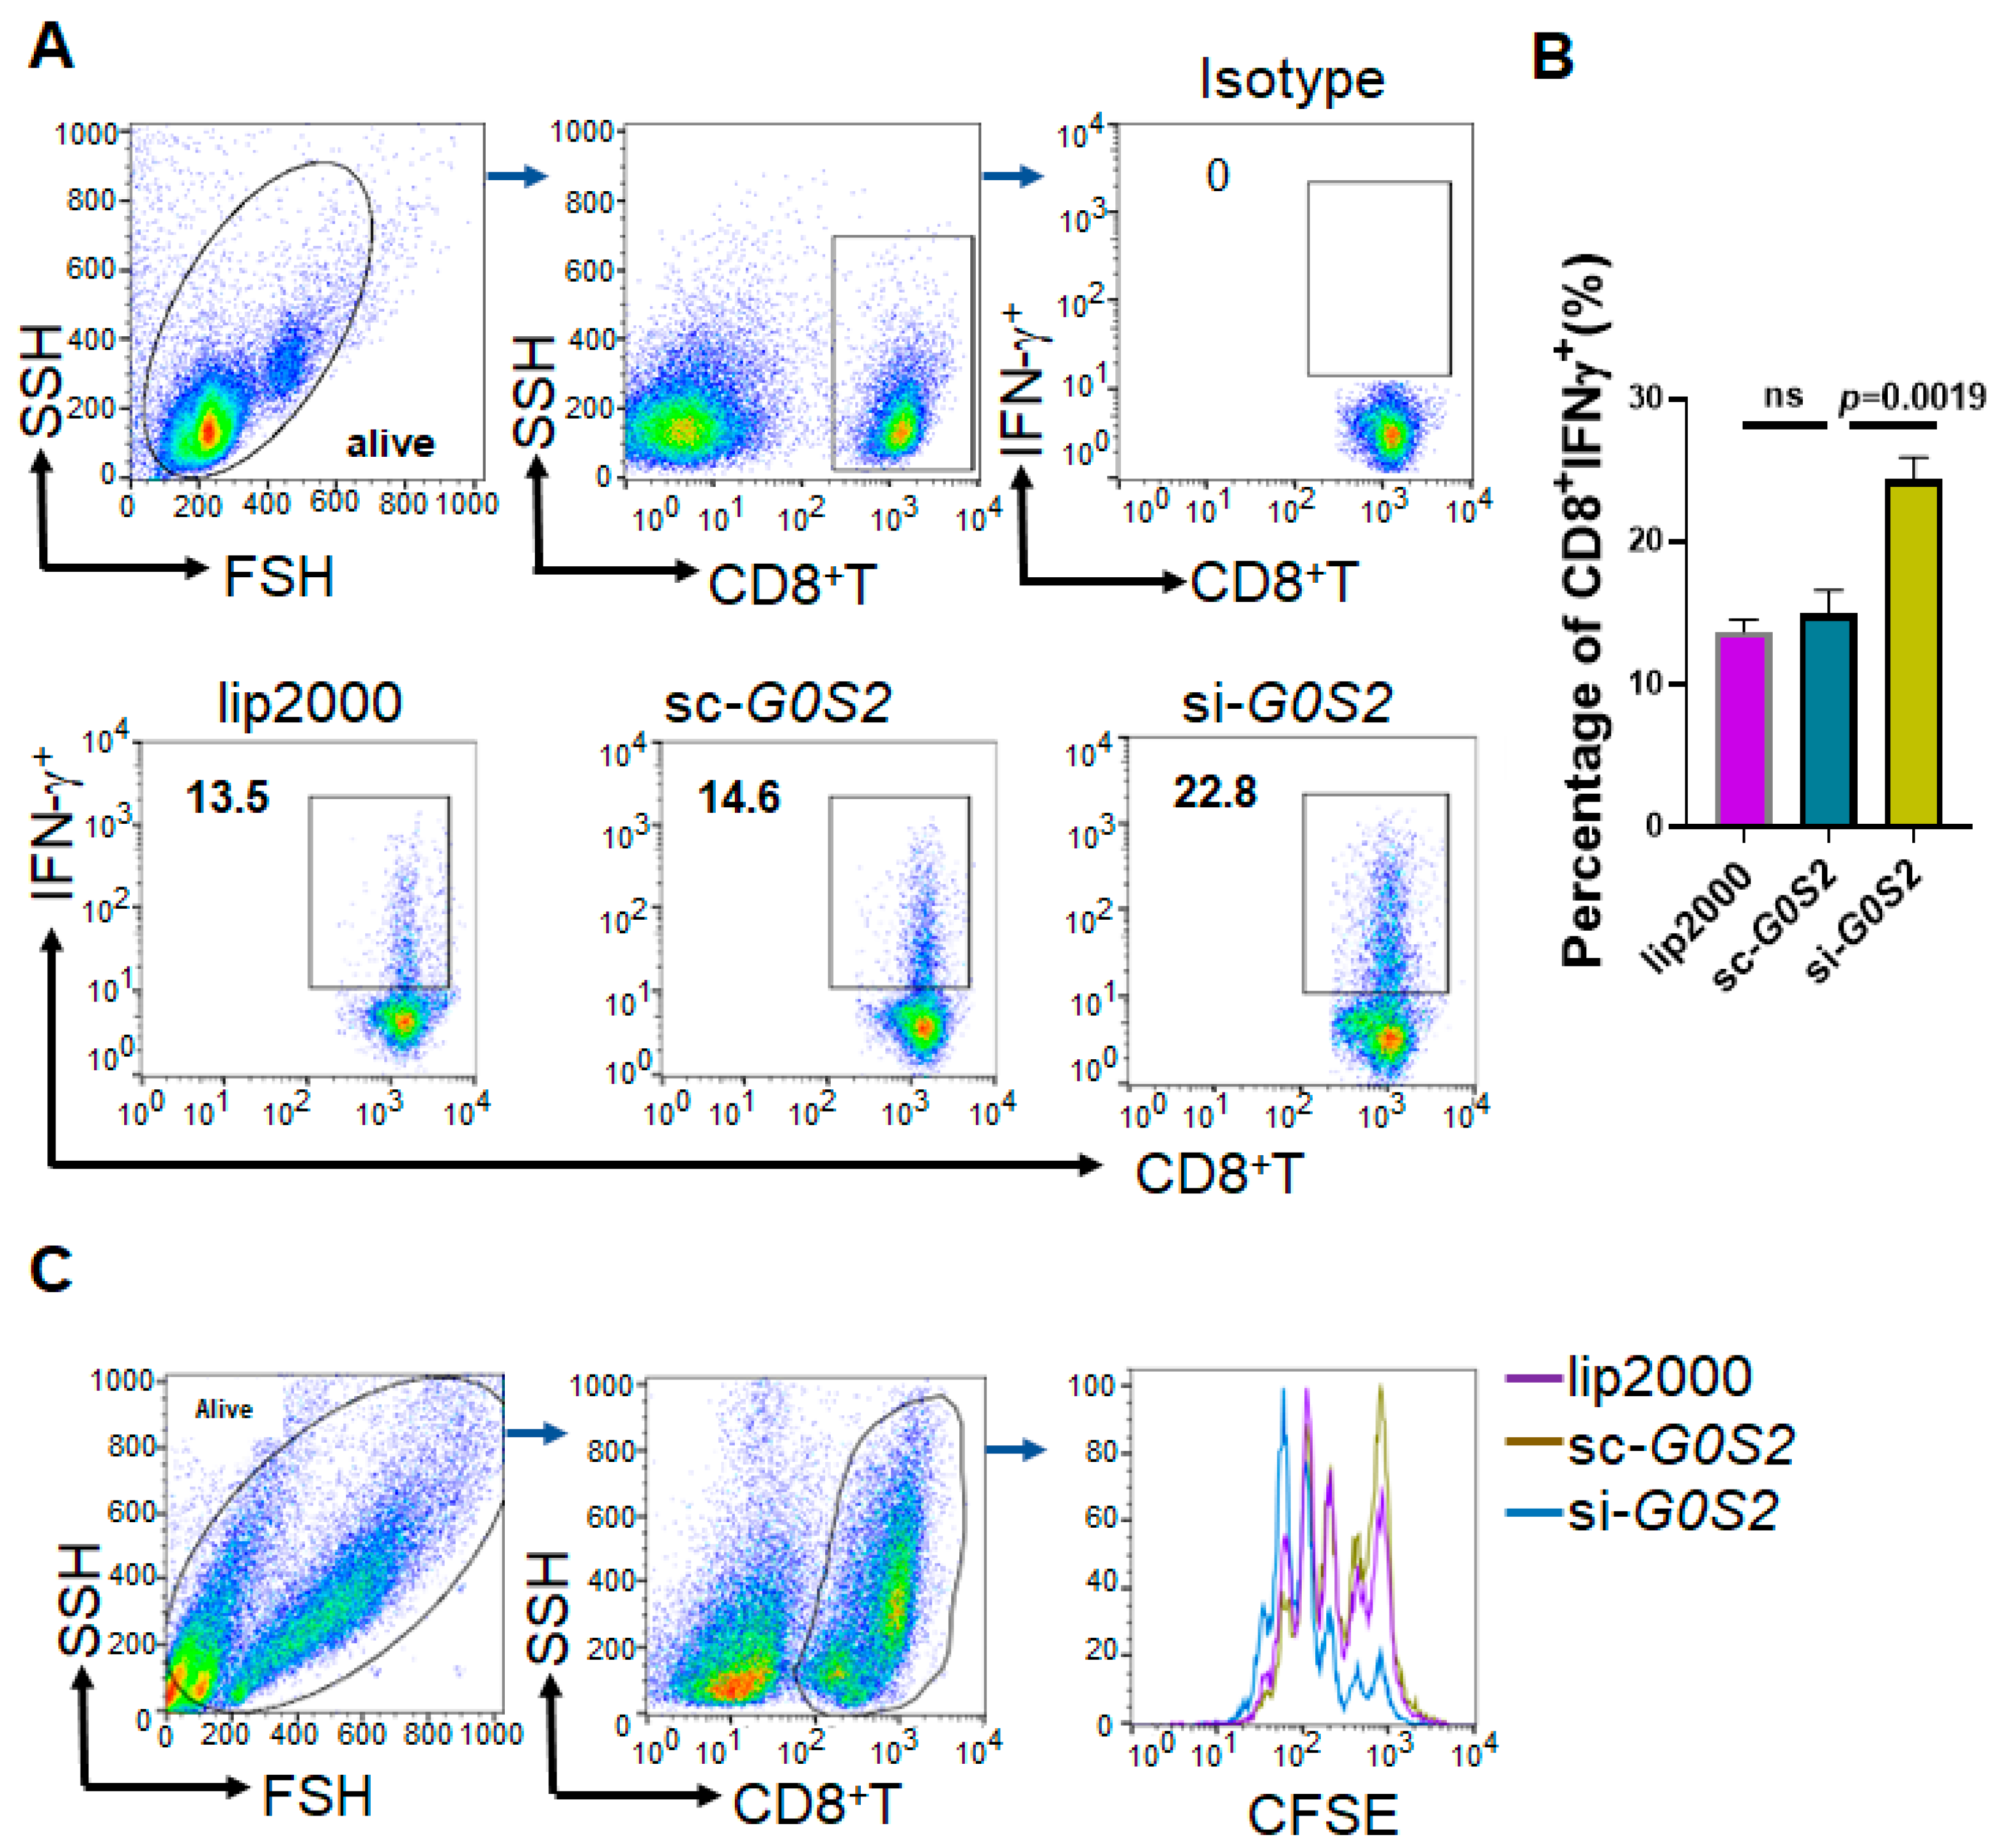
To evaluate the impact of G0S2 knockdown on CD8+T cell proliferation and IFN-γ secretion, G0S2-silenced THP-1 cells were co-cultured with CD8+T cells from healthy donors. The experimental procedure was as follows: Specific siRNA was used to knock down G0S2 expression in THP-1 cells (using Lipofectamine RNAiMAX reagent, Catalog No. 13778075, Invitrogen, Carlsbad, CA, USA). After 24 h of transfection, cells were collected and washed to remove transfection reagents. PBMCs were isolated from the peripheral blood of healthy donors using the Ficoll-Paque density gradient centrifugation method (Catalog No. 17-1440-02, GE Healthcare, Little Chalfont, Buckinghamshire, UK). CD8 + T cells were separated using negative selection with a CD8+T cell isolation kit (Catalog No. 130-045-201, Miltenyi Biotec, Bergisch Gladbach, Germany). G0S2-knockdown THP-1 cells were mixed with CD8 + T cells at a 1:1 ratio and added to a co-culture system containing complete RPMI 1640 medium (Catalog No. 11875-093, Gibco, Grand Island, NY, USA). Cells were incubated at 37 °C with 5% CO2 for 48 h. After 48 h of co-culture, cells were stimulated with medium containing PMA (50 ng/mL) and ionomycin (1 μg/mL) for 4 h (Catalog Nos. P8139 and I9657, Sigma-Aldrich, St. Louis, MO, USA), along with protein transport inhibitors such as Brefeldin A (Catalog No. 420601, BioLegend). Cells were collected and washed with flow cytometry buffer. Fcγ receptor blocking reagent (Catalog No. 422302, BioLegend) was added and incubated at 4 °C for 10 min to reduce non-specific binding. Anti-CD8-APC (Catalog No. 301014, BioLegend) was added for cell surface staining, followed by incubation at 4 °C in the dark for 30 min. Cells were fixed and permeabilized using the BD Cytofix/Cytoperm kit (Catalog No. 554714, BD Biosciences). Anti-IFN-γ-PE antibody (Catalog No. 506506, BioLegend) was added and incubated at 4 °C in the dark for 30 min. Cells were washed and resuspended in 500 μL flow cytometry buffer. Detection was performed using the BD LSRFortessa flow cytometer, and data were analyzed using FlowJo software to quantify the percentage of CD8+ IFN-γ+ T cells, assessing the impact of G0S2 knockdown on CD8+T cell function.
CD8+T cells were labeled with CFSE (5-(6)-Carboxyfluorescein diacetate succinimidyl ester, Catalog No. C34554, Invitrogen) to evaluate cell proliferation. G0S2-knockdown THP-1 cells were mixed with CFSE-labeled CD8+T cells at a 1:1 ratio and added to a co-culture system containing complete RPMI 1640 medium. Cells were incubated at 37 °C with 5% CO2 for 48 h. CFSE fluorescence intensity was detected using the BD LSRFortessa flow cytometer to assess T cell proliferation. FlowJo software was used to analyze flow cytometry data, calculating the percentage of proliferating CD8+T cells and the average number of cell divisions.
2.9. Data Statistical Analysis
All experiments were performed at least three times, and data are presented as mean ± standard deviation (mean ± SD). Differences between groups were analyzed using one-way ANOVA or two-way ANOVA with GraphPad Prism 9 software (GraphPad Software). A p-value of less than 0.05 (p < 0.05) was considered statistically significant.
4. Discussion
Our results demonstrate that G0S2 expression is significantly elevated in both tumor tissues and peripheral blood mononuclear cells of HCC patients. Importantly, G0S2 knockdown in THP-1 cells resulted in a marked reduction in PD-L1 expression, as confirmed. Furthermore, co-culture experiments with human CD8⁺ T cells revealed that G0S2-knockdown monocytes led to enhanced T cell proliferation and increased IFN-γ production, indicating that the immunosuppressive function of monocytes is at least partly mediated through G0S2-dependent PD-L1 regulation. These comprehensive data clearly support the conclusion that G0S2 is a key regulator of PD-L1 expression in monocytes, making it a promising predictive biomarker and potential therapeutic target in HCC immunotherapy.
As a growth inhibition-specific gene,
G0S2 has been shown to participate in cell growth and metabolic regulation across various cell types [
14]. However, its function in immune cells has not been extensively studied. Monocytes are a vital type of immune cell in the blood, capable of migrating into the TME and differentiating into TAMs [
15]. TAMs exert immunosuppressive effects within the tumor microenvironment, playing a critical role in tumor immune escape [
16]. PD-L1 is a key factor in tumor immune escape, inhibiting T cell activation and proliferation by binding to the PD-1 receptor on T cells, thereby allowing tumor cells to evade immune surveillance [
17,
18]. In our study, we observed that the high expression of G0S2 in the PBMCs of HCC patients was significantly correlated with the upregulation of PD-L1. This suggests that G0S2 may play a pivotal role in tumor immune escape by regulating TAMs. An immunohistochemical analysis demonstrated that G0S2 expression was significantly higher in the tumor tissues compared to the adjacent non-tumorous tissues, further confirming its important role within the tumor microenvironment. The flow cytometry results also confirmed that the G0S2 expression in the PBMCs of HCC patients was significantly higher than that in the healthy controls, positively correlating with the expression of immunosuppressive molecules such as PD-L1 and CD206. This indicates that these immune cells possess immune-escaping characteristics, thereby promoting tumor growth and metastasis. The high expression of G0S2 in monocytes may thus be a key factor in tumor immune escape and resistance to PD-1 inhibitors.
To further explore the mechanism by which G0S2 regulates PD-L1 expression in monocytes, we conducted G0S2 knockdown experiments in the THP-1 cell line. The results showed that knocking down G0S2 significantly reduced PD-L1 expression at both the mRNA and protein levels. Additionally, co-culture with human CD8⁺ T cells revealed that the G0S2-knockdown THP-1 cells significantly enhanced IFN-γ production and the proliferation of T cells. This indicates that high expression of G0S2 inhibits the antitumor activity of T cells through PD-L1 regulation. These findings suggest that G0S2 promotes tumor immune escape by suppressing T cell function through PD-L1 expression regulation. This aligns with existing research indicating that monocytes and macrophages play significant roles in immune regulation within the tumor microenvironment, impacting the effectiveness of immunotherapy [
19,
20]. Our study provides a new perspective for understanding the role of monocytes in immune escape.
Furthermore, our experimental results indicated that the expression of the M2-type marker CD206 decreased following G0S2 knockdown [
21], suggesting that G0S2 may play an important role in the differentiation and function of M2-type monocytes. M2-type monocytes and macrophages are generally considered to be immunosuppressive and tumor-promoting cells within tumors. High expression of G0S2 in these cells may help maintain their immunosuppressive functions, thereby further supporting tumor growth and dissemination.
G0S2 is highly expressed in HCC patients and is associated with PD-L1 expression and the suppression of CD8
+ T cell function. Recent studies have highlighted that the use of predictive biomarkers in the adjuvant setting can significantly improve patient outcomes by guiding treatment intensification or modification. It is reported that immune-related lncRNA signature possesses promising prognostic value in HCC and may have the potentiality to predict clinical outcome of ICB immunotherapy [
22]. RPS3A may serve as a therapeutic target in and predict the efficacy of ICB therapy for HCC [
23]. Our data suggest that quantifying G0S2 expression in PBMCs may help identify HCC patients who are less likely to respond to standard PD-1 inhibitor therapy. These patients could be considered for alternative or combination adjuvant strategies, such as incorporating G0S2-targeted agents, combining PD-1 inhibitors with other immunomodulatory approaches (e.g., CTLA-4 blockade), or even integrating interventions that modulate the gut microbiome, such as fecal microbiota transplantation (FMT). By implementing routine G0S2 monitoring, clinicians may be able to detect early signs of immunotherapy resistance and adjust adjuvant treatment plans accordingly, thereby reducing recurrence risk and improving overall survival. Future prospective studies are needed to validate G0S2 as a reliable adjuvant biomarker and to integrate it into multi-modal treatment algorithms.
Our findings suggest that G0S2 upregulation in monocytes, which leads to increased PD-L1 expression, is particularly relevant for predicting the efficacy of PD-1/PD-L1 blockade therapies, such as pembrolizumab, nivolumab, and camrelizumab. There are a lot of ongoing or completed clinical trials focused on PD-1/PD-L1 blockade therapies for HCC (Supplemental
Table S3). Although our study focused on anti-PD-1 monotherapy, recent meta-analyses [
24,
25] have demonstrated that regorafenib is more effective than other treatments (cabozantinib, nivolumab, or placebo) for patients with HCC who have not responded to initial sorafenib therapy. It is important to note that regorafenib primarily functions as a multi-kinase inhibitor and does not directly target the PD-1/PD-L1 axis. However, as in the immunotherapy strategies evolve, combination regimens involving PD-1/PD-L1 inhibitors and agents like regorafenib are being investigated. In such combinations, our data raise the possibility that G0S2 expression could also serve as a predictive biomarker, guiding treatment decisions and helping to identify patients who might benefit from the addition of PD-1/PD-L1 blockade to regorafenib therapy. Future studies will be needed to explore whether G0S2 detection can predict responses in these combination settings, thereby further refining therapeutic strategies for HCC.
Fecal microbiota transplantation (FMT) has been shown to improve the efficacy of PD-1 inhibitors by restoring a balanced gut microbial ecosystem, which in turn can enhance systemic antitumor immunity [
26,
27]. By normalizing the gut–liver axis, FMT may help re-establish effective antitumor immunity, making subsequent PD-1 blockade therapy more effective. Our future work may focus on investigating how FMT affects the expression of G0S2 and PD-L1 in the PBMCs of HCC patients. By elucidating the underlying mechanisms through which FMT alters these molecular pathways, we aim to uncover potential strategies to reduce PD-1 resistance and further improve the therapeutic outcomes of immunotherapy in HCC.
Despite uncovering the role of G0S2 in regulating PD-L1 expression and affecting T cell function in HCC patients, several questions remain to be addressed. Firstly, the specific molecular mechanisms by which G0S2 regulates PD-L1 expression need to be further explored. Future studies could employ transcription factor binding site analysis and gene knockout experiments to verify the upstream regulatory mechanisms of G0S2 in PD-L1 regulation. Secondly, it is necessary to validate whether G0S2 exhibits similar functions and its generalizability in immunosuppression across different cancer types. Additionally, investigating whether G0S2 is associated with the expression and function of other immune checkpoint molecules is an important direction for future research. Existing studies have shown that G0S2 can regulate lipid metabolism and apoptosis, which may influence tumor cells and immune cells through different mechanisms [
7,
8,
9,
11,
12,
13,]. We hypothesize that G0S2 may promote PD-L1 expression by regulating the metabolic state of cells, thereby inhibiting T cell activity. The high expression of G0S2 in monocytes may induce PD-L1 upregulation through multiple signaling pathways, including NF-κB and STAT3 pathways [
28,
29], playing a crucial role in the formation of an immunosuppressive microenvironment. Additionally, using
G0S2-deficient mice for in vivo animal studies could further validate the impact of G0S2-mediated PD-L1 regulation on the efficacy of ICB therapy.
This study demonstrates elevated G0S2 expression in HCC patients and its role in inhibiting CD8+T cell function by promoting PD-L1 expression, potentially leading to resistance to PD-1 inhibitors. Our results suggest that G0S2 could serve as an important biomarker for predicting the efficacy of PD-1 inhibitors in HCC patients and provide a theoretical basis for developing combination therapy strategies targeting G0S2. Through further mechanistic studies and clinical validation, G0S2 has the potential to become a key regulatory factor in improving the effectiveness of immunotherapy in HCC patients. Our research lays the groundwork for exploring G0S2 as a new immunotherapy target, opening new avenues for immunotherapeutic strategies in HCC and other cancers.


 and
and 