Article

Terrestrial Adaptation in Chelonoidis vicina as Revealed Based on Analysis of the Complete Mitochondrial Genome

1
College of Life Sciences, Qufu Normal University, Qufu 273165, China
2
Zhonghuan Shengda Environmental Technology Group (Qingyun) Co., Ltd., Dezhou 253000, China
*
Author to whom correspondence should be addressed.
These authors contributed equally to this work.
Genes 2025, 16(2), 173; https://doi.org/10.3390/genes16020173
Submission received: 12 December 2024 / Revised: 26 January 2025 / Accepted: 27 January 2025 / Published: 30 January 2025
(This article belongs to the Section Animal Genetics and Genomics)

Simple Summary

The mitochondrial genome has been widely used in biological phylogeny and evolutionary ecology due to its specific energy metabolism center and matrilineal inheritance. In this study, the mitochondrial genome of Chelonoidis vicina was assembled and annotated, and comparative mitochondrial genome, phylogenetic, and selection pressure analyses were used to examine the structure, phylogenetic status, and terrestrial adaptive evolution characteristics of C. vicina. These analyses can aid our understanding of the history of this ancient tortoise’s adaptive evolution to a terrestrial environment from a molecular evolution standpoint.

Abstract

Background/Objectives: Mitochondrial genomes are widely used in phylogenetics and evolutionary and ecological research. Methods: In this study, the newest mitochondrial genome of Chelonoidis vicina was assembled and annotated. The comparative mitochondrial genome and selection pressure analyses were used to examine the terrestrial adaptive evolution characteristics of C. vicina and other terrestrial reptiles. Results: The results reveal that the mitochondrial genome of the tortoise C. vicina is consistent with that of other tortoise species, comprising 13 protein-coding genes (PCGs), 2 rRNAs, 22 tRNAs, and 1 noncoding control region (CR). The analysis of selection pressure reveals the presence of positive selection sites in the COX2, COX3, Cytb, ND3, ND4, ND4L, ND5, and ND6 genes of terrestrial reptiles. Of these, the COX2 and ND3 genes exhibited faster evolutionary rates. The mitochondrial genome structure of C. vicina is consistent with that of different terrestrial reptiles. The positive selection sites of COX2 and ND3 in terrestrial reptiles are closely related to a change in mitochondrial energy metabolism, which is possibly related to terrestrial adaptability. Conclusions: The results of this study provide new insights into the adaptive evolution of C. vicina to terrestrial niches from a mitogenomic perspective, as well as genetic resources for the protection of C. vicina.

1. Introduction

Mitochondria are organelles involved in the function of energy metabolism in eukaryotic cells and that harbor a genome independent of the nuclear genome [1,2]. In vertebrates, the mitochondrial genome is a double-stranded closed-loop molecular structure of about 14 to 16 Kb [3]. The mitochondrial genome generally consists of two chains, a guanine-rich heavy (H) chain and a cytosine-rich light (L) chain, comprising four components, namely a control region (D-loop), 2 ribosomal RNA genes (rRNAs), 13 protein-coding genes (PCGs), and 22 transfer RNA genes (tRNAs) [3,4,5,6,7,8,9]. Compared with nuclear genomes, mitochondrial genomes have unique properties, such as regarding their size, the complete absence or lower frequency of recombination, matrilineal inheritance, and a highly conservative gene content and evolutionary rate [10,11,12]; therefore, the mitochondrial genome is an extremely useful resource for investigating vertebrate phylogeny, genetic diversity, and adaptive evolution [13,14,15]. A large number of studies have shown that in vertebrates, the evolution of their mitochondrial genome is related to their niche adaptation. For example, as members of the Mustelidae have adapted to different niches, their mitochondrial genomes have undergone different evolutionary processes, and similar evolutionary patterns are found in Cetartiodactyla mitochondrial genomes [16,17]. As another example, Vesicomyidae species have adapted to a deep-sea environment, and their mitochondrial genome shows evidence of positive selection signals [18]. In addition, the patterns of less stringent selection in the mitochondrial genomes of domestic animals (such as dogs, cattle, and yaks) are evidence of their adaptation to domesticated niches [19,20,21]. The mitochondrial genome of Tibetan loaches contains more nonsynonymous mutations for adapting to the Tibetan plateau [22]. Furthermore, in order to adapt to their habitat environment, the adaptive evolutionary attributes of several aquatic reptiles such as Killifish (Fundulus genus), the intertidal spider (Desis jiaxiangi), Rhinogobius shennongensis, Rhinogobius wuyanlingensis, and Chaenogobius annularis are characterized by a low mutation rate and positive selection in their PCGs [23,24,25]. In summary, research into the biogeography, population genetics, and adaptive evolution of a species is strengthened by the results of investigations into the mitochondrial genome.
C. vicina (also referred to as the Cerro Azul giant tortoise, the Iguana Cove tortoise, or the Isabela Island giant tortoise), belonging to Reptilia, Testudines, Testudinidae, and Chelonoidis, is a species of Galápagos tortoise endemic to the Galápagos Isabela Island [26]. The habitat of C. vicina has been destroyed by extensive overexploitation and the introduction of exotic species, resulting in their population decline [27,28,29,30,31]. In existing research on C. vicina, conservation biology researchers have mostly focused on large-scale ecological studies, including examining their biological characteristics, distribution scope, the causes of their endangered status, and conservation measures.
From a previous study [32], the entire mitochondrial genome of C. vicina has been assembled, which has already been used to resolve the phylogenetic history of giant tortoises across the Galapagos; however, the ND2 coding sequences of C. vicina have several unrecognized base sequences (from 4199 bp to 4216 bp), which means the mitochondrial genome data cannot be used for the analysis of selection pressure. Therefore, in this study, the entire new mitochondrial genome of C. vicina was assembled and annotated using high-quality original genome sequencing data for evolutionary analysis. The aims of this study were to (1) investigate the structural properties of the C. vicina mitochondrial genome and (2) use bioinformatics and evolutionary analysis to investigate the evolutionary traits of the mitochondrial genome related to terrestrial habitat adaptation by comparison with other available mitochondrial genomes. And our results not only allow elucidating the most recent molecular processes in the adaptive evolution of terrestrial reptiles to a terrestrial environment but also provide genetic resources for the protection of C. vicina.

2. Materials and Methods

2.1. Complete Mitogenome Data and Species Sample

Using the GenBank database (http://www.ncbi.nlm.nih.gov/, accessed on 12 October 2024), the complete mitogenomes of 48 vertebrate species each with two different habitats (32 terrestrial reptiles and 16 aquatic reptiles) were downloaded to be used for comparisons in this study (Table S1).
Furthermore, high-quality raw genome sequencing data of C. vicina (SRX12027758) were downloaded from the SRA database (https://www.ncbi.nlm.nih.gov/sra/, accessed on 10 February 2022). The raw data were used to assemble the complete mitogenome using NOVOPlasty (V 4.1). The sequencing data were assembled using seed sequence data (accession number: NC_080265.1). The revised mitochondrial genome sequences were annotated using MITOS2 of Galaxy tools, a free online platform for data analysis (https://usegalaxy.eu/, accessed on 18 October 2024) [33]. After annotation, the results were compared with the mitogenome of C. carbonarius (accession number: NC_080265.1) using BLAST searches.

2.2. Mitogenome Analyses

The structural map of the C. vicina mitogenome was investigated using OGDRAW (V 1.3.1, https://chlorobox.mpimp-golm.mpg.de/OGDraw.html, accessed on 23 October 2024) [34]. Then, relative synonymous codon usage (RSCU) of the C. vicina mitogenome was calculated using MEGA X [35] and presented using R software (V 4.1.3; package, ggplot2). The tRNA gene structures of the C. vicina mitogenome were predicted using tRNAScan-SE (V 2.0) [36]. The effective number of codons (Enc) and the GC content of the third codon positions (GC3s) were determined using Codon W (V 1.4.4) [37]. The composition skew values were calculated according to the following formulas: AT skew [(A T)/(A + T)] and GC skew [(G C)/(G + C)] [38]. The rose plot for amino acid usage in the C. vicina mitogenome is represented as heatmaps, created using ggplot2 of R software (V 4.1.3).

2.3. Comparative Mitochondrial Genome Analyses

The AT and GC skew values were used to measure nucleotide compositional bias [38]. Additionally, a synteny analysis was conducted among 14 mitochondrial genomes, selected from the abovementioned 48 species and C. vicina, using Mauve software (V 2.4.0) [39]. Comparative codon and amino acid usage among the 48 selected mitogenomes and C. vicina are represented as heatmaps, which were generated using ggplot2 of R software (V 4.1.3).

2.4. Phylogenetic Construction

In order to determine the phylogenetic status of C. vicina, we selected the sequences of 48 mitogenomes (Table S1) for concatenation in representing the 13 different characteristic protein-coding genes (PCGs). The Gallus gallus was selected as the outgroup. The 13 mtDNA PCGs were aligned by using MUSCLE (V 3.8.31) [40]. For BI analysis, the GTR + I + G model was constructed from the BIC scores in ModelFinder to perform Bayesian inference (BI) analysis by following previous research [41]. BI analysis was determined using Mr. Bayes software (V 3.2.6) [42] under following four independent chains running for 100,000 generations, sub-sampling every 1000 generations, and using a burn-in of 100 generations. MEGA X [35] was used to edit the resulting phylogenetic trees. Finally, the BI phylogenetic tree was edited and visualized using online tools at the Interactive Tree of Life (ITOL) website (https://itol.embl.de/, accessed on 25 October 2024) [43].

2.5. Selection Pressure Analyses

The ω values were 1, <1, or >1, indicating neutral mutation, negative (purifying) selection, or positive (diversifying) selection, respectively. In our study, the branch model (one-ratio (M0) model, two-ratio (M2) model, and NSsites = 0) was selected to detect each mtDNA PCG in the 49 species. The terrestrial reptiles (TRs) were set as foreground branches, and the aquatic reptiles (ARs) were set as the background branches. Furthermore, the branch-site model (one-ratio (M0) model, two-ratio (M2) model, and NSsites = 2) from PAML (V 4.3) [44] was used to detect each mtDNA PCG of the 49 species (foreground branches: TRs; background branches: ARs). The p-values were corrected using the false discovery rate (FDR) [23]. The p-value of LRTs was used to identify the genes of mtDNA PCGs that had undergone rapid evolution. All analyses of the selection pressure were based on the BI tree.

3. Result

3.1. Mitogenome Organization and Structure

In this study, the complete mitogenome of the Cerro Azul giant tortoise (C. vicina) was assembled and uploaded to GenBank with the accession number PP475397. The mitogenome of C. vicina is 16,440 bp and includes 13 protein-coding genes (PCGs), 2 ribosomal RNA genes (12S rRNA and 16S rRNA), 1 control region (D-loop), and 22 transfer RNA genes (tRNA). There are eight tRNAs (tRNAGln, tRNAAla, tRNAAsn, tRNACys, tRNATyr, tRNASer, tRNAGlu, and tRNAPro) and one PCG (ND6) located on the light (L or −) strand, while the others are located on the heavy (H or +) strand (Figure 1).
The total sequence length of the PCGs is 11,370 bp, of which the longest gene is ND5 (1797 bp), while the shortest genes are tRNACys (66 bp) and tRNASer (66 bp), which are, respectively, located in the heavy and light strands (Table 1). Gene spacing or gene overlap is observed between adjacent genes in the C. vicina mitogenome. There are 16 gene spacers with a total of 75 bp, of which the longest interval is 26 bp between tRNACys and tRNATyr. And there are nine gene overlaps, with a total length of 29 bp. The longest overlap, between ATP8 and ATP6, is 10 bp long (Table 1). ATG is the most frequently used start codon for the eight protein-coding genes, with COX1 being the exception in using the GTG codon for initiation (Table 1).
We analyzed the mitogenome compositions of C. vicina, which showed a distinct AT bias (Table 2). The nucleotide composition of the total C. vicina mitogenome is adenine (A)-5726 (34.83%), thymine (T)-4044 (24.60%), guanine (G)-2067 (12.57%), and cytosine (C)-4603 (28.00%). The proportion of AT (59.43%) was higher than that of GC (40.57%). In addition, the total AT and GC skew is 0.85 and −1.53, respectively (Table 2), indicating a higher content of A than T nucleotides and a higher content of C than G nucleotides, respectively.

3.2. Protein-Coding Genes

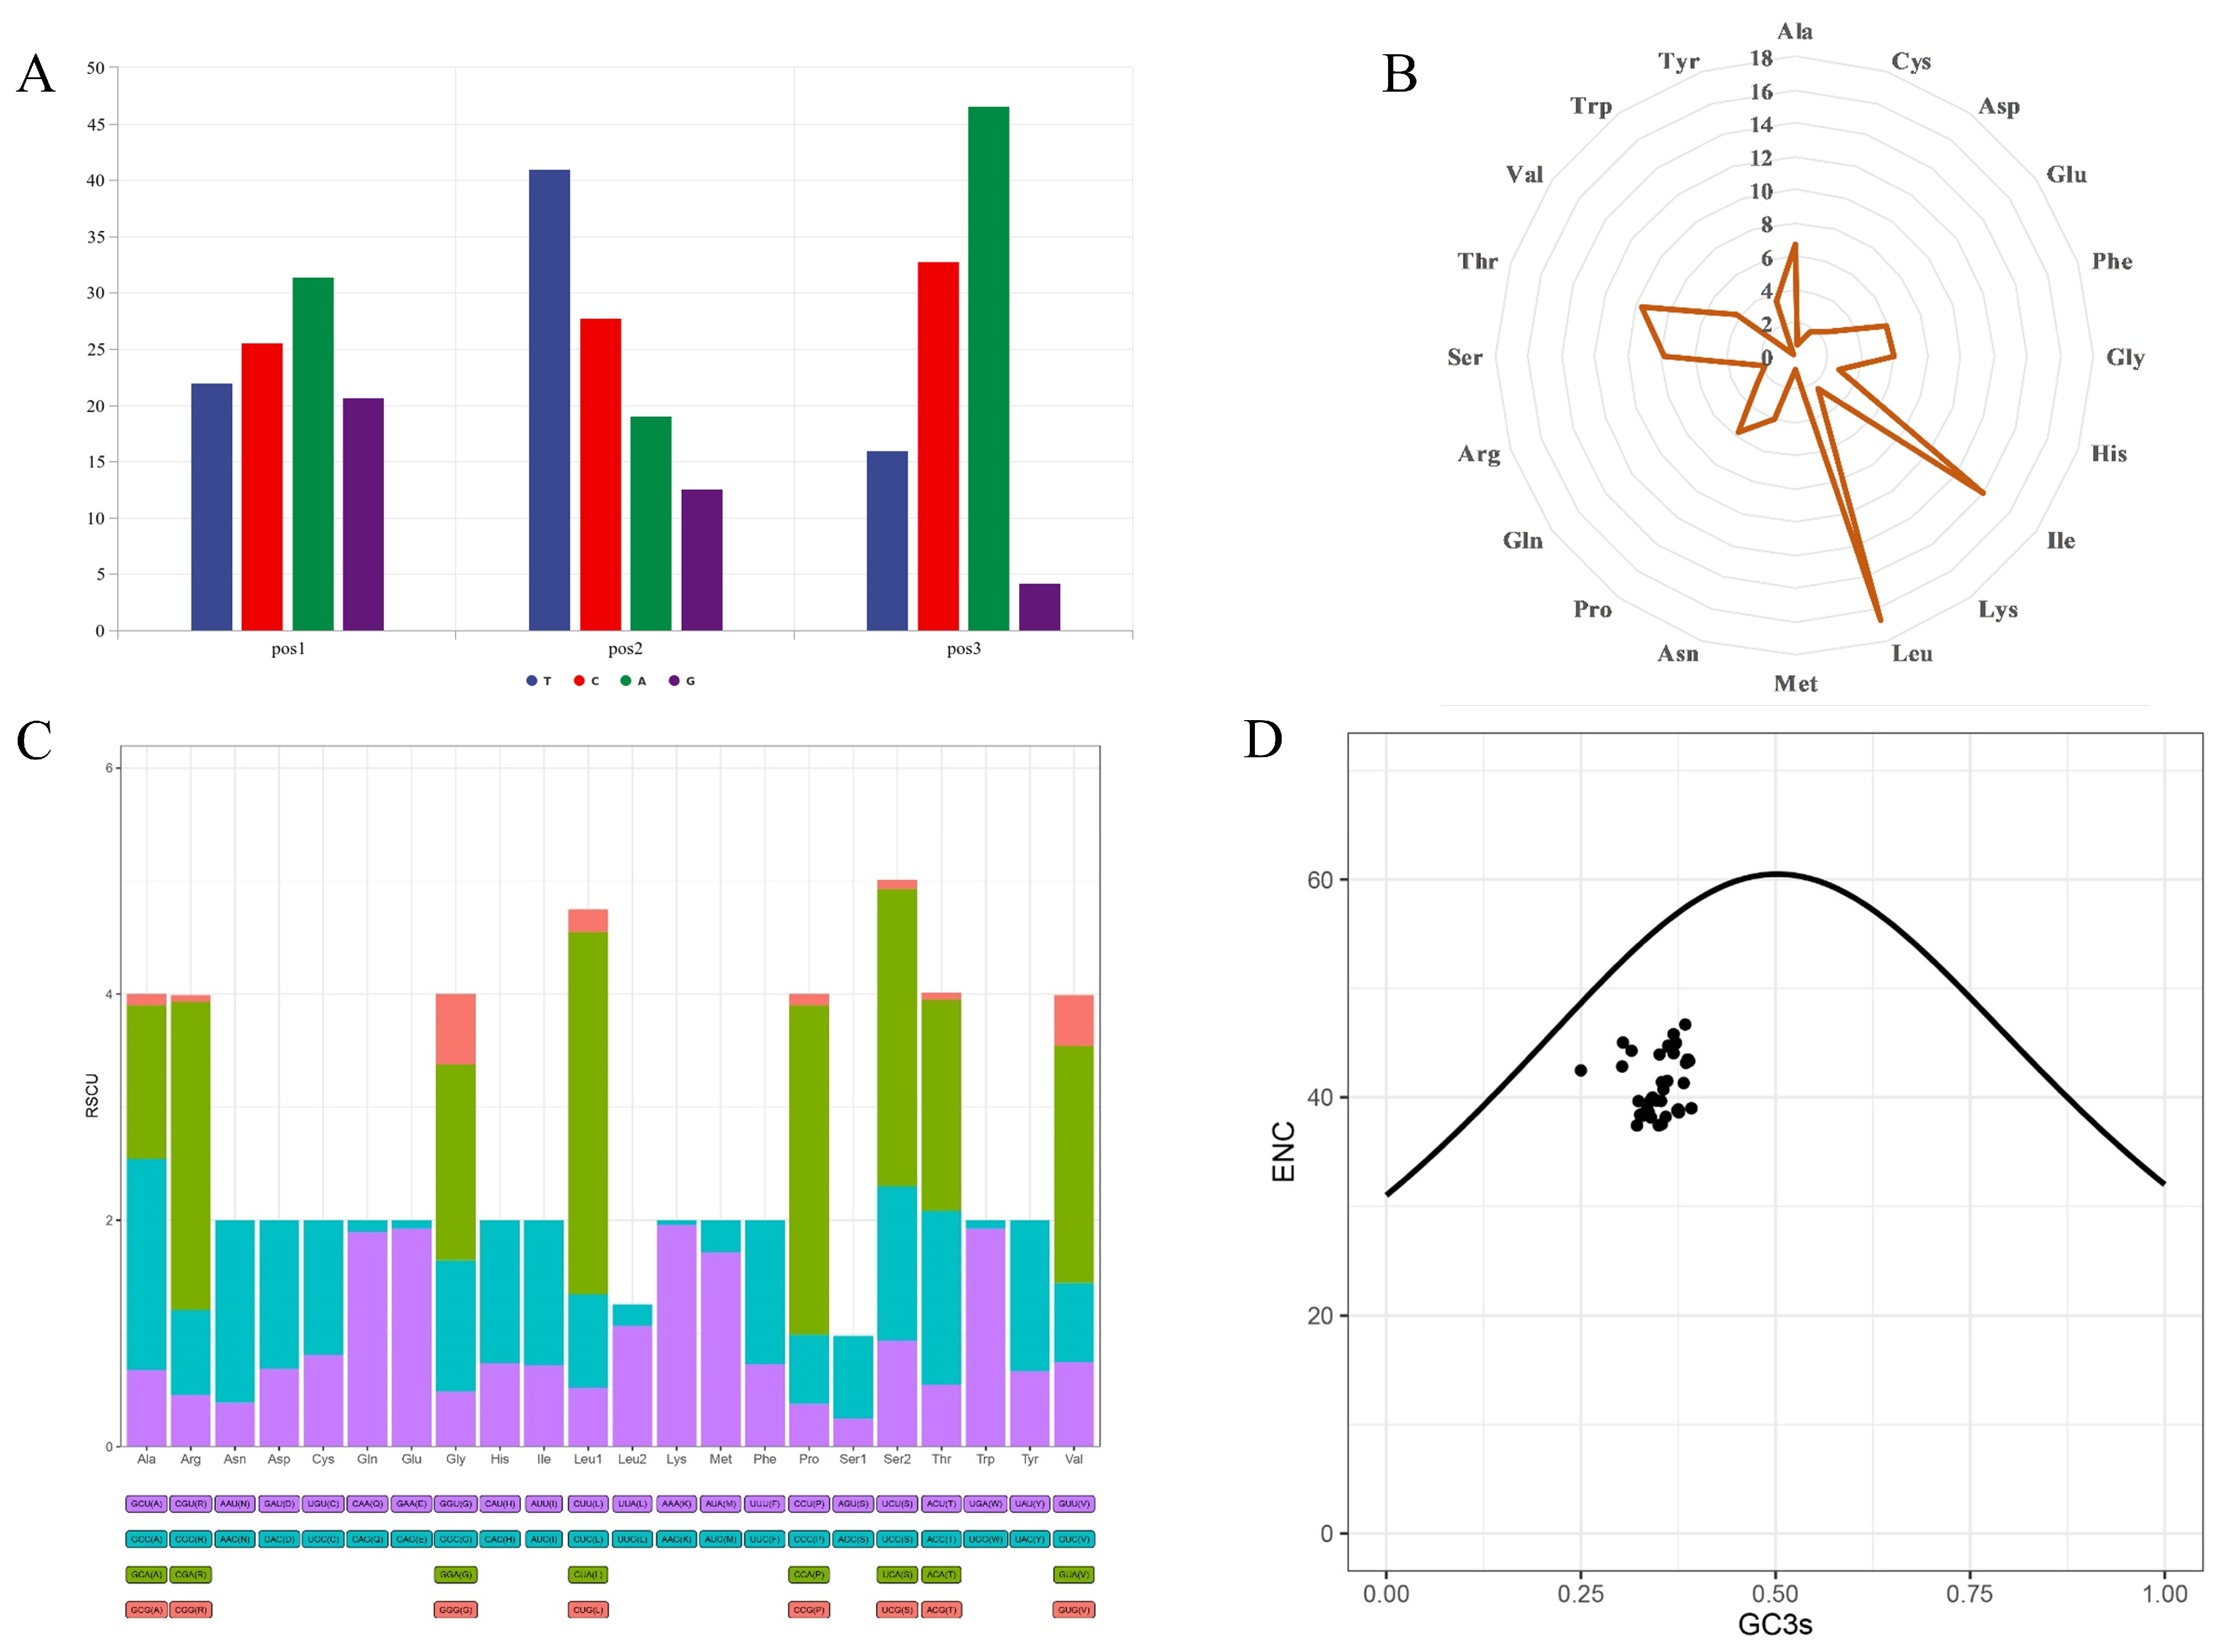
The entire length of the PCGs is 11,340 bp, which accounts for 68.98% of the C. vicina mitogenome (Table 2). The occurrence of A and C in the third codon position was found to be 46.61% and 32.80%, respectively, based on analysis of the position-specific nucleotide usage (Figure 2A), which was validated by analysis of the relative synonymous codon usage (RSCU) (Figure 2C). Additionally, according to the RSCU, the codons CUA (327, 8.65%), AUC (207, 5.48%), and AUA (194, 5.13%) were the most prevalent, whereas CGG (1, 0.03%), AAG (2, 0.05%), and GAG (3, 0.08%) were the least prevalent (Figure 2C). The total length of the translated PCGs is 3780 amino acids. In the C. vicina mitogenome, translation of 12 of the PCGs was found to be initiated by an ATG start codon, namely, ND1, ND2, COX2, ATP8, ATP6, COX3, nad3, ND4L, ND4, ND5, ND6, and Cytb, while COX1 is the exception and uses a GTG codon for initiation (Table 2). TAA is the most frequent stop codon, found in the sequences of COX2, ATP8, ATP6, ND4L, and ND5. The PCGs of ND1 and ND2 have TAG as their stop codon, while AGG was only associated with COX1. The stop codons of the PCGs Cytb, COX3, nad3, and ND4 are incomplete, with TA, TA, T, and T, respectively. In addition, from the analysis of amino acid usage in the C. vicina genome, we could determine that leucine (L, 485, 12.83%), threonine (T, 356, 9.42%), and isoleucine (I, 323, 8.54%) are the most preferred, while cysteine (C, 27, 0.714%), aspartate (D, 64, 0.17%), and arginine (R, 69, 0.18%) are the least preferred (Figure 2B). Furthermore, analysis of the effective number of codons (ENc) revealed that all the 49 mitogenomes investigated in this study were below the selection pressure curve, which indicates that there is natural selection acting on all these mitogenomes (Figure 2D).

3.3. RNA Genes in C. vicina Mitogenomes

There are two ribosomal RNAs (rRNAs) in the C. vicina mitogenomes, in which the content of A+T accounted for 58.44% (Table 1). In addition, the 12S rRNA and 16S rRNA genes were identified with lengths of 969 bp and 1593 bp, respectively (Table 2), and an AT and GC skew of 0.17 and −0.22, respectively (Table 2). In addition, there are 22 transfer RNAs (tRNAs) in the mitogenome of C. vicina, in which the content of A+T accounted for 61.49% (Table 3). The lengths of the tRNAs are 66–76 bp with a 0.31 AT skew and −0.19 GC skew, which indicates that there is a higher content of A (38.37%) than of T (20.07%) and higher content of C (24.82%) than of G (16.74%) (Table 3). In total, 21 tRNAs have a canonical clover leaf structure. All of them lack a variable loop while tRNASer1(GCT) lacks a dihydrouridine hairpin structure (Figure 3).

3.4. Comparing Mitogenomes Among Species

The nucleotide composition of mitogenomes was generally consistent between the 49 species. In addition, the A% (32.4%) was higher than the T% (26.4%), while the G% (12.5%) was lower than the C% (28.7%). There was a positive AT skew and negative GC skew. In addition, the AT skew differs with a positive value greatly by 49 species whereas the GC skew of each species does not differ much with a negative value. And it should be noted that the AT skew values of the same group do not differ much, e.g., Naja, Chelonoidis, and Testudo.
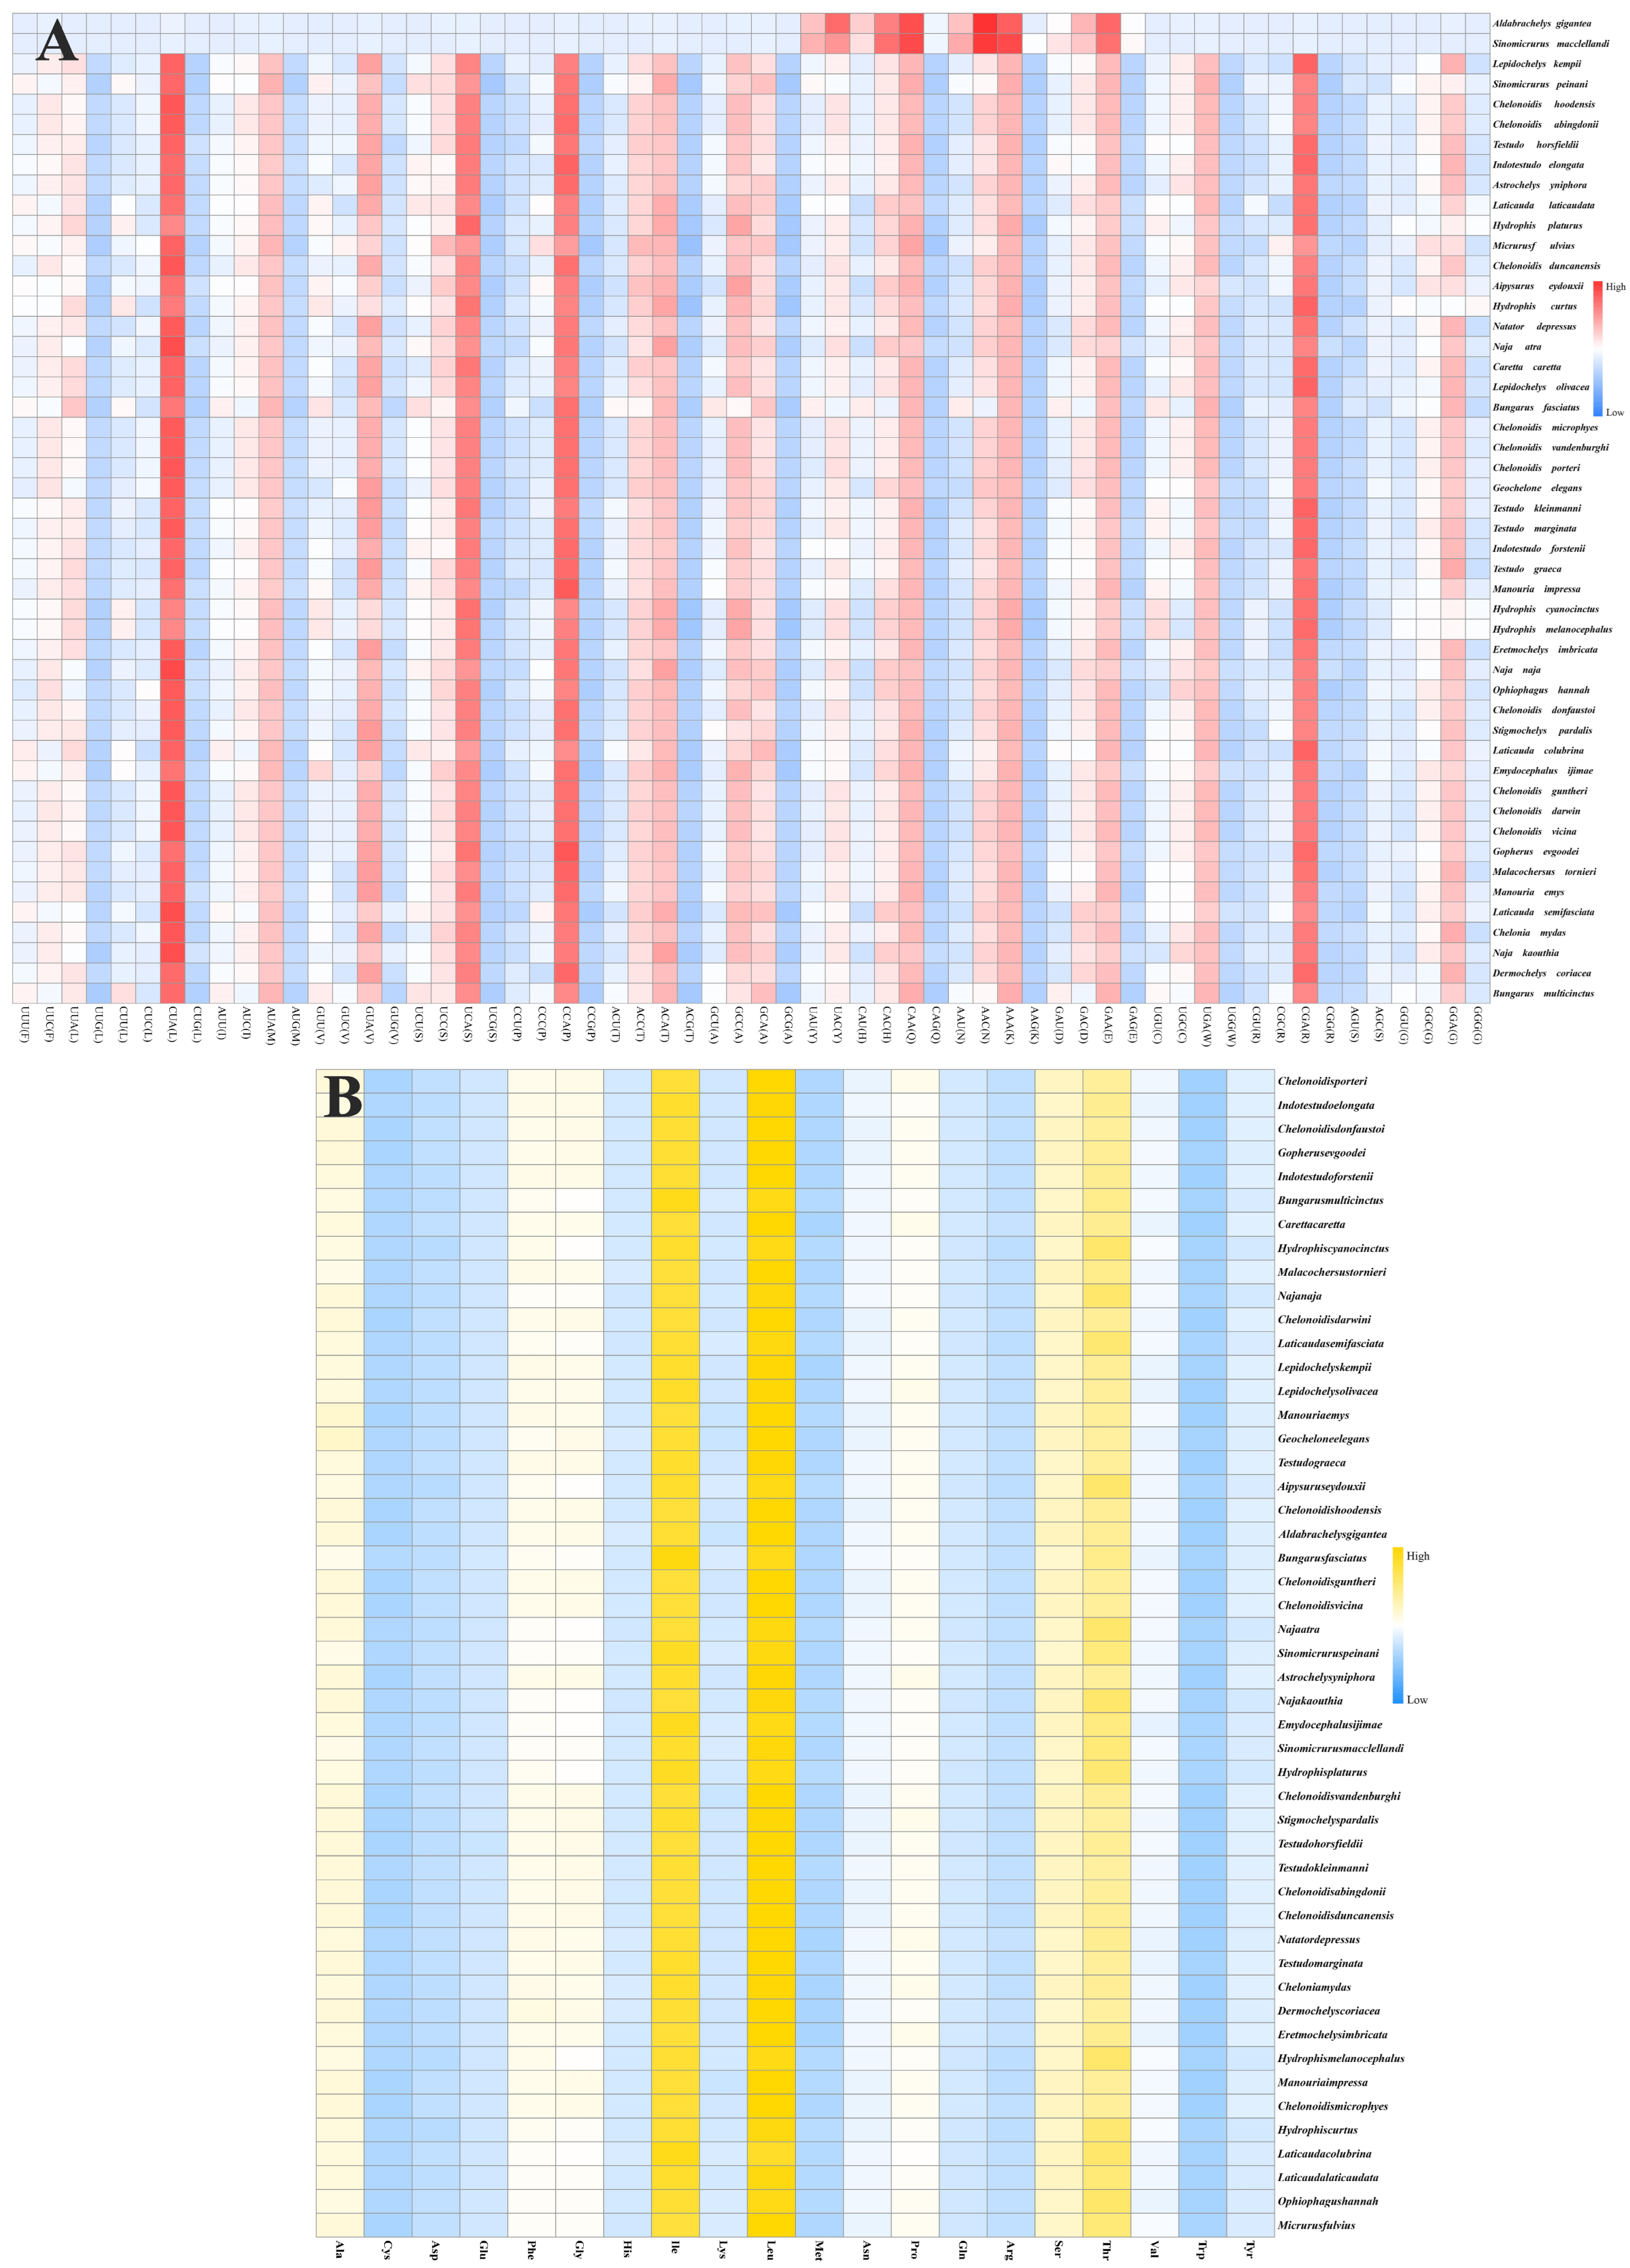
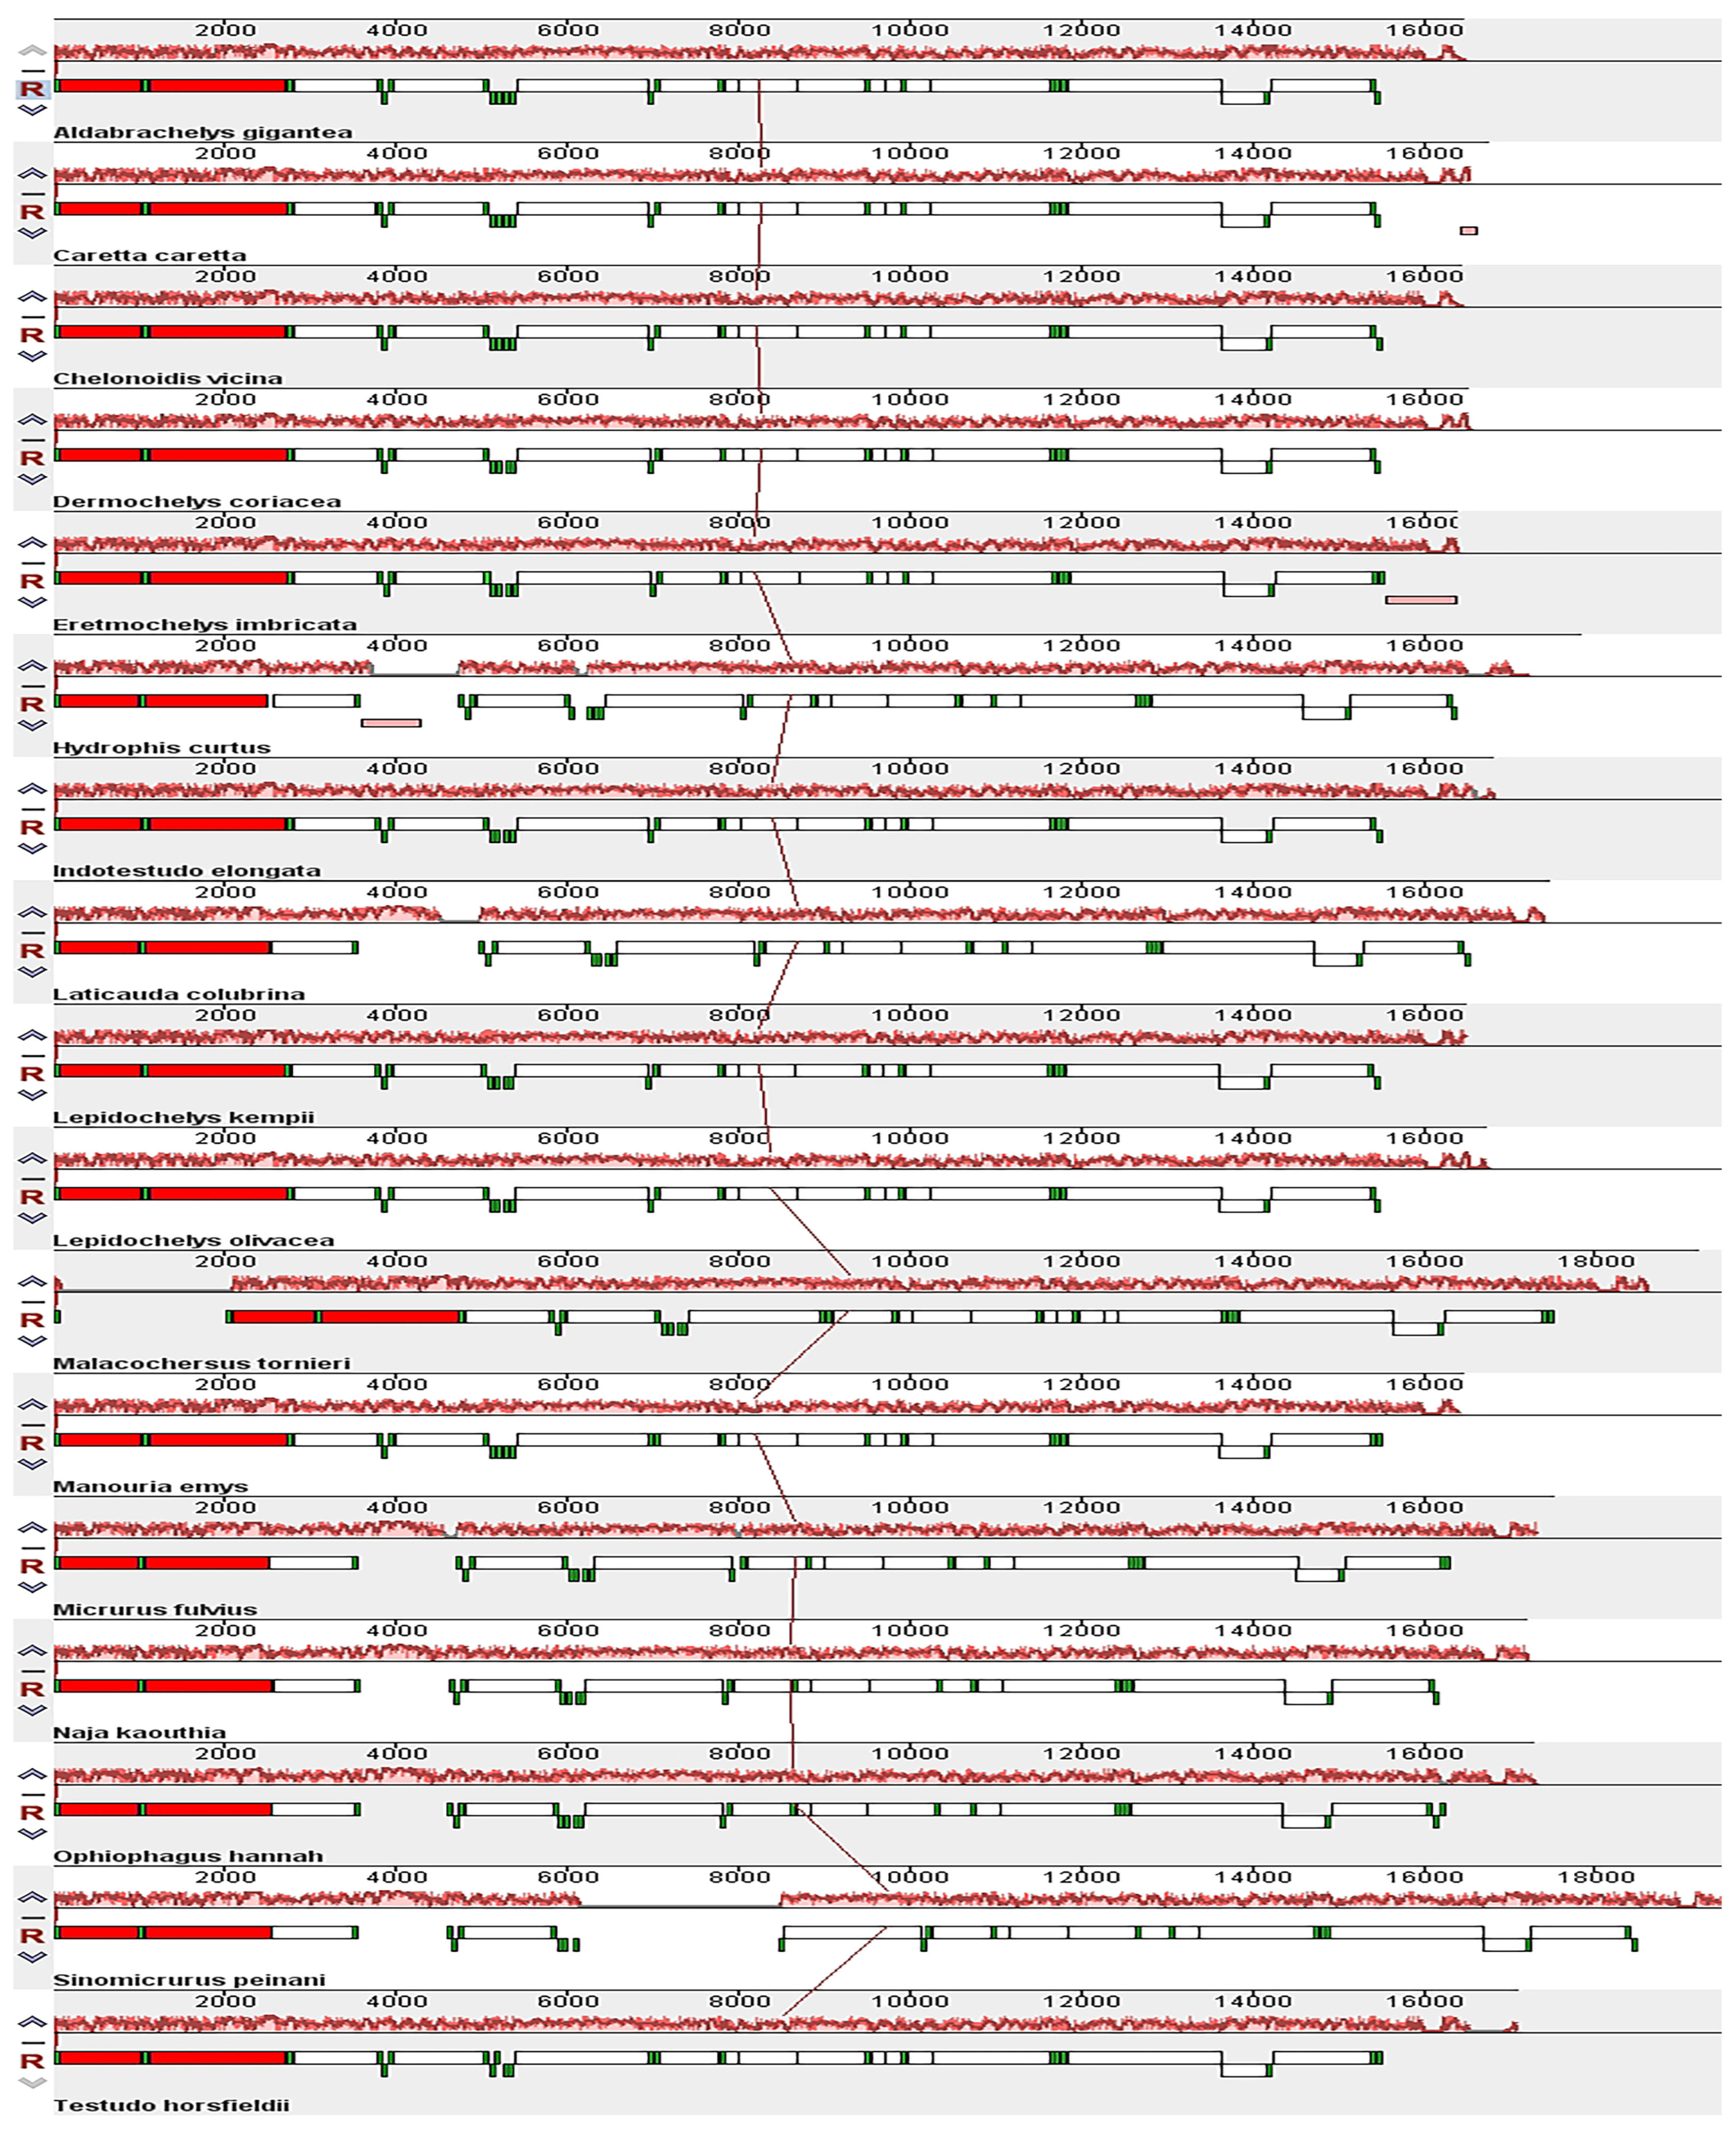
The heatmap of the codon usage in the mitogenomes of the 49 species shows that the codons CAA (Q), AAA (K), GAA (E), CUA (L), CCA (P), CGA (R), and UCA (S) were the most used (Figure 4A). In addition, the amino acids isoleucine (Ile, I), leucine (Leu, L), threonine (Thr, T), serine (Ser, S), alanine (Ala, A), and proline (Pro, P) were the most prevalent (Figure 4B). Comparative alignment of the 17 mitochondrial genomes showed that the gene order was the same in C. vicina and 16 other species investigated in this study (Figure 5).

3.5. Phylogenetic Analyses

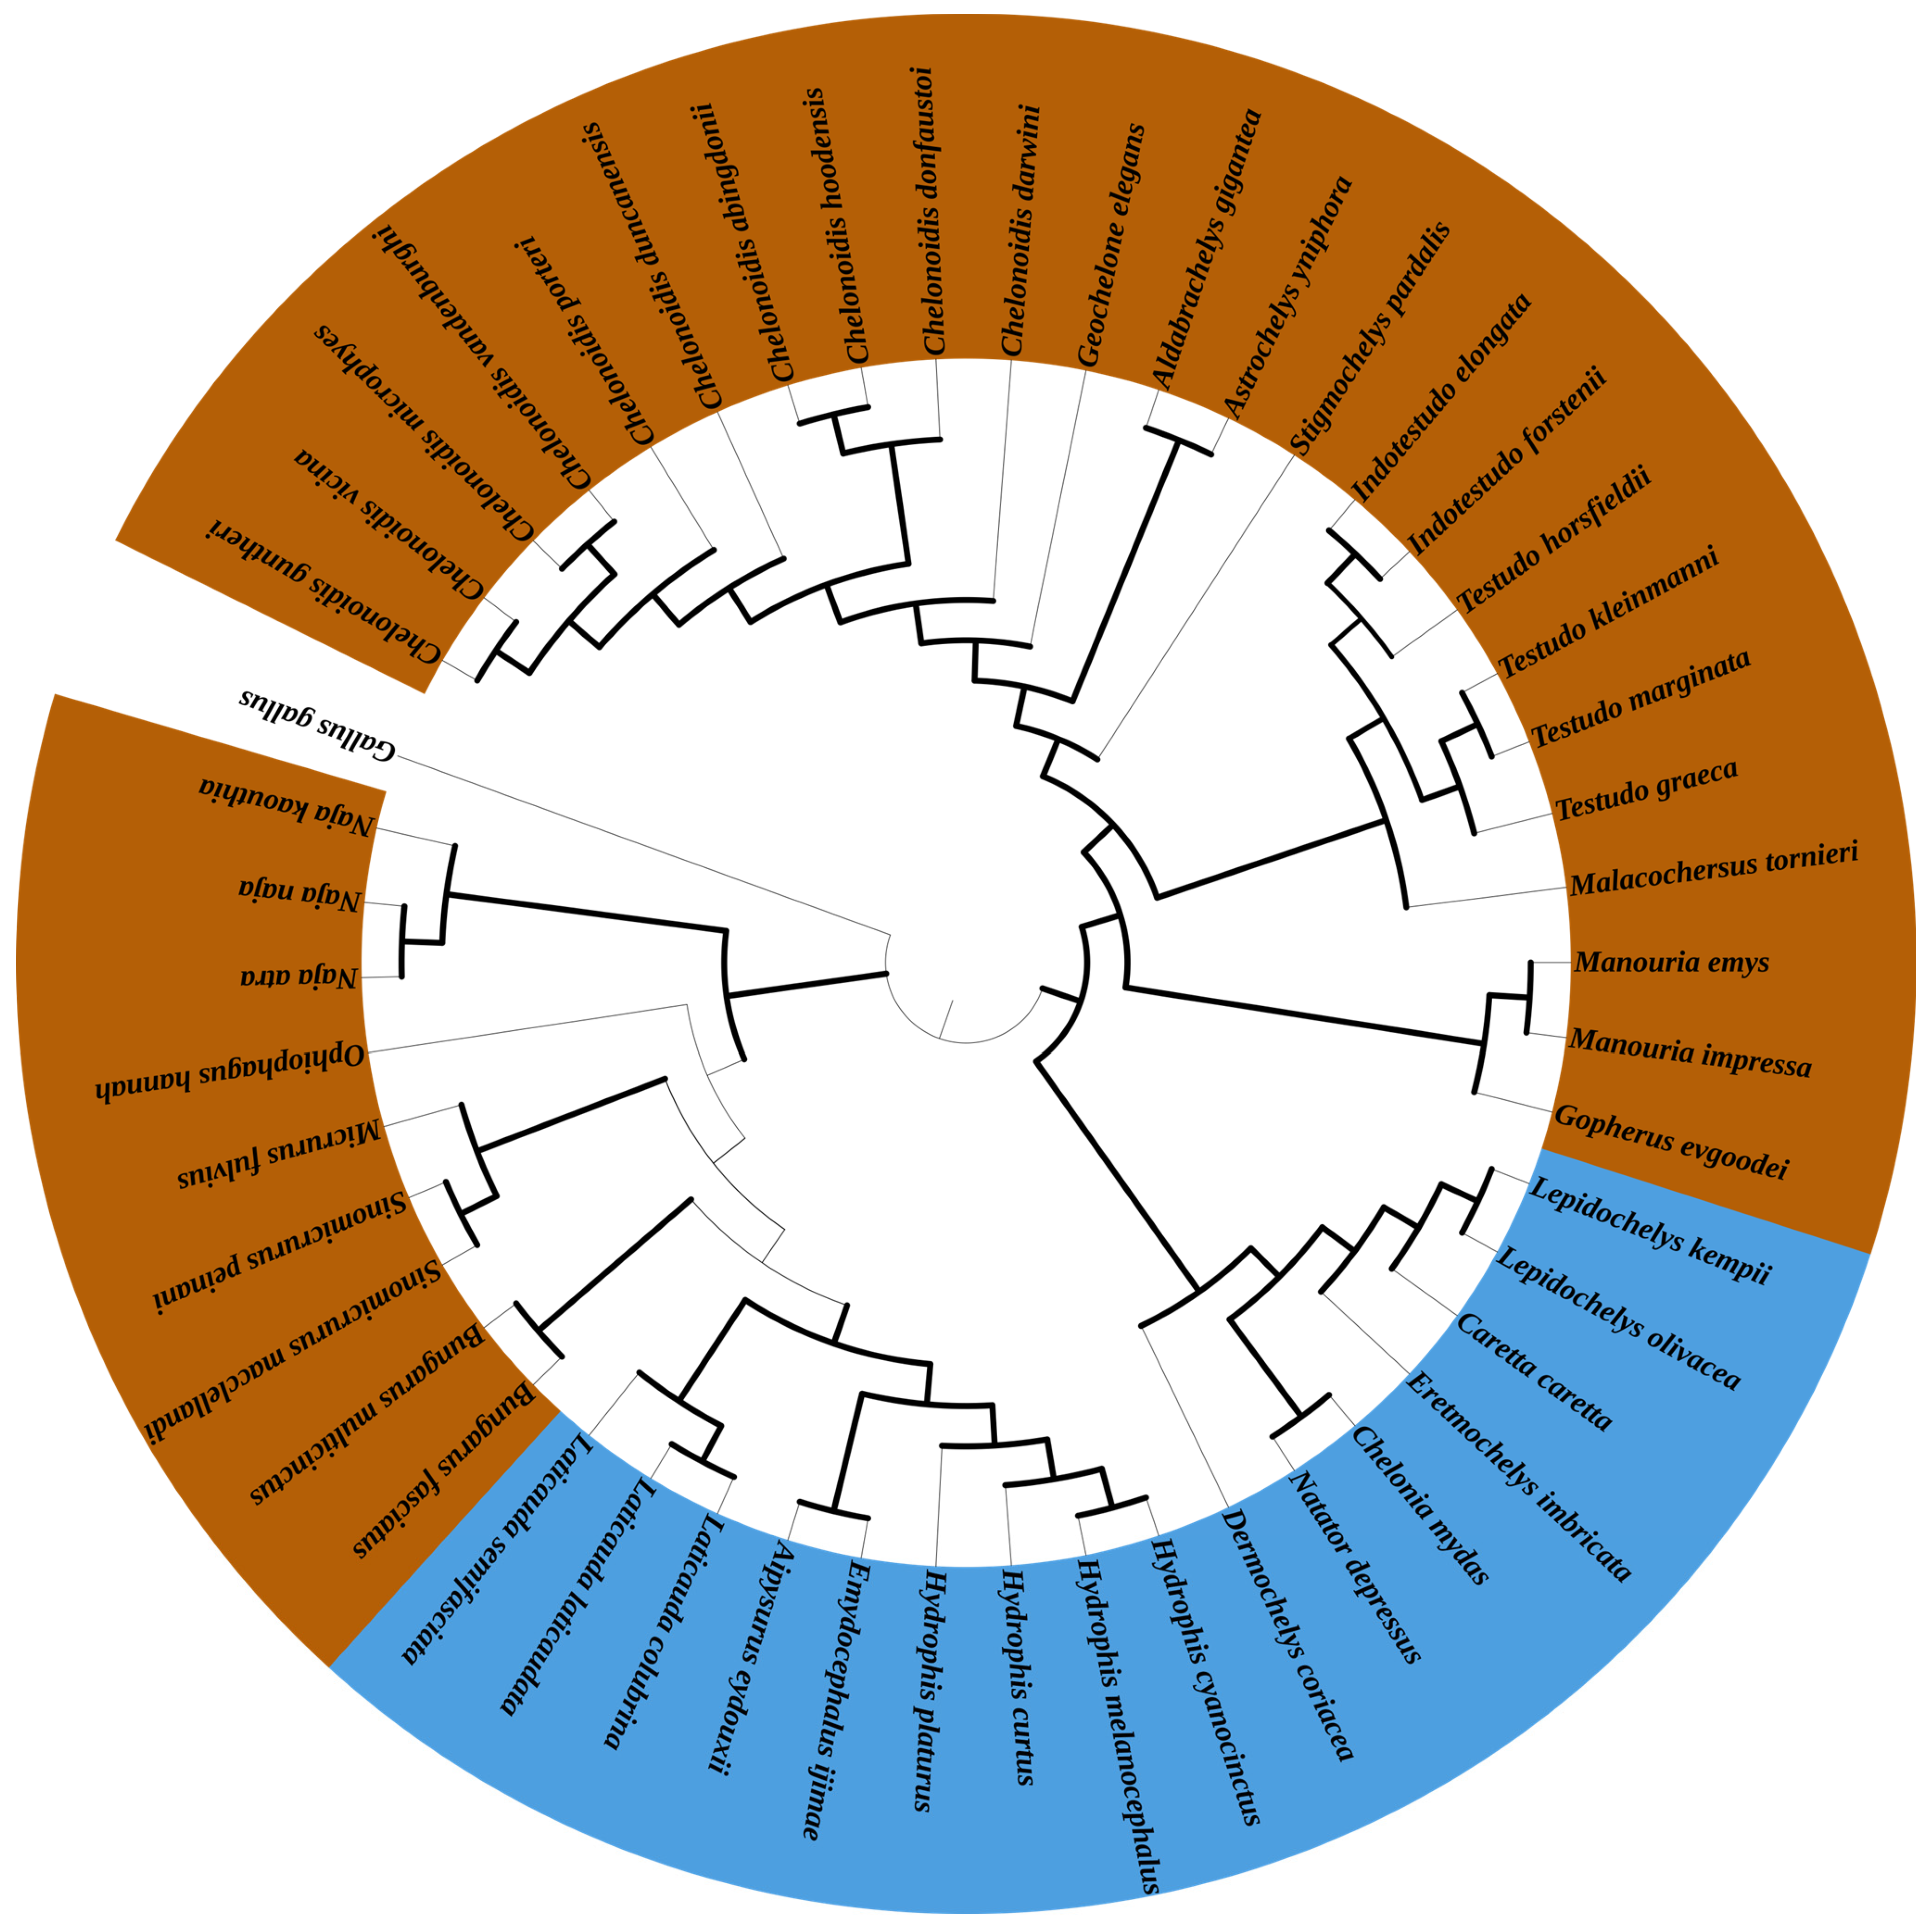
The Bayesian (BI) phylogenetic tree revealed that there are two branches including Testudoformes and Serpentes within the 49 species (Figure 6). Subsequently, C. vicina shared a closer common ancestor with Chelonoidis guntheri. Species of the genus Chelonoidis were clustered into one clade that was closest to Geochelone. This also serves as support for the mitochondrial genome data of C. vicina being correctly assembled in our study. Among the sea snakes, three species of Laticauda and Hydrophis differentiated earlier and formed a separate branch. In addition, Aipysurus and Emydocephalus differentiated from Hydrophis to form a branch.

3.6. Evolutionary Analysis

The dN/dS values of 13 PCGs of the 49 species were estimated to evaluate the mutational pressure of the codons from purifying selection under the branch model within the PAML package. The evolutionary rates of the mtDNA PCGs in the 49 species investigated in this study differed under different environmental selection pressures. The branch-site model was used to detect the positive site of each mtDNA PCG in the 49 species. From the results of the analysis of the branch-site model (Table 4), we determined that there are six positively selected site genes COX2 (p = 1; positively selected sites 5 and 16), COX3 (p = 1; positively selected sites 22 and 175), CYTB (p = 1; positively selected site 324), ND3 (p = 1; positively selected sites 14 and 16), ND4 (p = 1; positively selected sites 30 and 431), ND4L (p = 1; positively selected sites 15 and 56), ND5 (p = 1; positively selected site 535), and ND6 (p = 1; positively selected site 130). By using the branch model, there are three genes that show significant differences, namely COX2 (p = 0.012), ND1 (p = 0.003), and ND3 (p = 0.002). Meanwhile, COX2 (ωAR = 0.024; ωTR = 0.039) and ND3 (ωAR = 0.060; ωTR = 0.112) are two rapidly evolving genes within the 32 terrestrial reptiles, and ND1 (ωAR = 0.049; ωTR = 0.035) is a rapidly evolving gene within the 16 aquatic reptiles (Table 5).

4. Discussion

Mitochondria, as energy-generating organelle, can provide the energy required for animals’ life activities through oxidative phosphorylation [45,46,47]. In evolutionary biology and conservation genetics, mitochondrial genomes are used to analyze phylogenetic relationships and adaptive evolution. Therefore, in this study, we assembled the mitochondrial genome of C. vicina and compared it with that of 32 terrestrial reptiles and 16 aquatic reptiles in order to clarify how terrestrial reptiles have adapted to their terrestrial niche, thereby providing a scientific and theoretical basis for their protection.

4.1. Mitochondrial Genome Characteristics

The characteristics of the mitochondrial genome of different animal groups may vary. The mitochondrial genome of terrestrial reptiles is usually a double-stranded circular molecule, about 15–20 Kb in size, and containing 37 genes, including 13 PCGs, 2 rRNAs, 22 tRNAs, and 1 control region. In most PCGs, the start codon is ATG and the stop codon is TAA [48]. Here, we assembled and annotated the mitochondrial genome of C. vicina, and the results (Figure 1 and Table 2) show that its characteristics are similar to those of other terrestrial reptiles. Previous studies have shown that in protozoa, the GC offset rate is indicative of a DNA replication-driven genome evolution event [49]. The C. vicina mitochondrial genome is characterized by a higher AT than GC content, similarly to other vertebrates [24]. In addition, in this study, the AT content was also found to be higher than the GC content for other terrestrial reptiles (Table 4), but it is not clear whether there is a relationship between the GC skewness and species evolution, especially in C. vicina. In terms of the secondary structure of C. vicina tRNAs, only tRNASER2 (GCT) lacks a dihydrouridine hairpin structure, and the other 21 tRNAs have a typical clover structure. There are some studies showing that tRNASER lacks a typical clover structure in several animals [41,50], while others have shown that the lack of a dihydrouridine arm or thymidine–pseudo-uridine–cytidine (T-ψ-C) ring in tRNASER may not affect its normal function [51].

4.2. Phylogenetic Analysis

In the phylogenetic analysis, all animals of Testudoformes were clustered into one branch, while animals of Serpentes were clustered into another branch, which validates the use of mitochondrial genomes in the systematic taxonomy classification of species. All the species of the genus Chelonoidis grouped into one branch, where C. guntheri and C. vicina are the most closely genetically related, which is consistent with previous research results on the traditional classification of C. vicin [32].

4.3. Evolutionary Analysis of Terrestrial Adaptability

The selection stress intensity of protein-coding genes is measured based on the nonsynonymous/synonymous nucleotide substitution ratio (i.e., the dN/dS ratio or ω value) [52,53]. In this study, the result of the ENc plot revealed that all the 49 species bore natural selection (Figure 2D); therefore, it is necessary to conduct selection stress analysis to screen positive selection genes. After the analysis, the ω value of each mtDNA PCG of the 49 species was generally less than 1, indicating that the PCG of vertebrate mitochondrial DNA is in a state of purifying selection in different habitats. In addition, we used the branch-site model to detect positively selected genes. The results showed that compared with aquatic reptiles, the COX2, COX3, Cytb, ND3, ND4, ND4L, ND5, and ND6 genes of terrestrial reptiles contain unique positive selection sites (Table 5). Of these, the COX2 and ND3 genes not only have positive selection sites but also have faster evolutionary rates in terrestrial reptiles than in aquatic reptiles (Table 5). This suggests that tortoises accumulate more non-identical mutations in these three genes. Studies have shown that a large number of nonsynonymous mutations may lead to some useful changes in amino acids related to defense [22,23,54]. In fact, the proteins encoded by ND genes are concentrated mostly in mitochondrial complex I to respond to various stresses [55]. Mitochondrial complex I is a large enzyme that can affect mitochondrial differential reactive oxygen species (ROS) through the electronic respiratory chain. And ROS is closely related to energy production [56]. In addition, the COX genes are located in cytochrome c oxidase (Complex IV), which is the last and rate-limiting step in the electronic respiratory chain and closely related to the prevention of the formation of ROS [57]. Therefore, the positive selection sites of COX2 and ND3 in terrestrial reptiles are closely related to a change in mitochondrial energy metabolism, which is possibly related to terrestrial adaptability.

5. Conclusions

In this study, the high-quality mitochondrial genomes of C. vicina were constructed, and comparative mitogenomic analyses of 32 terrestrial reptiles and 16 aquatic reptiles were conducted. We (1) found the structural characteristics of the mitochondrial genome of the tortoise C. vicina are consistent with those of other tortoise species; (2) the AT skew differs with a positive value greatly by 49 species whereas the GC skew of each species does not differ much with a negative value; (3) C. vicina shared a closer common ancestor with Chelonoidis guntheri. The genus Chelonoidis was clustered into one clade that was closest to Geochelone; (4) COX2 and ND3 are two rapidly evolving genes within the 32 terrestrial reptiles; meanwhile, ND1 is a rapidly evolving gene within the 16 aquatic reptiles; and (5) the positive selection sites of COX2 and ND3 in terrestrial reptiles are closely related to a change in mitochondrial energy metabolism, which is possibly related to terrestrial adaptability. Overall, this study is a blueprint for further research on the protection of C. vicina based on the comparative mitogenomic analyses and evolutionary analyses and which provide important basic data for the future research and conservation of Chelonoidis.

Author Contributions

Data curation, Y.S. and H.C.; formal analysis, Y.C., X.W. (Xibao Wang), H.C. and Y.Q.; funding acquisition, X.W. (Xiaoyang Wu), W.S. and H.Z.; investigation, Y.Q.; methodology, Y.C., X.W. (Xiaoyang Wu), Q.W., Y.Q. and S.L.; resources, Q.W. and W.S.; software, X.W. (Xiaoyang Wu) and Y.S.; writing—original draft, Y.C. and X.W. (Xibao Wang); writing—review and editing, Y.C. and X.W. (Xibao Wang); Y.C. and X.W. (Xibao Wang) have contributed equally to this work. All authors have read and agreed to the published version of the manuscript.

Funding

This work was funded by the National Natural Science Foundation of China (32070405, 32270444, 32370443 and 32170530) and the Youth Innovation Team in Colleges and Universities of Shandong Province (2022KJ177).

Institutional Review Board Statement

Because non-invasive samples were collected, ethical reviews were waived.

Informed Consent Statement

Not applicable.

Data Availability Statement

The mitochondrial genome of C. vicina is available at GenBank repository (https://www.ncbi.nlm.nih.gov/, accessed on 12 October 2024), with the accession number: PP475397. The complete mitogenome information for 49 reptiles is available in Table S1.

Acknowledgments

We thank the National Center for Biotechnology Information (NCBI) Database for providing the data platform.

Conflicts of Interest

Shuli Liu is from Zhonghuan Shengda Environmental Technology Group (Qingyun) Co., Ltd. The authors declare no conflicts of interest.

References

  1. Kruuk, H. Otters: Ecology, Behaviour and Conservation; Oxford University Press: Oxford, UK, 2006. [Google Scholar] [CrossRef]
  2. Timm-Davis, L.L.; DeWitt, T.J.; Marshall, C.D. Divergent Skull Morphology Supports Two Trophic Specializations in Otters (Lutrinae). PLoS ONE 2015, 10, e0143236. [Google Scholar] [CrossRef] [PubMed]
  3. Boore, J.L. Animal mitochondrial genomes. Nucleic Acids Res. 1999, 27, 1767–1780. [Google Scholar] [CrossRef] [PubMed]
  4. Liu, Y.; Wu, P.D.; Zhang, D.Z.; Zhang, H.B.; Tang, B.P.; Liu, Q.N.; Dai, L.S. Mitochondrial genome of the yellow catfish Pelteobagrus fulvidraco and insights into Bagridae phylogenetics. Genomics 2019, 111, 1258–1265. [Google Scholar] [CrossRef] [PubMed]
  5. Macey, J.R.; Schulte, J.A., 2nd; Larson, A.; Papenfuss, T.J. Tandem duplication via light-strand synthesis may provide a precursor for mitochondrial genomic rearrangement. Mol. Biol. Evol. 1998, 15, 71–75. [Google Scholar] [CrossRef]
  6. Mascolo, C.; Ceruso, M.; Palma, G.; Anastasio, A.; Pepe, T.; Sordino, P. The complete mitochondrial genome of the Pink dentex Dentex gibbosus (Perciformes: Sparidae). Mitochondrial DNA Part B Resour. 2018, 3, 525–526. [Google Scholar] [CrossRef]
  7. Shinde, S.; Bhadra, U. A complex genome-microRNA interplay in human mitochondria. BioMed Res. Int. 2015, 2015, 206382. [Google Scholar] [CrossRef]
  8. Taanman, J.W. The mitochondrial genome: Structure, transcription, translation and replication. Biochim. Biophys. Acta 1999, 1410, 103–123. [Google Scholar] [CrossRef]
  9. Yang, C.; Chen, Y.; Chen, Z.; He, G.; Zhong, Z.; Xue, W. The next-generation sequencing reveals the complete mitochondrial genome of Rhinogobius formosanus (Perciformes: Gobiidae). Mitochondrial DNA Part B Resour. 2020, 5, 2673–2674. [Google Scholar] [CrossRef]
  10. Mindell, D.P.; Sorenson, M.D.; Dimcheff, D.E. Multiple independent origins of mitochondrial gene order in birds. Proc. Natl. Acad. Sci. USA 1998, 95, 10693–10697. [Google Scholar] [CrossRef]
  11. Ren, Q.; Yuan, J.; Ren, L.; Zhang, L.; Zhang, L.; Jiang, L.; Chen, D.; Kan, X.; Zhang, B. The complete mitochondrial genome of the yellow-browed bunting, Emberiza chrysophrys (Passeriformes: Emberizidae), and phylogenetic relationships within the genus Emberiza. J. Genet. 2014, 93, 699–707. [Google Scholar] [CrossRef]
  12. van Tuinen, M.; Sibley, C.G.; Hedges, S.B. The early history of modern birds inferred from DNA sequences of nuclear and mitochondrial ribosomal genes. Mol. Biol. Evol. 2000, 17, 451–457. [Google Scholar] [CrossRef] [PubMed]
  13. Caccone, A.; Gentile, G.; Burns, C.E.; Sezzi, E.; Bergman, W.; Ruelle, M.; Saltonstall, K.; Powell, J.R. Extreme difference in rate of mitochondrial and nuclear DNA evolution in a large ectotherm, Galápagos tortoises. Mol. Phylogenetics Evol. 2004, 31, 794–798. [Google Scholar] [CrossRef] [PubMed]
  14. Gissi, C.; Iannelli, F.; Pesole, G. Evolution of the mitochondrial genome of Metazoa as exemplified by comparison of congeneric species. Heredity 2008, 101, 301–320. [Google Scholar] [CrossRef] [PubMed]
  15. Harrison, R.G. Animal mitochondrial DNA as a genetic marker in population and evolutionary biology. Trends Ecol. Evol. 1989, 4, 6–11. [Google Scholar] [CrossRef]
  16. Wang, X.; Shang, Y.; Wu, X.; Wei, Q.; Zhou, S.; Sun, G.; Mei, X.; Dong, Y.; Sha, W.; Zhang, H. Divergent evolution of mitogenomics in Cetartiodactyla niche adaptation. Org. Divers. Evol. 2023, 23, 243–259. [Google Scholar] [CrossRef]
  17. Wei, Q.; Zhang, H.; Wu, X.; Sha, W. The selective constraints of ecological specialization in mustelidae on mitochondrial genomes. Mammal Res. 2020, 65, 85–92. [Google Scholar] [CrossRef]
  18. Yang, M.; Gong, L.; Sui, J.; Li, X. The complete mitochondrial genome of Calyptogena marissinica (Heterodonta: Veneroida: Vesicomyidae): Insight into the deep-sea adaptive evolution of vesicomyids. PLoS ONE 2019, 14, e0217952. [Google Scholar] [CrossRef]
  19. Bjornerfeldt, S.; Webster, M.T.; Vila, C. Relaxation of selective constraint on dog mitochondrial DNA following domestication. Genome Res. 2006, 16, 990–994. [Google Scholar] [CrossRef]
  20. MacEachern, S.; McEwan, J.; McCulloch, A.; Mather, A.; Savin, K.; Goddard, M. Molecular evolution of the Bovini tribe (Bovidae, Bovinae): Is there evidence of rapid evolution or reduced selective constraint in Domestic cattle? BMC Genom. 2009, 10, 179. [Google Scholar] [CrossRef]
  21. Wang, Z.; Yonezawa, T.; Liu, B.; Ma, T.; Shen, X.; Su, J.; Guo, S.; Hasegawa, M.; Liu, J. Domestication Relaxed Selective Constraints on the Yak Mitochondrial Genome. Mol. Biol. Evol. 2011, 28, 1553–1556. [Google Scholar] [CrossRef]
  22. Wang, Y.; Shen, Y.; Feng, C.; Zhao, K.; Song, Z.; Zhang, Y.; Yang, L.; He, S. Mitogenomic perspectives on the origin of Tibetan loaches and their adaptation to high altitude. Sci. Rep. 2016, 6, 29690. [Google Scholar] [CrossRef] [PubMed]
  23. Li, F.; Lv, Y.; Wen, Z.; Bian, C.; Zhang, X.; Guo, S.; Shi, Q.; Li, D. The complete mitochondrial genome of the intertidal spider (Desis jiaxiangi) provides novel insights into the adaptive evolution of the mitogenome and the evolution of spiders. BMC Ecol. Evol. 2021, 21, 72. [Google Scholar] [CrossRef] [PubMed]
  24. Shang, Y.; Wang, X.; Liu, G.; Wu, X.; Wei, Q.; Sun, G.; Mei, X.; Dong, Y.; Sha, W.; Zhang, H. Adaptability and Evolution of Gobiidae: A Genetic Exploration. Animals 2022, 12, 1741. [Google Scholar] [CrossRef] [PubMed]
  25. Whitehead, A. Comparative mitochondrial genomics within and among species of killifish. BMC Evol. Biol. 2009, 9, 11. [Google Scholar] [CrossRef]
  26. Jensen, E.L.; Gaughran, S.J.; Fusco, N.A.; Poulakakis, N.; Tapia, W.; Sevilla, C.; Málaga, J.; Mariani, C.; Gibbs, J.P.; Caccone, A. The Galapagos giant tortoise Chelonoidis phantasticus is not extinct. Commun. Biol. 2022, 5, 546. [Google Scholar] [CrossRef]
  27. Cayot, L.J.; Gibbs, J.P.; Tapia, W.; Caccone, A. Chelonoidis vicina; The IUCN Red List of Threatened Species: Cambridge, UK, 2018. [Google Scholar]
  28. MacFarland, C.G.; Villa, J.; Toro, B. The Galápagos giant tortoises (Geochelone elephantopus) Part I: Status of the surviving populations. Biol. Conserv. 1974, 6, 118–133. [Google Scholar] [CrossRef]
  29. Márquez, C.; Wiedenfeld, D.; Snell, H.; Fritts, T.; Flyway Belen, M.; MacFarland, C.; Tapia, W.; Naranjo, S. Estado actual de las poblaciones de tortugas terrestres gigantes (Geochelone spp., Chelonia: Testudinae) en las islas Galápagos. Ecol. Apl. 2004, 3, 98–111. [Google Scholar] [CrossRef]
  30. Pritchard, P. The Galapagos Tortoises: Nomenclatural and Survival Status; Chelonian Research Foundation: Lunenburg, MA, USA, 1996. [Google Scholar]
  31. Swingland, I. Geochelone elephantopus. Galapagos giant tortoises. In The Conservation Biology of Tortoises; IUCN: Gland, Switzerland, 1989; pp. 24–28. [Google Scholar]
  32. Poulakakis, N.; Miller, J.M.; Jensen, E.L.; Beheregaray, L.B.; Russello, M.A.; Glaberman, S.; Boore, J.; Caccone, A. Colonization history of Galapagos giant tortoises: Insights from mitogenomes support the progression rule. J. Zool. Syst. Evol. Res. 2020, 58, 1262–1275. [Google Scholar] [CrossRef]
  33. Donath, A.; Juehling, F.; Al-Arab, M.; Bernhart, S.H.; Reinhardt, F.; Stadler, P.F.; Middendorf, M.; Bernt, M. Improved annotation of protein-coding genes boundaries in metazoan mitochondrial genomes. Nucleic Acids Res. 2019, 47, 10543–10552. [Google Scholar] [CrossRef]
  34. Lohse, M.; Drechsel, O.; Bock, R. OrganellarGenomeDRAW (OGDRAW): A tool for the easy generation of high-quality custom graphical maps of plastid and mitochondrial genomes. Curr. Genet. 2007, 52, 267–274. [Google Scholar] [CrossRef]
  35. Kumar, S.; Stecher, G.; Li, M.; Knyaz, C.; Tamura, K. MEGA X: Molecular Evolutionary Genetics Analysis across Computing Platforms. Mol. Biol. Evol. 2018, 35, 1547–1549. [Google Scholar] [CrossRef] [PubMed]
  36. Lowe, T.M.; Chan, P.P. tRNAscan-SE On-line: Integrating search and context for analysis of transfer RNA genes. Nucleic Acids Res. 2016, 44, W54–W57. [Google Scholar] [CrossRef] [PubMed]
  37. He, W.; Wang, N.; Tan, J.; Wang, R.; Yang, Y.; Li, G.; Guan, H.; Zheng, Y.; Shi, X.; Ye, R.; et al. Comprehensive codon usage analysis of porcine deltacoronavirus. Mol. Phylogenet. Evol. 2019, 141, 106618. [Google Scholar] [CrossRef] [PubMed]
  38. Perna, N.T.; Kocher, T.D. Patterns of nucleotide composition at fourfold degenerate sites of animal mitochondrial genomes. J. Mol. Evol. 1995, 41, 353–358. [Google Scholar] [CrossRef]
  39. Darling, A.C.E.; Mau, B.; Blattner, F.R.; Perna, N.T. Mauve: Multiple alignment of conserved genomic sequence with rearrangements. Genome Res. 2004, 14, 1394–1403. [Google Scholar] [CrossRef]
  40. Edgar, R.C. MUSCLE: Multiple sequence alignment with high accuracy and high throughput. Nucleic Acids Res. 2004, 32, 1792–1797. [Google Scholar] [CrossRef]
  41. Sun, C.H.; Liu, H.Y.; Min, X.; Lu, C.H. Mitogenome of the little owl Athene noctua and phylogenetic analysis of Strigidae. Int. J. Biol. Macromol. 2020, 151, 924–931. [Google Scholar] [CrossRef]
  42. Huelsenbeck, J.P.; Ronquist, F. MRBAYES: Bayesian inference of phylogenetic trees. Bioinformatics 2001, 17, 754–755. [Google Scholar] [CrossRef]
  43. Letunic, I.; Bork, P. Interactive Tree Of Life (iTOL) v4: Recent updates and new developments. Nucleic Acids Res. 2019, 47, W256–W259. [Google Scholar] [CrossRef]
  44. Yang, Z. PAML 4: Phylogenetic analysis by maximum likelihood. Mol. Biol. Evol. 2007, 24, 1586–1591. [Google Scholar] [CrossRef]
  45. Angione, C.; Costanza, J.; Carapezza, G.; Lió, P.; Nicosia, G. Analysis and design of molecular machines. Theor. Comput. Sci. 2015, 599, 102–117. [Google Scholar] [CrossRef]
  46. Hüttemann, M.; Helling, S.; Sanderson, T.H.; Sinkler, C.; Samavati, L.; Mahapatra, G.; Varughese, A.; Lu, G.; Liu, J.; Ramzan, R.; et al. Regulation of mitochondrial respiration and apoptosis through cell signaling: Cytochrome c oxidase and cytochrome c in ischemia/reperfusion injury and inflammation. Biochim. Biophys. Acta Bioenerg. 2012, 1817, 598–609. [Google Scholar] [CrossRef] [PubMed]
  47. Koch, R.E.; Buchanan, K.L.; Casagrande, S.; Crino, O.; Dowling, D.K.; Hill, G.E.; Hood, W.R.; McKenzie, M.; Mariette, M.M.; Noble, D.W.A.; et al. Integrating Mitochondrial Aerobic Metabolism into Ecology and Evolution. Trends Ecol. Evol. 2021, 36, 321–332. [Google Scholar] [CrossRef] [PubMed]
  48. Cui, L.; Huang, A.; He, Z.; Ao, L.; Ge, F.; Fan, X.; Zeng, B.; Yang, M.; Yang, D.; Ni, Q.; et al. Complete Mitogenomes of Polypedates Tree Frogs Unveil Gene Rearrangement and Concerted Evolution within Rhacophoridae. Animals 2022, 12, 2449. [Google Scholar] [CrossRef]
  49. Kono, N.; Tomita, M.; Arakawa, K. Accelerated Laboratory Evolution Reveals the Influence of Replication on the GC Skew in Escherichia coli. Genome Biol. Evol. 2018, 10, 3110–3117. [Google Scholar] [CrossRef]
  50. Ma, B.; Li, Z.; Lv, Y.; Zixuan, E.; Fang, J.; Ren, C.; Luo, P.; Hu, C. Analysis of Complete Mitochondrial Genome of Bohadschia argus (Jaeger, 1833) (Aspidochirotida, Holothuriidae). Animals 2022, 12, 1437. [Google Scholar] [CrossRef]
  51. Fourdrilis, S.; Martins, A.M.d.F.; Backeljau, T. Relation between mitochondrial DNA hyperdiversity, mutation rate and mitochondrial genome evolution in Melarhaphe neritoides (Gastropoda: Littorinidae) and other Caenogastropoda. Sci. Rep. 2018, 8, 17964. [Google Scholar] [CrossRef]
  52. Andrieux, L.O.; Arenales, D.T. Whole-genome identification of neutrally evolving pseudogenes using the evolutionary measure dN/dS. Methods Mol. Biol. 2014, 1167, 75–85. [Google Scholar] [CrossRef]
  53. Xia, T.; Zhang, H.; Zhang, L.; Yang, X.; Sun, G.; Chen, J.; Xu, D.; Zhao, C. Comparative and evolutionary analysis of the reptilian hedgehog gene family (Shh, Dhh, and Ihh). PeerJ 2019, 7, e7613. [Google Scholar] [CrossRef]
  54. Wang, X.B.; Zhou, S.Y.; Wu, X.Y.; Wei, Q.G.; Shang, Y.Q.; Sun, G.L.; Mei, X.S.; Dong, Y.H.; Sha, W.L.; Zhang, H.H. High-altitude adaptation in vertebrates as revealed by mitochondrial genome analyses. Ecol. Evol. 2021, 11, 15077–15084. [Google Scholar] [CrossRef]
  55. Hong, Y.H.; Huang, H.M.; Wu, L.; Storey, K.B.; Zhang, J.Y.; Zhang, Y.P.; Yu, D.N. Characterization of Two Mitogenomes of Hyla sanchiangensis (Anura: Hylidae), with Phylogenetic Relationships and Selection Pressure Analyses of Hylidae. Animals 2023, 13, 1593. [Google Scholar] [CrossRef]
  56. Lenaz, G.; Fato, R.; Genova, M.L.; Bergamini, C.; Bianchi, C.; Biondi, A. Mitochondrial Complex I: Structural and functional aspects. Biochim. Biophys. Acta 2006, 1757, 1406–1420. [Google Scholar] [CrossRef] [PubMed]
  57. Kadenbach, B. Complex IV—The regulatory center of mitochondrial oxidative phosphorylation. Mitochondrion 2021, 58, 296–302. [Google Scholar] [CrossRef] [PubMed]
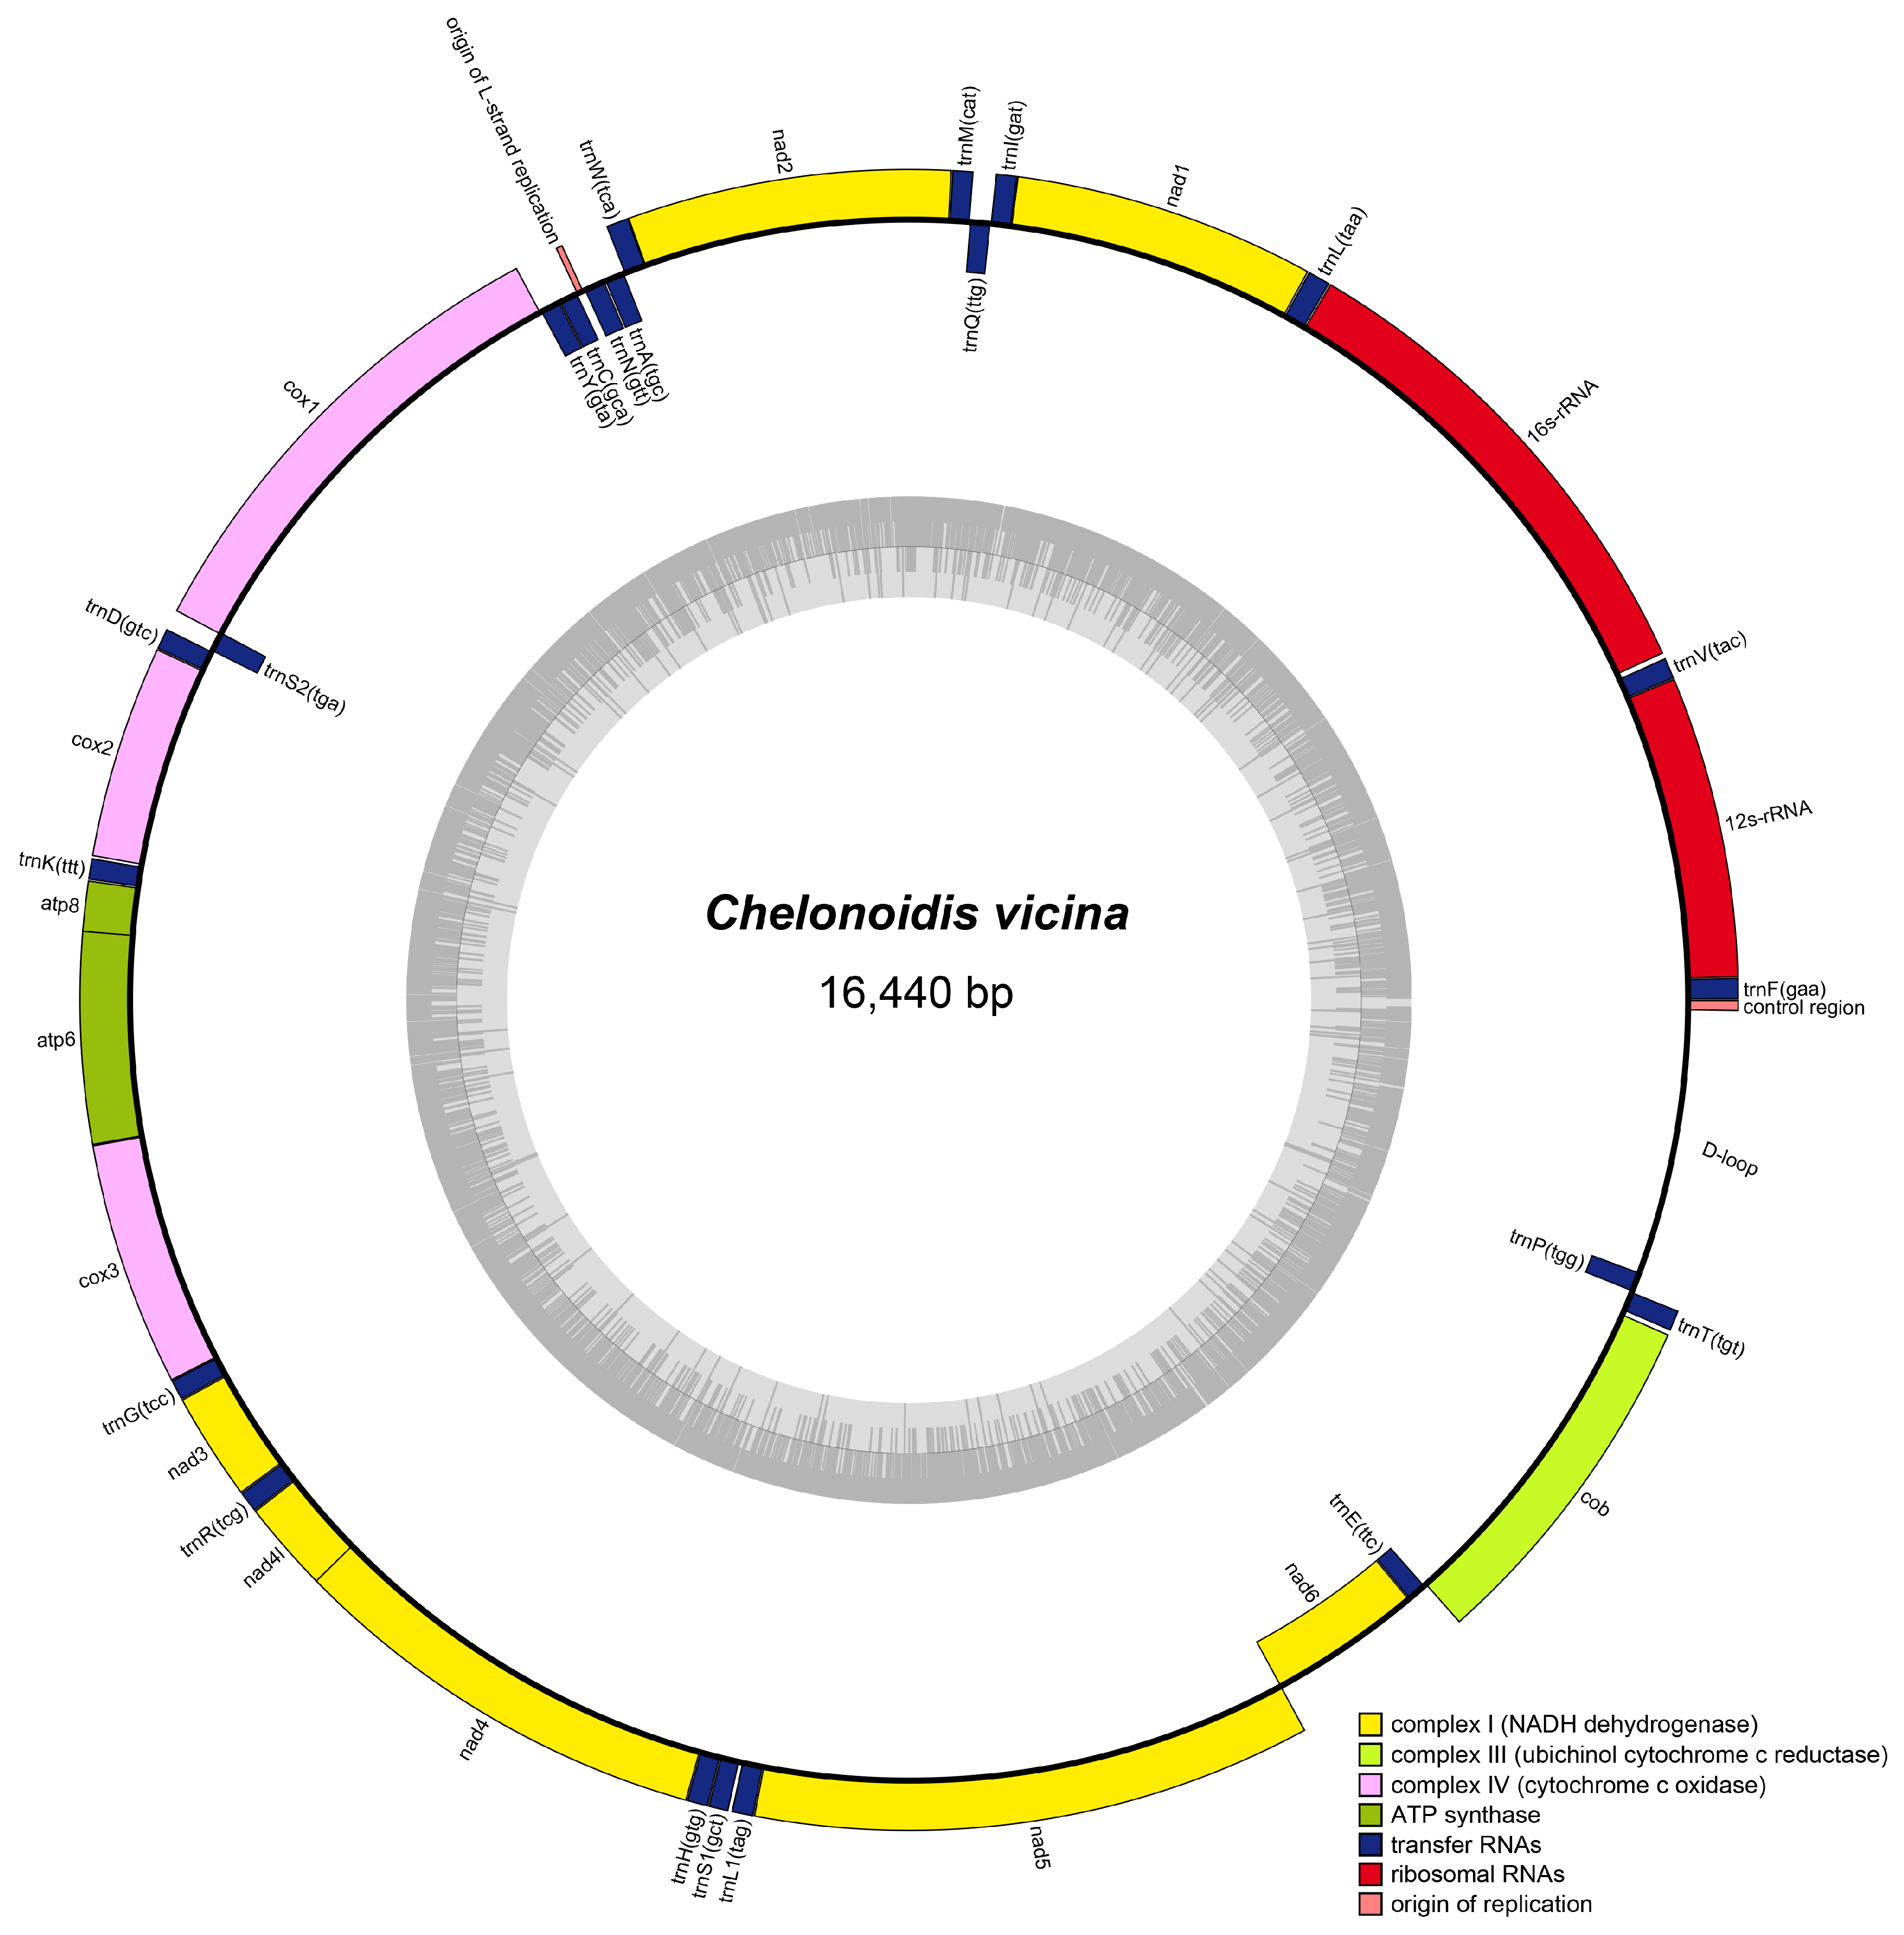
Figure 1. Map of C. vicina mitogenome genes plotted on the outer circle are encoded on the heavy strand (H-strand) and indicated by clockwise arrows, while genes plotted on the inner circle are encoded on the light strand (L-strand) and indicated by counterclockwise arrows.
Genes 16 00173 g001
Figure 2. (A) Position-specific nucleotide usage in the C. vicina mitogenome. (B) Rose plot of amino acid usage in the C. vicina mitogenome. (C) Relative synonymous codon usage (RSCU) in C. vicina. In the X-axis, each amino acid encoded by different codon families is represented using different colors; the Y-axis represents the RSCU values. (D) Plot of effective number of codons (ENc) of 49 mitogenomes below the curve of selection pressure.
Genes 16 00173 g002
Figure 3. The secondary structures of 22 tRNAs in the C. vicina mitogenome. Note: the last colored tRNA secondary structures have a canonical clover leaf structure.
Genes 16 00173 g003
Figure 4. Heatmap of codon usage in the mitogenomes of the 49 species. Note: (A), heatmap of nucleic acid composition of 49 species; (B), heatmap of amino acid composition of 49 species; red represents the most used codons, yellow represents the most used amino acids, and blue represents rarely used codons.
Genes 16 00173 g004
Figure 5. Collinearity analysis of the mitochondrial genome of 17 species analyzed in this study using Mauve. PCGs: white block; 12S rRNA and 16S rRNA: red block; tRNA: green block.
Genes 16 00173 g005
Figure 6. The phylogenetic relationships of 49 species based on BI tree using 13 concatenated mitochondrial PCGs. Note: C. vicina shared a closer common ancestor with Chelonoidis guntheri. The genus Chelonoidis was clustered into one clade that was closest to Geochelone. Among the sea snakes, three species of Laticauda and Hydrophis differentiated earlier and formed a separate branch. In addition, Aipysurus and Emydocephalus differentiated from Hydrophis to form a branch. Bayes software (V 3.2.6) under four simultaneous Markov chain Monte Carlo (MCMC) iterations, each of which was run for 2,000,000 cycles. Sampling was conducted every 1000 generations. Brown and blue represent terrestrial and aquatic reptiles, respectively. G. gallus was used as an outgroup.
Genes 16 00173 g006
Table 1. Characteristics of the mitochondrial genome of C. vicina.
GeneStartStopStrandLengthIntergenic NucleotideStarStop
tRNAPhe170+700
12s rRNA711039+9690
tRNAVal10401110+7114
16s rRNA11252717+15931
tRNALeu27192794+761
ND127963767+972−1ATGTAG
tRNAIle37673836+70−1
tRNAGln3836390671−1
tRNAMet39063974+690
ND239755015+1041−2ATGTAG
tRNATrp50145088+751
tRNAAla50905158692
tRNAAsn51615234743
tRNACys526153266626
tRNATyr53275397711
COX153996946+15483GTGAGG
tRNASer69387008710
tRNAAsp70097078+700
COX270797765+6875ATGTAA
tRNALys77717840+701
ATP878428006+165−10ATGTAA
ATP679978680+684−1ATGTAA
COX386809464+785−1ATGTA
tRNAGly94649531+680
ND395329883+1800ATGTA
tRNAArg98829951+701
ND4L995210,248+2970ATGTAA
ND410,24211,619+1378−7ATGT
tRNAHis11,62011,689+700
tRNASer11,69011,755+660
tRNALeu11,76511,836+729
ND511,83713,633+17970ATGTAA
ND613,62914,153525−5ATGAGG
tRNAGlu14,15414,221680
Cytb14,22615,357+11324ATGTA
tRNAThr15,37015,438+692
tRNAPro15,44015,508691
Table 2. Nucleotide composition and AT and GC skew in C. vicina.
C. vicinaSizeA %T %G %C %AT %GC %AT SkewGC Skew
mtDNA16,44034.8324.6012.5728.0059.4340.570.17−0.38
PCGs11,34034.0224.8711.3429.7758.8941.110.16−0.45
tRNAs154535.8625.6315.0823.4361.4938.510.17−0.22
rRNAs256238.3720.0716.7424.8258.4441.560.31−0.19
D-Loop93234.4431.9711.9221.6766.4133.590.04−0.29
Table 3. The mitogenome composition of 49 species.
SpciesT(U)%A%AT%AT SkewG%C%GC%GC Skew
Bungarus fasciatus31.333.564.80.03411.22435.2−0.362
Bungarus multicinctus29.932.262.10.03712.125.837.9−0.362
Micrurus fulvius27.730.858.50.05313.028.541.5−0.373
Naja naja26.232.158.30.10213.228.541.7−0.367
Naja kaouthia26.232.258.30.10313.228.541.7−0.368
Naja atra26.232.258.40.10113.128.541.6−0.371
Ophiophagus hannah26.132.758.80.11312.129.141.2−0.413
Sinomicrurus peinani29.332.461.70.05111.826.538.3−0.383
Sinomicrurus macclellandi27.732.059.60.07212.228.240.4−0.397
Aldabrachelys gigantea26.432.859.20.10712.428.440.8−0.392
Chelonoidis microphyes26.432.358.80.10012.528.741.2−0.394
Chelonoidis vandenburghi26.432.458.80.10012.428.741.2−0.396
Chelonoidis guntheri26.432.458.80.10912.428.741.2−0.396
Chelonoidis donfaustoi26.432.458.80.10212.428.841.2−0.397
Chelonoidis darwini26.432.558.80.10412.428.841.2−0.399
C. vicina26.432.458.80.10812.528.741.2−0.395
Chelonoidis porteri26.432.458.80.10812.428.841.2−0.399
Chelonoidis duncanensis26.332.558.80.10412.428.841.2−0.399
Chelonoidis hoodensis26.432.458.80.10212.428.841.2−0.397
Chelonoidis abingdonii26.432.458.80.10212.428.841.2−0.397
Gopherus evgoodei27.432.359.70.08212.927.440.3−0.358
Geochelone elegans25.632.057.60.11213.229.342.4−0.380
Malacochersus tornieri27.733.060.70.08711.827.539.3−0.399
Testudo kleinmanni27.932.360.20.07312.527.239.8−0.370
Testudo marginata27.832.360.10.07612.727.339.9−0.366
Testudo horsfieldii27.53259.50.07712.827.740.5−0.369
Indotestudo forstenii27.832.860.70.08212.127.239.3−0.382
Stigmochelys pardalis27.532.560.10.08412.627.439.9−0.371
Manouria emys27.531.759.20.06913.327.540.8−0.350
Testudo graeca28.332.961.20.07412.226.638.8−0.372
Indotestudo elongata28.133.061.10.07912.026.938.9−0.384
Manouria impressa28.031.659.60.05913.327.140.4−0.341
Astrochelys yniphora27.532.560.10.08312.527.439.9−0.371
Laticauda semifasciata27.331.959.20.07913.227.640.8−0.352
Laticauda colubrina29.133.162.20.06512.125.737.8−0.360
Laticauda laticaudata28.032.160.20.06812.827.139.8−0.358
Aipysurus eydouxii26.831.958.70.08612.728.641.3−0.384
Emydocephalus ijimae28.031.959.90.06612.627.640.1−0.373
Hydrophis curtus28.331.059.30.04613.527.240.7−0.337
Hydrophis cyanocinctus28.231.459.60.05413.027.340.4−0.354
Table 4. Positive selection of eight mtDNA PCGs using the branch-site model.
GeneModel2Δlnlp-ValuePositively Selected Sites (BEB Analysis)
COX2Model A vs.
Null Mode
015 T 0.986 *, 16 T 0.985 *
COX30122 M 0.955 *, 175 A 0.962 *
CYtb01324 T 0.994 **
ND30114 S 0.998 **, 16 L 0.975 *
ND40130 Y 0.975 *, 431 I 0.994**
ND4L0115 T 0.990 *,56 Q 0.962 *
ND501535 S 0.970 *
ND601130 G 0.977 *
Note: T, threonine, Thr; M, methionine, Met; A, alanine, Ala; S, serine, Ser; L, leucine, Leu; Y, tyrosine, Tyr; I, isoleucine, Ile; Q, glutarnine, Gln; G, Glycine, Gly; *, have significance, **, have very significance.
Table 5. Test for positive selection in divergent clades of each mtDNA PCG using branch model.
GeneModel Compared|2ΔlnL|p-ValueωARωTR
ATP6M2 vs. M00.6350.4260.0950.085
ATP80.0490.8250.2090.198
COX10.5180.4720.0170.015
COX26.3220.012 *0.0240.039
COX30.0210.8850.0330.034
Cytb0.0870.7680.0440.046
ND18.9890.003 **0.0490.035
ND20.1330.7150.0670.064
ND310.2560.002 **0.0600.112
ND43.4620.0630.0610.050
ND4L0.0170.8980.0570.055
ND50.6090.4350.0710.066
ND62.0740.1500.0900.116
*, have significance, **, have very significance.
Disclaimer/Publisher’s Note: The statements, opinions and data contained in all publications are solely those of the individual author(s) and contributor(s) and not of MDPI and/or the editor(s). MDPI and/or the editor(s) disclaim responsibility for any injury to people or property resulting from any ideas, methods, instructions or products referred to in the content.