Abstract
Background: Phospholipase A (PLA) enzymes catalyze the hydrolysis of glycerophospholipids, releasing free fatty acids and lysophospholipids that play vital roles in plant growth, development, and stress responses. Methods: This study identified and analyzed SlPLA genes through bioinformatics and further explored the function of PLA genes under cold stress through virus-induced gene silencing (VIGS) experiments. Results: This study systematically characterized the SlPLA gene family in tomato, identifying 80 genes distributed across 12 chromosomes. Phylogenetic analysis categorized these genes into three groups: pPLA, PLA1, and PLA2. Conserved motifs and gene structure analysis revealed distinct patterns, with some genes lacking untranslated regions (UTRs), which suggests functional diversification. Promoter analysis indicated that SlPLA genes are regulated by light, hormones, and stress-related elements, particularly cold stress. RNA-seq data and qRT-PCR results indicated the differential expression of SlPLA genes across various tissues in tomato cultivars (Heinz and Micro-Tom). Under cold stress, certain SlPLA genes, especially SlPLA1-2, were up-regulated, suggesting their involvement in cold tolerance. Silencing SlPLA1-2 resulted in increased membrane damage, elevated malondialdehyde (MDA) levels, higher electrolyte leakage, and a lower expression of cold-responsive genes within the ICE1-CBF-COR pathway and jasmonic acid (JA) biosynthesis. Conclusions: This study discovered 80 SlPLA genes in tomato across 12 chromosomes, categorizing them into pPLA, PLA1, and PLA2 via phylogenetic analysis. The qRT-PCR analysis identified that SlPLA1-2 was strongly induced by cold stress, and further experiments regarding genetics and physiology revealed that SlPLA1-2 boosts the cold tolerance of tomato by affecting the CBF signaling pathway and JA biosynthesis, offering insights for future stress-resilience breeding.
1. Introduction
Phospholipids, as a class of lipid molecules containing phosphates, are one of the primary components of cell membranes [1]. Phospholipases (PLs) catalyze the hydrolysis of phospholipids, yielding a variety of lipid molecules, including free fatty acids (FFAs), phosphatidic acids (PAs), diacylglycerol (DAG), and lysophospholipids [2]. These hydrolysis products are essential to the signaling pathways that regulate plant growth, development, and responses to stress [3]. PLs can be classified into three main families according to their different hydrolysis sites, including phospholipase A (PLA), phospholipase C (PLC), and phospholipase D (PLD) [4]. PLA, serving as ubiquitous phospholipid hydrolases found in various organisms, liberates free fatty acids and lysophospholipids through the cleavage of the sn-1 or sn-2 positions of glycerophospholipids. Based on distinct functional domains, PLAs could be categorized into three groups: patatin-like phospholipase A (pPLA), phospholipase A1 (PLA1), and phospholipase A2 (PLA2) [5]. pPLAs hydrolyzes glycerolipids to produce free fatty acids and monoacyl derivatives [6]. PLA1s catalyze the hydrolysis of phospholipids at the sn-1 position, specifically targeting phosphatidylcholine (PC) and PA [7]. Free fatty acids and hemolytic phospholipids are produced by PLA2s hydrolyzing glycerophospholipids at the sn-2 position [8,9].
A growing body of evidence has indicated that PLA was critical for cell growth, seed germination, root development, and pollen maturation [10]. In Arabidopsis, the over-expression of pPLAIIIβ resulted in reduced length of leaves, petioles, hypocotyls, main root, and root hairs, as well as a decrease in cellulose content compared with wild-type plants. This indicated that pPLAIIIβ was essential for root growth and the proliferation of plant cells [10]. The up-regulation of pPLAIIIα in Arabidopsis has been demonstrated to decrease lignin levels in secondary cell walls, causing inhibited plant growth and development, reduced leaf surface area, shortened seed length, and decreased root hair density [11]. The silencing of GhpPLA23 and GhpPLA44 genes decreased the size of petals, stigmas, and anthers, as well as resulted in a significant reduction in the vitality of pollen. This ultimately affected the reproductive and developmental processes of upland cotton [12]. In addition, PLA genes play a role in regulating plant responses to biotic and abiotic stress factors. In cotton (Gossypium barbadense), GbPLA1-32-silenced plants exhibited a disruption in the stability of leaf membrane structure compared to wild types under salt stress [13]. Under salt and drought stress, the knockout of pPLAIIIγ resulted in decreased germination rates of Arabidopsis seeds and significant reductions in main root length and dry weight. Compared with the control, the growth of knockout plants was more sensitive to salt and drought stress [14]. Compared with wild-type plants, AtPLAI knocked-out plants exhibited increased lesion size, maceration of leaves, and leaf necrosis under Botrytis cinerea (B. cinerea) infection [15]. This result indicates that plant PLAs also participate in plant biotic stress responses.
Recently, PL was reported to be crucial for sexual reproduction in numerous plants [16]. Phospholipase NOT-LIKE-DAD (NLD), also referred to as MTL or ZmPLA1, which encoded a membrane-localized phospholipase, was essential for the process of fertilization (Gilles et al., 2021). Previous studies have demonstrated that the mutation of the maize MTL gene triggers haploid induction (HI) [17]. Furthermore, in rice and wheat, the knockout of MTL/ZmPLA1/NLD homologous genes also leads to HI [18].
Tomato, an important vegetable crop in the Solanaceae family, has been widely cultivated around the world [19]. However, studies on the SlPLA gene family of tomato are currently absent, and the functions of its members in growth, development, and stress response remain unclear. In this study, a detailed investigation into the gene structure, chromosomal positions, evolutionary relationships, and expression of the SlPLA gene family was undertaken. In addition, the role of SlPLA1-2 in tomato plants exposed to low temperatures was identified using the VIGS method. This study aims to further our knowledge of the evolutionary connections between SlPLA genes in tomato and their possible function in combating abiotic stress.
2. Materials and Methods
2.1. Plant Materials and Treatments
Tomato seeds of the varieties ‘Micro-Tom’ and ‘Ailsa Craig’ (AC) were used in this study. Germinated seeds were planted in a 3:1 mixture of peat and vermiculite. Plants were grown in a greenhouse under a 12 h photoperiod at 25 °C with 70% humidity. Samples from root, stem, leaf, mature pollen, pistil, and fruit were collected from ‘Micro-Tom’ to study the expression levels of SlPLA genes in different tissues, with four biological replicates for each.
Cold treatment was applied to ‘AC’ plants at the five-leaf stage by placing them in a 4 °C incubator. Samples of leaves were collected at 0, 3, 6, 12, and 24 h and then quickly frozen in liquid nitrogen and kept at −80 °C for RNA extraction.
2.2. Identification and Phylogenetic Analysis of PLA Genes
The PLA gene family members were identified using the Hidden Markov Model (HMM) and Blastp approaches [20]. A Blastp search of the NCBI tomato genome database (https://www.ncbi.nlm.nih.gov/, accessed on 3 November 2023) was conducted using AtPLAs protein sequences as the query [21]. The HMM search was also performed on the tomato genome database using conserved functional domains from the Pfam database (http://pfam.xfam.org, accessed on November 10, 2023). Redundant entries from both methods were filtered to yield the final SlPLA gene family members, which were annotated on the Softberry website (http://www.softberry.com/, 10 December 2023). To examine the evolutionary relationships, PLA protein sequences from Arabidopsis and maize were also included. Genome data of these species were downloaded from the NCBI, and ClustalX2 software was used for multiple sequence alignment. A phylogenetic tree was generated utilizing MEGA11.0 software, employing the Maximum Likelihood (ML) method and incorporating 2000 bootstrap replications for statistical support [22].
2.3. Characterization of PLA Proteins, Chromosomal Localization, and Synteny Analysis in Tomato
The ExPASy tool was used to predict the molecular weights and isoelectric points of SlPLA proteins (https://web.expasy.org/protparam/, accessed on 4 November 2023) [23,24]. Subcellular localization predictions were obtained using Cell-PLoc2.0 (http://www.csbio.sjtu.edu.cn/bioinf/plant-multi/, accessed on accessed on 13 November 2023) [20]. The locations of SlPLA genes on chromosomes were identified with the ‘Show Genes on Chromosome’ tool in TBtools software [25], and synteny analysis of SlPLA genes was conducted using the One step MCScanX model of TBtools v1.110 [26].
2.4. Conserved Motifs, Gene Structure, and Cis-Acting Elements of SlPLA Genes
The MEME suite was used to identify conserved motifs in SlPLA proteins (https://meme-suite.org/meme/tools/meme, accessed on accessed on 25 November 2023) [27], specifying a total of 10 motifs that vary from 6 to 200 residues, with visualization in TBtools (version 2.080). Researchers analyzed the SlPLA family’s gene structure using GSDS online (https://gsds.gao-lab.org/, accessed on 28 November 2023).
In TBtools, the 2000 bp upstream promoter region for each PLA member was extracted, and PlantCARE was used to predict cis-acting elements (http://bioinformatics.psb.ugent.be/webtools/plantcare/html/, accessed on accessed on 4 February 2024) [28,29]. Visualization of cis-acting structure for each SlPLA member was conducted in TBtools [30].
2.5. Tissue-Specific, Cold Stress-Responsive Expression Analysis
RNA-seq data obtained from the Tomato Functional Genomics Database (TFGD; http://ted.bti.cornell.edu/, accessed on 4 April 2024) and Molecular Plant Online [31] were used to examine the expression patterns of the SlPLA genes. Expression data across different tissues (root, stem, leaf, bud, flower, and fruit) were compared between two tomato varieties, Heinz and Micro-Tom. The expression data of SlPLA genes under cold stress were obtained from published studies [32].
2.6. RNA Isolation and qRT-PCR Analysis
RNA extraction was performed by HiPure Plant RNA Plus Kit (Megan, R4150, Guangzhou, China), followed by reverse transcription into cDNA for fluorescence quantitative identification [33]. The initial cDNA strand was generated from 1 μg of total RNA utilizing HiScript II Q RT Super Mix for qPCR (+gDNA wiper) (Nanjing Vazyme Biotech, Nanjing, China) in accordance with the manufacturer’s guidelines. Gene-specific primers for qRT-PCR were designed using NCBI’s Primer-BLAST tool. Primer details are provided in Table S1. qRT-PCR was conducted on a CFX96 Real-Time System (Bio-Rad, Boston, MA, United States) using ChamQ Universal SYBR qPCR Master Mix reagent (Vazyme, Nanjing, China). The qRT-PCR parameters were 95 °C for 30 s, followed by 40 cycles of 95 °C for 3 s, 60 °C for 30 s, and final steps of 95 °C for 15 s, 60 °C for 60 s, and 95 °C for 15 s. Each reaction included four replicates, with data processed using the 2−ΔCT or 2−ΔΔCT method.
2.7. Virus-Induced Gene Silencing Assay
A 300 bp CDS fragment for silencing was obtained from the Sol Genomics Network (https://solgenomics.net/, accessed on 18 April 2024). The VIGS primers were designed using the Vazyme CETool (https://crm.vazyme.com/cetool/simple.html, accessed on 18 April 2024), and viral vector construction and plant injection followed methods from previous research [34]. The primer sequence was F: GTGAGTAAGGTTACCGAATTCATGGATGGTCTTTGTTTGACAGG. R: CGTGAGCTCGGTACCGGATCCGCAAAATCTTCAATACCCAATTCTC.
2.8. Cold Stress Tolerance Assay
Four-week-old tomato seedlings were subjected to cold stress at 4 °C, while control plants were kept in normal conditions. For RNA extraction and qRT-PCR analysis, leaf samples were gathered at 0 h, 3 h, 6 h, and 12 h after treatment. After 7 days of cold exposure, ion leakage assays were conducted to measure relative electrolyte leakage (REL) in the leaves. For REL measurement, 0.1 g of leaf tissue was placed in 10 mL of deionized water, shaken for 2 h, and the initial conductivity (R1) was recorded. Samples were then heated to 95 °C for 15 min, allowed to cool to room temperature, and then their final conductivity (R2) was measured. REL was calculated as the ratio of R1 to R2. The maximum photochemical efficiency of PSII (Fv/Fm) was evaluated using the PlantExplorer XS (Wageningen, The Netherlands). MDA content was determined using the MDA kit (Grace, G0109W, Suzhou, China).
2.9. Statistical Analysis
All experiments were conducted in a completely randomized design with three replicates. One-way ANOVA was used for statistical analyses, followed by Tukey’s multiple range test (p < 0.05) in SPSS (version 16.0).
3. Results
3.1. Identification and Chromosome Localization of SlPLA Genes
A Blastp search revealed 81 possible PLA genes within the entire genome of the tomato (Table S2). The amino acid sequence of Solyc04g079230 exhibits consistency with that of Solyc04g079210, as confirmed by annotations on the Softberry website. Of these, 80 SlPLA genes were named based on group classification and chromosomal location (Table 1). The amino acid (aa) sequences of SlPLAs ranged from 78 aa (SlPLA1-41) to 1348 aa (SlpPLA4), with molecular weight (MW) spanning 8.57 kDa (SlPLA1-41) to 149.43 kDa (SlpPLA4) and isoelectric points (pI) from 4.86 (SlpPLA16) to 9.43 (SlPLA2-1). Subcellular localization analysis revealed that 51 genes were located within chloroplasts, 19 genes in vacuoles, 1 gene in Golgi apparatus, and the remaining in diverse cellular compartments such as cell membranes, cell walls, nucleus, and cytoplasm.

Table 1.
SlPLA gene family members and related information.
The SlPLA genes were found to be distributed unevenly across 12 chromosomes according to chromosomal mapping (Figure 1). Among these, chromosome 2 contained the largest number (26) of SlPLA members, followed by chromosomes 1 and 8 with 7 each, while chromosome 11 had only 2 genes. The expansion of gene family members was largely driven by tandem repeat events [35]. In this study, seven tandem segments were found on chromosomes 2, 4, 5, 8, and 9 of tomato (Figure 1).
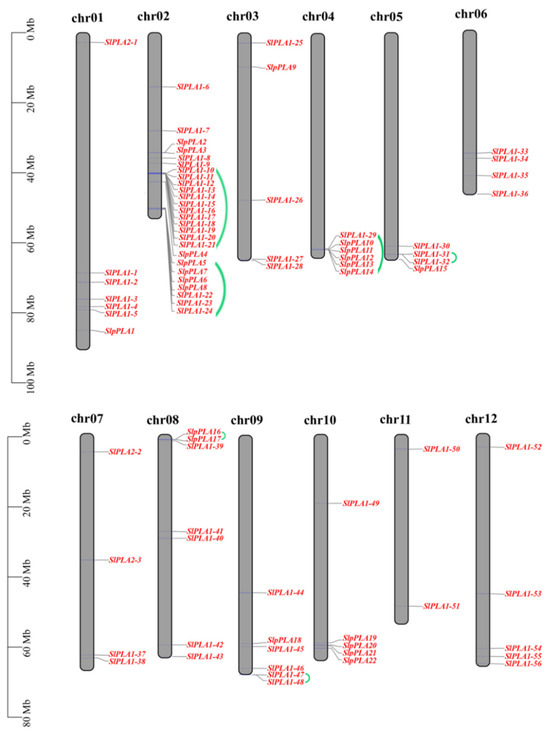
Figure 1.
Chromosomal positioning of PLA genes in tomato. The gray bar structure signifies the chromosome. The chromosome number is located above the chromosome and displayed in black font. The PLA genes were represented in red font and located on the right side of the chromosome, with tandem repeat genes connected with a green line. The scale bar located on the left side of the figure represents the length of chromosomes in millions of bases (Mb).
3.2. Phylogenetic Analysis of PLA Gene Family
A phylogenetic tree was created using selected PLA genes from Arabidopsis, maize, and tomato to further examine their phylogenetic relationships (Figure 2). The results revealed that these PLA genes could be categorized into three groups: pPLA, PLA1, and PLA2, which is consistent with prior research [13]. The pPLA group consisted of 52 PLA members, with 21 from tomato; the PLA2 group contained 11 PLA members, while the PLA1 comprised 122 members, including 56 from tomato. Moreover, the analysis showed that the SlPLA genes exhibited a closer evolutionary relationship with the Arabidopsis members within each group.
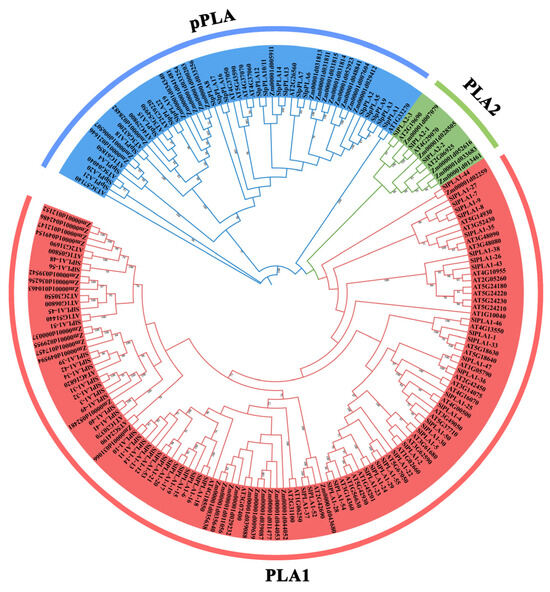
Figure 2.
Phylogenetic tree of PLAs from tomato, Arabidopsis, and maize. Multiple sequence alignment was performed on the amino acid sequences of 185 PLA in Arabidopsis, rice, and tomato. The phylogenetic tree was constructed with MEGA11.0 software using the ML method with 2000 bootstrap replications. Red/green/blue represent PLA1/PLA2/pPLA group, respectively.
3.3. Analysis of Conserved Motifs and Gene Structure in SlPLA Genes
Using the MEME tool, we identified 10 conserved motifs (motifs 1–10) among the 80 SlPLA proteins (Figure 3a), with lengths ranging from 16 to 50 amino acids (Table 2). Four proteins (SlPLA2-1, SlPLA2-2, SlPLA2-3, and SlpPLA10/11) lacked conserved motifs. The motif 2 was ubiquitous in all SlPLA proteins except for SlPLA2-1, SlPLA2-2, SlPLA2-3, SlPLA10/11, and SlPLA1-45 (Figure 3b). In the SlpPLA group, only motif 2 was consistently present. Based on these conserved motifs, group PLA1 was divided into four subgroups (I-IV) [13]. Subgroup I members had seven conserved motifs, including the subgroup-specific motif 4. Subgroup II shared high similarity with subgroup I but lacked motif 4. In subgroup III, all members, except SlPLA1-41, contained motifs 2, 5, and 7. Three members (SlPLA1-2, SlPLA1-5, SlPLA1-36) in subgroup IV contained motif 7. None of the SlPLA2 members detected conserved motifs.
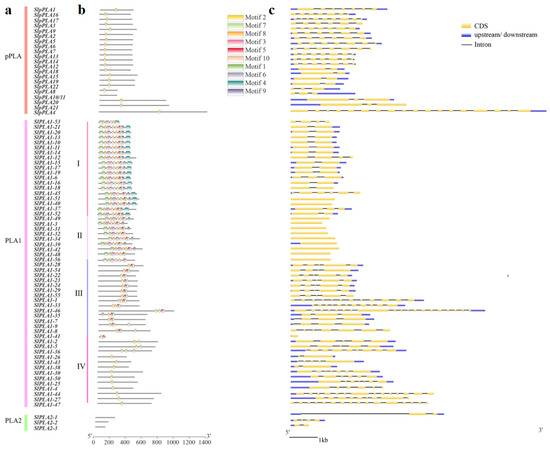
Figure 3.
Gene structure and motif analysis of PLA gene family in tomato. (a) Classification of 80 SlPLA genes based on phylogenetic tree (b) Ten conserved motifs of the SlPLA family, predicted by Multiple Em for Motif Elicitation (MEME). The different colors represent different amino acids. The bigger letters represent a more conserved sequence. (c) The gene structure of the SlPLA genes. The yellow box represents the CDS regions, the UTR is denoted by the blue box, and the intron regions are represented by the black line.
Table 2.
A list of the conserved motifs found in SlPLA proteins.
Intron-exon configurations revealed that SlPLA genes had 0-18 introns, with similar intron-exon arrangements within each subgroup (Figure 3c). Most subgroup I members (57%) within the PLA1 group contained a single intron, while subgroup II genes were intron less, and subgroup III had mostly 3-4 introns. SlPLA1-46 in subgroup III contained the highest intron count (18). In addition, we observed that some members contained the 5′UTR or 3′UTR or both of them. Among them, 3 genes had only the 5′UTR region, 11 genes had only the 3′UTR, 41 genes had both the 5′UTR and 3′UTR, and 15 genes lacked any UTR.
3.4. Collinearity and Duplication Analysis of SlPLA Genes
In order to analyze the evolutionary relationships of PLA genes from tomato, Arabidopsis, and maize, a comparative analysis was performed by TBtools (Figure 4a). Results indicated 37 orthologous pairs between tomato and Arabidopsis, and 14 pairs of PLA genes showed synteny with maize. Furthermore, we also imported the tomato genome data and the genome annotation file into the TBtools plugin One step MCScanX, which allowed us to obtain information on gene duplication of the tomato genome. Within the 80 SlPLA genes, a total of six duplicate gene pairs were identified (Figure 4b). There were two pairs (SlpPLA5/SlpPLA9, SlpPLA6/SlpPLA10) of tandem repeat genes in the pPLA group. The PLA1 group had four pairs of tandem repeat genes, containing SlPLA1-42/SlPLA1-34, SlPLA1-42/SlPLA1-3, SlPLA1-48/SlPLA1-56, SlPLA1-31/SlPLA1-48.
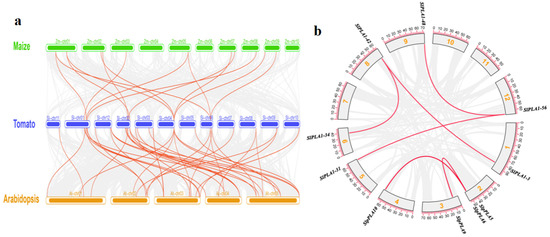
Figure 4.
Analysis of collinearity and homogeneity of SlPLA genes. (a) Collinearity analysis was performed on three species of PLA genes, including Arabidopsis, maize, and tomato. Red lines in the background indicate collinear regions in tomato and other plants, while gray line highlight collinear gene pairs between PLA members. (b) The duplication genes in the SlPLA gene family. The red line indicates all collinear genes in the genome, while the gray box symbolizes chromosomes, and the yellow numbers inside the gray box denote chromosome numbers.
3.5. Promoter Cis-Element Analysis of SlPLA Genes
To investigate the regulatory potential of SlPLA family members, we analyzed 2000 bp upstream promoter regions for cis-element composition using the PlantCARE database (Figure 5). The identified cis-elements were classified into three main categories: light response, hormone response, and abiotic stress response element. The findings indicated that, with the exception of SlpPLA8 and SlPLA1-22, light response elements and hormone response elements were present in the promoter regions of all SlPLA family members. Light response elements were the most abundant (including conserved DNA module involved in light responsiveness, part of a light-responsive module, cis-acting regulatory element involved in light responsiveness, part of a module for light response, and MYB binding site involved in light responsiveness). Additionally, 73 genes were found to contain abiotic stress-responsive elements (e.g., drought, low temperature, anaerobic, and defense elements). In addition, we found many hormone-specific cis-elements, including abscisic acid (ABA), methyl jasmonate (MeJA), gibberellin (GA), salicylic acid (SA), and auxin (IAA).
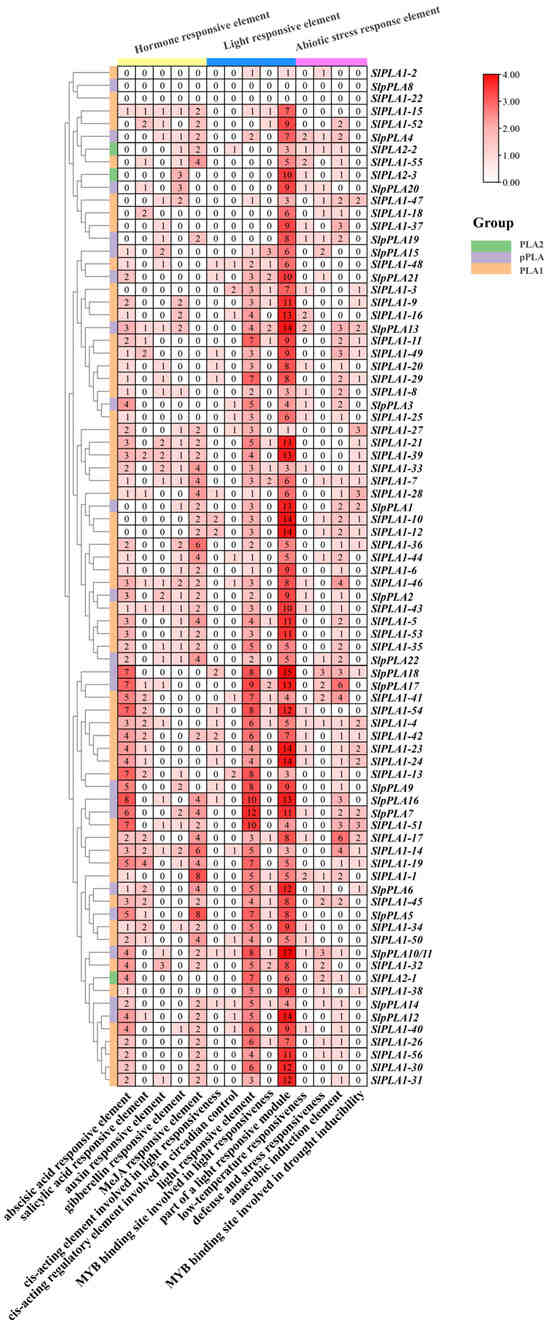
Figure 5.
Analysis of cis-acting elements in the promoter region of the SlPLA gene family. At the top of the heat map, various colors are used to distinguish the overall categories of cis-acting elements, such as ABA, MeJA, and IAA, all of which are classified as hormone-response elements. Each box contains the number of cis-acting elements. The intensity of the box’s color is directly proportional to the number of components it encompasses.
3.6. Expression Analysis of SlPLA Genes in Different Organs Based on RNA-Seq Data
We analyzed SlPLA gene expression profiles in various tomato organs of the Heinz and Micro-Tom cultivars (Figure 6). In Heinz, 28% of SlPLA genes were highly expressed in roots, 8% in leaves, 11% in flower buds, and 7% in fruits (Figure 6a). There were only two highly expressed genes (SlpPLA21 and SlpPLA8) in the opened flower, and both were classified within the pPLA group. In breaker fruit, only the SlPLA1-50 gene was highly expressed. Compared to Heinz, Micro-Tom had more SlPLA genes that were highly expressed in flowers (25%) (Figure 6b). In Micro-Tom, high expression of the SlPLA genes accounted for 12.5% in the root, 5% in the stem, 6% in flower bud, 6% in immature green fruit, and 6% in breaker fruit. We observed that during the developmental stage of Micro-Tom tomato fruit (immature green fruit, mature green fruit, and breaker fruit), the expression levels of two genes (SlPLA1-46 and SlPLA1-51) were significantly up-regulated, while the expression levels of five genes (SlPLA1-4, SlPLA1-5, SlPLA1-47, SlpPLA20, and SlPLA1-56) were significantly down-regulated. Furthermore, with the exception of SlpPLA20, all other genes were classified within the PLA1 group. When the expression profiles of the SlPLA genes between the two tomato genotypes were compared, SlPLA1-16 was highly expressed in leaves of both varieties, and five genes (SlPLA1-10, SlPLA1-11, SlPLA1-13, SlPLA1-26, and SlpPLA17) were highly expressed in their root.
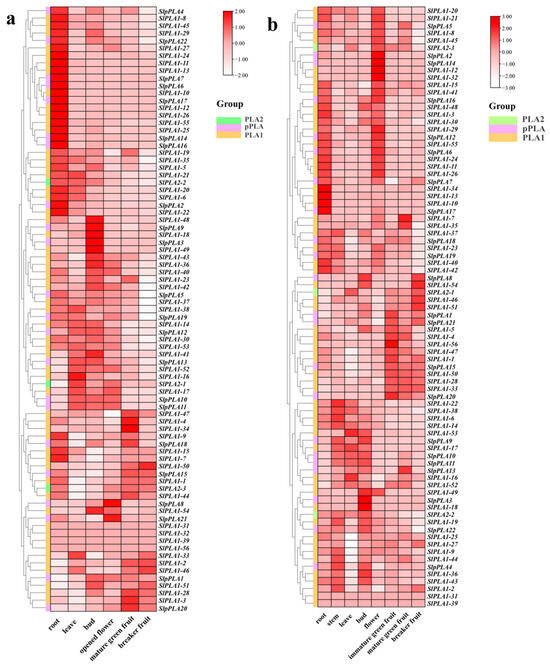
Figure 6.
RNA-seq analysis of SlPLA gene expression across various tomato tissues. (a) RNA seq data of PLAs in different tissues of Heinz tomato. (b) RNA seq data of PLAs in different tissues of Micro-Tom tomato. Heat maps were displayed using red, pink, and white colors to indicate high, medium, and low expression levels, respectively.
3.7. Expression Analysis of the SlPLA Genes in Different Organs Using qRT-PCR
We further examined the expression levels of SlPLA genes in six organs of tomato (Micro-Tom) by qRT-PCR method, including root, stem, leave, mature pollen, pistil, and fruit. Results revealed diverse expression patterns of all SlPLA genes across the different organs (Figure 7). SlPLA genes had similar gene structures and physicochemical properties across groups, but their expression varied in different organs. We found that SlPLA1-3, SlPLA1-6, SlPLA1-10, SlPLA1-11, SlPLA1-24, SlPLA1-39, SlPLA1-45, SlPLA1-55, SlpPLA15, SlpPLA16, SlpPLA17, SlpPLA18, SlpPLA19, and SlpPLA22 were highly expressed in root. There were eight SlPLA genes highly expressed in the leaves, namely SlPLA1-4, SlPLA1-5, SlpPLA1, SlPLA1-7, SlPLA1-17, SlPLA1-38, SlPLA1-48, and SlPLA1-52. Approximately 10% of SlPLA genes were highly expressed in fruit. Only four genes, e.g., SlPLA2-1, SlpPLA13, SlPLA1-35, and SlPLA1-53, were highly expressed in stems. In addition, approximately a quarter of the SlPLA genes were highly expressed in the pistil. It is worth noting that SlPLA1-2, SlPLA1-13, SlPLA1-18, and SlPLA1-43 were highly expressed in mature pollen, and all of these genes belonged to the PLA1 group.
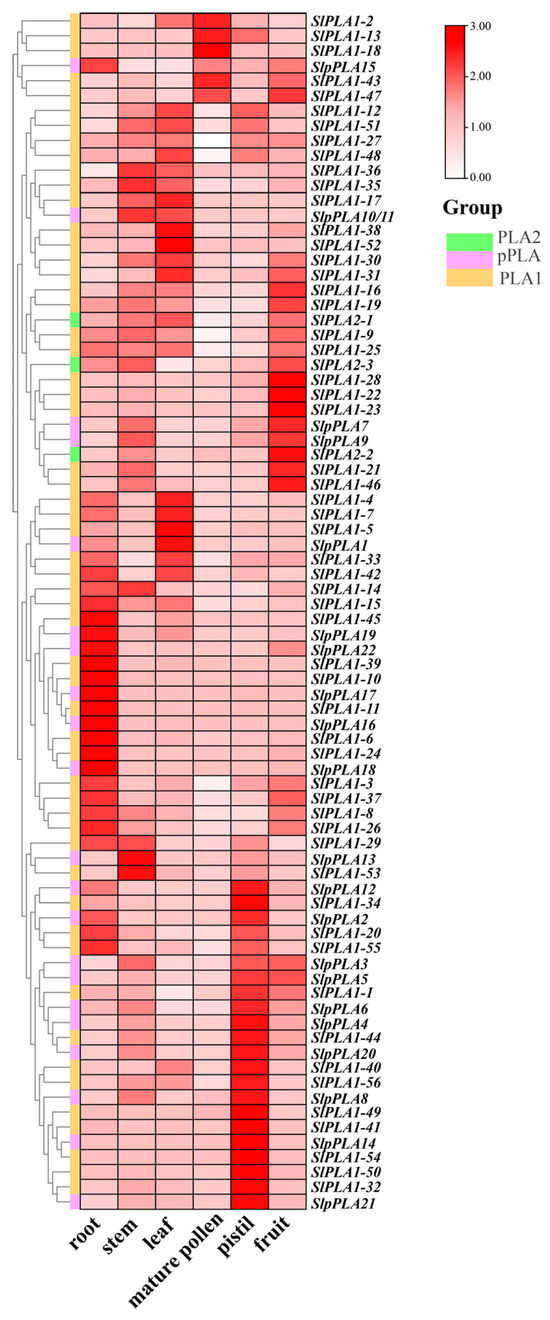
Figure 7.
qRT-PCR was employed to assess the relative expression levels of 80 genes within the SlPLA family across various tissues of the Micro-Tom. Heat maps were presented using a color scheme of red, pink, and white to represent high, medium, and low expression levels, respectively.
3.8. Expression Analysis of SlPLA Genes Under Cold Stress
To investigate the expression of SlPLA genes in response to cold stress, we analyzed tomato RNA-seq data under cold treatment, and the results showed that five genes (SlPLA1-2, SlPLA1-17, SlpPLA13, SlPLA1-42, and SlpPLA19) were up-regulated and three genes (SlPLA2-2, SlPLA1-46, and SlpPLA22) were down-regulated (Figure 8a). In addition, qRT-PCR analysis was performed on these differentially expressed genes (Figure 8b). Under chilling stress, the up-regulation of SlPLA1-2, SlpPLA13, SlPLA1-42, and SlpPLA19 gene expression levels were consistent with RNA-seq results. The down-regulation in the expression of the SlPLA1-46 gene aligns with the RNA-seq results, while the SlPLA2-2 and SlpPLA22 were significantly up-regulated, which is inconsistent with RNA-seq data. The relative expression of SlPLA1-17 showed no significant difference under cold treatment compared with normal temperature treatment, which was also inconsistent with RNA-seq data. This inconsistency may be attributed to variations in sampling times, methods of plant cultivation, and other related factors, which can lead to differing outcomes.
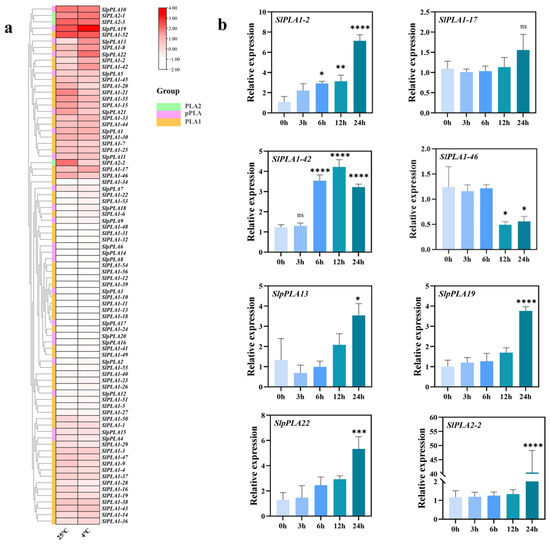
Figure 8.
Expression analysis of SlPLA genes under low-temperature stress. (a) Expression profile of SlPLA genes under low-temperature conditions. Heat maps were presented in red/pink/white colors that represent high/medium/low expression, respectively. (b) qRT-PCR analysis of representative SlPLA genes under low-temperature conditions (0 h, 3 h, 6 h, 12 h, and 24 h). We used 0 h as the control for cold stress treatment, with its relative expression set at 1. The “ns” indicates that the difference between the groups is not statistically significant. * p < 0.05, ** p < 0.01, *** p < 0.001, **** p < 0.0001.
3.9. SlPLA1-2 Positively Regulated Tomato Cold Tolerance
To further investigate the function of SlPLA1-2, a gene from the PLA1 group that is highly expressed in response to cold stress in tomato, we used gene silencing technology to reduce endogenous SlPLA1-2 expression. Silencing efficiency was verified to ensure successful suppression of SlPLA1-2 expression (Figure 9c). Under normal conditions (25 °C), TRV2-SlPLA1-2 plants displayed no noticeable phenotypic differences compared to TRV2 control plants. However, following cold treatment (4 °C), the SlPLA1-2-silenced plants exhibited more severe wilting symptoms and a significant reduction in the maximum photo quantum efficiency of PSII (Fv/Fm) compared to the control. Both relative electrolyte leakage and malondialdehyde (MDA) content were markedly higher in SlPLA1-2-silenced plants than in TRV2 plants (Figure 9b,d–f), indicating that SlPLA1-2 may play a positive role in enhancing tomato cold tolerance.
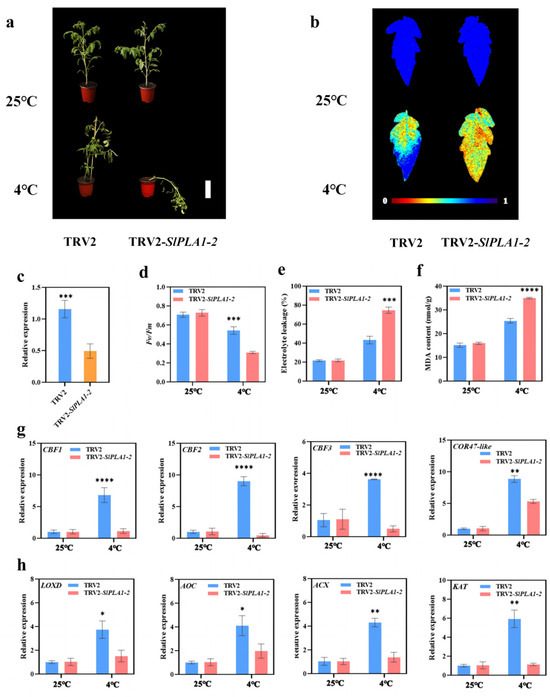
Figure 9.
Silencing SlPLA1-2 with VIGS heightened the tomato plants’ sensitivity to cold stress. (a) Phenotypes of TRV2 and TRV2-SlPLA1-2 tomato plant after exposure to 25 or 4 °C for 7 days. (b) Fv/Fm in TRV2 and TRV2-SlPLA1-2 tomato leaves after exposure to 25 or 4 °C for 7 days. The false color code depicted at the bottom of the image ranges from 0 (black) to 1.0 (purple), representing the level of damage in the leaves. (c) qRT-PCR analysis of the relative expression levels of SlPLA1-2 in the silenced plant (TRV2-SlPLA1-2) and control (TRV2) plant. (d) The Photosynthetic Capacity (Fv/Fm) in TRV2-SlPLA1-2 tomato leaves after exposure to 25 or 4 °C for 7 days. (e) The relative electrolyte leakage in TRV2, and TRV2-SlPLA1-2 tomato leaves after exposure to 25 or 4 °C for 7 days. (f) The MDA content in TRV2-SlPLA1-2 tomato leaves after exposure to 25 or 4 °C for 7 days. (g) Relative transcript levels of SlCBF1, SlCBF2, SlCBF3, and COR47-like in TRV2 and TRV2-SlPLA1-2 tomato plant after exposure to 25 or 4 °C. (h) Relative transcript levels of LOXD, AOC, ACX, and KAT in TRV2, and TRV2-SlPLA1-2 tomato plant after exposure to 25 or 4 °C. * p < 0.05, ** p < 0.01, *** p < 0.001, **** p < 0.0001.
To further explore the mechanisms by which SlPLA1-2 contributes to cold tolerance, we examined the expression levels of downstream genes essential to tomato’s cold response. CRT/DRE-binding factors (CBFs) and Cold-regulated (COR) genes, which are key players in cold response, were significantly induced in TRV2 plants under cold treatment compared to normal temperatures. However, in SlPLA1-2-silenced plants, CBF expression was significantly lower under cold stress compared to controls (Figure 9g). Previous studies have suggested that impaired PLA1 genes may disrupt JA biosynthesis, so we also assessed the expression of JA biosynthesis-related genes (LOXD, AOC, ACX, and KAT) under both normal and cold conditions. These genes were significantly induced in TRV2 plants under cold stress, but in TRV2-SlPLA1-2 plants, their expression levels were reduced relative to TRV2 under the same conditions (Figure 9h). This evidence suggests that SlPLA1-2 might improve cold tolerance in tomato by modulating the CBF signaling pathway and boosting JA biosynthesis.
4. Discussion
4.1. Bioinformatic Analysis of PLA Genes in Tomato: Structure, Features, and Evolutionary Relationships
Phospholipase A is a crucial enzyme that facilitates the hydrolysis of phospholipids, leading to the production of hydrolysates that play a vital role in the growth and development of plants. In recent years, researchers have elucidated the characteristics of PLA genes and further enhanced our understanding of plant responses to stresses, including Arabidopsis, maize, and cotton [36]. However, the PLA gene family has not been characterized in tomato, hindering the understanding of the functional role of SlPLA genes. This study fills that gap by providing the first comprehensive analysis of the PLA genes in tomato, identifying 80 SlPLA genes in significantly larger families than in maize (47 members) and Arabidopsis (57 members), which suggests species-specific expansion in tomato. Our phylogenetic analysis categorized PLA genes into three primary groups: pPLA, PLA1, and PLA2, consistent with earlier studies [13]. This analysis also revealed that tomato SlPLA genes share close evolutionary relationships with those in other dicots, indicating evolutionary conservation along with distinct expansions in tomato [37]. Gene duplication appears to be a major driver of this family’s expansion in tomato, with both tandem and segmental duplications contributing to gene amplification [38,39]. Tandem duplications, defined as adjacent genes from the same subfamily within a chromosome and separated by fewer than ten genes [40], were evident across seven clusters on chromosomes 2, 4, 5, 8, and 9. Additionally, we identified six segmentally duplicated gene pairs, supporting the role of duplication events in the expansion of the SlPLA gene family in tomato [41].
Functional predictions of conserved motifs suggest these sequences may act as recognition sites or encode functional protein regions, providing insight into family members’ structural and functional diversity [42]. Interestingly, we observed variation in gene architecture, with certain SlPLA genes lacking UTRs, a feature also reported in PLA genes in sorghum [43]. This variability in UTR presence may indicate functional diversification within the family. Promoter analysis identified three main types of cis-acting elements associated with light response, hormone response, and abiotic stress response. Light-responsive elements were the most numerous, suggesting a strong regulatory link between SlPLA gene expression and light conditions. Additionally, many SlPLA promoters contained stress-responsive cis-elements related to drought, low temperature, and anaerobic conditions, reflecting a stress-resilient expression pattern similar to what has been reported in soybean [44]. The prevalence of these cis-elements implies that SlPLA genes expression may be finely tuned by various environmental factors, such as light intensity, hormone levels, and stress exposure, making these genes potentially significant targets for enhancing stress resilience in tomato [12].
4.2. Expression Analysis Indicates PLA Genes’ Roles in Tomato Development and Stress Response
RNA-seq data revealed that SlPLA genes accounted for 28% of high expression levels in Heinz tomato root and 20% in Micro-Tom tomato flowers, suggesting notable differential expression between these varieties. Additionally, qRT-PCR results identified 14 SlPLA genes with high expression levels in roots, 4 in stems, 8 in leaves, 18 in pistil, and 9 in fruit, highlighting the gene family’s diverse roles in growth and development across tissues. In Micro-Tom, four genes (SlPLA2-1, SlpPLA13, SlPLA1-35, and SlPLA1-53) were specifically expressed in pollen, suggesting potential involvement in pollen development or fertilization. This is consistent with findings in maize, where ZmPLA1, a pollen-specific gene, contributes to haploid production when inactivated [45]. Therefore, these pollen-specific genes in tomato may similarly play roles in HI. In addition, the expression patterns also aligned with findings from cis-element analysis. For instance, SlpPLA4, which contains the highest number of photo-responsive elements, is homologous to the phototactic Arabidopsis gene AT1G61850 [46]. Meanwhile, SlpPLA18, showing strong phylogenetic similarity to Arabidopsis pPLAIIIδ (AT3G63200), was exclusively expressed in tomato roots. Arabidopsis pPLAIIIδ overexpression has been linked to reduced lignin and seed germination rates [11], suggesting that SlpPLA18 may similarly contribute to root development and germination in tomato.
We further analyzed SlPLA gene expression under cold stress using RNA-seq data and qRT-PCR. RNA-seq data indicated that four genes (SlPLA1-2, SlPLA1-17, SlpPLA13, SlPLA1-42, and SlpPLA19) were significantly up-regulated, while three (SlPLA2-2, SlPLA1-46, and SlpPLA22) were down-regulated. However, qRT-PCR validation showed that three genes (SlPLA1-17, SlPLA2-2, and SlpPLA22) displayed different expression trends compared to RNA-seq, likely due to differences in sampling time points. Cis-element analysis of eight differentially expressed genes under chilling stress revealed that, except for SlPLA1-2 and SlpPLA22, all contained low-temperature responsive elements. In addition, five of these genes (excluding SlPLA1-2, SlPLA2-2, and SlpPLA19) had ABA-responsive elements, and six had MeJA-responsive elements, except for SlpPLA13 and SlPLA1-2. Both ABA and JA are typical phytohormones that enhance plant cold tolerance by activating the classical ICE1-CBF-CORs pathway, as well as other physiological and biochemistry processes [47]. Thus, variations in the number of cis-acting elements may play a significant role in modulating SlPLA gene expression under cold stress conditions.
4.3. The SlPLA1-2 Positively Regulated Tomato Cold Tolerance Through CBF Pathway and JA Biosynthesis Pathway
We conducted a VIGS assay on SlPLA1-2 to explore the involvement of PLA genes in tomato cold tolerance. Following cold stress treatment, SlPLA1-2-silenced plants exhibited severe wilting phenotype, along with increased MDA content and electrolyte leakage, in contrast to TRV2 control plants. MDA, a byproduct of membrane lipid peroxidation, reflects the extent of stress-induced cell membrane damage, with higher levels indicating decreased stress tolerance [48]. Similarly, electrolyte leakage, which indicates membrane permeability, was significantly higher in the VIGS plants, suggesting substantial membrane damage in TRV2-SlPLA1-2 lines [49]. In this study, the MDA content and electrolyte leakage in VIGS lines were significantly higher than in the control group after cold treatment. These results indicated that TRV2-SlPLA1-2 suffered serious damage in the cell membrane. Damage to the cell membrane can impact numerous critical cellular processes, including carbon allocation, cell elongation, defense responses, seedling establishment, and overall plant growth. These processes were also associated with the release of membrane fatty acids and the storage of lipids within the plant system [3]. Lipid metabolism is critical for plant growth and defense against abiotic and biotic stress [50]. PLA enzymes are crucial in lipid metabolism as they break down phospholipids to produce free fatty acids and lysophosphatids, vital for maintaining membrane stability and responding to stress [51]. Thus, silencing SlPLA1-2 likely impairs lipids metabolism, leading to reduced tolerance to cold stress.
Based on these findings, we propose that SlPLA1-2 acts as a positive regulator of tomato cold tolerance [13]. The ICE1-CBF-COR pathway is a well-established signaling cascade involved in cold stress response [52]. Under cold stress conditions, plants with silenced SlPLA1-2 exhibited significantly reduced expression of SlCBFs and SlCOR47-like genes compared to control, indicating that SlPLA1-2 may enhance cold tolerance by modulating the CBF-COR pathway [53]. Additionally, the AT1G02660 gene (PLIP2), homologous to SlPLA1-2, has been implicated in JA biosynthesis [54]. In SlPLA1-2-silenced plants, expression of JA biosynthesis genes (LOXD, AOC, ACX, and KAT) was significantly reduced under cold stress, suggesting that SlPLA1-2 may positively regulate these genes to enhance JA synthesis, which in turn contributes to cold resistance. These results indicate that SlPLA1-2 may enhance tomato cold tolerance by positively regulating the CBF signaling pathway and JA biosynthesis, positioning SlPLA genes as beneficial modulators of stress resilience in tomato. Nevertheless, the limitations of this study are primarily attributed to the insufficient availability of gene editing materials. Future research endeavors will aim to address and overcome these constraints.
Furthermore, under conditions of cold stress, analyses of RNA-seq and qRT-PCR data revealed the presence of four consistently expressed genes (SlPLA1-42, SlPLA1-46, SlpPLA19, and SlpPLA22), with the exception of SlPLA1-2. These genes may also exert regulatory influences in response to cold stress. Among these, the protein sequence of SlPLA1-46 in the PLA1 group exhibits similarity to that of the AT4G13550, as demonstrated by evolutionary tree analysis. Previous studies have identified the AT4G13550 gene as playing a significant role in lipid remodeling in response to abiotic stress [55]. And the AT4G16820 gene, which encodes a protein sequence analogous to SlPLA1-42, has been identified as encoding an enzyme involved in the biosynthesis of JA [56]. In the pPLA group, the gene AT2G39220, which exhibits similarity to the SlpPLA19 and SlpPLA22 genes, has been identified as a participant in the biosynthetic pathway of JA [54]. Subsequent investigations will provide additional validation regarding the roles of genes that exhibit sensitivity to cold stress.
5. Conclusions
This study identified and characterized 80 SlPLA genes, offering the first comprehensive analysis of their structural features, evolutionary relationships, and functional roles. Phylogenetic analysis grouped SlPLA genes into pPLA, PLA1, and PLA2 across 12 chromosomes, with cis-elements linked to light, hormone, and stress responses. The expression profile and VIGS experiment demonstrated that SlPLA1-2 enhances cold tolerance in tomato by activating the CBF signaling pathway and JA biosynthesis. These findings lay the groundwork for further investigation into the molecular mechanisms underlying tomato resistance to abiotic stress within the PLA family, as well as for future functional studies and potential crop improvement strategies targeting the SlPLA gene family.
Supplementary Materials
The following supporting information can be downloaded at https://www.mdpi.com/article/10.3390/genes16020130/s1. Table S1. The primers used in real-time PCR (qRT-PCR) analysis in this study. Table S2. The SlPLA members identified in tomato genome.
Author Contributions
The authors confirm contributions to the paper as follows: study conception and design: C.L. (Chenxu Liu). and S.G.; draft manuscript: Z.L. and Z.Y.; methodology and data analysis: H.W. and M.R.; visualization: R.W. and Q.Y.; investigation and analysis: Y.C. and G.Z.; manuscript revision: C.L. (Chaochao Liu). All authors have read and agreed to the published version of the manuscript.
Funding
This work was supported by the National Natural Science Foundation of China (32341044), Zhejiang Provincial major Agricultural Science and Technology Projects of New Varieties Breeding (2016C02051), and the National Key Research and Development Program of China (2023YFD1201504).
Institutional Review Board Statement
Not applicable.
Informed Consent Statement
Not applicable.
Data Availability Statement
The original contributions presented in this study are included in the article/Supplementary Material. Further inquiries can be directed to the corresponding authors.
Conflicts of Interest
The authors declare that they have no known competing financial interests or personal relationships that could have appeared to influence the work reported in this paper.
References
- Suetsugu, S.; Kurisu, S.; Takenawa, T. Dynamic shaping of cellular membranes by phospholipids and membrane-deforming proteins. Physiol. Rev. 2014, 94, 1219–1248. [Google Scholar] [CrossRef] [PubMed]
- Balboa, M.A.; Balsinde, J. Phospholipases: From structure to biological function. Biomolecules 2021, 11, 428. [Google Scholar] [CrossRef] [PubMed]
- Ali, U.; Lu, S.; Fadlalla, T.; Iqbal, S.; Yue, H.; Yang, B.; Hong, Y.; Wang, X.; Guo, L. The functions of phospholipases and their hydrolysis products in plant growth, development and stress responses. Prog. Lipid Res. 2022, 86, 101158. [Google Scholar] [CrossRef] [PubMed]
- Liang, G.; Wang, X. Crosstalk between phospholipase D and sphingosine kinase in plant stress signaling. Front. Plant Sci. 2012, 3, 00051. [Google Scholar] [CrossRef]
- Scherer, G.F.E.; Ryu, S.B.; Wang, X.; Matos, A.R.; Heitz, T. Patatin-related phospholipase A: Nomenclature, subfamilies and functions in plants. Trends Plant Sci. 2010, 15, 693–700. [Google Scholar] [CrossRef]
- Li, M.; Wei, F.; Tawfall, A.; Tang, M.; Saettele, A.; Wang, X. Overexpression of patatin-related phospholipase AIIIδ altered plant growth and increased seed oil content in camelina. Plant Biotechnol. J. 2015, 13, 766–778. [Google Scholar] [CrossRef]
- Ryu, S.B. Phospholipid-derived signaling mediated by phospholipase A in plants. Trends Plant Sci. 2004, 9, 229–235. [Google Scholar] [CrossRef]
- Lee, H.Y.; Bahn, S.C.; Kang, Y.-M.; Lee, K.H.; Kim, H.J.; Noh, E.K.; Palta, J.P.; Shin, J.S.; Ryu, S.B. Secretory low molecular weight phospholipase A2 plays important roles in cell elongation and shoot gravitropism in Arabidopsis. Plant Cell 2003, 15, 1990–2002. [Google Scholar] [CrossRef]
- Mariani, M.E.; Fidelio, G.D. Secretory Phospholipases A2 in Plants. Front. Plant Sci. 2019, 10, 00861. [Google Scholar] [CrossRef]
- Li, M.; Bahn, S.C.; Guo, L.; Musgrave, W.; Berg, H.; Welti, R.; Wang, X. Patatin-related phospholipase pPLAIIIβ-Induced changes in lipid metabolism alter cellulose content and cell elongation in Arabidopsis. Plant Cell 2011, 23, 1107–1123. [Google Scholar] [CrossRef]
- Simiyu, D.C.; Jang, J.H.; Lee, O.R. A group III patatin-like phospholipase gene pPLAIIIδ regulates lignin biosynthesis and influences the rate of seed germination in Arabidopsis thaliana. Front. Plant Sci. 2023, 14, 12979. [Google Scholar] [CrossRef] [PubMed]
- Wang, M.; Tian, D.; Li, T.; Pan, J.; Wang, C.; Wu, L.; Luo, K.; Mei, Z.; Liu, J.; Chen, W.; et al. Comprehensive identification and functional characterization of GhpPLA gene family in reproductive organ development. BMC Plant Biol. 2023, 23, 599. [Google Scholar] [CrossRef]
- Zhang, H.; Zhang, Y.; Xu, N.; Rui, C.; Fan, Y.; Wang, J.; Han, M.; Wang, Q.; Sun, L.; Chen, X.; et al. Genome-wide expression analysis of phospholipase A1 (PLA1) gene family suggests phospholipase A1-32 gene responding to abiotic stresses in cotton. Int. J. Biol. Macromol. 2021, 192, 1058–1074. [Google Scholar] [CrossRef] [PubMed]
- Li, J.; Li, M.; Yao, S.; Cai, G.; Wang, X. Patatin-Related phospholipase pPLAIIIγ involved in osmotic and salt tolerance in Arabidopsis. Plants 2020, 9, 650. [Google Scholar] [CrossRef] [PubMed]
- Yang, W.; Devaiah, S.P.; Pan, X.; Isaac, G.; Welti, R.; Wang, X. AtPLAI is an acyl hydrolase involved in basal jasmonic acid production and Arabidopsis resistance to botrytis cinerea. J. Biol. Chem. 2007, 282, 18116–18128. [Google Scholar] [CrossRef]
- Gilles, L.M.; Calhau, A.R.M.; La Padula, V.; Jacquier, N.M.A.; Lionnet, C.; Martinant, J.-P.; Rogowsky, P.M.; Widiez, T. Lipid anchoring and electrostatic interactions target NOT-LIKE-DAD to pollen endo-plasma membrane. J. Cell Biol. 2021, 220, e202010077. [Google Scholar] [CrossRef]
- Gilles, L.M.; Khaled, A.; Laffaire, J.B.; Chaignon, S.; Gendrot, G.; Laplaige, J.; Bergès, H.; Beydon, G.; Bayle, V.; Barret, P.; et al. Loss of pollen-specific phospholipase NOT LIKE DAD triggers gynogenesis in maize. EMBO J. 2017, 36, 707–717. [Google Scholar] [CrossRef]
- Liu, C.; Zhong, Y.; Qi, X.; Chen, M.; Liu, Z.; Chen, C.; Tian, X.; Li, J.; Jiao, Y.; Wang, D.; et al. Extension of the in vivo haploid induction system from diploid maize to hexaploid wheat. Plant Biotechnol. J. 2020, 18, 316–318. [Google Scholar] [CrossRef]
- Marin-Montes, I.M.; Rodríguez-Pérez, J.E.; Robledo-Paz, A.; de la Cruz-Torres, E.; Peña-Lomelí, A.; Sahagún-Castellanos, J. Haploid induction in tomato (Solanum lycopersicum L.) via gynogenesis. Plants 2022, 11, 1595. [Google Scholar] [CrossRef]
- Mistry, J.; Chuguransky, S.; Williams, L.; Qureshi, M.; Salazar, G.; Sonnhammer, E.L.L.; Tosatto, S.C.E.; Paladin, L.; Raj, S.; Richardson, L.J.; et al. Pfam: The protein families database in 2021. Nucleic Acids Res. 2021, 49, D412–D419. [Google Scholar] [CrossRef]
- Onodera, W.; Hara, N.; Aoki, S.; Asahi, T.; Sawamura, N. Phylogenetic tree reconstruction via graph cut presented using a quantum-inspired computer. Mol. Phylogenetics Evol. 2023, 178, 107636. [Google Scholar] [CrossRef] [PubMed]
- Kumar, S.; Stecher, G.; Li, M.; Knyaz, C.; Tamura, K. MEGA X: Molecular evolutionary genetics analysis across computing platforms. Mol. Biol. Evol. 2018, 35, 1547–1549. [Google Scholar] [CrossRef]
- Bjellqvist, B.; Basse, B.; Olsen, E.; Celis, J.E. Reference points for comparisons of two-dimensional maps of proteins from different human cell types defined in a pH scale where isoelectric points correlate with polypeptide compositions. Electrophoresis 1994, 15, 529–539. [Google Scholar] [CrossRef]
- Artimo, P.; Jonnalagedda, M.; Arnold, K.; Baratin, D.; Csardi, G.; de Castro, E.; Duvaud, S.; Flegel, V.; Fortier, A.; Gasteiger, E.; et al. ExPASy: SIB bioinformatics resource portal. Nucleic Acids Res. 2012, 40, W597–W603. [Google Scholar] [CrossRef]
- Chen, C.; Chen, H.; Zhang, Y.; Thomas, H.R.; Frank, M.H.; He, Y.; Xia, R. TBtools: An integrative toolkit developed for interactive analyses of big biological data. Mol. Plant 2020, 13, 1194–1202. [Google Scholar] [CrossRef] [PubMed]
- Wang, Y.; Tang, H.; DeBarry, J.D.; Tan, X.; Li, J.; Wang, X.; Lee, T.-h.; Jin, H.; Marler, B.; Guo, H.; et al. MCScanX: A toolkit for detection and evolutionary analysis of gene synteny and collinearity. Nucleic Acids Res. 2012, 40, e49. [Google Scholar] [CrossRef] [PubMed]
- Qu, Y.; Dudhate, A.; Shinde, H.S.; Takano, T.; Tsugama, D. Phylogenetic trees, conserved motifs and predicted subcellular localization for transcription factor families in pearl millet. BMC Res. Notes 2023, 16, 38. [Google Scholar] [CrossRef]
- Lescot, M.; Déhais, P.; Thijs, G.; Marchal, K.; Moreau, Y.; Van de Peer, Y.; Rouzé, P.; Rombauts, S. PlantCARE, a database of plant cis-acting regulatory elements and a portal to tools for in silico analysis of promoter sequences. Nucleic Acids Res. 2002, 30, 325–327. [Google Scholar] [CrossRef]
- Wang, W.; Quan, C.; Zheng, S.; Wang, Y.W.; Mo, Y.; Ma, C.; Xu, Z.; Li, L.; Huang, Z.; Jia, X.; et al. OsPM1 is a positive regulator of rice tolerance to drought stress but a negative regulator of rice tolerance to salt stress. J. Plant Interact. 2021, 16, 213–221. [Google Scholar] [CrossRef]
- Wang, X.; Lu, X.; Malik, W.A.; Chen, X.; Wang, J.; Wang, D.; Wang, S.; Chen, C.; Guo, L.; Ye, W. Differentially expressed bZIP transcription factors confer multi-tolerances in Gossypium hirsutum L. Int. J. Biol. Macromol. 2020, 146, 569–578. [Google Scholar] [CrossRef]
- Li, Y.; Chen, Y.; Zhou, L.; You, S.; Deng, H.; Chen, Y.; Alseekh, S.; Yuan, Y.; Fu, R.; Zhang, Z.; et al. MicroTom metabolic network: Rewiring tomato metabolic regulatory network throughout the growth cycle. Mol. Plant 2020, 13, 1203–1218. [Google Scholar] [CrossRef]
- Fang, P.; Yan, M.; Chi, C.; Wang, M.; Zhou, Y.; Zhou, J.; Shi, K.; Xia, X.; Foyer, C.H.; Yu, J. Brassinosteroids act as a positive regulator of photoprotection in response to chilling stress. Plant Physiol. 2019, 180, 2061–2076. [Google Scholar] [CrossRef] [PubMed]
- Mo, F.; Zhang, N.; Qiu, Y.; Meng, L.; Cheng, M.; Liu, J.; Yao, L.; Lv, R.; Liu, Y.; Zhang, Y.; et al. Molecular characterization, gene evolution and expression analysis of the F-Box gene family in tomato (Solanum lycopersicum). Genes 2021, 12, 417. [Google Scholar] [CrossRef] [PubMed]
- Liu, P.; Gu, J.; Cui, X.; Fu, H.; Wang, F.; Qi, M.; Sun, Z.; Li, T.; Liu, Y. Genome-wide investigation of the phospholipase C gene family in Solanum lycopersicum and abiotic stress analysis. Environ. Exp. Bot. 2023, 210, 105336. [Google Scholar] [CrossRef]
- Stephan, W. Tandem-repetitive noncoding DNA: Forms and forces. Mol. Biol. Evol. 1989, 6, 198–212. [Google Scholar] [CrossRef]
- Zhou, Q.; Jayawardhane, K.N.; Strelkov, S.E.; Hwang, S.F.; Chen, G. Identification of Arabidopsis phospholipase A mutants with increased susceptibility to plasmodiophora brassicae. Front. Plant Sci. 2022, 13, 799142. [Google Scholar] [CrossRef]
- Wang, W.; Cheng, Y.; Ruan, M.; Ye, Q.; Yao, Z.; Wang, R.; Zhou, G.; Liu, D.; Wan, H. Comprehensive identification of glutathione peroxidase (GPX) gene family in response to abiotic stress in pepper (Capsicum annuum L.). Gene 2023, 881, 147625. [Google Scholar] [CrossRef]
- Kondrashov, F.A. Gene duplication as a mechanism of genomic adaptation to a changing environment. Proc. R. Soc. B Biol. Sci. 2012, 279, 5048–5057. [Google Scholar] [CrossRef]
- Panchy, N.; Lehti-Shiu, M.; Shiu, S.-H. Evolution of gene duplication in plants. Plant Physiol. 2016, 171, 2294–2316. [Google Scholar] [CrossRef]
- Wei, K.; Wang, Y.; Xie, D. Identification and expression profile analysis of the protein kinase gene superfamily in maize development. Mol. Breed. 2014, 33, 155–172. [Google Scholar] [CrossRef]
- Wei, Y.; Chong, Z.; Lu, C.; Li, K.; Liang, C.; Meng, Z.; Wang, Y.; Guo, S.; He, L.; Zhang, R. Genome-wide identification and expression analysis of the cotton patatin-related phospholipase A genes and response to stress tolerance. Planta 2023, 257, 49. [Google Scholar] [CrossRef] [PubMed]
- Wang, W.; Liang, L.; Dai, Z.; Zuo, P.; Yu, S.; Lu, Y.; Ding, D.; Chen, H.; Shan, H.; Jin, Y.; et al. A conserved N-terminal motif of CUL3 contributes to assembly and E3 ligase activity of CRL3KLHL22. Nat. Commun. 2024, 15, 3789. [Google Scholar] [CrossRef]
- Sapara, V.J.; Shankhapal, A.R.; Reddy, P.S. Genome-wide screening and characterization of phospholipase A (PLA)-like genes in sorghum (Sorghum bicolor L.). Planta 2024, 260, 35. [Google Scholar] [CrossRef] [PubMed]
- Ferreira, D.; Figueiredo, J.; Laureano, G.; Machado, A.; Arrabaça, J.D.; Duarte, B.; Figueiredo, A.; Matos, A.R. Membrane remodelling and triacylglycerol accumulation in drought stress resistance: The case study of soybean phospholipases A. Plant Physiol. Biochem. 2021, 169, 9–21. [Google Scholar] [CrossRef] [PubMed]
- Liu, C.; Li, X.; Meng, D.; Zhong, Y.; Chen, C.; Dong, X.; Xu, X.; Chen, B.; Li, W.; Li, L.; et al. A 4-bp insertion at ZmPLA1 encoding a putative phospholipase A generates haploid induction in maize. Mol. Plant 2017, 10, 520–522. [Google Scholar] [CrossRef]
- Effendi, Y.; Radatz, K.; Labusch, C.; Rietz, S.; Wimalasekera, R.; Helizon, H.; Zeidler, M.; Scherer, G.F.E. Mutants of phospholipase A (pPLA-I) have a red light and auxin phenotype. Plant Cell Environ. 2014, 37, 1626–1640. [Google Scholar] [CrossRef]
- Sah, S.K.; Reddy, K.R.; Li, J. Abscisic acid and abiotic stress tolerance in crop plants. Front. Plant Sci. 2016, 7, 00571. [Google Scholar] [CrossRef]
- Kong, W.; Liu, F.; Zhang, C.; Zhang, J.; Feng, H. Non-destructive determination of Malondialdehyde (MDA) distribution in oilseed rape leaves by laboratory scale NIR hyperspectral imaging. Sci. Rep. 2016, 6, 35393. [Google Scholar] [CrossRef]
- Wang, X.; Ding, Y.; Li, Z.; Shi, Y.; Wang, J.; Hua, J.; Gong, Z.; Zhou, J.-M.; Yang, S. PUB25 and PUB26 promote plant freezing tolerance by degrading the cold signaling negative regulator MYB15. Dev. Cell 2019, 51, 222–235.e225. [Google Scholar] [CrossRef]
- Liu, X.; Ma, D.; Zhang, Z.; Wang, S.; Du, S.; Deng, X.; Yin, L. Plant lipid remodeling in response to abiotic stresses. Environ. Exp. Bot. 2019, 165, 174–184. [Google Scholar] [CrossRef]
- Iqbal, S.; Ali, U.; Fadlalla, T.; Li, Q.; Liu, H.; Lu, S.; Guo, L. Genome wide characterization of phospholipase A & C families and pattern of lysolipids and diacylglycerol changes under abiotic stresses in Brassica napus L. Plant Physiol. Biochem. 2020, 147, 101–112. [Google Scholar] [CrossRef] [PubMed]
- Xu, J.; Liu, S.; Hong, J.; Lin, R.; Xia, X.; Yu, J.; Zhou, Y. SlBTB19 interacts with SlWRKY2 to suppress cold tolerance in tomato via the CBF pathway. Plant J. 2024, 120, 1112–1124. [Google Scholar] [CrossRef] [PubMed]
- Zhang, P.; Qian, D.; Luo, C.; Niu, Y.; Li, T.; Li, C.; Xiang, Y.; Wang, X.; Niu, Y. Arabidopsis ADF5 Acts as a Downstream Target Gene of CBFs in Response to Low-Temperature Stress. Front. Cell Dev. Biol. 2021, 9, 635533. [Google Scholar] [CrossRef] [PubMed]
- Wang, K.; Guo, Q.; Froehlich, J.E.; Hersh, H.L.; Zienkiewicz, A.; Howe, G.A.; Benning, C. Two abscisic acid-responsive plastid lipase genes involved in jasmonic acid biosynthesis in Arabidopsis thaliana. Plant Cell 2018, 30, 1006–1022. [Google Scholar] [CrossRef] [PubMed]
- Higashi, Y.; Okazaki, Y.; Takano, K.; Myouga, F.; Shinozaki, K.; Knoch, E.; Fukushima, A.; Saito, K. HEAT INDUCIBLE LIPASE1 remodels chloroplastic monogalactosyldiacylglycerol by liberating α-Linolenic acid in Arabidopsis leaves under heat stress. Plant Cell 2018, 30, 1887–1905. [Google Scholar] [CrossRef]
- Ruduś, I.; Terai, H.; Shimizu, T.; Kojima, H.; Hattori, K.; Nishimori, Y.; Tsukagoshi, H.; Kamiya, Y.; Seo, M.; Nakamura, K.; et al. Wound-induced expression of DEFECTIVE IN ANTHER DEHISCENCE1 and DAD1-like lipase genes is mediated by both CORONATINE INSENSITIVE1-dependent and independent pathways in Arabidopsis thaliana. Plant Cell Rep. 2014, 33, 849–860. [Google Scholar] [CrossRef]
Disclaimer/Publisher’s Note: The statements, opinions and data contained in all publications are solely those of the individual author(s) and contributor(s) and not of MDPI and/or the editor(s). MDPI and/or the editor(s) disclaim responsibility for any injury to people or property resulting from any ideas, methods, instructions or products referred to in the content. |
© 2025 by the authors. Licensee MDPI, Basel, Switzerland. This article is an open access article distributed under the terms and conditions of the Creative Commons Attribution (CC BY) license (https://creativecommons.org/licenses/by/4.0/).