Abstract
Background/Objectives: In order to determine the basic structural characteristics of the mitochondrial genome of Cyphochilus crataceus and explore its phylogenetic status, as well as to understand the codon usage bias of Melolonthinae species, the next-generation sequencing was used to obtain the mitochondrial genome sequence of C. crataceus. Methods: Combined with 121 sequences of Scarabaeidae downloaded from GeneBank, a phylogenetic tree of the family was constructed using PhyloSuite v 1.2.3 software. Additionally, the codon composition and codon usage bias of the mitochondrial protein-coding genes of C. crataceus and 16 other Melolonthinae species were analyzed. Results: The results showed that the mitochondrial genome sequence of C. crataceus was 17,946 bp in length, with an A + T content of 71.82%, exhibiting a significant AT bias and a preference for ending with the base A/U, showed typical features of Scarabaeidae mitogenomes. The analysis of RSCU, ENC-plot, and neutrality plot revealed that factors such as nucleotide composition, gene mutations, and natural selection can have an impact on codon usage bias, but the intensity varies. For C. crataceus, codon usage preference is primarily influenced by gene mutations. The phylogenetic tree results indicated that, apart from Melolonthinae, all other subfamilies within Scarabaeidae were monophyletic. Conclusions: This study not only enriches the mitochondrial genome information of scarab beetles in the subfamily Melolonthinae but also provides important foundational information for molecular systematics, population genetics, and molecular ecology research in the family Scarabaeidae.
1. Introduction
C. crataceus (Niijima & Kinoshita, 1923) [1], belongs to Melolonthinae, Scarabaeidae, and Coleoptera. Scarabaeidae is a large group of insects within Coleoptera. Based on their feeding habits, beetles can be divided into two branches: coprophagous and phytophagous (including saprophagous). C. crataceus is a phytophagous beetle reported to damage the leaves and roots of oil tea plants. It is mainly distributed in the mid to low-altitude mountainous regions south of China and bears a striking resemblance to Cyphochilus taipeiensis. Research on C. crataceus has mainly focused on synthesizing high-performance materials by mimicking the iridescent scales of the beetle, while its distribution and harmful effects remain unclear. Since Erichson [2], phytophagous beetles have been named Pleurosticti and are considered an independent branch, receiving affirmation from morphological studies, including Melolonthinae, Cetoniinae, Dynastinae, and Rutelinae as the four subfamilies [3,4]. However, the taxonomy and phylogeny of Melolonthinae are still controversial. Based on morphological characteristics, multi-gene sequences, and mitochondrial genome analysis, Melolonthinae is supported as a monophyletic group [5,6,7]. Nevertheless, some authors have proposed merging Melolonthinae, Rutelinae, and Dynastinae into the family Melolonthidae [8,9]. There is also debate on whether Sericinae should be considered as a tribe within Melolonthinae [5,6,10]. Clarifying the status of subgroups within the family Melolonthinae may help understand their evolution and aid in future classification work; thus, it is necessary to integrate existing data for a more comprehensive reconstruction of the phylogenetic tree of Scarabaeidae.
Mitogenome is a useful tool for resolving phylogenetic issues at different taxonomic levels in animals and plants [11,12]. The complete mitochondrial genome of Melolonthinae is relatively conservative, with most showing no rearrangements or deletions, including 13 protein-coding genes (PCGs), 22 transfer RNA genes (tRNAs), 2 ribosomal RNA genes (rRNAs), and 1 control region. Next-generation sequencing (NGS) technologies have been widely used to reconstruct mitochondrial genomes of various insects, including Scarabaeidae [7,13,14,15]. Organisms with close relationships tend to exhibit similar codon usage patterns, and codon usage bias analysis can reveal the origin of species or genes, mutation patterns, and phylogenetic relationships among organisms [16]. Genome composition is one of the factors influencing codon usage bias [17]. In this study, we assembled the mitochondrial genome of C. crataceus using NGS technology. After assembly and annotation, we analyzed the structure and gene arrangement, composition, codon usage bias, and influencing factors of the mitochondrial genome of C. crataceus, as well as the structure of transfer RNA (tRNA). By combining published data on Scarabaeidae mitochondrial genomes, we reexamined the phylogenetic relationships of Scarabaeidae, with a particular focus on the monophyly of Melolonthinae and the phylogenetic position of Sericinae. Through the analysis of mitochondrial genome composition, codon usage bias, and influencing factors, we aim to delve deeper into elucidating the phylogenetic position of C. crataceus and clarifying the taxonomic status of Melolonthinae.
2. Materials and Methods
2.1. Sample Collection and Mitogenome Sequencing, Assembly, and Annotation
A small leg muscle tissue sample was extracted from C. crataceus collected from the Yinggeling National Nature Reserve, Hainan Province, China (18°49′40.49″ N, 109°31′49.89″ E). The remaining sample was stored in 75% alcohol and kept refrigerated in a −20 °C freezer at the College of Tea Science of Guizhou University. Genomic DNA was extracted using the standardized CTAB method [18] and then subjected to next-generation sequencing by Shanghai Personal Biotechnology Co., Ltd. (Shanghai, China) using an Illumina NovaSeq sequencing platform (Illumina NovaSeq, Illumina Inc., San Diego, CA, USA) with 300 bp paired ends. The final mitochondrial sequence was corrected using pilon v.1.18 software [19], assembled using A5-miseq version 2.0 [20], annotated using Geneious Prime 2020.2.4 [21], and deposited into GenBank under the accession number OP963801.1 The CGview Server http://stothard.afns.ualberta.ca/cgview_server/index.html (accessed on 25 September 2017)was utilized to generate the circular map of the mitochondrial genome [22].
2.2. Composition, Structure, and Codon Usage Bias Analysis of Mitochondrial Genomes
The MITOS web server http://mitos2.bioinf.uni-leipzig.de/index.py (accessed on 25 September 2017) [23] and tRNAscan-SE v1.3.1 [24] were utilized for predicting the secondary structures of tRNAs. Base compositions, codon usage, and relative synonymous codon usage (RSCU) were analyzed using MEGA v.7.0 [25] and graphically represented using ggplot2 packaging in R. The strand asymmetry was calculated using the formulas: AT-skew = (A − T)/(A + T) and GC-skew = (G − C)/(G + C) [26]. Factors influencing codon usage bias were analyzed using ENC-plot and neutrality plot analysis. The formula for calculating the expected ENc value is: ENC = 2 + GC3s + 29/[GC3s2 + (1 − GC3s)2]. A lower ENC value indicates a stronger influence of GC3s on codon usage bias, while a higher ENC value suggests a stronger impact of natural selection on gene evolution [27]. The neutrality plot plots GC12 (average of GC1 and GC2) against GC3, and the correlation between GC3 and GC12 reflects the influence of base mutations on codon usage bias. A stronger correlation indicates a greater impact of base mutations, while a weaker correlation suggests a higher influence of selection pressure. The analysis was performed using MEGA v.7.0 [25] to calculate the GC1, GC2, and GC3 values for each codon.
2.3. The Phylogenetic Tree of Scarabaeidae
To construct the phylogenetic tree of Scarabaeidae, 122 complete mitochondrial genome sequences of Scarabaeidae were downloaded from the NCBI database. The sequence of C. crataceus obtained in this study was also included, with the insect Hydrochus carinatus from the family Hydrochidae used as an outgroup. Detailed information on the data is provided in Supplementary Table S1. The phylogenetic tree was constructed using the PhyloSuite v 1.2.3 software (downloaded from https://github.com/dongzhang0725/PhyloSuite/releases) [28,29]. Initially, the 13 protein-coding genes (PCGs) sequences were extracted and aligned using the MAFFT program (version 7.313) [30] included in PhyloSuite software. The alignment results were concatenated into a combined sequence dataset. PartitionFinder2 [31] was then used to precisely calculate the partitioning strategy and corresponding evolutionary models. The branch lengths were set to converge, and the Bayesian model and Akaike information criterion (AICc) were used to select the optimal solution using a greedy search strategy. The phylogenetic tree was constructed using both Bayesian inference (BI) and Maximum Likelihood (ML) methods. In the BI analysis, the Bayesian inference method was used to construct the phylogenetic tree with two parallel runs and four chains. After running for 1,000,000 generations, the average standard deviation of split frequencies (ASDOSFs) values was 0.005 (<0.01). Sampling was performed every 1000 generations, and 25% of the initial samples were discarded as burn-in [32]. Posterior probability (PP) values were calculated for each node. The ML tree was generated in IQ-tree [33] mode using the PhyloSuite program. Ultrafast bootstrapping with 10,000 replicates was performed using the Edge-linked partition style [34,35] to calculate bootstrap (BS) values for each node. The final phylogenetic trees were visualized and refined in Adobe Illustrator CS5.
3. Results
3.1. Analysis of Mitochondrial Genome Composition and Features
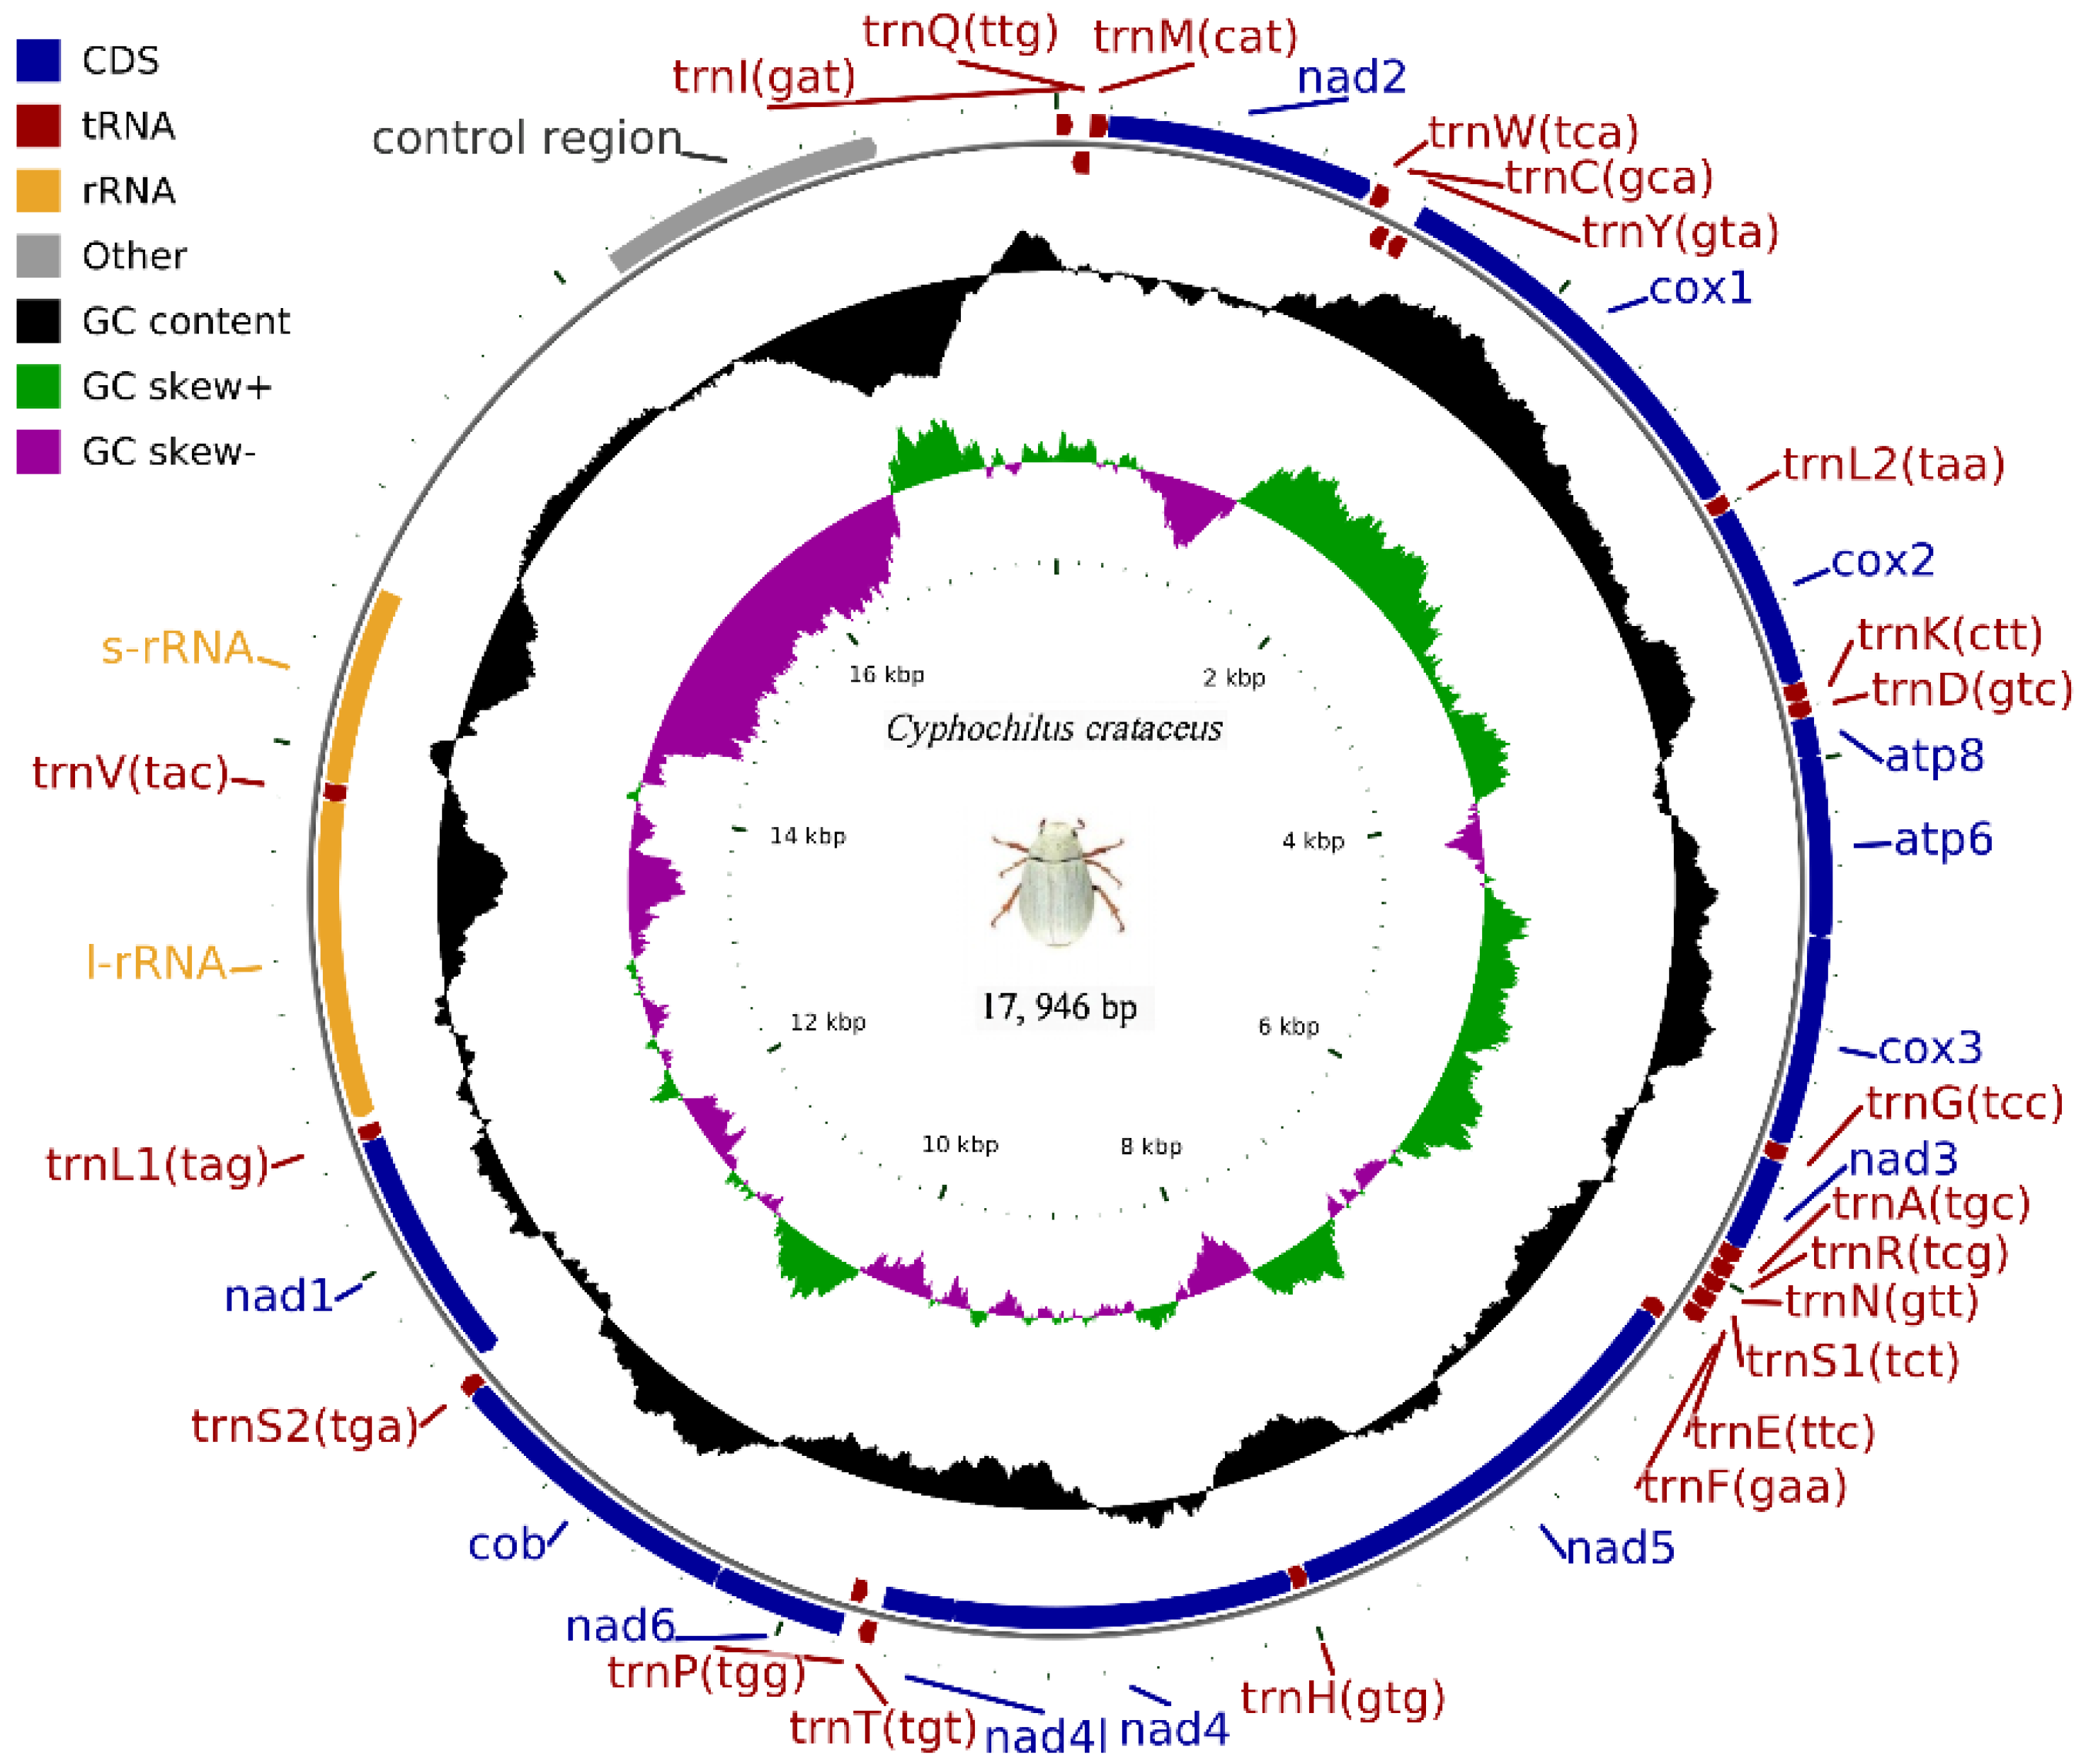
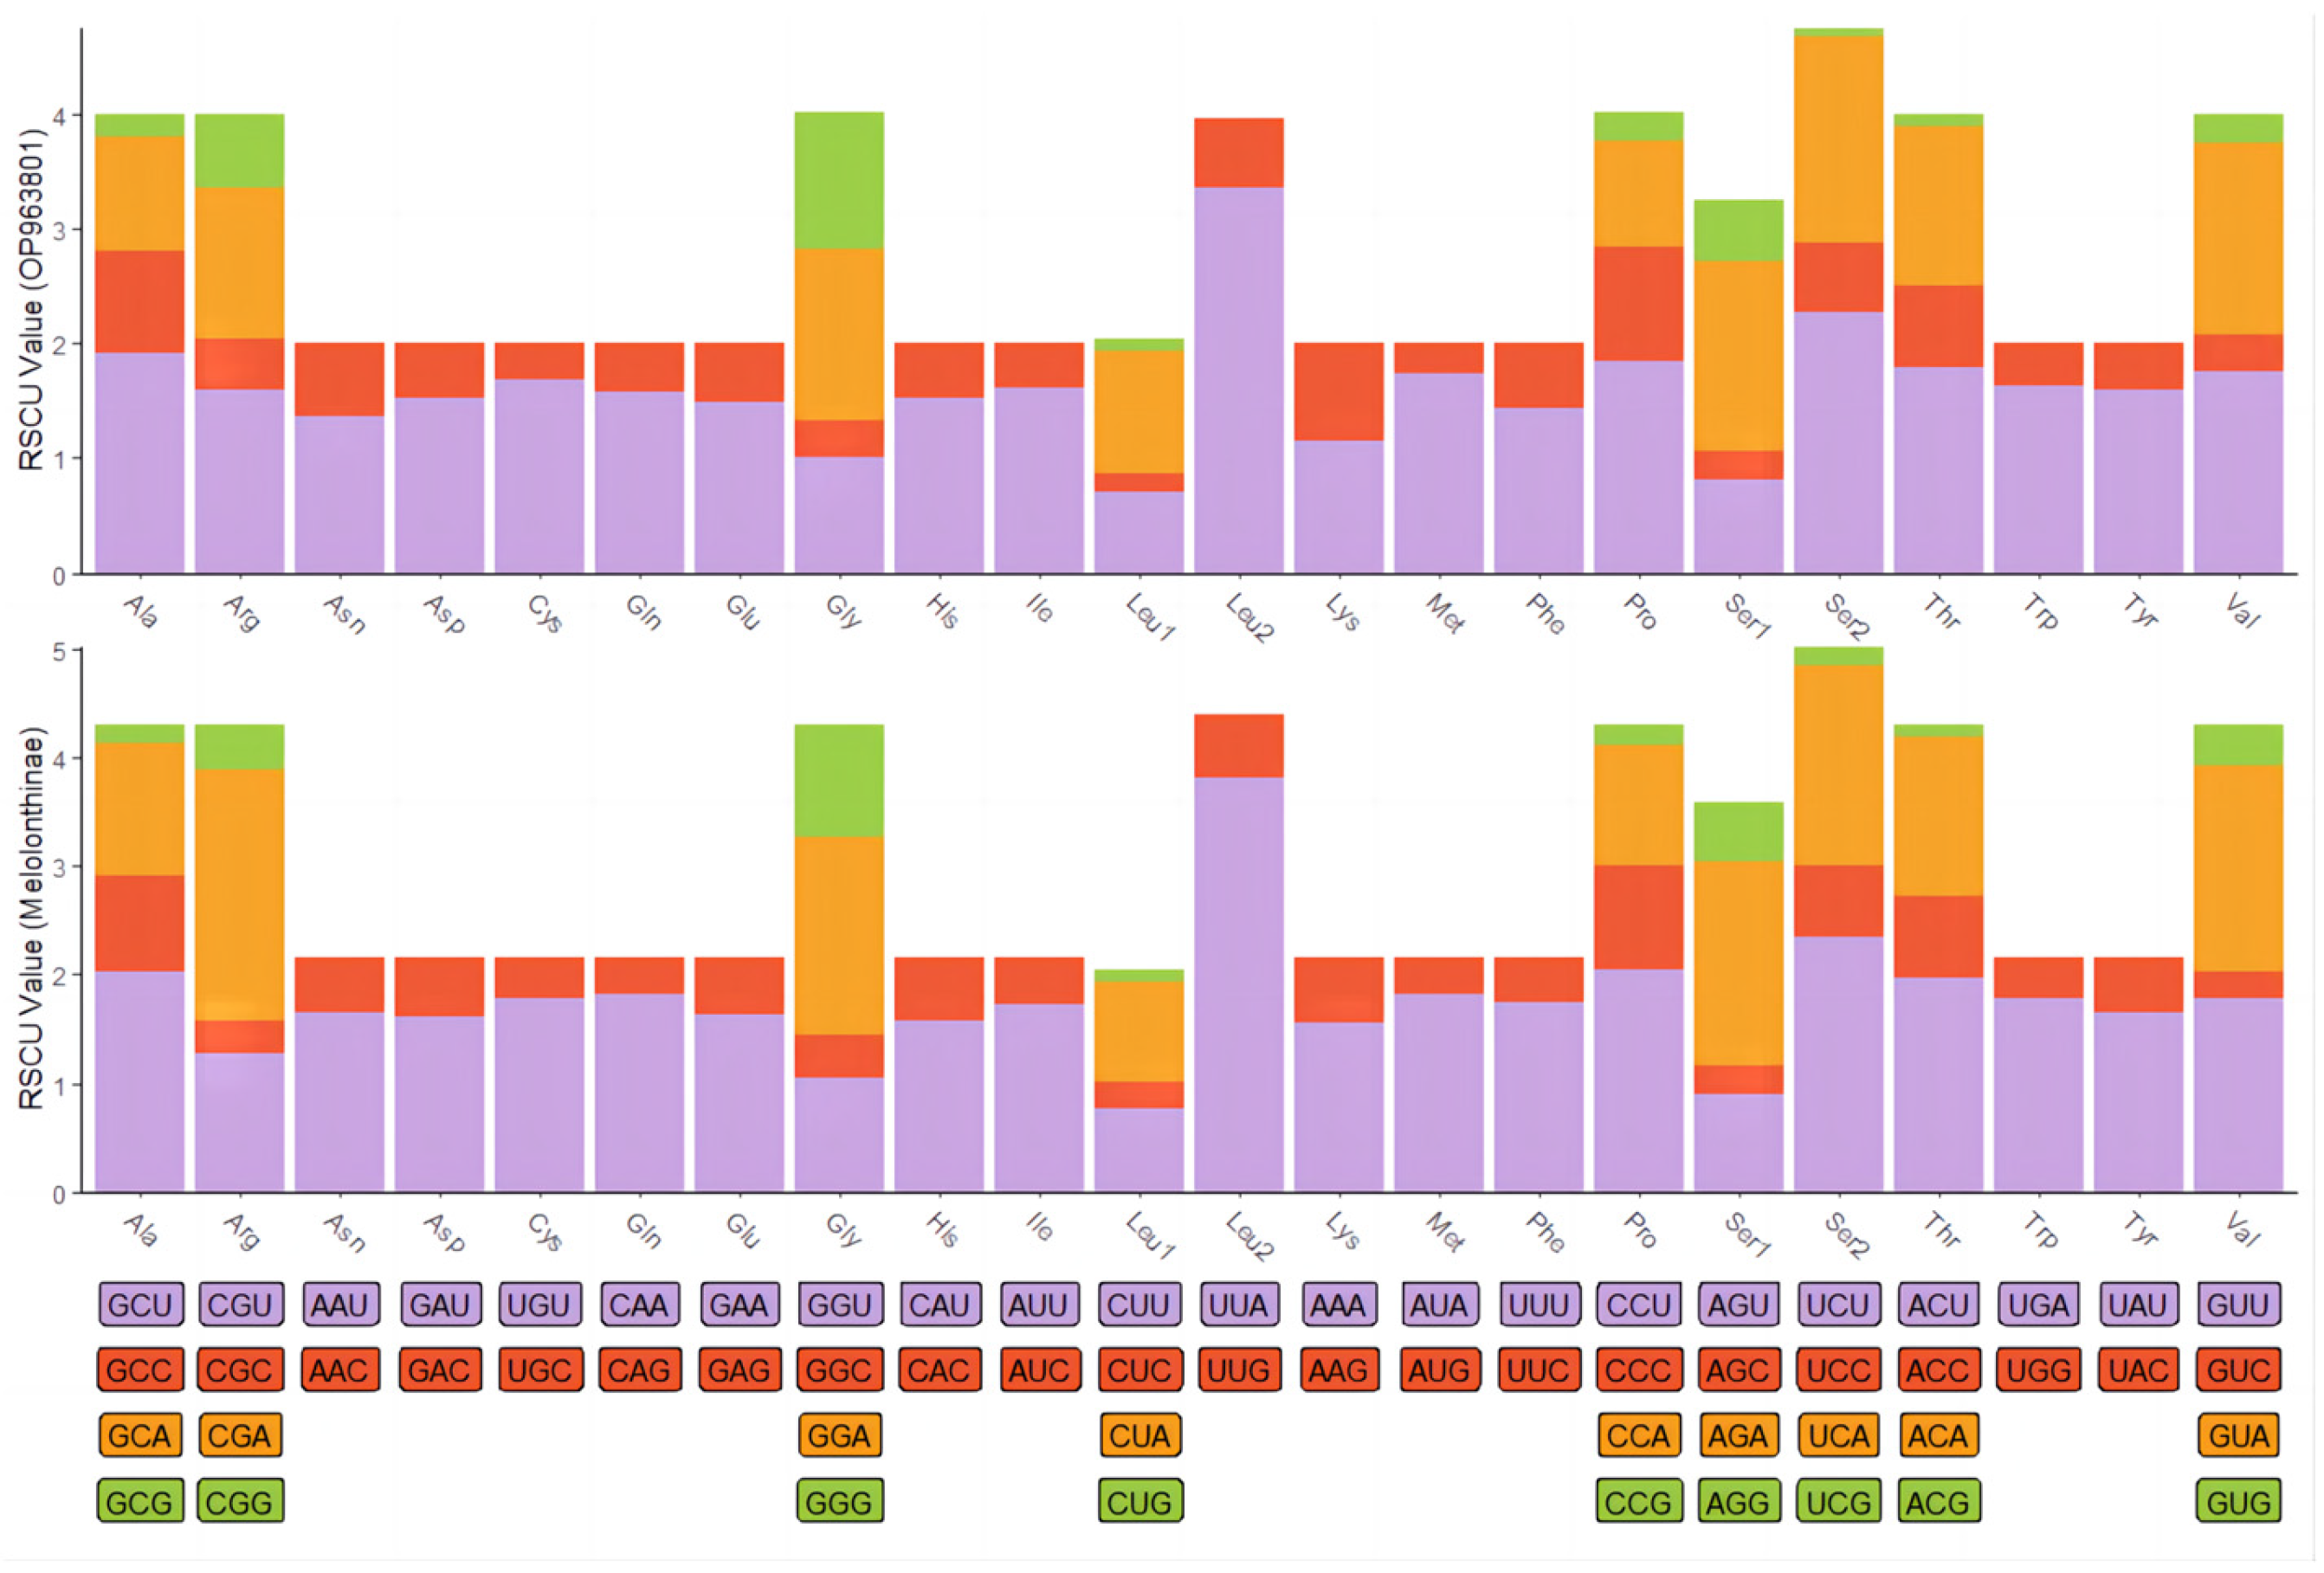
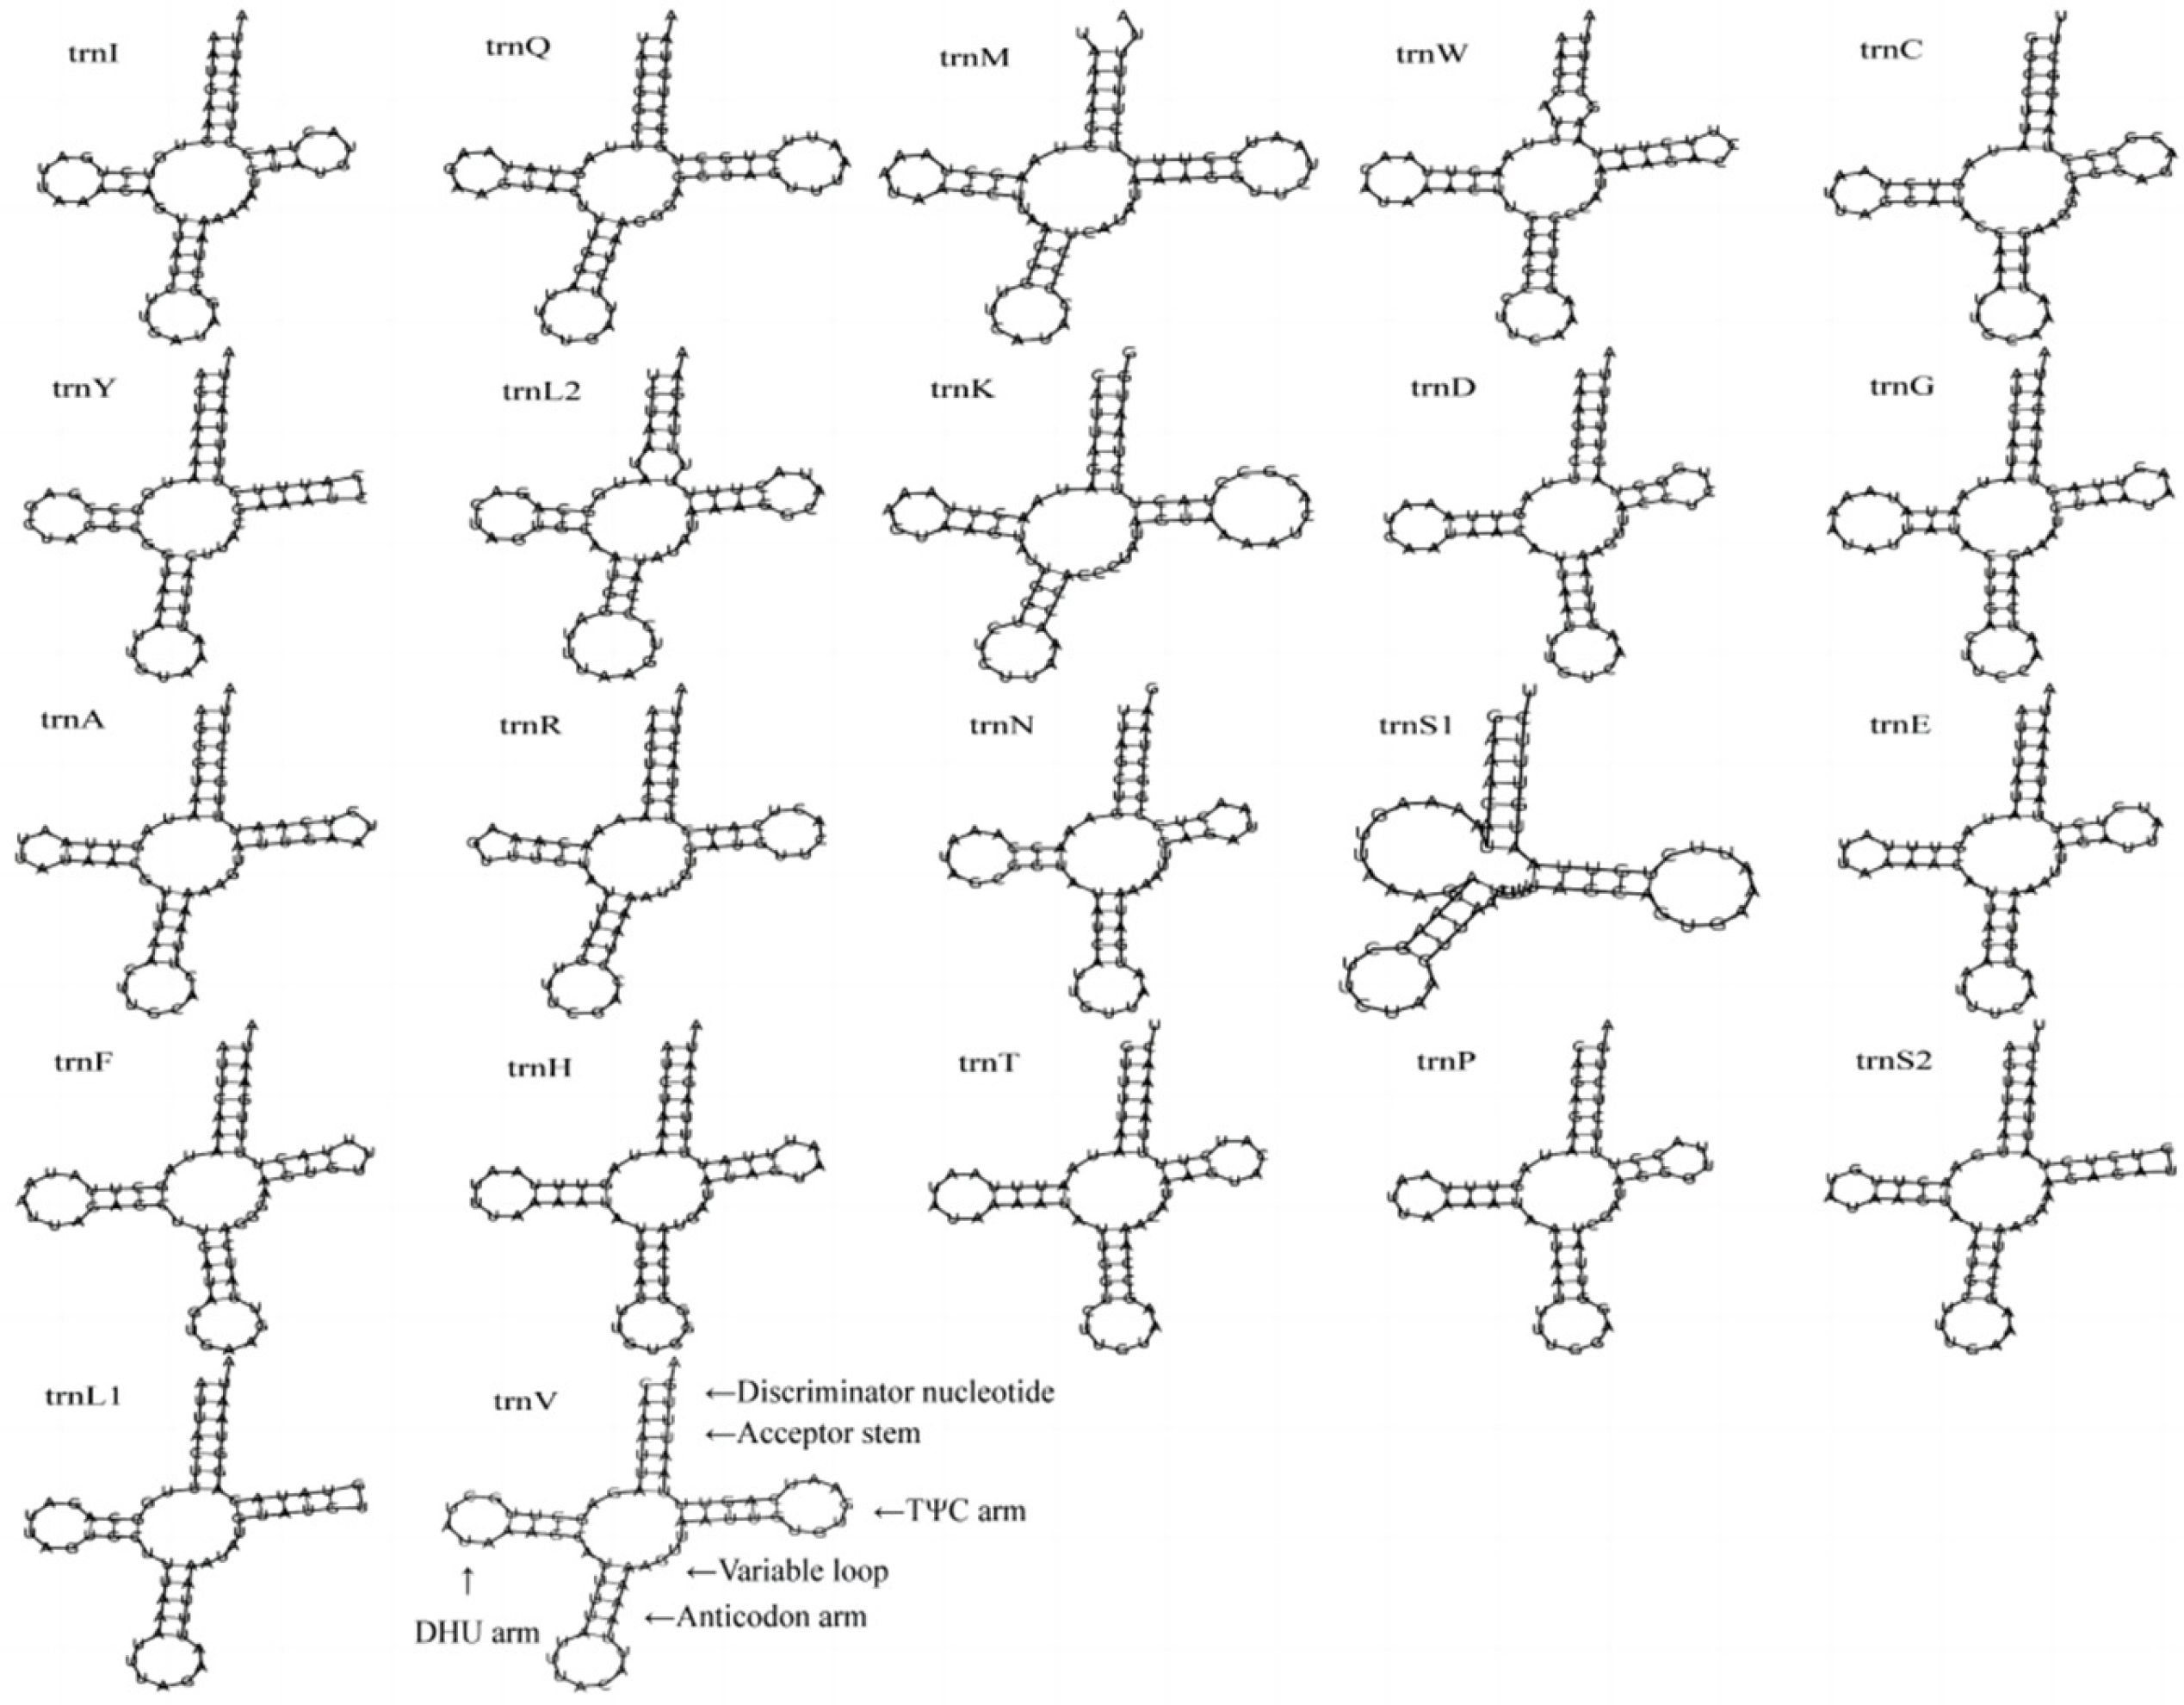
The complete mitochondrial genome of C. crataceus is 17,946 bp in length (Figure 1), containing 13 protein-coding genes (PCGs), 1 D-loop region, 22 tRNAs, and 2 rRNAs. The sequence did not exhibit any rearrangement and showed typical features of Scarabaeidae mitogenomes. Among them, trnQ, trnC, trnY, trnF, nad5, trnH, nad4, nad4l, trnP, nad1, trnL1, rrnL, trnV, and rrnS are located on the J strand, while trnI, trnM, nad2, trnW, cox1, trnL2, cox2, trnK, trnD, atp8, atp6, cox3, trnG, nad3, trnA, trnR, trnN, trnS1, trnE, trnT, nad6, cob, trnS2, and OH are located on the N strand (Table 1). Like other insect mitochondrial genomes, the C. crataceus mitochondrial genome also exhibits gene overlaps and intergenic regions, with 19 instances of base overlaps ranging from 1–8 bp and 11 instances of base gaps ranging from 1–1531 bp (Table 1). The overall genome composition includes A: 37.64%, C: 18.3%, G: 9.88%, T: 34.19%, (A + T): 71.82%, (G + C): 28.18%, with an AT skew (0.048) greater than the GC skew (−0.299), indicating a significant AT bias. However, certain sequences such as nad1, nad4, nad4L, nad5, and rRNA exhibit significant GC bias, while some genes show both AT skew < 0 and GC skew < 0 (Table 2). The lengths of the 13 PCGs in C. crataceus range from 156 bp to 1718 bp. Details of the start and stop codons of PCGs in C. crataceus are provided in Table 1. The predominant start codons used were ATT for nd2, cox1, and nad5, ATG for cox2, atp6, cox3, nad4, nad4l, cytb, and nad1, ATC for atp8, and ATA for nad3 and nad6. The commonly used stop codons were TAA for cox1, cox2, atp8, cox3, nad5, nad4, nad4l, atp6, nad6, and nad1, whereas nad2, atp6, nad3, and cytb ended with TAG. The relative synonymous codon usage (RSCU) value of C. crataceus is highly similar to other Melolonthinae species (Figure 2), with the most frequently used codons being GCU, CGA, GGA, UUA, CCU, AGA, UCU, GUA, and GUU (Figure 2). The lengths of the 22 tRNAs range from 63 bp to 71 bp (Table 1), with most tRNAs of C. crataceus exhibiting the canonical cloverleaf structure, for trnS1, which has an unpaired stretch of 10 nucleotides instead of the DHU arm (Figure 3).
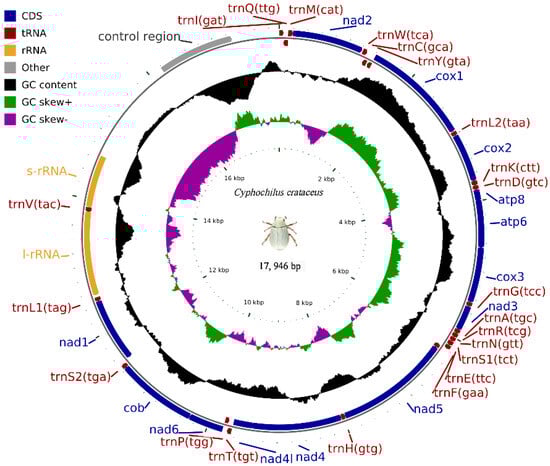
Figure 1.
Mitochondrial genome structure of C. crataceus.

Table 1.
Annotation of the complete mitogenome of C. crataceus.
Table 2.
Base composition in the mitochondrial genome of C. crataceus.
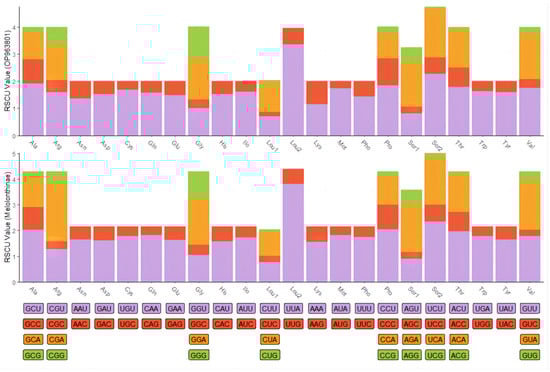
Figure 2.
Relative synonymous codon usage (RSCU) in mitochondrial protein-coding genes of C. crataceus and 19 Melolonthinae species.

Figure 3.
The secondary structures of tRNA genes inferred for C. crataceus.
3.2. Analysis of Factors Influencing Codon Usage Bias
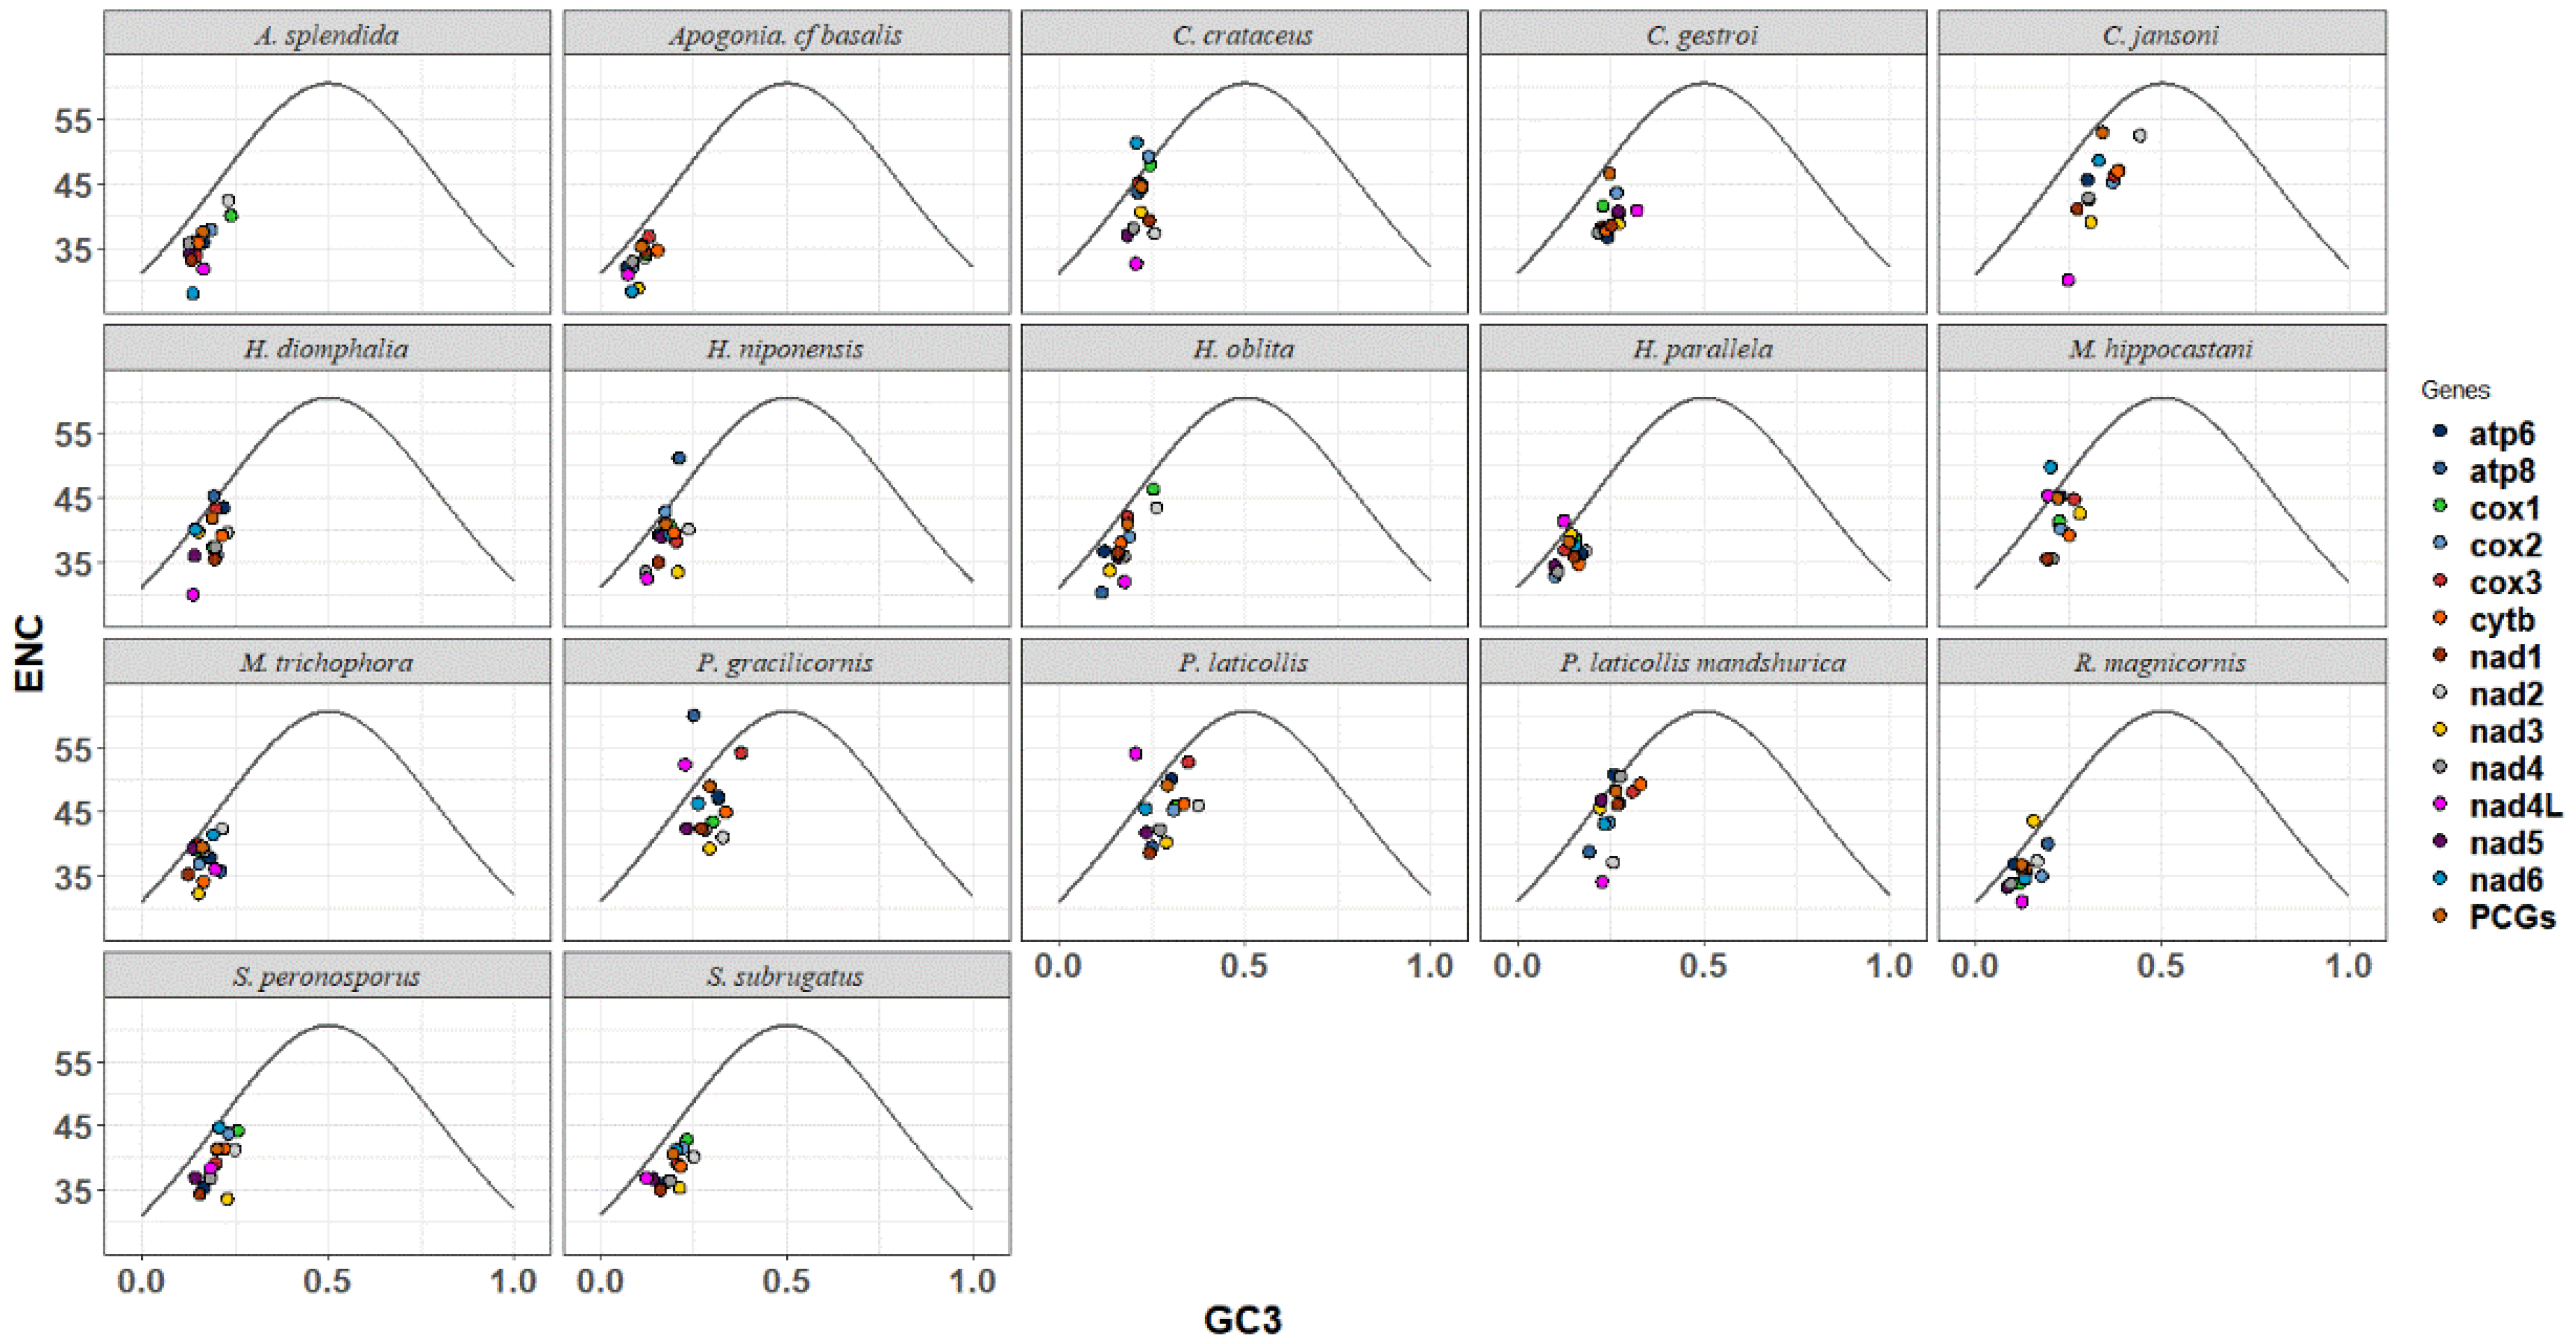
The ENC-GC3 plot was utilized to analyze the evolutionary pressure experienced by Melolonthinae species. Scatter plots were used to depict the relationship between the Expected Number of Codons (ENCs) and the GC content at the third codon position (GC3s) for each species (Figure 4). The ENC-GC3 plots of 17 Melolonthinae species varied, with most protein-coding genes having ENC values lower than the expected values, ranging between 25% and 62%, and GC3 content ranging from 5% to 50%. Some genes exhibited a distribution of codons along the expected curve, indicating that these genes were primarily influenced by base mutations. Points located further from the curve on either side indicated a stronger influence of selection, with a few genes positioned significantly below the curve, suggesting that nucleotide composition, gene mutations, and natural selection, among other factors, influenced codon selection in the 17 Melolonthinae species. In the sequenced C. crataceus sequence, genes such as cox1, cox2, cox3, and atp6 were mainly influenced by base mutations, while nad1, nad2, nad3, nad4, nad4L, and nad5 were positioned below the curve, far from the expected ENC value, indicating that the codon usage bias of these genes was influenced by factors such as natural selection.
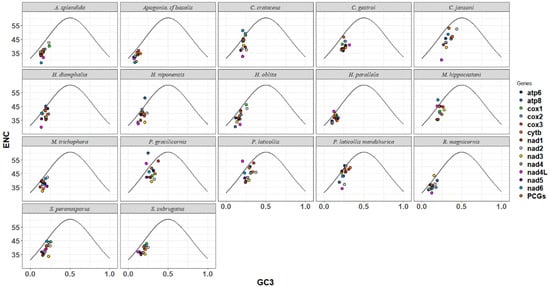
Figure 4.
ENC-GC3 analysis of mitochondrial genomes of 17 species of Melolonthinae.
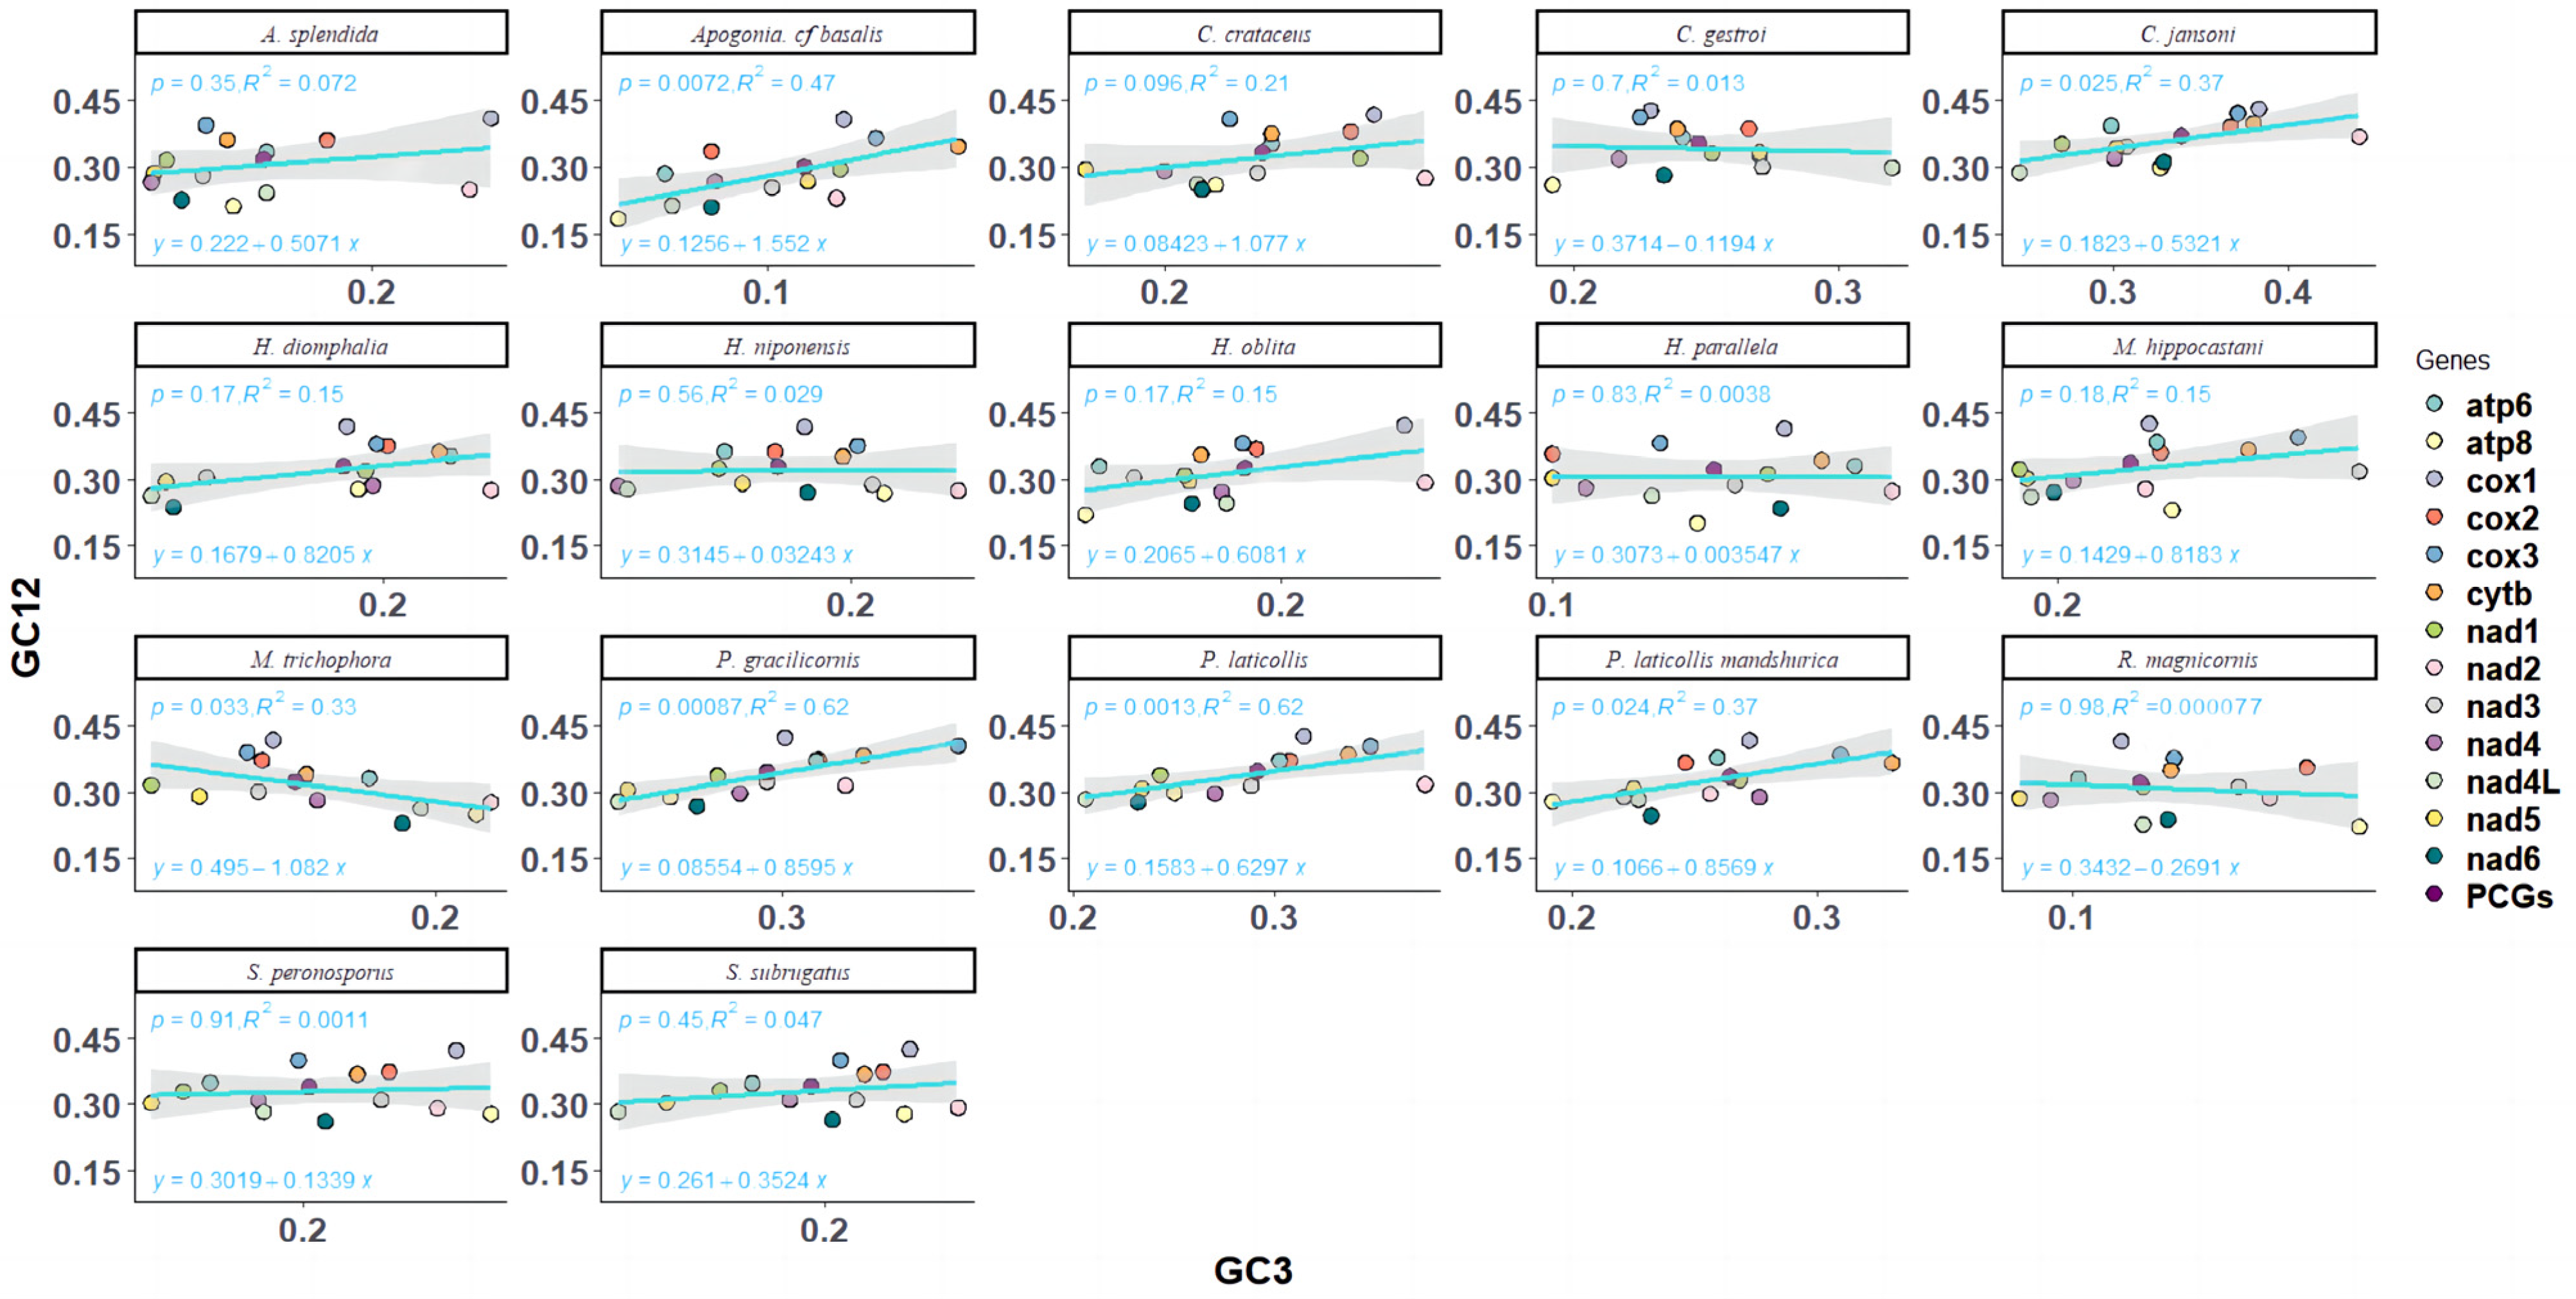
Neutral plot analysis, reflecting the mutational selection balance of codon usage in Melolonthinae, was conducted based on the correlation between GC12 and GC3 (Figure 4). Analysis of the neutral plots of GC12 and GC3 in Melolonthinae species (Figure 5) showed varying slopes of the standard curves for all 17 species, indicating differences in the intensity of mutational pressure or natural selection influencing codon usage bias. The correlation between GC12 and GC3 content varied among species, with some showing positive correlations and others negative correlations, although the correlations were not significant, further indicating differences in the composition of the third base of codons compared with the first and second bases. The slope of the standard curve for C. crataceus in this sequencing was 1.075, close to 1, indicating no difference in the base composition at the three positions of codons, with mutations being the primary force influencing codon bias.
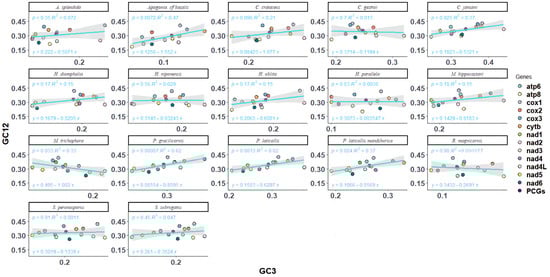
Figure 5.
Neutrality plot analysis of mitochondrial genomes of 17 species of Melolonthinae.
3.3. Phylogenetic Analyses of Scarabaeidae
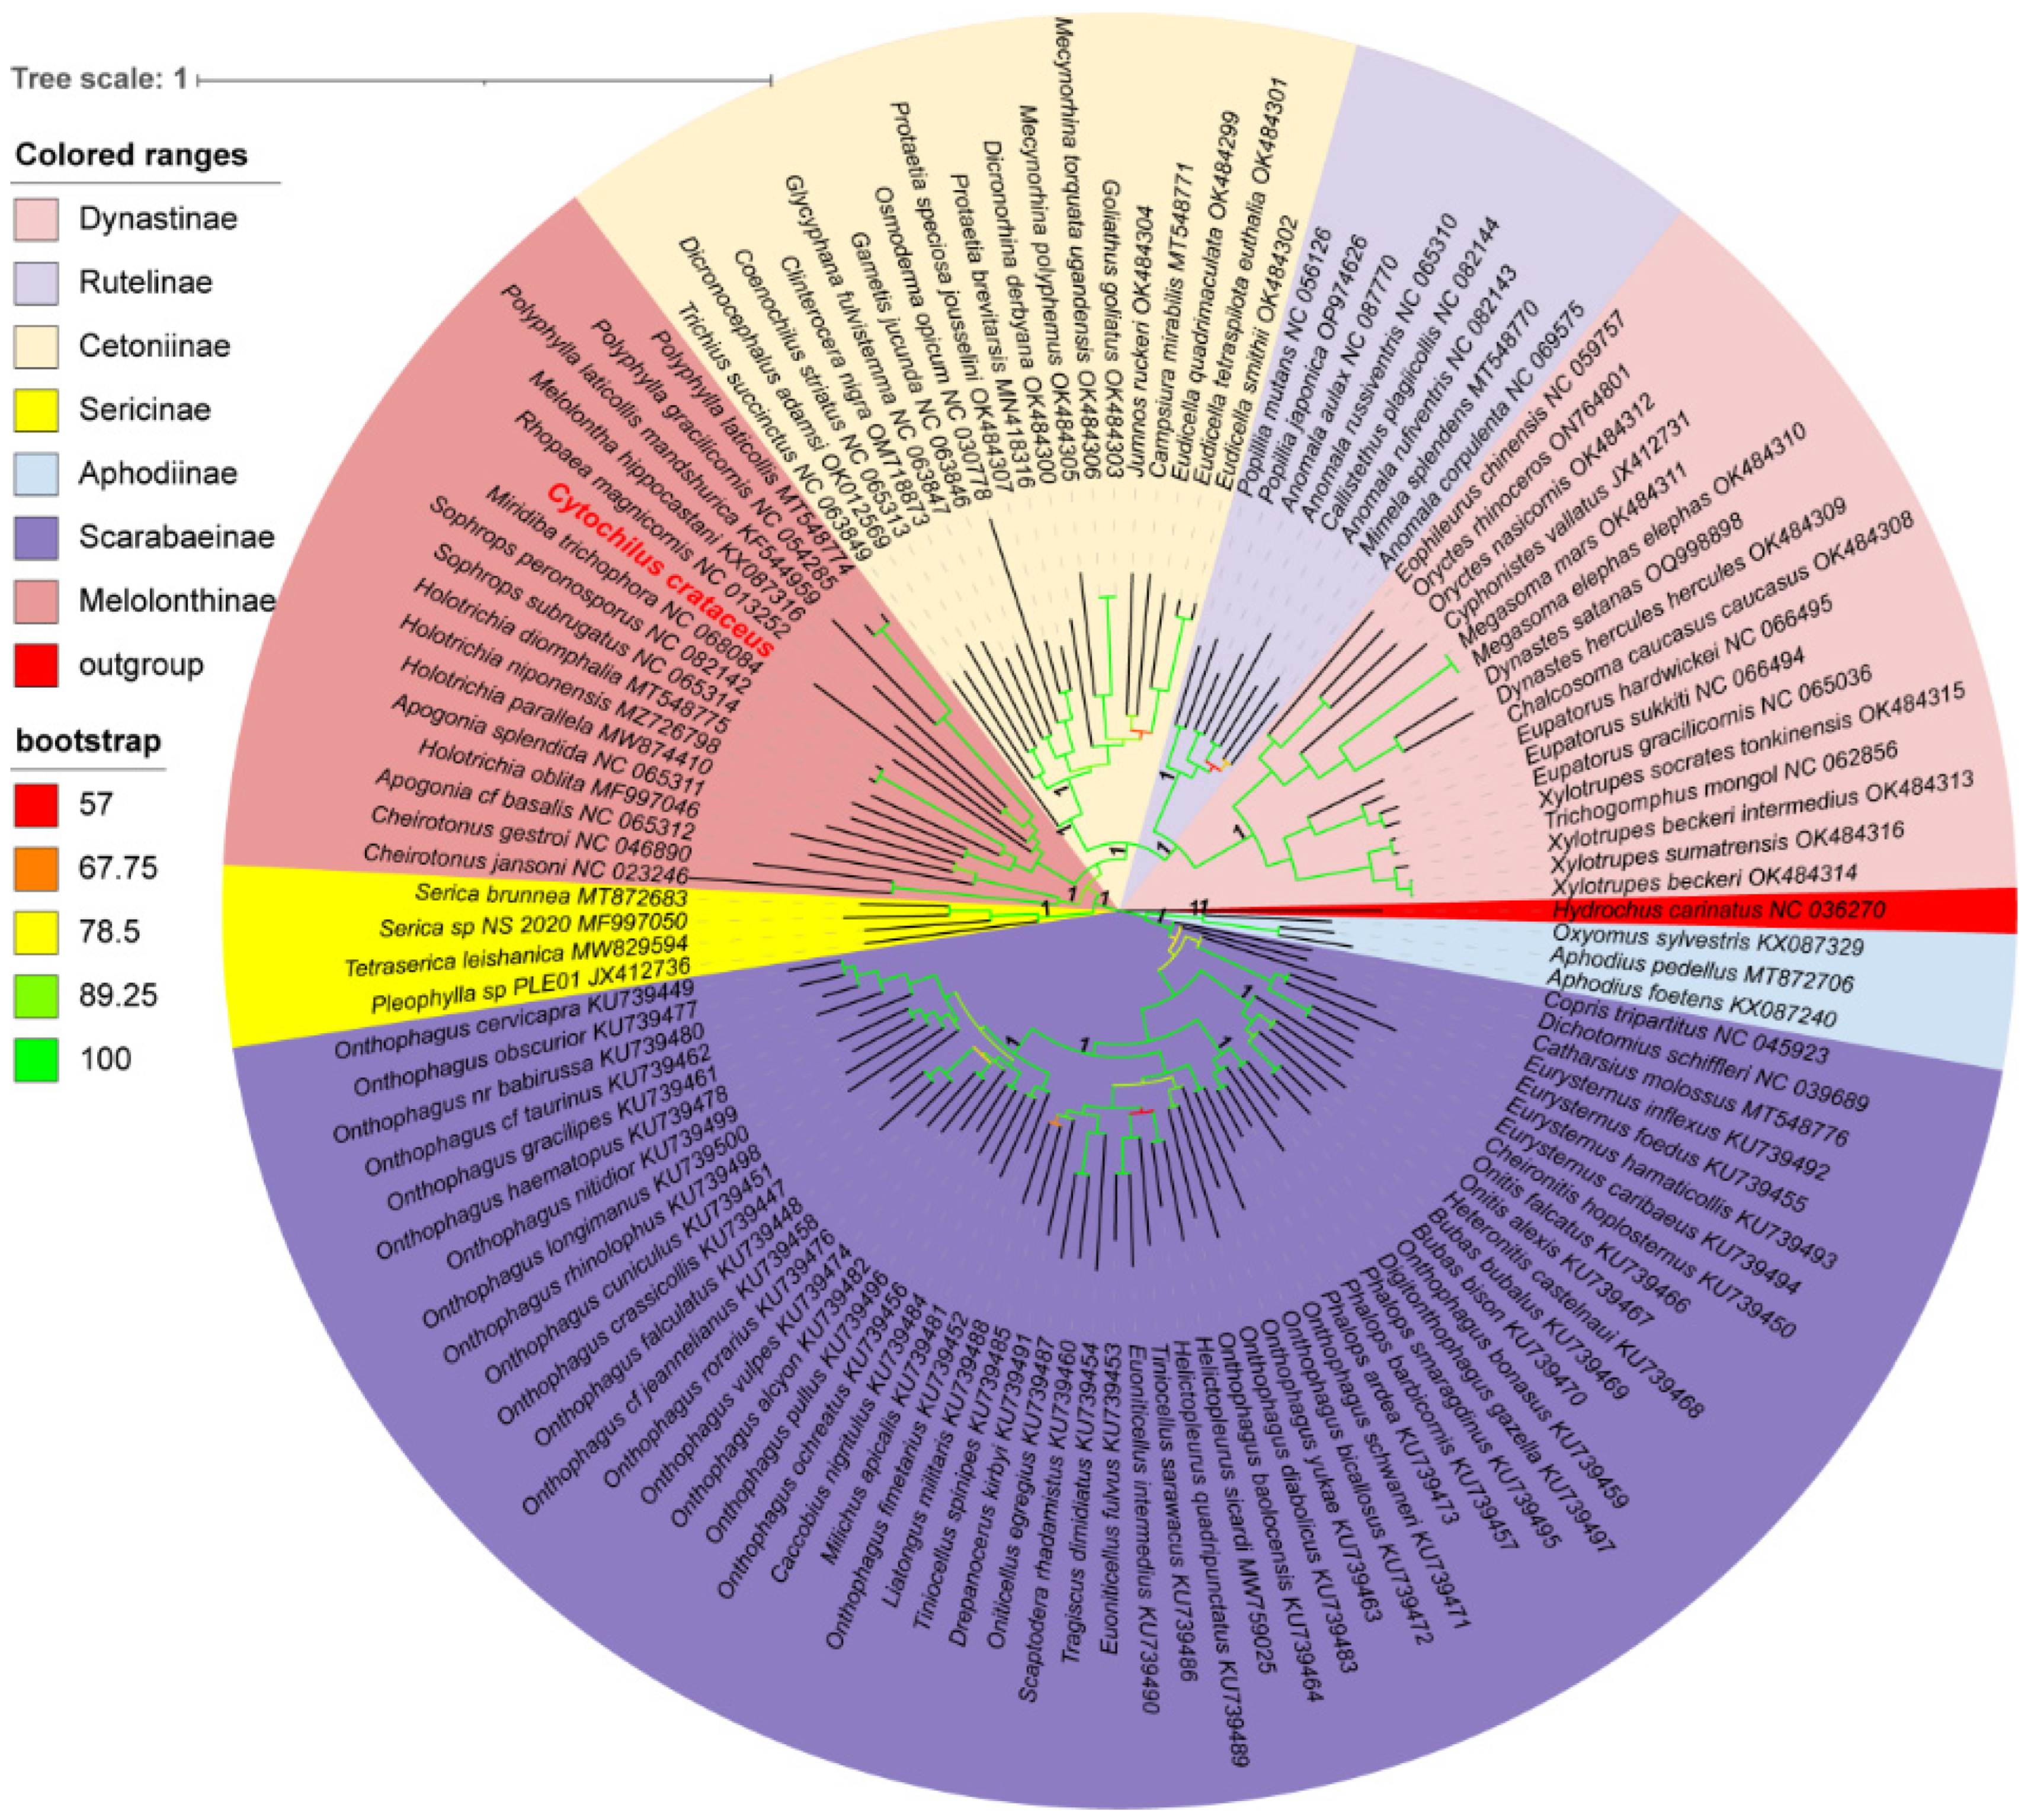
Using the 13 protein-coding genes (PCGs), phylogenetic trees of 122 species of Scarabaeidae were constructed using the RAxML and MrBayes methods, resulting in identical topologies within the major clades (Figure 6). Apart from the outgroups, the tree is primarily divided into two major clades. One clade consisted of the Scarabaeinae and Aphodiinae, both comprising coprophagous beetles, while the other clade included ((((Dynastinae + Rutelinae) + Cetoniinae) + Melolonthinae) + Sericinae), all being phytophagous beetles. Cetoniinae, Dynastinae, Rutelinae, and Sericinae were found to be monophyletic with strong support values (PP: 1, BS: 100). In contrast, Melolonthinae was paraphyletic, consisting of two distinct clades. Within the Melolonthinae branch, C. crataceus was most closely related to Miridiba trichophora and Rhopaea magnicornis, with C. crataceus forming a sister clade with these two species, followed by a sister group relationship with Melolontha hippocastani, Polyphylla mandshurica, Polyphylla gracilicornis, and Polyphylla laticollis, forming the phylogenetic structure of ((((P. gracilicornis + P. laticollis) + P. mandshurica) + M. hippocastani) + C. crataceus) + M. trichophora.
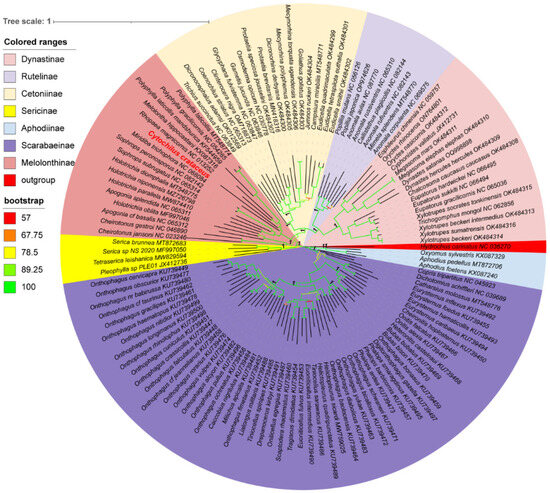
Figure 6.
Phylogenetic tree of Scarabaeidae based on protein-coding genes and constructed by Bayesian inference and Maximum Likelihood methods(The species highlighted in red font is sequenced in this study).
4. Discussion
Previous studies have extensively reported the phylogenetic relationships within Scarabaeidae. However, with the continual addition of new mitochondrial genome sequences within this family, there is a need for a more comprehensive understanding of the accurate phylogenetic positions of the various subfamilies within Scarabaeidae. In this study, we sequenced the mitochondrial genome of C. crataceus, a species within the Melolonthinae subfamily that has been underexplored and reported less frequently. By integrating all publicly available accurate mitochondrial genome sequences of Scarabaeidae, we collectively constructed a phylogenetic tree based on the 13 protein-coding genes. Additionally, we conducted a comprehensive analysis of the mitochondrial genome composition, structure, codon usage bias, and influencing factors of C. crataceus to further understand its phylogenetic position within the Melolonthinae subfamily and confirm the factors influencing codon usage bias. The arrangement of the C. crataceus mitochondrial genome and the secondary structures of the rrnL and rrnS genes were found to be similar to other Scarabaeidae species [7]. The protein-coding genes of C. crataceus exhibited an AT content of 71.82%, showing a clear AT bias with a preference for codons ending in A/U. This study’s results were consistent with those reported by Long et al. [15]. for species such as Sophrops peronosporus Gu and Zhang, Anomala rufventris Kollar and Redtenbacher, and Callistethus plagiicollis Fairmaire, all of which had an AT content exceeding 70% and a preference for A/U-ending codons. Therefore, the codon usage bias in C. crataceus and Melolonthinae species is closely related to nucleotide composition, serving as an important factor influencing codon usage bias. The ENC-GC3 plot analysis revealed that the codon usage bias in Melolonthinae species is influenced by multiple factors such as nucleotide composition, gene mutations, and natural selection. The neutral plot analysis indicated that the codon usage bias in Melolonthinae is influenced by mutational pressure or natural selection, with varying intensities, which may be related to the broad distribution range and survival environments of the species.
The phylogenetic analyses of the 122 Scarabaeidae species were largely consistent with previous studies based on rRNAs, nuclear genes, and the 13 PCGs sequences [15,35], phylogenetic structure of ((Scarabaeinae + Aphodiinae) + ((((Dynastinae + Rutelinae) + Cetoniinae) + Melolonthinae) + Sericinae)) + outgroup. This obtained topological structure is consistent with the phylogenetic structures based on mitochondrial nucleotide sequences and amino acid sequences, based on transcriptomic data, and based on the combination of mitochondrial and nuclear genes [7,36,37,38,39,40], indicating that using only mitochondrial protein-coding genes is a simple and effective method for constructing the phylogeny of Scarabaeidae. The use of the Hydrochidae insect H. carinatus as an outgroup did not lead to long branch attraction issues, indicating the rational selection of the outgroup species. Melolonthinae was found to be paraphyletic, consistent with results based on morphological features [5], while the other subfamilies were monophyletic, consistent with the findings of most researchers [7,15,36]. However, some studies have suggested that Rutelinae may be a paraphyletic group [7,40], with a possibility of some Dynastinae species being reclassified under Rutelinae [3]. This divergence in results may be due to the limited sample size leading to misinterpretation of the results. Therefore, we do not currently support the proposal to merge Melolonthinae, Rutelinae, and Dynastinae into the family Melolonthidae, as suggested by Cherman et al. [9] The phylogenetic tree in this study did not reveal any species closely related to the sequenced C. crataceus, highlighting the importance of sampling more Scarabaeidae species, especially the Aphodiinae, Dynastinae, Rutelinae, and Sericinae species with fewer available mitochondrial genome sequences in future studies to establish a more comprehensive phylogenetic relationship within Scarabaeidae, facilitating a better understanding of the topology, monophyly, polyphyly, and relationships among the subfamilies.
5. Conclusions
The complete mitogenome of C. crataceus, with a size of 17,946 bp, represents a typical circular, double-stranded DNA molecule, sharing key features with other reported Melolonthinae mitogenomes, such as gene order and tRNA secondary structures. The phylogenetic analyses provided strong support for the paraphyly of Melolonthinae and the monophyly of other Scarabaeidae subfamilies.
Supplementary Materials
The following supporting information can be downloaded at: https://www.mdpi.com/article/10.3390/genes16020111/s1, Table S1: The list of species analyzed in this study and their GenBank accession numbers.
Author Contributions
H.Z. analyzed the data and wrote the original draft. Q.C. performed the revision of the manuscript, the DNA extraction, and PCR amplification and collected the C. crataceus. X.Y. designed the experiments and reviewed and edited the manuscript. All authors have read and agreed to the published version of the manuscript.
Funding
This study was supported by Guizhou Provincial Science and Technology Foundation, grant/award number: (Qiankehe jichu-ZK[2021]yiban152); Science and Technology Foundation of Guizhou Forestry Bureau (Qianlinkehe [2020] 09); The project of Guizhou Zhengfeng Tea Technology Courtyard.
Institutional Review Board Statement
This research is not required for ethical approval. They only collected a dead C. crataceus.
Informed Consent Statement
Not applicable.
Data Availability Statement
The mitogenome sequences of C. crataceus have been deposited in GenBank under accession number OP963801.1.
Acknowledgments
We are grateful to Lei Liu, the Yinggeling National Nature Reserve, for assisting in sample collection.
Conflicts of Interest
The authors declare that they have no conflicts of interest.
References
- Niijima, Y.; Kinoshita, E. Die Untersuchung über japanische Melolonthiden II. Res. Bull. Collect. Exped. For. Hokkaido Imp. Univ. 1923, 2, 1–253. [Google Scholar]
- Erichson, W.F.; von Kiesenwetter, H.; Kraatz, G.; Reitter, E.; Schaum, H.R.; Seidlitz, G.; Weise, J. Naturgeschichte der Insecten Deutschlands. 1. Abtheilung, Coleoptera; Nicholaische Buchhandlung: Berlin, Germany, 1848. [Google Scholar]
- Smith, A.B.T.; Hawks, D.C.; Heraty, J.M. An Overview of the Classification and Evolution of the Major Scarab Beetle Clades (Coleoptera: Scarabaeoidea) Based on Preliminary Molecular Analyses. Coleopt. Bull. 2006, 60, 35–46. [Google Scholar] [CrossRef]
- Eberle, J.; Myburgh, R.; Ahrens, D. The Evolution of Morphospace in Phytophagous Scarab Chafers: No Competition—No Divergence? PLoS ONE 2014, 9, e98536. [Google Scholar] [CrossRef] [PubMed]
- Ahrens, D. The Phylogeny of Sericini and Their Position within the Scarabaeidae Based on Morphological Characters (Coleoptera: Scarabaeidae). Syst. Entomol. 2006, 31, 113–144. [Google Scholar] [CrossRef]
- Ahrens, D.; Schwarzer, J.; Vogler, A.P. The Evolution of Scarab Beetles Tracks the Sequential Rise of Angiosperms and Mammals. Proc. R. Soc. B Biol. Sci. 2014, 281, 20141470. [Google Scholar] [CrossRef]
- Song, N.; Zhang, H. The Mitochondrial Genomes of Phytophagous Scarab Beetles and Systematic Implications. J. Insect Sci. 2018, 18, 11. [Google Scholar] [CrossRef] [PubMed]
- Morón, M.Á.; Cherman, M. Validación de La Familia Melolonthidae Leach, 1819 (Coleoptera: Scarabaeoidea). Acta Zool. Mex. 2014, 30, 201–220. [Google Scholar] [CrossRef]
- Cherman, M.A.; Morón, M.A.; Almeida, L.M. Phylogenetic Relationships within Diplotaxini Kirby (Coleoptera: Melolonthidae: Melolonthinae) with Emphasis on Liogenys Guérin-Méneville. Syst. Entomol. 2016, 41, 744–770. [Google Scholar] [CrossRef]
- Machatschke, J.W. Phylogenetische Untersuchungen über die Sericini (Sensu Dalla Torre 1912) (Coleoptera: Lamellicornia, Melolonthidae). Beiträge Entomol. Contrib. Entomol. 1959, 9, 730–746. [Google Scholar] [CrossRef]
- Wang, M.; Yu, W.; Yang, J.; Hou, Z.; Li, C.; Niu, Z.; Zhang, B.; Xue, Q.; Liu, W.; Ding, X. Mitochondrial Genome Comparison and Phylogenetic Analysis of Dendrobium (Orchidaceae) Based on Whole Mitogenomes. BMC Plant Biol. 2023, 23, 586. [Google Scholar] [CrossRef]
- Chen, F.; Lu, P.; Liang, D.; Wu, Y.; Jiang, Z.; Huang, W.; Gao, L. Phylogenetic Analysis Based on the Complete Mitochondrial Genome of Discogobio brachyphysallidos (Cypriniformes: Cyprinidae) Suggests the Need for Taxonomic Revision at the Genus Level. Mitochondrial DNA Part B 2024, 9, 200–203. [Google Scholar] [CrossRef] [PubMed]
- Gillett, C.P.D.T.; Crampton-Platt, A.; Timmermans, M.J.T.N.; Jordal, B.H.; Emerson, B.C.; Vogler, A.P. Bulk De Novo Mitogenome Assembly from Pooled Total DNA Elucidates the Phylogeny of Weevils (Coleoptera: Curculionoidea). Mol. Biol. Evol. 2014, 31, 2223–2237. [Google Scholar] [CrossRef] [PubMed]
- Song, N.; Li, H.; Song, F.; Cai, W. Molecular Phylogeny of Polyneoptera (Insecta) Inferred from Expanded Mitogenomic Data. Sci. Rep. 2016, 6, 36175. [Google Scholar] [CrossRef]
- Long, T.; Zhu, W.; Yang, L.; Long, J.; Chang, Z.; Chen, X. First Report of the Complete Mitochondrial Genome of 3 Beetles (Coleoptera: Scarabaeidae) Harming Gastrodia elata (Asparagales: Orchidaceae). J. Insect Sci. 2024, 24, 12. [Google Scholar] [CrossRef] [PubMed]
- Athey, J.; Alexaki, A.; Osipova, E.; Rostovtsev, A.; Santana-Quintero, L.V.; Katneni, U.; Simonyan, V.; Kimchi-Sarfaty, C. A New and Updated Resource for Codon Usage Tables. BMC Bioinform. 2017, 18, 391. [Google Scholar] [CrossRef]
- Parvathy, S.T.; Udayasuriyan, V.; Bhadana, V. Codon Usage Bias. Mol. Biol. Rep. 2022, 49, 539–565. [Google Scholar] [CrossRef] [PubMed]
- Lutz, K.A.; Wang, W.; Zdepski, A.; Michael, T.P. Isolation and Analysis of High Quality Nuclear DNA with Reduced Organellar DNA for Plant Genome Sequencing and Resequencing. BMC Biotechnol. 2011, 11, 54. [Google Scholar] [CrossRef]
- Walker, B.J.; Abeel, T.; Shea, T.; Priest, M.; Abouelliel, A.; Sakthikumar, S.; Cuomo, C.A.; Zeng, Q.; Wortman, J.; Young, S.K.; et al. Pilon: An Integrated Tool for Comprehensive Microbial Variant Detection and Genome Assembly Improvement. PLoS ONE 2014, 9, e112963. [Google Scholar] [CrossRef] [PubMed]
- Coil, D.; Jospin, G.; Darling, A.E. A5-Miseq: An Updated Pipeline to Assemble Microbial Genomes from Illumina MiSeq Data. Bioinformatics 2015, 31, 587–589. [Google Scholar] [CrossRef]
- Kearse, M.; Moir, R.; Wilson, A.; Stones-Havas, S.; Cheung, M.; Sturrock, S.; Buxton, S.; Cooper, A.; Markowitz, S.; Duran, C.; et al. Geneious Basic: An Integrated and Extendable Desktop Software Platform for the Organization and Analysis of Sequence Data. Bioinformatics 2012, 28, 1647–1649. [Google Scholar] [CrossRef] [PubMed]
- Stothard, P.; Wishart, D.S. Circular Genome Visualization and Exploration Using CGView. Bioinformatics 2005, 21, 537–539. [Google Scholar] [CrossRef] [PubMed]
- Bernt, M.; Donath, A.; Jühling, F.; Externbrink, F.; Florentz, C.; Fritzsch, G.; Pütz, J.; Middendorf, M.; Stadler, P.F. MITOS: Improved de Novo Metazoan Mitochondrial Genome Annotation. Mol. Phylogenetics Evol. 2013, 69, 313–319. [Google Scholar] [CrossRef] [PubMed]
- Lowe, T.M.; Chan, P.P. TRNAscan-SE On-Line: Integrating Search and Context for Analysis of Transfer RNA Genes. Nucleic Acids Res. 2016, 44, W54–W57. [Google Scholar] [CrossRef] [PubMed]
- Kumar, S.; Stecher, G.; Tamura, K. MEGA7: Molecular Evolutionary Genetics Analysis Version 7.0 for Bigger Datasets. Mol. Biol. Evol. 2016, 33, 1870–1874. [Google Scholar] [CrossRef]
- Perna, N.T.; Kocher, T.D. Patterns of Nucleotide Composition at Fourfold Degenerate Sites of Animal Mitochondrial Genomes. J. Mol. Evol. 1995, 41, 353–358. [Google Scholar] [CrossRef]
- Novembre, J.A. Accounting for Background Nucleotide Composition When Measuring Codon Usage Bias. Mol. Biol. Evol. 2002, 19, 1390–1394. [Google Scholar] [CrossRef] [PubMed]
- Zhang, D.; Gao, F.; Jakovlić, I.; Zou, H.; Zhang, J.; Li, W.X.; Wang, G.T. PhyloSuite: An Integrated and Scalable Desktop Platform for Streamlined Molecular Sequence Data Management and Evolutionary Phylogenetics Studies. Mol. Ecol. Resour. 2020, 20, 348–355. [Google Scholar] [CrossRef]
- Nguyen, L.-T.; Schmidt, H.A.; von Haeseler, A.; Minh, B.Q. IQ-TREE: A Fast and Effective Stochastic Algorithm for Estimating Maximum-Likelihood Phylogenies. Mol. Biol. Evol. 2015, 32, 268–274. [Google Scholar] [CrossRef]
- Katoh, K.; Standley, D.M. MAFFT Multiple Sequence Alignment Software Version 7: Improvements in Performance and Usability. Mol. Biol. Evol. 2013, 30, 772–780. [Google Scholar] [CrossRef]
- Lanfear, R.; Frandsen, P.B.; Wright, A.M.; Senfeld, T.; Calcott, B. PartitionFinder 2: New Methods for Selecting Partitioned Models of Evolution for Molecular and Morphological Phylogenetic Analyses. Mol. Biol. Evol. 2017, 34, 772–773. [Google Scholar] [CrossRef]
- Ronquist, F.; Klopfstein, S.; Vilhelmsen, L.; Schulmeister, S.; Murray, D.L.; Rasnitsyn, A.P. A total-evidence approach to dating with fossils, applied to the early radiation of the Hymenoptera. Syst. Biol. 2012, 61, 973–999. [Google Scholar] [CrossRef]
- Minh, B.Q.; Schmidt, H.A.; Chernomor, O.; Schrempf, D.; Woodhams, M.D.; von Haeseler, A.; Lanfear, R. IQ-TREE 2: New Models and Efficient Methods for Phylogenetic Inference in the Genomic Era. Mol. Biol. Evol. 2020, 37, 1530–1534. [Google Scholar] [CrossRef] [PubMed]
- Minh, B.Q.; Nguyen, M.A.T.; von Haeseler, A. Ultrafast Approximation for Phylogenetic Bootstrap. Mol. Biol. Evol. 2013, 30, 1188–1195. [Google Scholar] [CrossRef] [PubMed]
- Hoang, D.T.; Chernomor, O.; von Haeseler, A.; Minh, B.Q.; Vinh, L.S. UFBoot2: Improving the Ultrafast Bootstrap Approximation. Mol. Biol. Evol. 2018, 35, 518–522. [Google Scholar] [CrossRef] [PubMed]
- Guo, S.; Lin, X.; Song, N. Mitochondrial Phylogenomics Reveals Deep Relationships of Scarab Beetles (Coleoptera, Scarabaeidae). PLoS ONE 2022, 17, e0278820. [Google Scholar] [CrossRef]
- Monaghan, M.T.; Inward, D.J.G.; Hunt, T.; Vogler, A.P. A Molecular Phylogenetic Analysis of the Scarabaeinae (Dung Beetles). Mol. Phylogenetics Evol. 2007, 45, 674–692. [Google Scholar] [CrossRef]
- Dietz, L.; Seidel, M.; Eberle, J.; Misof, B.; Pacheco, T.L.; Podsiadlowski, L.; Ranasinghe, S.; Gunter, N.L.; Niehuis, O.; Mayer, C.; et al. A Transcriptome-based Phylogeny of Scarabaeoidea Confirms the Sister Group Relationship of Dung Beetles and Phytophagous Pleurostict Scarabs (Coleoptera). Syst. Entomol. 2023, 48, 672–686. [Google Scholar] [CrossRef]
- Ayivi, S.P.G.; Tong, Y.; Storey, K.B.; Yu, D.-N.; Zhang, J.-Y. The Mitochondrial Genomes of 18 New Pleurosticti (Coleoptera: Scarabaeidae) Exhibit a Novel TrnQ-NCR-TrnI-TrnM Gene Rearrangement and Clarify Phylogenetic Relationships of Subfamilies within Scarabaeidae. Insects 2021, 12, 1025. [Google Scholar] [CrossRef] [PubMed]
- Gunter, N.L.; Weir, T.A.; Slipinksi, A.; Bocak, L.; Cameron, S.L. If Dung Beetles (Scarabaeidae: Scarabaeinae) Arose in Association with Dinosaurs, Did They Also Suffer a Mass Co-Extinction at the K-Pg Boundary? PLoS ONE 2016, 11, e0153570. [Google Scholar] [CrossRef] [PubMed]
Disclaimer/Publisher’s Note: The statements, opinions and data contained in all publications are solely those of the individual author(s) and contributor(s) and not of MDPI and/or the editor(s). MDPI and/or the editor(s) disclaim responsibility for any injury to people or property resulting from any ideas, methods, instructions or products referred to in the content. |
© 2025 by the authors. Licensee MDPI, Basel, Switzerland. This article is an open access article distributed under the terms and conditions of the Creative Commons Attribution (CC BY) license (https://creativecommons.org/licenses/by/4.0/).