Article

Genome-Wide Identification and Analysis of the MYC Gene Family in Cotton: Evolution and Expression Profiles During Normal Growth and Stress Response

1
Agricultural College, Shihezi University, Shihezi 832003, China
2
Key Laboratory of Oasis Ecology Agriculture, Xinjiang Production and Construction Crops, Shihezi 832003, China
3
Xinjiang Production and Construction Corps Seed Management Station, Urumqi 830011, China
4
Xinjiang Production and Construction Corps Agricultural Technology Extension Station, Urumqi 830011, China
*
Authors to whom correspondence should be addressed.
These authors contributed equally to this work.
Genes 2025, 16(1), 20; https://doi.org/10.3390/genes16010020
Submission received: 2 December 2024 / Revised: 22 December 2024 / Accepted: 25 December 2024 / Published: 26 December 2024
(This article belongs to the Section Bioinformatics)

Abstract

:
Background: The gene family of myelomatosis (MYC), serving as a transcription factor in the jasmonate (JA) signaling pathway, displays a significant level of conservation across diverse animal and plant species. Cotton is the most widely used plant for fiber production. Nevertheless, there is a paucity of literature reporting on the members of MYCs and how they respond to biotic stresses in cotton. Methods: Bioinformatics analysis was used to mine the MYC gene family in cotton based on InterPro, cottongen, etc. Results: The gene structure, conserved motifs, and upstream open reading frames of 32 GhMYCs in Gossypium hirsutum were identified. Moreover, it was anticipated that the GT1-motif is the most abundant in GhMYCs, indicating that the GT1-motif plays a significant role in light-responsive GhMYCs. The expression patterns of GhMYCs under biotic stresses including V. dahliae and Aphid gossypii were evaluated, suggesting that GhMYCs in class-1 and -3 GhMYCs, which function as negative regulators, are involved in resistance to verticillium wilt and aphids. The class-3 GhMYCs genes were found to be mostly expressed in female tissues. Interestingly, it was also determined that the homeologous expression bias within GhMYCs in cotton was uncovered, and results showed that the gene expression of class-1A and class-2 GhMYCs in the Dt sub-genome may have a direct impact on gene function. Conclusions: This study provides a research direction for researchers and breeders to enhance cotton traits through manipulating individual or multiple homeologs, which laid a foundation for further study of the molecular characteristics and biological functions of GhMYC gene.

1. Introduction

The myelomatosis (MYC) gene family, which functions as a transcription factor in the jasmonate (JA) signaling pathway, exhibits high conservation across diverse animal and plant species [1,2]. The MYC transcription factor (TF), the Skp–Cullin–F-Box E3 ubiquitin ligase complex SCFCOI1 (COI1, COI1, Coronatine Insensitive 1), and the jasmonate ZIM domain (JAZ) proteins collectively constitute the three core components of the jasmonic acid (JA) signaling pathway [3]. JA is a vital plant hormone that enables plants to withstand mechanical damage, resist infestation by chewing insects, and defend themselves against pathogens that cause vegetative death [4].
The MYC protein family has been demonstrated to be present in numerous plant species, indicating its involvement in a wide range of physiological development processes, including plant growth, development, flower induction, secondary metabolite production, and defense responses [4]. Present studies have revealed the identification of a total of 14 members of the MYC gene family in the model plant Arabidopsis thaliana [5]. Among them, in the myc2 mutant, the expression level of PDF1.2 was found to increase fivefold, with a concomitant enhancement in resistance to Fusarium necrotrophic wilt [6], which indicated that the MYC2 transcription factors can regulate the production of specialized defense-related metabolites in response to biological stress. Susceptibility to Spodoptera littoralis in the triple mutants of transcription factors AtMYC2, AtMYC3, and AtMYC4 [7] also indicated that AtMYC2 and its homologues AtMYC3 and AtMYC4 play important roles in the defense response [7,8,9,10,11,12,13]. MYC is also involved in the defense responses of other plants. The overexpression of OsMYC2 in response to biological stress has been shown to up-regulate PR genes, thereby conferring resistance to rice bacterial blight [14]. Recent studies have demonstrated that the bHLH transcription factors MTB1 (MYC2-targeted BHLH1), MTB2, and MTB3 are jasmonia-induced and directly activated by MYC2, and the mutants of these genes have been shown to exhibit significant improvement in defense responses without affecting growth and development [15]. Moreover, the double mutants of zmmyc2a and zmmyc2b in maize exhibited increased susceptibility to insect feeding compared to the wild type [16]. In addition, the MYC protein has been demonstrated to co-regulate the aromatic amino acid defense mechanism with JAZ, thereby increasing resistance to necrotic pathogens while concomitantly reducing resistance to phytophagous insects [17].
Meanwhile, MYC protein family members not only play a crucial role in biological stress but also serve an indispensable role in abiotic stress. Atmyc2 mutants show higher rates of seed germination and root growth under high-salinity conditions [10]. The drought tolerance of AtMYC2-overexpressing transgenic Arabidopsis plants was markedly enhanced by the simultaneous activation of MYC2 and inhibition of ATAF1 [8,12]. In contrast, med25 mutations that physically interact with MYC2 demonstrate high sensitivity to salt and significantly reduced seed germination rates under salt treatment compared to the wild type [18]. Phenotypic comparison of Arabidopsis myc2 and med25 mutants has demonstrated that MYC2 exhibits a negative regulatory effect on salt tolerance via MED25. The atmyc2/3/4 mutation mitigates the inhibition of root cell elongation caused by salt [19]. Studies have also shown that MYC2 can inhibit SlRR26 (a B-type response regulator of the cytokinin pathway), which is a pivotal regulator of stomatal movements in response to JA under conditions of drought stress [20]. MYC2 enhances salt tolerance in rice by regulating the expression of the cyclophilin chaperone OsCYP2 [21]. Moreover, MYC2, which plays a pivotal role in plant low-temperature stress, activates the transcriptional cascade regulation of ICE-CBF/DREB-COR by its interaction with the INDUCER OF CBF EXPRESSION (ICE), subsequently binding to CBFs (C-REPEAT BINDING FACTORS)/DREB (dehydration response element binding factors) promoters and up-regulating downstream gene expression [22]. In addition, MYC2 has been identified to interact with INDUCER OF CBF EXPRESSION 1 (ICE1) in MeJA-induced cold resistance in wheat and bananas [23,24]. MdMYC2 is capable of enhancing cold tolerance in apples through its ability to bind to the G-box element located within the MdCBF1 promoter [25]. Finally, Under LD and SD conditions, myc2/3 and myc2/4 double mutants and myc2/3/4 triple mutants displayed consistent early flowering phenotypes, showing that MYC gene family plays an essential role in growth and development by interaction with jasmonate [26].
Cotton is a globally significant cash crop, a unique commodity, and a crucial strategic material for national economic advancement. However, there have been a limited number of reports indicating that MYCs may be involved in the cotton defense response, particularly at the genome-wide level. Here, the genome-wide annotation and members of MYC genes in the G. hirsutum are investigated, and we report their phylogenetic relationships, structural and conserved motifs, cis-acting elements and transcription factors, tissue expression patterns, the varying bias in homeolog expression, and their response to V. dahliae and A. gossypii. This research establishes a foundation for further research on the functional roles of the GhMYCs gene family.

2. Results

2.1. Genome-Wide Identification of MYC Gene Family in Upland Cotton

To identify myelocytomatosis protein (MYC) sequences in upland cotton, a total of thirty-two predicted GhMYC protein sequences were identified using InterPro and cottongen and confirmed using NCBI Batch CD-Search (Tables S1 and S2). Bioinformatics analysis showed that these sequences have protein lengths of 421–684 aa (Table 1). The largest MYC (Ghir_A08G019450.1) consists of 684 aa, whereas the smallest MYC (Ghir_A08G013170.1) comprises only 421 aa (Table 1). The molecular weights of these amino acid sequences span a range, varying between 47.05 and 76.48 kDa. All the GhMYCs proteins were predicted to be acidic, with PI ranging from 4.97 to 6.81 (Table 1). Subcellular localization prediction indicated that GhMYC proteins predominantly reside within the nucleus. However, it is noteworthy that the specific protein Ghir_A08G011490.1 exhibited dual localization, being found not only in the nucleus but also within the chloroplasts (Table 1). The predicted instability index, aliphatic index, and grand average of hydropathicity ranged from 39.66 to 70.55, 67.79 to 89.75, and –0.723 to –0.348, respectively (Table 1), indicating that GhMYCs encoded unstable hydrophilic proteins. These findings suggest that the characteristics of instability, hydrophilicity, and nuclear localization are commonly associated with MYC proteins.

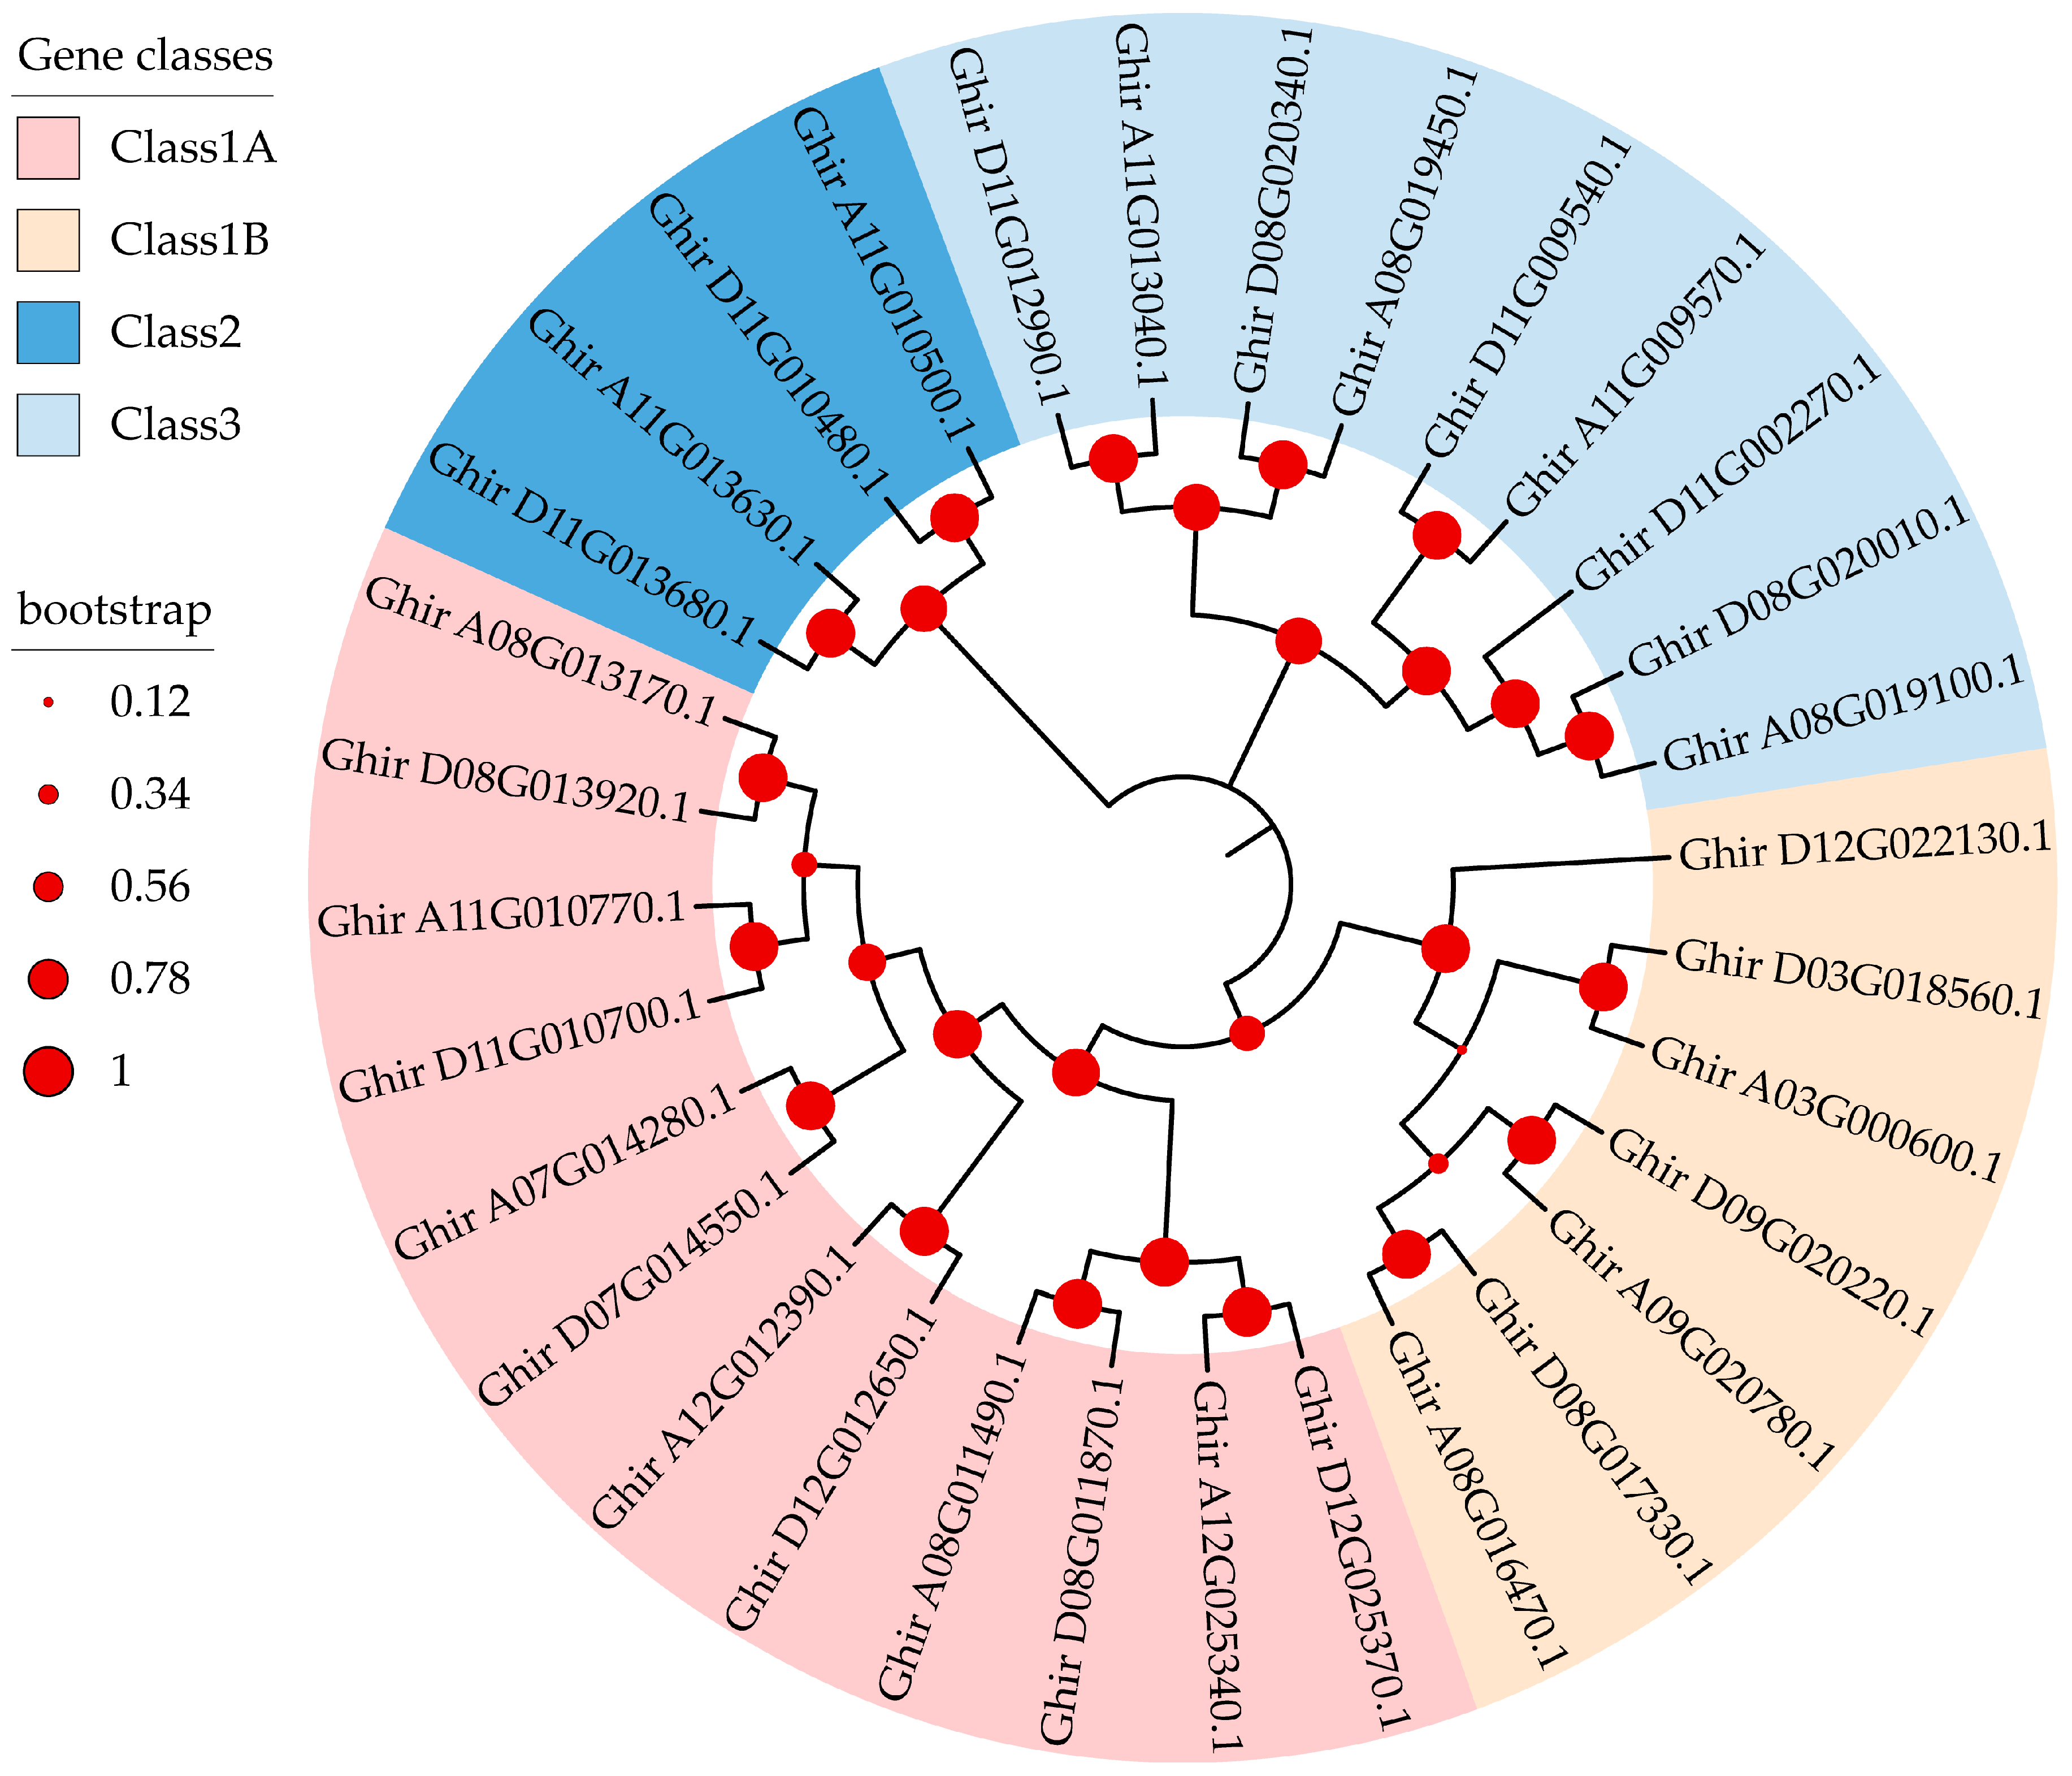
2.2. Phylogenetic Analysis of the MYC Gene Family

To uncover the phylogenetic relationships among the 32 G. hirsutum GhMYCs, the phylogenetic tree was reconstructed using an ML procedure. It showed that GhMYCs are clustered into four groups. There are 12 members in class 1A; 7 members in class 1B; 4 members in class 2; and 9 members in class 3 (Figure 1). Among them, class 1 contains the most members and can be divided into two subgroups, suggesting that class-1 GhMYCs have undergone duplication evolutionary events and gene function divergence. A pairwise comparison of the 32 full-length GhMYC sequences revealed notable features (Figure S1). All class-1 (including 1A and 1B) GhMYCs showed > 35%. The pairwise sequence identity for all class-2 and class-3 GhMYCs was found to be greater than 24%. The box plot revealed that the protein sequence identities of class-1B GhMYCs were significantly higher than those of other classes, except for class-2 MYCs (independent-sample t-test, p < 0.0001) (Figure S1). This suggests that the degree of sequence divergence among class-1A/class-3 MYCs was greater than that among class-1B GhMYCs. It is noteworthy that the protein sequence identities among the class-2 GhMYCs had undergone a substantial alteration, indicating that the degree of sequence divergence among the class-2 GhMYCs was high (Figure S1).

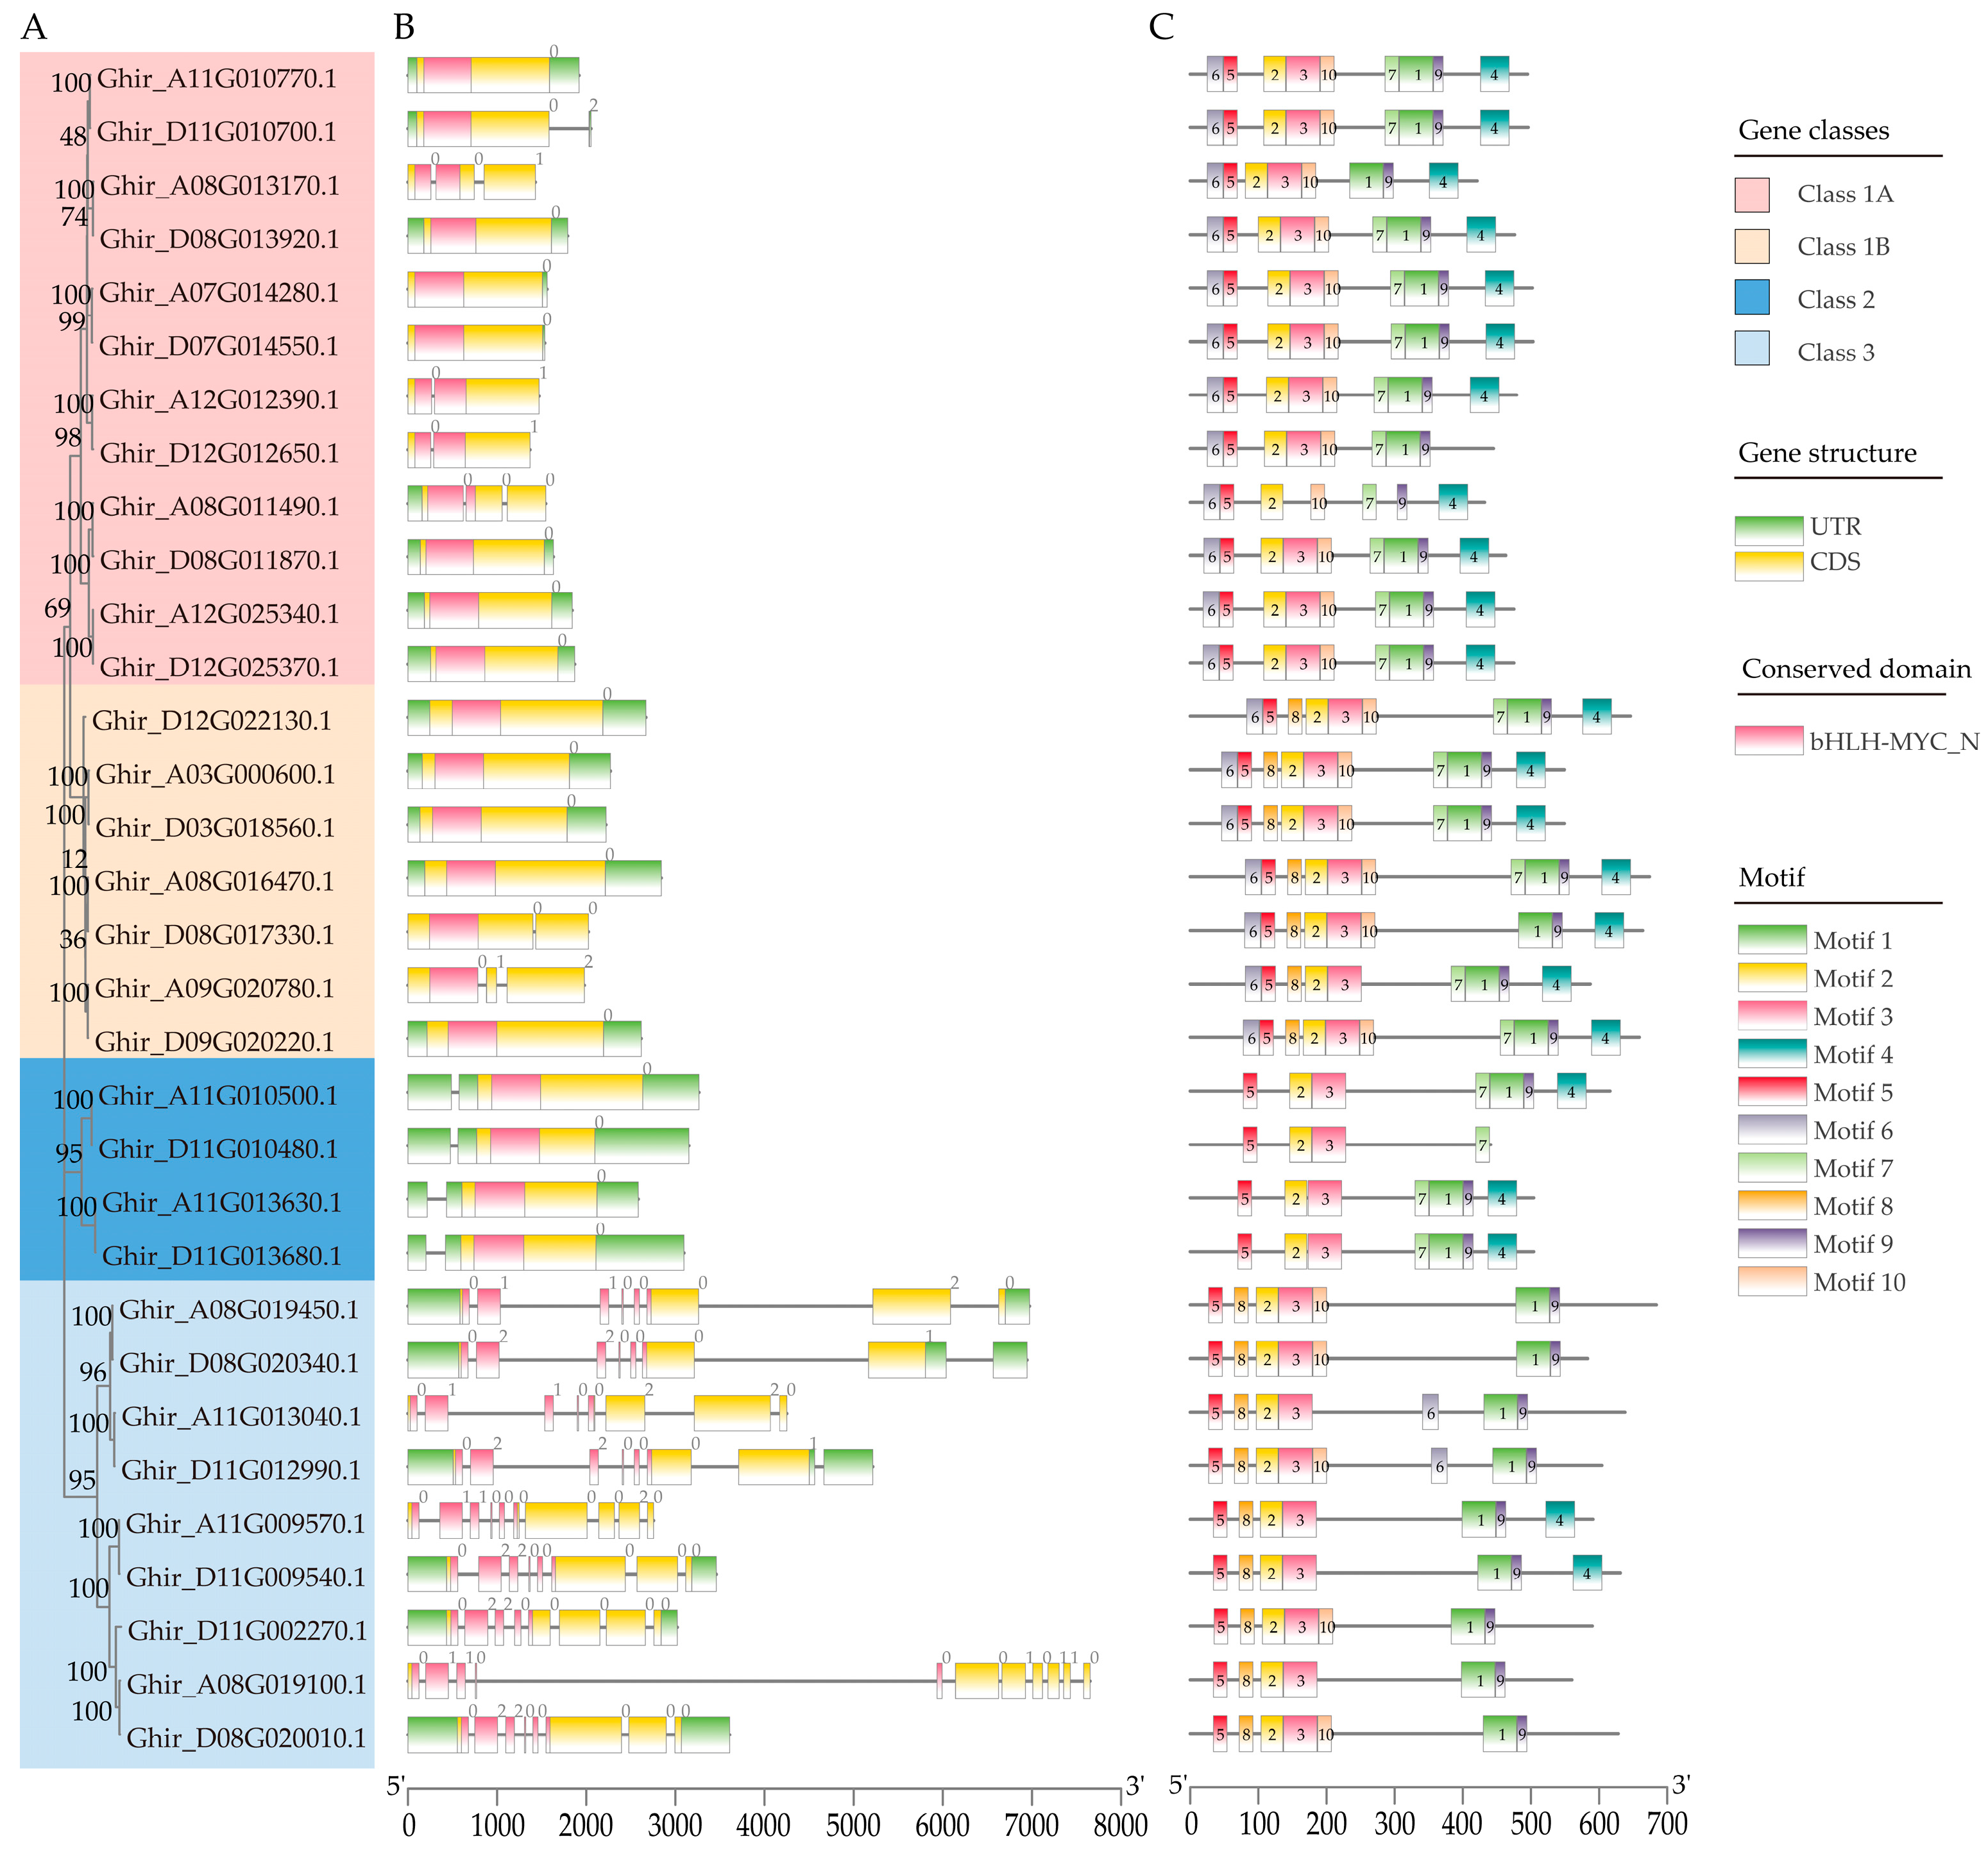
2.3. Analysis of the Structural and Conserved Motifs of GhMYCs

To gain further insight into the evolutionary history of the GhMYC genes, an investigation was conducted into the exon–intron organization, functional domains and conserved motifs of the GhMYCs. The results of this analysis demonstrated that all GhMYCs contain the bHLH-MYC_N domain and that the number of exons present is from zero to ten (Figure 2A,B). Interestingly, the number of exons in class-3 GhMYCs was more than that in other GhMYCs, indicating that there is functional divergence between class-3 GhMYCs and other GhMYCs (Figure 2B). An online MEME analysis was conducted to reveal ten conserved motifs present across the 32 GhMYCs genes (Table S3). There are 10 motifs in class 1B, with Ghir_D08G017330.1 being an exception, featuring only 9 motifs (Figure 2C), while other classes of GhMYCs exhibit 4–9 motifs (Figure 2C). Interestingly, motifs 2 and 5 are distributed in all GhMYCs (Figure 2C). Further analysis revealed that the amino acid with the highest frequency in motif 2 and motif 5 is F (phenylalanine) and W (tryptophan), respectively (Figure S3), which suggests that these amino acids may play vital roles in the function of GhMYCs. Further, the multiple-sequence alignment of all MYC proteins from G. hirsutum, G. barbadense, G. raimondii, A. thaliana, Oryza sativa, Selaginella mollendorffii, Nymphaea colorata, Amborella trichopoda, and Physcomitrella patens showed that hydrophobic core amino acid residues (VALFIs) were observed in almost all MYC protein sequences, indicating that these residues are crucial for the folding and fundamental functions of MYC proteins (Figure S4).
Present studies showed the variations in upstream open reading frame (uORF) shape phenotypic diversity in plants [27]. However, the uORF functions of GhMYCs were still unclear. Based on the method as described by Zhang et al. [28], 18 MYCs were identified in Gossypium raimondii, and the uORF was detected in 12 out of 18 MYC genes in G. raimondii. Then, the homologous relationship with the MYC gene between G. raimondii and G. hirsutum was determined, and it showed that there is the most uORF in Ghir_A11G009570.1/Ghir_D11G009540.1. Interestingly, uORFs were not detected in class-1A GhMYCs, suggesting that class-1A GhMYCs may be functionally divergent by losing the uORF throughout their evolution (Table S4). However, the impact on upland cotton has yet to be explored in future studies.

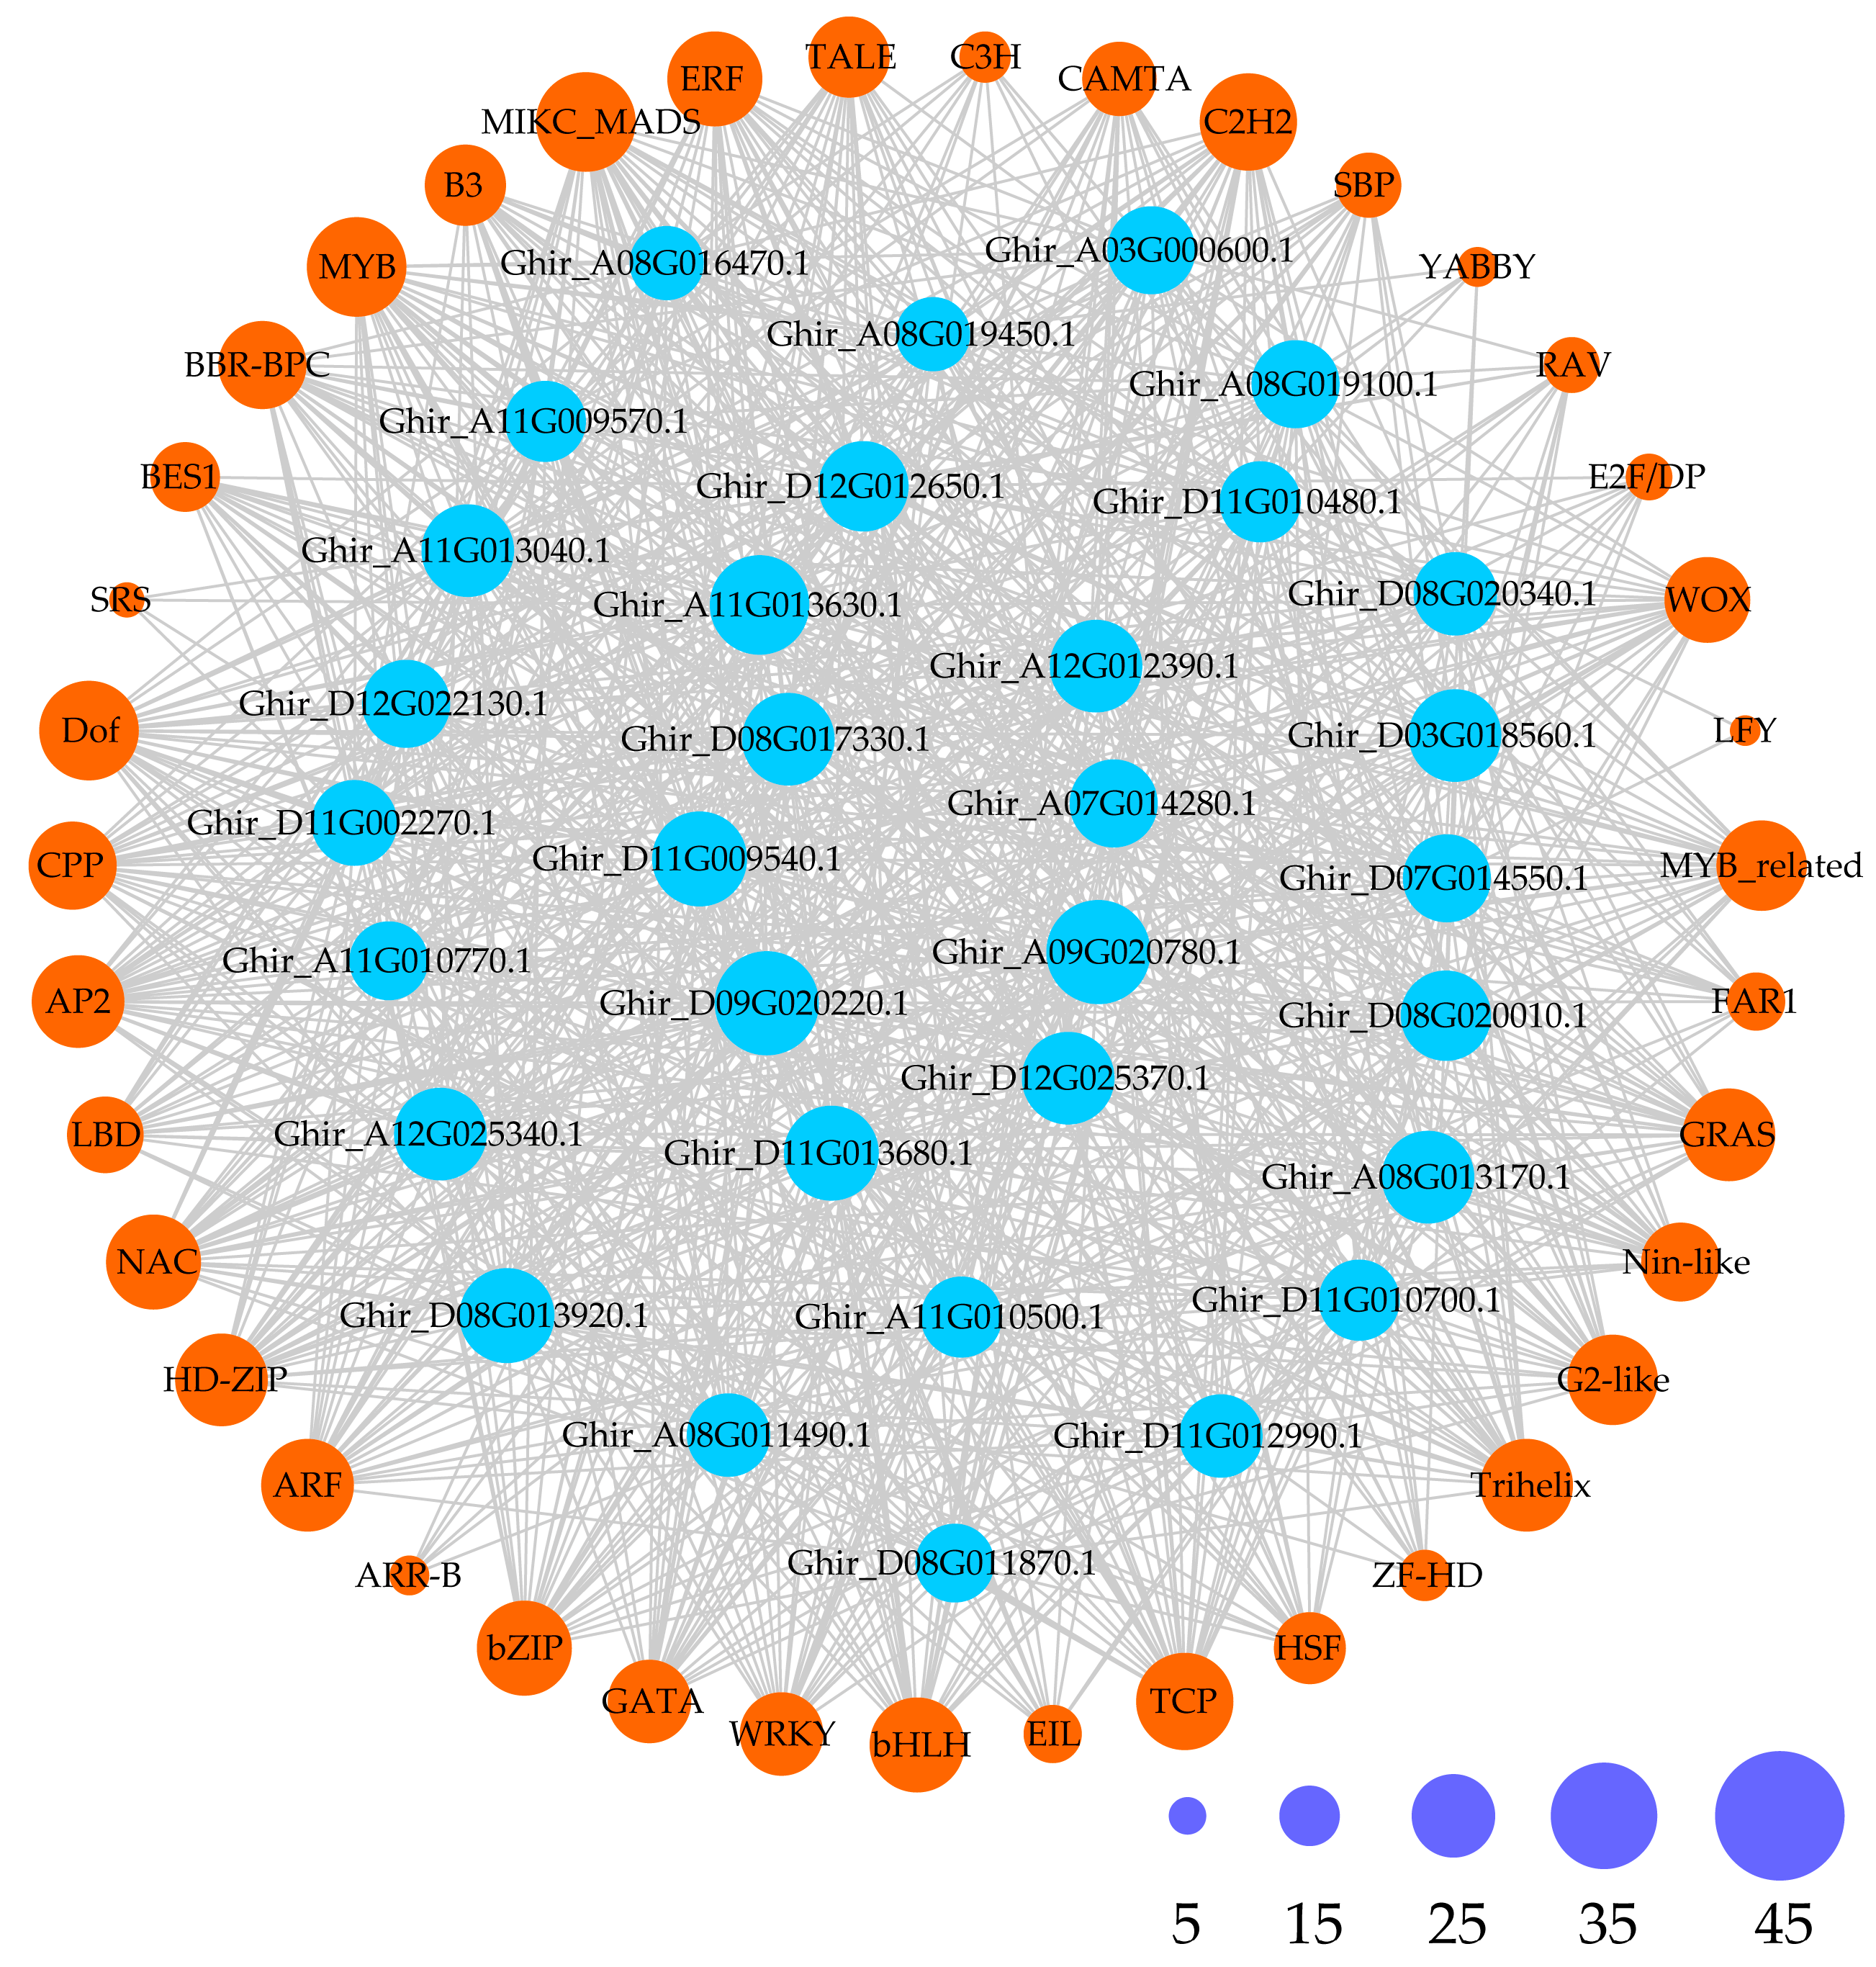
2.4. Prediction of Cis-Acting Elements and Transcription Factors Among the GhMYCs

In order to predict the cis-acting elements among the GhMYCs, the 2000 bp upstream promoter sequence of GhMYCs genes were collected by using TM-1 genome data [29] and analyzed by using PlantCARE. This revealed that a total of 2286 cis-acting elements, representing 27 types, were predicted, and they were divided into seven groups including development-related, environmental stress-related, hormonal response, promoter-related, site binding, and other functional elements (Table S5). Among them, the promoter-related elements group, with 17-85 elements, was the group with the largest number of elements (Figure 3A). There were more elements in class 1A and class 2 than in class 1B or class 3 (Figure 3A). The prediction of 187 hormone-related components was divided into three categories (ABRE, MYC and Myc), the majority of which were related to ABA and JA (Figure 3B), which indicated that GhMYCs might have the potential for self-regulation. There were 140 elements related to light-responsiveness that were predicted in eight categories, including G-box, GT1 motif, AE-box, Gap-box, TCT motif, CAG motif, GATA motif, and GA motif (Figure 3C). Among them, the GT1 motif (47 out of 140) is the most abundant, indicating that the GT1 motif plays an important role in light-responsive GhMYCs.
Furthermore, to provide a comprehensive demonstration of the regulatory network of GhMYCs in upland cotton, the potential TFs of GhMYCs were predicted, which revealed that a total 39 types of transcription factors were predicted to be involved in regulating GhMYC expression (Figure 4 and Table S6). These different GhMYC genes were regulated by a range from 21 to 34 transcription factors. In detail, the number of TFs in each class is as follows: class 1A—23 to 34; class 1B—24 to 30; class 2—25 to 29; class 3—21 to 34 (Table S7). Only the MIKC_MADS, MYB, and Dof transcription factors were conserved in the regulation of all GhMYC expression, indicating that the MIKC_MADS, MYB, and Dof transcription factors play important roles in regulating GhMYC expression (Table S7). Moreover, the specific transcription factor LFY was only present in Ghir_D07G014550 and Ghir_A08G019450. These results indicated that class-3 GhMYCs underwent more intense functional differentiation during evolution.

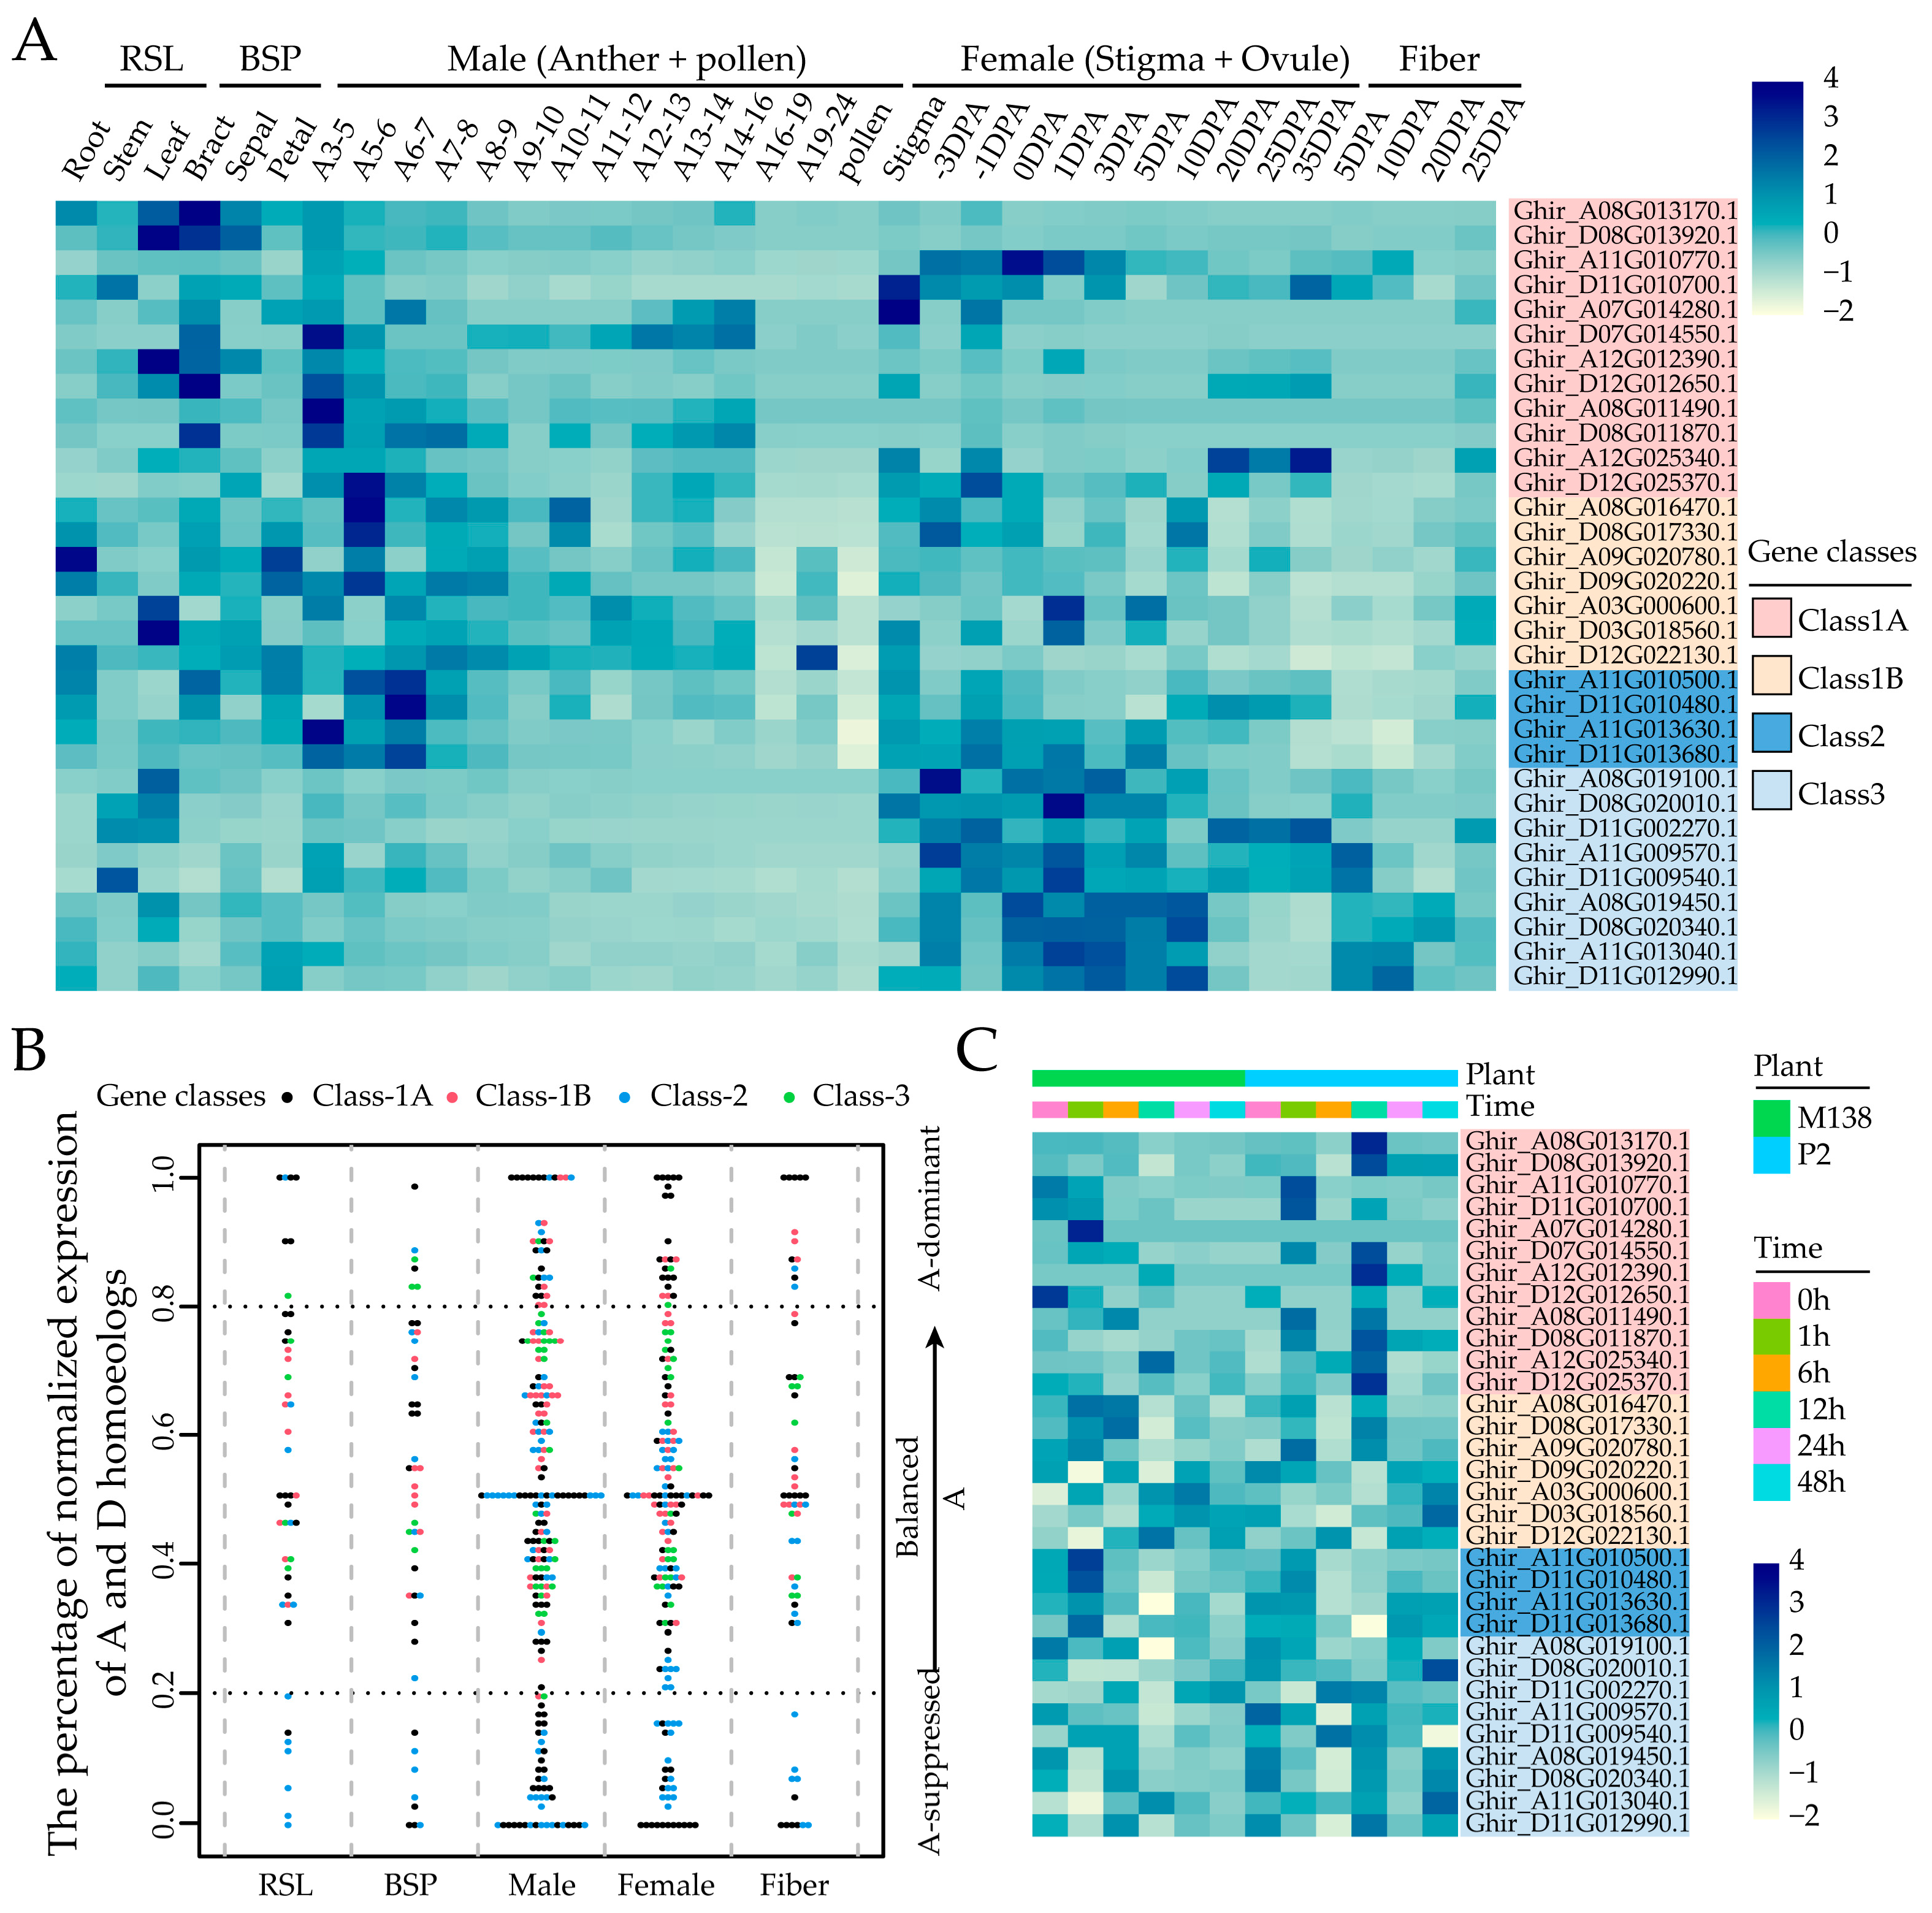
2.5. Tissue Expression Patterns of GhMYCs

To gain a comprehensive understanding of the functions of GhMYCs, the spatial and temporal expression analysis of all GhMYCs was determined using RNA-seq data. This analysis was performed in each of the tissues, including RSL (root, stem, and leaf), BSP (bract, sepal, petal), male (different-stage anthers and pollen), female (stigma and ovule), and fiber (Figure 5A and Table S8). These findings revealed that that GhMYC genes are predominantly expressed in vegetative and female tissues, exhibiting minimal expression in male tissues, particularly in pollen (Figure 5A). Moreover, class-3 GhMYCs genes were found to be predominantly expressed in female tissues, which suggests that class-3 GhMYCs play an important role in female development (Figure 5A).
It is noteworthy that the bias in homeologous expression exhibits variability among tissues within GhMYCs, as observed in tetraploid upland cotton [28,30]. To determine patterns of homeologous expression within GhMYCs, the distribution of GhMYC genes across G. hirsutum chromosomes was investigated, and it was revealed that there is an uneven localization of GhMYCs across the 12 G. hirsutum chromosomes (Figure S5). Then, the gene pairs were identified through collinearity analysis, revealing that a total of 15 gene pairs within GhMYCs were detected, except for Ghir_D12G022130 (Class-1B) and Ghir_D11G002270 (Class-3). These were distributed as follows: six, three, two, and four pairs in class 1A, class 1B, class 2 and class 3, respectively (Figure S5). The bias in the homeologous expression of GhMYCs was analyzed. If the same genes have similar transcript abundance in both sub-genomes, the balanced expression term applies. If there are more or fewer transcripts in one sub-genome, they are A-suppressed or A-dominant. The results demonstrated that most A-suppressed genes were concentrated in class 1A and class 2, whereas the A-dominant genes were distributed across all classes (Figure 5B), which suggests that the gene expression of class-1A and class-2 GhMYCs in the Dt sub-genome may have a direct impact on gene function. Further analysis showed that GhMYC genes were mainly balanced in vegetative and reproductive tissue (Figure 5B), which suggests that the divergence in gene function between the At and Dt sub-genomes is not readily apparent. To gain further insight into the evolutionary process, the Ka/Ks ratios of 15 gene pairs within GhMYCs were calculated as a measure of selection pressure. The results demonstrated that the Ka/Ks ratios of the GhMYCs homeologous pairs exhibited a range from 0.0825 to 1.0902 (Table S9). Among them, only the pair Ghir_A12G012390 and Ghir_D12G012650 demonstrated positive selection with a Ka/Ks ratio greater than 1. The other GhMYC homeologous pairs were subjected to significant purification during the evolutionary process, with the pair Ghir_A12G025340 and Ghir_D12G0225370 undergoing the most pronounced changes. Interestingly, these two pairs were classified as class 1A, indicating that a substantial evolutionary shift has occurred within class 1A.

2.6. Expression of GhMYCs Under Biotic Stress

To explore whether GhMYCs are involved in the response to V. dahliae and A. gossypii, the expression patterns of GhMYCs in cotton plants infiltrated with V. dahliae (V991) and A. gossypii were examined, revealing that the gene expression of GhMYC genes, expect for class 2, exhibited a higher expression in the V. dahliae-susceptible cotton cultivar (P2) than in the V. dahliae-resistant cotton cultivar (M138) 12 h after infection with V991 (Figure 5C and Table S10), which suggests that the GhMYCs in class 1 and class 3 played a role in the resistance of cotton to verticillium wilt as a negative regulator. The expression pattern analysis of GhMYCs after infection with A. gossypii showed that only class-1A genes (Ghir_A07G014280 and Ghir_D08G011870) and class-3 (Ghir_A08G019100) GhMYC genes were observed to be more highly expressed in the aphid-susceptible G. hirsutum cultivar (Z50) than in the aphid-resistant G. hirsutum cultivar (Z61), revealing that the GhMYCs in class 1 and class 3 played a role in the response to A. gossypii as a negative regulator (Table S11). These results showed that the GhMYCs in classes 1 and 3 (particularly Ghir_A07G014280, Ghir_D08G011870 and Ghir_A08G019100) function as negative regulators, playing a role in resistance to verticillium wilt and aphids. However, further experiments are required to confirm these findings.

3. Discussion

3.1. The Conserved Motif and Sequence Characterization of GhMYCs

The MYC protein family plays a key role in a multitude of physiological development processes, including plant growth, development, flower induction, secondary metabolite production, and defense responses [4,8]. Consequently, they represent promising targets for crop breeding and improvement. However, relatively few studies have documented the function of the MYC gene family. In this study, a total of thirty-two predicted GhMYCs genes were identified and assigned to three conserved subfamilies (Figure 1). Further, the structural domains of GhMYCs were found to be conserved, displaying characteristics of instability and hydrophilicity and exhibiting nuclear localization (Figure 2). These features are likely to be typical of MYC proteins, as evidenced by the phylogenetic tree, the gene structure, and the analysis of the conserved motifs. These results suggested that GhMYCs have evolutionarily conserved functions during evolution and may play a crucial role in a multitude of physiological development processes. Class-1B GhMYCs are homologous to MYC2, which has been reported most recently [10,21,31]. Interestingly, the pairwise sequence identity of class 1B, with the most abundant motifs, was highest, which indicated that class-1B MYCs have evolutionarily conserved functions and may play a central role in defense responses. On the contrary, the results of the number of exons and regulated transcription factors in class 3 showed that there is a functional divergence between class-3 GhMYCs and other GhMYCs (Figure 2B), and uORFs were not detected in class-1A GhMYCs, suggesting that class-1A GhMYCs may be functionally divergent by losing the uORF throughout their evolution (Table S4). This structural basis underpins the functional diversity of the MYC gene family. Furthermore, the GT1 motif is the most abundant, indicating that the GT1 motif of GhMYCs plays a pivotal role in light-responsive processes, which indicates that GhMYCs may play an important role in light-responsive mechanisms. However, more experiments are needed in the future.

3.2. Function Analysis of GhMYC Genes Based on Gene Expression Pattern

Cotton is one of the world’s most significant cash crops, a unique commodity, and a crucial strategic material for national economic advancement [32]. However, it is often subjected to a multitude of biotic stresses, including Verticillium wilt, aphids, cotton bollworm, red spider, and so on [33,34]. Present studies showed that MYCs play an important role in the defense responses of plants to biotic stresses [4,14,17]. Resistance to F. necrotrophic wilt was enhanced in myc2 mutants [6]. Moreover, it has been shown that the increased expression of OsMYC2 in response to biological stress leads to the up-regulation of PR genes, thereby imparting resistance to rice against bacterial blight [14]. In this study, the expression pattern analysis showed that GhMYCs in classes 1 and 3 (particularly Ghir_A07G014280, Ghir_D08G011870, and Ghir_A08G019100), which function as negative regulators, play a role in resistance to verticillium wilt and aphids (Figure 5). These results provide genetic resources for cotton resistance breeding to verticillium wilt and aphids.
Moreover, the bias analysis of the homeologous expression in GhMYCs showed that the class-3 GhMYCs genes were found to be predominantly expressed in female tissues, which suggests that class-3 GhMYCs play an important role in female development (Figure 5A), and the gene expression of class-1A and class-2 GhMYCs in the Dt sub-genome may have a direct impact on gene function. As described by previous studies, gene expression and domestication bias existed in the cotton subgroups At and Dt [30,35]. However, more experiments are needed to confirm the function, gene expression, and domestication bias of GhMYCs in the future.

4. Conclusions

In this study, the gene structure, conserved motifs, and uORFs of GhMYCs in upland cotton were identified. Moreover, the expression patterns of GhMYCs under biotic stresses, including V. dahliae and A. gossypii, and the homeologous expression bias within GhMYCs were evaluated. There results provide a research direction for researchers and breeders to enhance cotton traits through manipulating individual or multiple homeologs, which lays a foundation for further study of the molecular characteristics and biological functions of the GhMYC gene.

5. Materials and Methods

5.1. Identification of the MYC Gene Family

To identify the MYC gene family in G. hirsutum, MYC protein sequences of A. thaliana (AT1G01260) were used as queries in InterPro (http://www.ebi.ac.uk/interpro/). Then, the candidate genes in G. hirsutum were used as queries in a BLAST search (score > 50, E-value < 0.01) in cottongen (https://www.cottongen.org/, accessed on 25 February 2024) with the G. hirsutum TM-1 genome [29]. Then, the gene sequence and location information were also derived from the TM-1 genome [29]. The NCBI’s Batch CD-Search function (https://www.ncbi.nlm.nih.gov/Structure/bwrpsb/bwrpsb.cgi, accessed on 27 February 2024) was employed to corroborate the presence of the characteristic bHLH-MYC_N domain (NCBI, cd13983) in the candidate MYC genes. Among them, the genes with an incomplete bHLH-MYC_N domain were eliminated. The characteristics of the MYC gene candidates in G. hirsutum, including their protein length, isoelectric point (pI), and molecular weight (MW), were calculated using ExPASy tools, facilitated by TBtools. Additionally, the subcellular localization of these proteins was forecasted using the Plant-mPLoc algorithm.

5.2. Phylogenetic Analysis and Molecular Evolution Analyses

The sequences of the MYC kinase gene family in G. hirsutum were sourced from cottongen. A comprehensive alignment of the complete protein sequences of the GhMYC gene family was conducted using Clustal-X version 1.8 [36]. Subsequently, a phylogenetic tree was constructed using the maximum likelihood (ML) method, with the following options enabled: the Jones–Taylor–Thornton (JTT) amino acid substitution model, γ-distributed rates among sites, and 1000 bootstrap replicates in MEGA-X (https://www.megasoftware.net/, accessed on 17 April 2024). Finally, the tree was further annotated and beautified by using iTOL (https://itol.embl.de/, accessed on 16 May 2024) [37]. Moreover, the MYC gene family derived from G. barbadense, G. raimondii, A. thaliana, O. sativa, S. moellendorffii, N. colorata, A. trichopoda, and P. patens was identified from Ensembl Plants (https://plants.ensembl.org/info/data/ftp/index.html, accessed on 21 June 2024) [38], and multiple-sequence alignment was performed as described above. The rates of synonymous (Ks) and nonsynonymous (Ka) substitutions for pairwise comparisons within the GhMYC gene family were determined using the PAML package [39,40].

5.3. Multiple Sequence Alignment of MYC Proteins

The protein sequences of members of the MYC family were employed to generate a multiple-sequence alignment and to conduct visualization analyses using Clustal-X (http://www.clustal.org/, accessed on 28 June 2024) and Jalview, respectively.

5.4. Analysis of Conserved Motifs, Gene Structure, Functional Domains, and 3D Structure

The conserved motifs within the GhMYCs gene family were identified using the MEME program [41], adhering to its default settings and specifying a maximum of 10 motifs to be detected. The GFF3 data of the GhMYCs proteins and the reference genome of G. hirsutum [29] were downloaded from cottongen. Then, the gene structure and functional domains were subjected to analysis and visualization utilizing the NCBI Batch CD-Search [42] and TBtools. In order to acquire the three-dimensional structure of GhMYC proteins, the GhMYC protein sequences were submitted to SWISS-MODEL (https://swissmodel.expasy.org/) with default algorithm parameters.
The uORFs of MYCs were detected using uORFlight (http://www.rnairport.com:443/Tool_uORFFinder.php, accessed on 17 August 2024) [43]. The uORFs of GhMYCs were detected using sequences for ICCu (initiation codon context for upstream open reading frames) and ICCm (initiation codon context for major open reading frames).

5.5. Promoter Cis-Acting Elements and TF Prediction

To identify the cis-acting elements that act as promoters for the GhMYCs genes, the promoter sequence of the genes, which had a length of 2000 bp, was obtained. Following this, the sequence was predicted by PlantCARE [44] and visualized by TBtools. Additionally, the transcription factors associated with GhMYC genes were forecasted using PlantRegMap, focusing on A. thaliana as the reference species. Cytoscape 3.6.0 software was employed for the visualization of the target relationships between transcription factors and GhMYCs [45].

5.6. Gene Expression Analysis

The tissue expression data of GhMYCs were downloaded from Zhang et al. (2022) [46] and visualized using R (https://www.r-project.org/). Subsequently, the homologous gene expression bias of GhMYCs was determined in accordance with the methodology described by Ramírez-González et al. (2018) [47]. Furthermore, the expression patterns of infiltration with V. dahliae (V991) and A. gossypii were obtained from the literature [34,48]. The cultivars M138 and P2 were derived from a MAGIC population and were selected as representatives of V. dahliae-resistant and -susceptible cotton, respectively. Xinluzao 61 and Xinluzao 50 were selected as representatives of aphid-resistant and -susceptible G. hirsutum, respectively.

Supplementary Materials

The following supporting information can be downloaded at: https://www.mdpi.com/article/10.3390/genes16010020/s1, Figure S1. Pairwise sequence identity of full-length MYC proteins. A, B, C, and D represent pairwise sequence identities of class-1A, class-1B, class-2, and class-3 MYC proteins, respectively. AB, AC, AD, BC, BD, and CD represent pairwise sequence identities between class-1A and -1B MYC proteins, class-1A and -2 MYC proteins, class-1A and -3 PG proteins, class-1B and -2 MYC proteins, class-1B and -3 MYC proteins, and class-2 and -3 MYC proteins. The box plot shows the median (black line) and interquartile range (box). Outliers are shown as circles outside of the whiskers. Figure S2. The 3D structure of MYC proteins. The 3D structure of class-1A (A), class-1B (B), class-2 (C), and class-3 (D) in the At sub-genome and part of the Dt sub-genome are shown. Figure S3. The sequence of motifs in GhMYCs. A total of 10 conserved motifs were identified in GhMYCs, and the sequence of motifs are shown. Figure S4. The conserved sequence of MYC proteins from the nine plant species. A total of 147 MYC proteins from G. hirsutum, G. barbadense, G. raimondii, A. thaliana, O. sativa, S. mollendorffii, N. colorata, A. trichopoda, and P. patens were used to perform multiple sequence alignment and visualization by using Clustal-x, and Jalview. The amino acid residues in the MYCs are colored. Red arrows indicate highly conserved positions of VALFI (hydrophobic core amino acid residues) residues. Figure S5. Genomic localization and collinearity analysis of GhMYCs. The genomic localization and collinearity analysis of GhMYCs are shown in the At sub-genome and part of the Dt sub-genome of the cotton genome by using PAML.

Author Contributions

J.C. and L.W. contributed to formal analysis, L.X. and H.W. collected resources, M.H., C.Z., P.H. and L.L. performed software processing, X.W. and Z.L. analyzed the data, S.X. is in charge of data curation, H.L. validation the data. J.C. and L.W. wrote the manuscript. X.N. and Y.W. revised the manuscript. All authors have read and agreed to the published version of the manuscript.

Funding

This research was financially backed by several sources, including the “Tianchi Talents” Introduction Plan (CZ006020), the Shihezi University Youth Innovative Talent Program (KX03090401), the Shihezi University High-level Talent Research Project (RCZK202337), the development fund for Xinjiang talents XL (XL202401-09), “Tianshan Talents” Program for the Top Young Innovative Talents (2023TSYCCX0117), and the earmarked fund for XJARS-03-16.

Institutional Review Board Statement

Not applicable.

Informed Consent Statement

Not applicable.

Data Availability Statement

All data generated or analyzed during this study are included in this published article and its additional files. The datasets used and analyzed during the current study are available from the corresponding author on reasonable request.

Acknowledgments

We would like to express our gratitude to the Cotton Genetic Improvement Team at Huazhong Agricultural University for their invaluable support in this project. We thank doc. Chengjie Chen for developing the TBtools tool.

Conflicts of Interest

The authors declare no conflicts of interest.

References

  1. Lüscher, B.; Eisenman, R.N. New light on Myc and Myb. Part II. Myb. Genes. Dev. 1990, 4, 2235–2241. [Google Scholar] [CrossRef]
  2. Boter, M.; Ruiz-Rivero, O.; Abdeen, A.; Prat, S. Conserved MYC transcription factors play a key role in jasmonate signaling both in tomato and Arabidopsis. Genes Dev. 2004, 18, 1577–1591. [Google Scholar] [CrossRef]
  3. Chini, A.; Fonseca, S.; Chico, J.M.; Fernández-Calvo, P.; Solano, R. The ZIM domain mediates homo- and heteromeric interactions between Arabidopsis JAZ proteins. Plant J. 2009, 59, 77–87. [Google Scholar] [CrossRef] [PubMed]
  4. Ruan, J.; Zhou, Y.; Zhou, M.; Yan, J.; Khurshid, M.; Weng, W.; Cheng, J.; Zhang, K. Jasmonic Acid Signaling Pathway in Plants. Int. J. Mol. Sci. 2019, 20, 2479. [Google Scholar] [CrossRef]
  5. Ren, Y.; Zou, W.; Feng, J.; Zhang, C.; Su, W.; Zhao, Z.; Wang, D.; Sun, T.; Wang, W.; Cen, G.; et al. Characterization of the sugarcane MYC gene family and the negative regulatory role of ShMYC4 in response to pathogen stress. Ind. Crops Prod. 2022, 176, 114292. [Google Scholar] [CrossRef]
  6. Anderson, J.P.; Badruzsaufari, E.; Schenk, P.M.; Manners, J.M.; Desmond, O.J.; Ehlert, C.; Maclean, D.J.; Ebert, P.R.; Kazan, K. Antagonistic interaction between abscisic acid and jasmonate-ethylene signaling pathways modulates defense gene expression and disease resistance in Arabidopsis. Plant Cell 2004, 16, 3460–3479. [Google Scholar] [CrossRef] [PubMed]
  7. Schweizer, F.; Fernandez-Calvo, P.; Zander, M.; Diez-Diaz, M.; Fonseca, S.; Glauser, G.; Lewsey, M.G.; Ecker, J.R.; Solano, R.; Reymond, P. Arabidopsis basic helix-loop-helix transcription factors MYC2, MYC3, and MYC4 regulate glucosinolate biosynthesis, insect performance, and feeding behavior. Plant Cell 2013, 25, 3117–3132. [Google Scholar] [CrossRef]
  8. Abe, H.; Urao, T.; Ito, T.; Seki, M.; Shinozaki, K.; Yamaguchi-Shinozaki, K. Arabidopsis AtMYC2 (bHLH) and AtMYB2 (MYB) function as transcriptional activators in abscisic acid signaling. Plant Cell. 2003, 15, 63–78. [Google Scholar] [CrossRef]
  9. Knight, H.; Zarka, D.G.; Okamoto, H.; Thomashow, M.F.; Knight, M.R. Abscisic acid induces CBF gene transcription and subsequent induction of cold-regulated genes via the CRT promoter element. Plant Physiol. 2004, 135, 1710–1717. [Google Scholar] [CrossRef]
  10. Verma, D.; Jalmi, S.K.; Bhagat, P.K.; Verma, N.; Sinha, A.K. A bHLH transcription factor, MYC2, imparts salt intolerance by regulating proline biosynthesis in Arabidopsis. FEBS Lett. 2020, 287, 2560–2576. [Google Scholar] [CrossRef]
  11. Bhadouriya, S.L.; Suresh, A.; Gupta, H.; Mehrotra, S.; Gupta, D.; Mehrotra, R. In Silico Analysis of CCGAC and CATGTG Cis-regulatory Elements Across Genomes Reveals their Roles in Gene Regulation under Stress. Curr. Genom. 2021, 22, 353–362. [Google Scholar] [CrossRef]
  12. Lahiri, A.; Zhou, L.; He, P.; Datta, A. Detecting drought regulators using stochastic inference in Bayesian networks. PLoS ONE 2021, 16, e0255486. [Google Scholar] [CrossRef] [PubMed]
  13. Li, Z.; Huang, Y.; Shen, Z.; Wu, M.; Huang, M.; Hong, S.B.; Xu, L.; Zang, Y. Advances in functional studies of plant MYC transcription factors. Theor. Appl. Genet. 2024, 137, 195. [Google Scholar] [CrossRef] [PubMed]
  14. Uji, Y.; Taniguchi, S.; Tamaoki, D.; Shishido, H.; Akimitsu, K.; Gomi, K. Overexpression of OsMYC2 Results in the Up-Regulation of Early JA-Rresponsive Genes and Bacterial Blight Resistance in Rice. Plant Cell Physiol. 2016, 57, 1814–1827. [Google Scholar] [CrossRef] [PubMed]
  15. Liu, Y.; Du, M.; Deng, L.; Shen, J.; Fang, M.; Chen, Q.; Lu, Y.; Wang, Q.; Li, C.; Zhai, Q. MYC2 Regulates the Termination of Jasmonate Signaling via an Autoregulatory Negative Feedback Loop. Plant Cell 2019, 31, 106–127. [Google Scholar] [CrossRef]
  16. Wang, G.; Wang, F.; Xu, Z.; Wang, Y.; Zhang, C.; Zhou, Y.; Hui, F.; Yang, X.; Nie, X.; Zhang, X.; et al. Precise fine-turning of GhTFL1 by base editing tools defines ideal cotton plant architecture. Genome Biol. 2024, 25, 59. [Google Scholar] [CrossRef]
  17. Johnson, L.Y.D.; Major, I.T.; Chen, Y.; Yang, C.; Vanegas-Cano, L.J.; Howe, G.A. Diversification of JAZ-MYC signaling function in immune metabolism. New Phytol. 2023, 239, 2277–2291. [Google Scholar] [CrossRef]
  18. Wang, H.; Li, S.; Li, Y.; Xu, Y.; Wang, Y.; Zhang, R.; Sun, W.; Chen, Q.; Wang, X.J.; Li, C.; et al. MED25 connects enhancer-promoter looping and MYC2-dependent activation of jasmonate signalling. Nat. Plants 2019, 5, 616–625. [Google Scholar] [CrossRef] [PubMed]
  19. Valenzuela, C.E.; Acevedo-Acevedo, O.; Miranda, G.S.; Vergara-Barros, P.; Holuigue, L.; Figueroa, C.R.; Figueroa, P.M. Salt stress response triggers activation of the jasmonate signaling pathway leading to inhibition of cell elongation in Arabidopsis primary root. J. Exp. Bot. 2016, 67, 4209–4220. [Google Scholar] [CrossRef]
  20. Zhao, W.; Huang, H.; Wang, J.; Wang, X.; Xu, B.; Yao, X.; Sun, L.; Yang, R.; Wang, J.; Sun, A.; et al. Jasmonic acid enhances osmotic stress responses by MYC2-mediated inhibition of protein phosphatase 2C1 and response regulators 26 transcription factor in tomato. Plant J. 2023, 113, 546–561. [Google Scholar] [CrossRef]
  21. Liu, H.; Cui, P.; Zhang, B.; Zhu, J.; Liu, C.; Li, Q. Binding of the transcription factor MYC2-like to the ABRE of the OsCYP2 promoter enhances salt tolerance in Oryza sativa. PLoS ONE 2022, 17, e0276075. [Google Scholar] [CrossRef] [PubMed]
  22. Li, Y.; Zhu, J.; Xu, J.; Zhang, X.; Xie, Z.; Li, Z. Effect of cold stress on photosynthetic physiological characteristics and molecular mechanism analysis in cold-resistant cotton (ZM36) seedlings. Front. Plant Sci. 2024, 15, 1396666. [Google Scholar] [CrossRef]
  23. Wang, R.; Yu, M.; Xia, J.; Xing, J.; Fan, X.; Xu, Q.; Cang, J.; Zhang, D. Overexpression of TaMYC2 confers freeze tolerance by ICE-CBF-COR module in Arabidopsis thaliana. Front. Plant Sci. 2022, 13, 1042889. [Google Scholar] [CrossRef]
  24. Zhao, M.L.; Wang, J.N.; Shan, W.; Fan, J.G.; Kuang, J.F.; Wu, K.Q.; Li, X.P.; Chen, W.X.; He, F.Y.; Chen, J.Y.; et al. Induction of jasmonate signalling regulators MaMYC2s and their physical interactions with MaICE1 in methyl jasmonate-induced chilling tolerance in banana fruit. Plant Cell Environ. 2013, 36, 30–51. [Google Scholar] [CrossRef]
  25. Wang, Y.; Xu, H.; Liu, W.; Wang, N.; Qu, C.; Jiang, S.; Fang, H.; Zhang, Z.; Chen, X. Methyl jasmonate enhances apple’ cold tolerance through the JAZ–MYC2 pathway. Plant Cell Tissue Organ Cult. 2018, 136, 75–84. [Google Scholar] [CrossRef]
  26. Gao, C.; Qi, S.; Liu, K.; Li, D.; Jin, C.; Li, Z.; Huang, G.; Hai, J.; Zhang, M.; Chen, M. MYC2, MYC3, and MYC4 function redundantly in seed storage protein accumulation in Arabidopsis. Plant Physiol. Biochem. 2016, 108, 63–70. [Google Scholar] [CrossRef]
  27. Wang, J.; Liu, J.; Guo, Z. Natural uORF variation in plants. Trends Plant Sci. 2024, 29, 290–302. [Google Scholar] [CrossRef] [PubMed]
  28. Zhang, Q.; Zhang, C.; Pan, Z.; Lin, H.; Li, Z.; Hou, X.; Liu, J.; Nie, X.; Wu, Y. Genome-Wide Identification and Analysis of the WNK Kinase Gene Family in Upland Cotton. Plants 2023, 12, 4036. [Google Scholar] [CrossRef] [PubMed]
  29. Wang, M.; Tu, L.; Yuan, D.; Zhu, D.; Shen, C.; Li, J.; Liu, F.; Pei, L.; Wang, P.; Zhao, G.; et al. Reference genome sequences of two cultivated allotetraploid cottons, Gossypium hirsutum and Gossypium barbadense. Nat. Genet. 2019, 51, 224–229. [Google Scholar] [CrossRef]
  30. Wang, M.; Tu, L.; Lin, M.; Lin, Z.; Wang, P.; Yang, Q.; Ye, Z.; Shen, C.; Li, J.; Zhang, L.; et al. Asymmetric subgenome selection and cis-regulatory divergence during cotton domestication. Nat. Genet. 2017, 49, 579–587. [Google Scholar] [CrossRef]
  31. Ma, C.; Li, R.; Sun, Y.; Zhang, M.; Li, S.; Xu, Y.; Song, J.; Li, J.; Qi, J.; Wang, L.; et al. ZmMYC2s play important roles in maize responses to simulated herbivory and jasmonate. J. Integr. Plant Biol. 2023, 65, 1041–1058. [Google Scholar] [CrossRef]
  32. Wu, Y.; Li, X.; Li, Y.; Ma, H.; Chi, H.; Ma, Y.; Yang, J.; Xie, S.; Zhang, R.; Liu, L.; et al. Degradation of de-esterified pctin/homogalacturonan by the polygalacturonase GhNSP is necessary for pollen exine formation and male fertility in cotton. Plant Biotechnol. J. 2022, 20, 1054–1068. [Google Scholar] [CrossRef]
  33. Zhang, Y.; Chen, B.; Sun, Z.; Liu, Z.; Cui, Y.; Ke, H.; Wang, Z.; Wu, L.; Zhang, G.; Wang, G.; et al. A large-scale genomic association analysis identifies a fragment in Dt11 chromosome conferring cotton Verticillium wilt resistance. Plant Biotechn. J. 2021, 19, 2126–2138. [Google Scholar] [CrossRef] [PubMed]
  34. An, Q.; Pan, Z.; Aini, N.; Han, P.; Wu, Y.; You, C.; Nie, X. Identification of candidate genes for aphid resistance in upland cotton by QTL mapping and expression analysis. Crop J. 2023, 11, 1600–1604. [Google Scholar] [CrossRef]
  35. You, J.; Liu, Z.; Qi, Z.; Ma, Y.; Sun, M.; Su, L.; Niu, H.; Peng, Y.; Luo, X.; Zhu, M.; et al. Regulatory controls of duplicated gene expression during fiber development in allotetraploid cotton. Nat. Genet. 2023, 55, 1987–1997. [Google Scholar] [CrossRef] [PubMed]
  36. Larkin, M.A.; Blackshields, G.; Brown, N.P.; Chenna, R.; McGettigan, P.A.; McWilliam, H.; Valentin, F.; Wallace, I.M.; Wilm, A.; Lopez, R.; et al. Clustal W and Clustal X. version 2.0. Bioinformatics 2007, 23, 2947–2948. [Google Scholar] [CrossRef] [PubMed]
  37. Letunic, I.; Bork, P. Interactive Tree Of Life (iTOL): An online tool for phylogenetic tree display and annotation. Bioinformatics 2006, 23, 127–128. [Google Scholar] [CrossRef]
  38. Kersey, P.J.; Allen, J.E.; Allot, A.; Barba, M.; Boddu, S.; Bolt, B.J.; Carvalho-Silva, D.; Christensen, M.; Davis, P.; Grabmueller, C.; et al. Ensembl Genomes 2018: An integrated omics infrastructure for non-vertebrate species. Nucleic Acids Res. 2018, 46, D802–D808. [Google Scholar] [CrossRef] [PubMed]
  39. Li, X.; Wu, Y.; Chi, H.; Wei, H.; Wang, H.; Yu, S. Genomewide Identification and Characterization of the Genes Involved in the Flowering of Cotton. Int. J. Mol. Sci. 2022, 23, 7940. [Google Scholar] [CrossRef] [PubMed]
  40. Yang, Z. PAML 4: Phylogenetic analysis by maximum likelihood. Mol. Biol. Evol. 2007, 24, 1586–1591. [Google Scholar] [CrossRef]
  41. Marchler-Bauer, A.; Derbyshire, M.K.; Gonzales, N.R.; Lu, S.; Chitsaz, F.; Geer, L.Y.; Geer, R.C.; He, J.; Gwadz, M.; Hurwitz, D.I.; et al. CDD: NCBI’s conserved domain database. Nucleic Acids Res. 2014, 43, D222–D226. [Google Scholar] [CrossRef]
  42. Marchler-Bauer, A.; Bo, Y.; Han, L.; He, J.; Lanczycki, C.J.; Lu, S.; Chitsaz, F.; Derbyshire, M.K.; Geer, R.C.; Gonzales, N.R.; et al. CDD/SPARCLE: Functional classification of proteins via subfamily domain architectures. Nucleic Acids Res. 2016, 45, D200–D203. [Google Scholar] [CrossRef] [PubMed]
  43. Niu, R.; Zhou, Y.; Zhang, Y.; Mou, R.; Tang, Z.; Wang, Z.; Zhou, G.; Guo, S.; Yuan, M.; Xu, G. uORFlight: A vehicle toward uORF-mediated translational regulation mechanisms in eukaryotes. Database 2020, 2020, baaa007. [Google Scholar] [CrossRef] [PubMed]
  44. Lescot, M.; Déhais, P.; Thijs, G.; Marchal, K.; Moreau, Y.; Van de Peer, Y.; Rouzé, P.; Rombauts, S. PlantCARE, a database of plant cis-acting regulatory elements and a portal to tools for in silico analysis of promoter sequences. Nucleic Acids Res. 2002, 30, 325–327. [Google Scholar] [CrossRef] [PubMed]
  45. Jin, J.; Tian, F.; Yang, D.-C.; Meng, Y.-Q.; Kong, L.; Luo, J.; Gao, G. PlantTFDB 4.0: Toward a central hub for transcription factors and regulatory interactions in plants. Nucleic Acids Res. 2016, 45, D1040–D1045. [Google Scholar] [CrossRef] [PubMed]
  46. Zhang, R.; Zhou, L.; Li, Y.; Ma, H.; Li, Y.; Ma, Y.; Lv, R.; Yang, J.; Wang, W.; Alifu, A.; et al. Rapid Identification of Pollen- and Anther-Specific Genes in Response to High-Temperature Stress Based on Transcriptome Profiling Analysis in Cotton. Int. J. Mol. Sci. 2022, 23, 3378. [Google Scholar] [CrossRef]
  47. Ramirez-Gonzalez, R.H.; Borrill, P.; Lang, D.; Harrington, S.A.; Brinton, J.; Venturini, L.; Davey, M.; Jacobs, J.; van Ex, F.; Pasha, A.; et al. The transcriptional landscape of polyploid wheat. Science 2018, 361, eaar6089. [Google Scholar] [CrossRef] [PubMed]
  48. Ainin, W.; Yuan-long, W.; Zhen-yuan, P.; Yi-zan, M.; Qiu-shuang, A.; Guang-ling, S.; Pan-xia, S.; Ding-yi, Y.; Hai-rong, L.; Bing-hui, T.; et al. Cotton ethylene response factor GhERF91 involved in the defense against Verticillium dahliae. J. Integr. Agric. 2023, 23, 3328–3342. [Google Scholar] [CrossRef]
Figure 1. Phylogenetic tree of MYC proteins in upland cotton. The phylogenetic tree was constructed using the MEGA X with 1000 bootstrap replicates. Based on the phylogenetic tree, the MYC gene family was divided into three classes, which are shown in different colors. Among them, class 1 was divided into two subgroups. The bootstrap value is shown as a red ring.
Genes 16 00020 g001
Figure 2. A detailed examination of the gene structure and architecture features of the conserved protein motifs in GhMYC genes. (A) The phylogenetic tree was constructed using the full-length sequences of the GhMYC proteins. (B) The exon–intron structure of GhMYCs is presented herewith. The untranslated regions, exons, and introns are represented by light green boxes, light yellow boxes, and horizontal lines, respectively. The red boxes represent the bHLH-MYC_N domain. (C) Ten types of conserved motifs, indicated by different colored boxes, were predicted in the GhMYCs protein sequences. The primary distinction between class 1A and class 1B is the absence or presence of motif 8.
Genes 16 00020 g002
Figure 3. In the 2000 bp promoter regions of the GhMYCs, cis-acting elements were predicted. (A) A schematic representation of the number of cis-acting elements detected in the promoter region of each GhMYC gene. All cis-acting elements were classified into seven distinct categories, with the number of elements within each category normalized by column. (B,C) The distribution of hormone-responsive (B) and light-responsive (C) elements in the promoter region of the GhMYC gene is examined.
Genes 16 00020 g003
Figure 4. Regulatory network between GhMYCs and potential transcription factors (TFs) was demonstrated. Blue rings with gene ID represent GhMYCs, orange rings with TF name represent possible TFs, and gray lines represent potential regulatory relationships. Ring size represents degree of potential regulatory relationships between GhMYCs and TFs. Size and number of interactions are shown by purple rings.
Genes 16 00020 g004
Figure 5. The expression pattern of GhMYCs. (A) A heatmap was constructed to demonstrate the tissue-specific expression of GhMYCs. RSL: root, stem, and leaf; BSP: bract, sepal, and petal; Anther: different anther development stages are based on bud length—for example, A3–5 represents anther in 3–5 mm bud; Ovule: ovule at different developmental stages; Fiber: Fiber at different developmental stages; DPA: days post anthesis. (B) The bias in homologous gene expression was observed to vary between tissues within GhMYCs genes in the At sub-genome. (C) A heatmap was constructed to demonstrate the expression pattern of GhMYCs between V. dahliae-resistant and -susceptible cotton cultivars after infection with V. dahliae isolates, strong pathogenicity strain V991.
Genes 16 00020 g005
Table 1. Detailed information of the 32 predicted GhMYC proteins in upland cotton.
Sequence IDGene LocationStrandCDSProtein Length (aa)Amino Acids MW (kDa)Theoretical pIPredicted LocalizationInstability IndexAliphatic IndexGrand Average of Hydropathicity
Ghir_A03G000600.1Ghir_A03:980039-982310+165054960.995.82Nucleus.48.5576.36−0.60
Ghir_A07G014280.1Ghir_A07:29260134-29261695-150950256.095.21Nucleus.55.478.03−0.45
Ghir_A08G011490.1Ghir_A08:78260647-78262193+129943248.216.15Chloroplast. Nucleus.44.7381.2−0.35
Ghir_A08G013170.1Ghir_A08:93976363-93977793+126642147.056.22Nucleus.43.1484.77−0.40
Ghir_A08G016470.1Ghir_A08:107604743-107607585+202567473.575.46Nucleus.54.1170.49−0.58
Ghir_A08G019100.1Ghir_A08:113779847-113787499+168356062.405.78Nucleus.52.9788.96−0.41
Ghir_A08G019450.1Ghir_A08:114199928-114206901+205568476.485.05Nucleus.66.5771.9−0.66
Ghir_A09G020780.1Ghir_A09:77127717-77129696-176458763.775.52Nucleus.50.7773.8−0.56
Ghir_A11G009570.1Ghir_A11:8503876-8506632+177659166.835.37Nucleus.49.0289.75−0.38
Ghir_A11G010500.1Ghir_A11:9603951-9607216-185161668.186.19Nucleus.47.8974.09−0.54
Ghir_A11G010770.1Ghir_A11:10151540-10153460+148849555.195.37Nucleus.55.2386.67−0.42
Ghir_A11G013040.1Ghir_A11:13511016-13515266+191763871.785.83Nucleus.60.780.13−0.54
Ghir_A11G013630.1Ghir_A11:14785560-14788144+151550455.695.51Nucleus.45.3876.59−0.47
Ghir_A12G012390.1Ghir_A12:80898036-80899508+144047953.465.19Nucleus.43.4482.23−0.51
Ghir_A12G025340.1Ghir_A12:104279639-104281482+142847553.056.35Nucleus.43.5578.13−0.48
Ghir_D03G018560.1Ghir_D03:52297122-52299344-165054960.705.96Nucleus.50.2576.74−0.60
Ghir_D07G014550.1Ghir_D07:22069145-22070681-151250356.225.2Nucleus.54.1378.67−0.47
Ghir_D08G011870.1Ghir_D08:40245698-40247330-139246352.006.24Nucleus.49.0781.23−0.36
Ghir_D08G013920.1Ghir_D08:47888044-47889836-143147653.076.36Nucleus.42.2179.5−0.50
Ghir_D08G017330.1Ghir_D08:55836510-55838535+199566472.325.29Nucleus.51.1771.7−0.54
Ghir_D08G020010.1Ghir_D08:60585556-60589165+188762870.245.95Nucleus.53.786.61−0.47
Ghir_D08G020340.1Ghir_D08:61033485-61040431+175258365.294.97Nucleus.70.5567.79−0.72
Ghir_D09G020220.1Ghir_D09:48417384-48420001-198065971.785.21Nucleus.49.3772.23−0.60
Ghir_D11G002270.1Ghir_D11:1856954-1859976+177359065.885.73Nucleus.57.7781.59−0.52
Ghir_D11G009540.1Ghir_D11:7909491-7912950+189663171.215.48Nucleus.49.3988.24−0.42
Ghir_D11G010480.1Ghir_D11:8889334-8892486-132644148.816.81Nucleus.44.5469.21−0.59
Ghir_D11G010700.1Ghir_D11:9307960-9310014+149149655.455.35Nucleus.52.2983.53−0.45
Ghir_D11G012990.1Ghir_D11:12048161-12053376+181560468.515.25Nucleus.68.2278.21−0.63
Ghir_D11G013680.1Ghir_D11:12872213-12875310+151550455.575.59Nucleus.44.678.73−0.44
Ghir_D12G012650.1Ghir_D12:41821932-41823302+133844549.555.32Nucleus.39.6680.18−0.47
Ghir_D12G022130.1Ghir_D12:56236545-56239215+194164671.005.47Nucleus.50.6171.56−0.58
Ghir_D12G025370.1Ghir_D12:59331943-59333814+142847553.046.4Nucleus.44.5778.13−0.48
Disclaimer/Publisher’s Note: The statements, opinions and data contained in all publications are solely those of the individual author(s) and contributor(s) and not of MDPI and/or the editor(s). MDPI and/or the editor(s) disclaim responsibility for any injury to people or property resulting from any ideas, methods, instructions or products referred to in the content.

