Article

Population Structure and Genetic Diversity of the Toona ciliata (Meliaceae) Complex Assayed with Chloroplast DNA Markers

1
College of Forestry and Landscape Architecture, South China Agricultural University, Guangzhou 510642, China
2
Guangdong Key Laboratory for Innovative Development and Utilization of Forest Plant Germplasm, Guangzhou 510642, China
*
Author to whom correspondence should be addressed.
Genes 2024, 15(3), 320; https://doi.org/10.3390/genes15030320
Submission received: 25 January 2024 / Revised: 13 February 2024 / Accepted: 26 February 2024 / Published: 28 February 2024
(This article belongs to the Section Plant Genetics and Genomics)

Abstract

:
Toona ciliata is a deciduous or semi-deciduous tree species and belongs to the Toona genus of the Meliaceae family. Owing to low natural regeneration and over-exploitation, the species is listed as an endangered species at level II in China and its conservation has received increasing concern. Here, we sampled 447 individuals from 29 populations across the range-wide distribution of the T. ciliata complex in China and assessed their genetic variation using two chloroplast DNA markers. The results showed that the overall haplotype diversity and nucleotide diversity per site were high at h = 0.9767 and π = 0.0303 for the psbA-trnH fragment and h = 0.8999 and π = 0.0189 for the trnL-trnL fragment. Phylogenetic analysis supported the division of the natural distribution of T. ciliata complex into western and eastern regions. The genetic diversity was higher in the western region than in the eastern region, showing significant phylogeographic structure. Genetic differentiation among populations was moderate ( Φ s t = 42.87 % ), and the effects of isolation by distance (IBD) were significant. A neutrality test and mismatch distribution analysis indicated that the distribution of the T. ciliata complex generally did not expand, although a few local populations could likely expand after bottleneck effects. The overall results were complementary to and consolidated previous studies using mitochondrial and nuclear DNA markers. We finally discussed strategies for the genetic conservation of the T. ciliata complex.

1. Introduction

Toona is a genus of deciduous or semi-deciduous broad-leaved trees in the Meliaceae family and is mainly distributed in subtropical and tropical areas [1]. The genus includes four species in China, including T. sinensis, T. ciliata, T. macrocarpa, and T. rubriflora, among which T. sinensis and T. ciliata are the most extensively exploited. T. ciliata is widely distributed in southern China, covering Yunnan, Guangxi, Guizhou, Sichuan, Hunan, Hubei, Fujian, and Guangdong Provinces. Based on the phenotypic variation in leaf and floral traits, five varieties of T. ciliata are recognized, including T. ciliata var. ciliata, T. ciliata var. yunnanensis, T. ciliata var. pubescens, T. ciliata var. sublaxiflora, and T. ciliata var. henryi [1]. These varieties are geographically distributed in sympatry or parapatry and grow in hills and mountains at elevations between 300 m and 2260 m above sea level. Natural hybridization among varieties cannot be excluded, although a few reports on their hybrids are available in the literature. Because leaf and floral traits are often influenced by environmental factors and exhibit continuous variation within and between species [2,3], the delimitation of varieties of T. ciliata based on these traits remains uncertain. There is still debate about the taxonomic status of these varieties [4]. Similar to a previous study that did not specify a variety, here we bring these five varieties together as the T. ciliata complex. Individual samples of T. ciliata were not identified to any specific variety.
T. ciliata is an important fast-growing timber species and is also known as the Chinese mahogany [5,6,7]. One remarkable feature is that T. ciliata has a tough texture, straight grain, beautiful pattern, dark reddish-brown heartwood, and lighter sapwood, and hence, it has a significant timber value [8,9]. The species also has a potential medicinal value since extracts from its branches and leaves have various biological activities, including antibacterial, antiviral, molluscacide, and antimalarial effects [9]. The species is considered as one of the preferred species to adjust the species structure of coniferous and broad-leaved mixed forests in the hills of southern China [9]. It is of great significance for developing forest production to vigorously promote the development of T. ciliata. However, due to its low natural regeneration [10] and over-exploitation, T. ciliata is recognized as an endangered species at level Ⅱ, which is defined as an endangered species of important economic, cultural, or scientific research value. Therefore, its genetic conservation has received increasing concern.
Previous studies on the T. ciliata complex have mainly focused on cultivation, silviculture techniques, ecophysiology, timber properties, and forest community succession [11]. For instance, the mixed forests of T. ciliata with Cunninghamia lanceolata, Pinus massoniana, or Pinus yunnanensis could effectively prevent land decline caused by continuous planting, and improve soil fertility [12,13]. Genetic studies have focused on provenance trials [14,15], tissue culture [16], and cuttings propagation [17]. Population genetic studies with molecular markers include the investigation of genetic diversity and population structure of the T. ciliata complex using SRAP (sequence-related amplified polymorphisms) markers [18], ISSR (inter-simple sequence repeats) markers [19], SSR (simple sequence repeat) markers [20], and nuclear ITS (nuclear internal transcribed spacer) and mitochondrial DNA (mtDNA) markers [4]. They showed that there were significant population differentiation and isolation-by-distance (IBD) effects in the natural distribution of the T. ciliata complex in China. Xiao et al. [21] showed that four varieties of T. ciliata (without T. ciliata var. sublaxiflora among the five varieties) in sympatry were genetically well mixed in terms of chloroplast genomes. Other studies using SSR markers include the population genetic structure of T. ciliata var. pubescens [22,23]. Analysis of the mating system scored by nuclear SSR markers indicated that the T. ciliata complex is predominantly outcrossing, with partial selfing and inbreeding [24]. Recent genome sequencing provides a useful reference for studying the phylogenetic relationship among varieties and for developing nuclear molecular markers for breeding [25,26]. All these studies provide a general picture of the genetic diversity and population structure of the T. ciliata complex, which serves as a valuable reference to the genetic conservation of this endangered species in China.
The purpose of this study was to use chloroplast DNA (cpDNA) markers to investigate the population genetic diversity and population structure of the T. ciliata complex in China. This study is complementary to previous studies using mtDNA and unclear SRAP and ITS markers [4,18]. It is well known that chloroplast DNA markers have multiple attributes that are suitable for investigating genetic variation within and between species [27,28], including (i) uniparental inheritance (maternal inheritance for angiosperms and paternal inheritance for gymnosperms), (ii) a higher mutation rate per site compared with the plant mitochondrial genome but a lower mutation rate per site compared with the plant nuclear genome, and (iii) a small genome size (120–220 kb) [29]. These characteristics ensure that the genetic diversity derived from cpDNA markers is different from that derived from mtDNA and nuclear DNA markers. Moreover, gene flow for the cpDNA markers of angiosperms is mediated by seed flow only, similar to mtDNA markers but different from nuclear markers whose gene flow is mediated by both seed and pollen flow. It is expected in theory that population genetic differentiation derived from cpDNA markers is comparable to that from mtDNA markers if mutation effects are negligible between them [30]. Also, it is expected that genetic differentiation derived from cpDNA markers is greater than that from nuclear markers due to smaller genetic drift effects and both seed and pollen flow for the nuclear markers [31]. To compare with previous studies [18,21], we investigated range-wide populations of the T. ciliata complex. By synthesizing information on genetic variation from nuclear and organelle genome markers, we assessed the genetic diversity and population structure of the T. ciliata complex from the whole genome perspective. The overall results were then applied in discussing the genetic conservation strategy for the T. ciliata complex.

2. Materials and Methods

2.1. Sampling and DNA Extraction

The experimental sampling sites covered 11 provinces, and four hundred and forty-seven individuals of 29 populations were collected across the range-wide distribution of the T. ciliata complex in China (Table 1). Here, populations in different localities were determined according to China’s administrative division. These sampling sites were the same as those used by Li et al. [18] and Xiao et al. [4] but fewer samples were analyzed. Most leaf samples were collected from 2015 to 2016 [18]. Because some leaf samples were used in previous experiments [18], we collected some supplementary samples from provenance trials established at the Zengcheng Experiment Station (113°37′ E, 23°14′ N, and 20.3 m above sea level) and the Yuejin North Experiment Station, South China Agricultural University (113°37′ E, 23°16′ N, and 42.3 m above sea level), in 2018. Note that some populations only had a few samples because supplementary samples were not obtained. All sample trees were separated by at least 50 m. The altitudes of the sampling sites ranged from 337 m (Guanshan, Jiangxi Province) to 1862 m (Huidong, Sichuan Province), with an average altitude of 808.2 m.
Approximately 5 g of fresh leaves per sample were immediately dried and preserved on silica gel. Most DNA samples extracted from healthy leaves were provided by Li et al. [18]. Supplementary DNA samples were extracted from the leaves of living plants according to the CTAB 2X protocol [32]. The quality of DNA extraction was checked by 0.8% (w/v) agarose gel electrophoresis. All quantified DNA samples were stored at −80 °C for subsequent polymerase chain reaction (PCR) amplification.

2.2. Primer Screening, Amplification, and Sequencing

According to the literature [33], four pairs of universal cpDNA primers were checked, namely, psbA-trnH, trnT-trnL, trnL-trnL, and trnL-trnF (Table 2). Among them, the intergenic region of psbA-trnH is one of the fastest evolutionary regions in the chloroplast genome, and the sequence has been widely used in genetic diversity analysis [34]. After checking the gel bands of the PCR amplifications (Figure S1), we selected two primer pairs, i.e., psbA-trnH and trnL-trnL, for sequencing analyses.
PCR amplification was carried out in a 25 μL reaction system, consisting of 1 μL of genomic DNA, 1 μL of forward and reverse primers, 12.5 μL of 2 × ES Taq Mastermix (Yongjin Biotechnology, Guangzhou, China), and 9.5 μL of ddH2O. The PCR procedure was carried out in a Dongsheng Thermal Cycler (EDC-810, Suzhou, China). The procedure of the thermal cycling system for both primer pairs was as follows: pre-denaturation for 4 min at 94 °C, followed by 35 cycles of 94 °C for 1 min, 55 °C for 1 min, 72 °C for 1 min, and finally, 72 °C extension for 10 min. The amplification products were stored in the refrigerator at 4 °C and then promptly sent to Sangon Biotech (Shanghai, China) for sequencing. The peak maps obtained from sequencing were viewed and detected by Chromatogram Explorer3.2 (Figure S2), which indicated that there were no cluttered peaks or strong base signals. The sequences with high quality and no mixed peak signals were used for downstream analyses.

2.3. Analysis of Genetic Diversity

The sequenced fragments from PCR amplifications were aligned using MEGA 7 [35], removing the parts with heterozygous interferences caused by unstable signals at the fronts and ends. Ultimately, we obtained two datasets of sequences for 29 populations, one for the psbA-trnH fragment and the other for the trnL-trnL fragment (see Table S1 in Supplementary Materials for concatenated alignment sequences). We used DnaSP v5 [36] to estimate haplotypes (see Tables S2 and S3 in Supplementary Materials for haplotype sequences), observed haplotype diversity ( h ), and nucleotide diversity ( π ) per site for each population and the overall samples. The observed haplotype diversity (h) for each population was estimated by
h = 1 i p i 2
where p i is the frequency of the ith haplotype in the focal population [37]. Since many haplotypes were detected, instead of drawing a complex network, we used parsimony tree by MEGA 7 [35] to depict the evolutionary relationships among haplotypes.

2.4. Population Genetic Structure

We used DNAsp v5 to estimate genetic differentiation coefficients, including N s t [38,39], G s t [37], and F s t [40]. We tested whether N s t was larger than G s t or not to infer if the phylogeographic structure occurred. Similarly, Arlequin v3.0 [41] was used for molecular analysis of variance (AMOVA) to calculate the distribution of genetic variation within and between populations and to estimate genetic differentiation Φ s t [42] between populations.
Isolation by distance (IBD) was tested using regression analysis of ( F s t / ( 1 F s t ) ) on the logarithm of geographic distance [40,43]:
F s t 1 F s t = a + b · l n ( g e o g r a p h i c d i s t a n c e ) .
A significant difference of the regression coefficient b from zero indicates the presence of IBD effects. Note that the geographical distance between pairwise populations was calculated using their longitude and latitude coordinates (Table 1). A Mantel’s test was also conducted to examine the relationship between F s t and geographic distance [44]. Pearson’s correlation ( r ) between haplotype diversity and elevation was tested for each fragment.
Phylogenetic relationships among 447 individuals of 29 populations were constructed by MEGA 7 [35]. The phylogenetic tree among populations was also drawn using the ML (maximum likelihood) method [36]. In addition, we investigated the population structure by ADMIXTURE 1.3.0 using the concatenated sequences of the psbA-trnH and trnL-trnL fragments [45].

2.5. Population Demography

Tajima’s D [46] and Fu’s F [47] tests were conducted to indicate if a population had experienced expansion after bottleneck effects. Neutrality was tested using Arlequin v3.0 [41] with the two chloroplast DNA fragments. It is expected that both Tajima’s D and Fu’s F are negative if the population has expanded after bottleneck effects. In addition, a mismatch distribution was analyzed for each population. When the observed frequency of pairwise different sites has a single-peaked distribution, consistent with a single-peaked Poisson distribution, population expansion is implied after bottleneck effects. Statistical tests were performed using the sum of squares (SSD) and Harpending’s raggedness index (Rag) to check whether the expected SSD (or Rag) was greater than the observed SSD (or Rag). Estimates of other parameters included θ 0 = 2 N 1 μ and θ 1 = 2 N 2 μ , where N 1 and N 2 are the population sizes before and after population expansion, respectively, and τ ( t ) is the time elapsed since the sudden expansion of the population.

3. Results

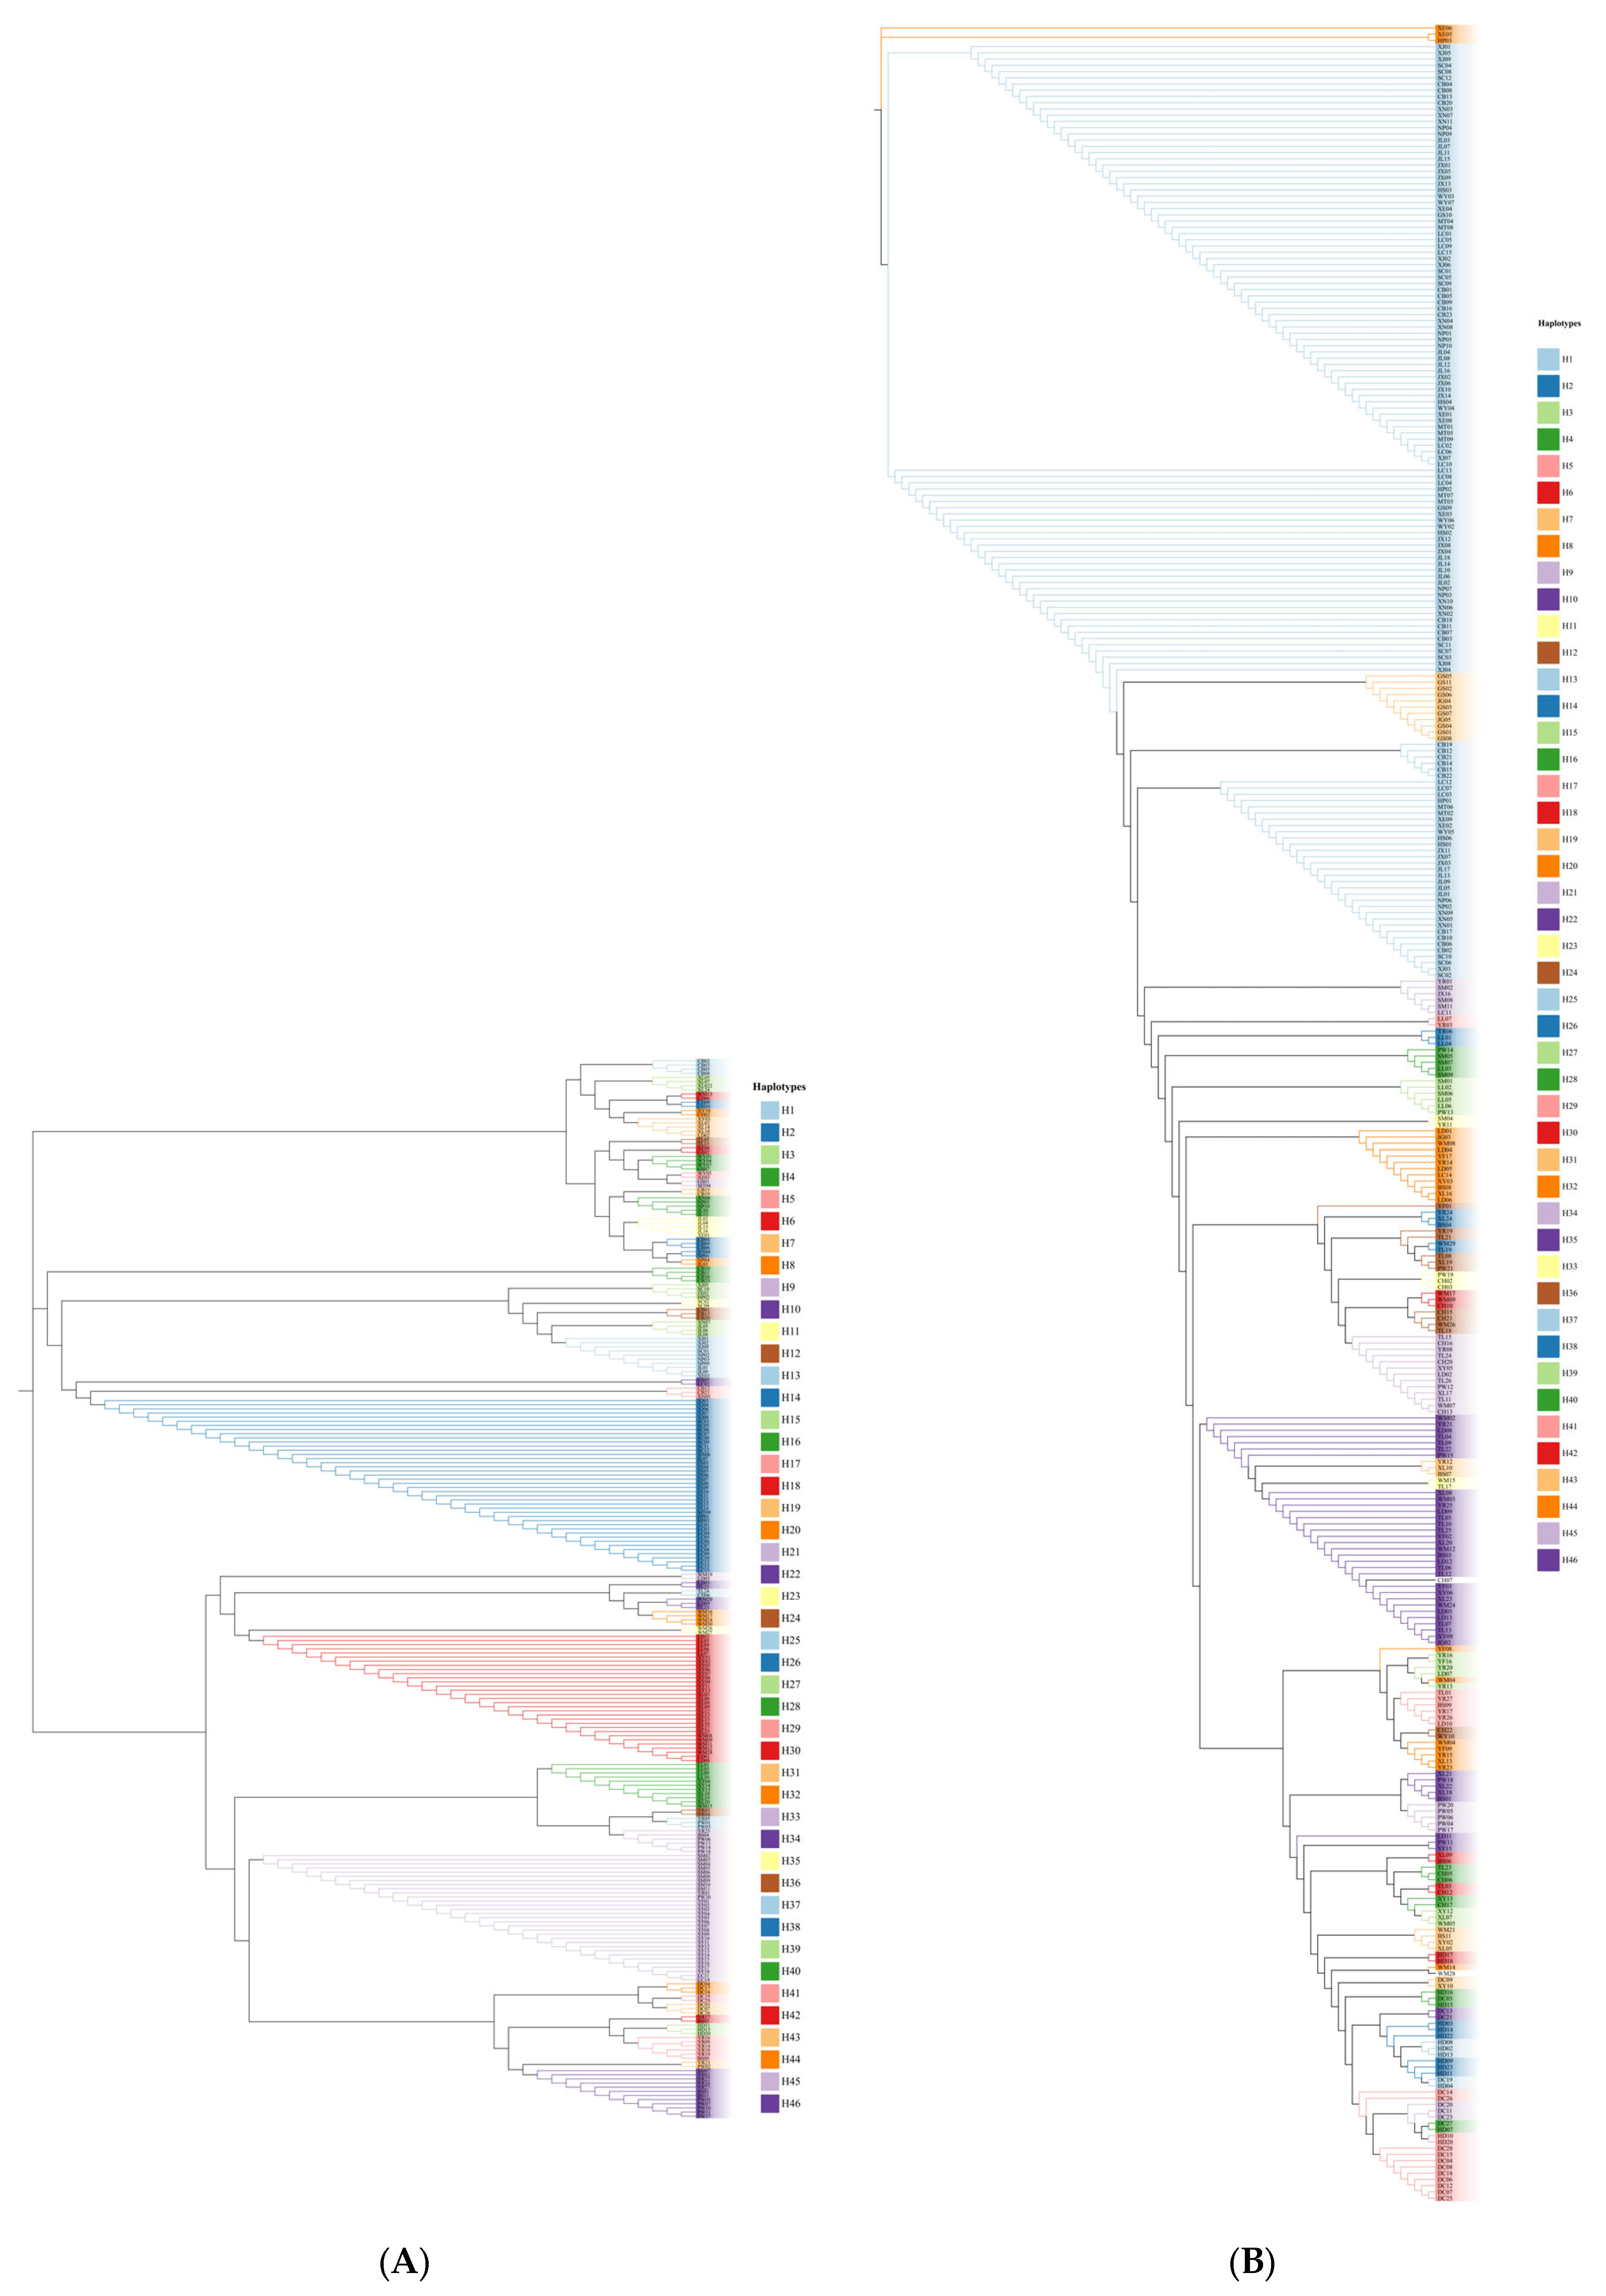
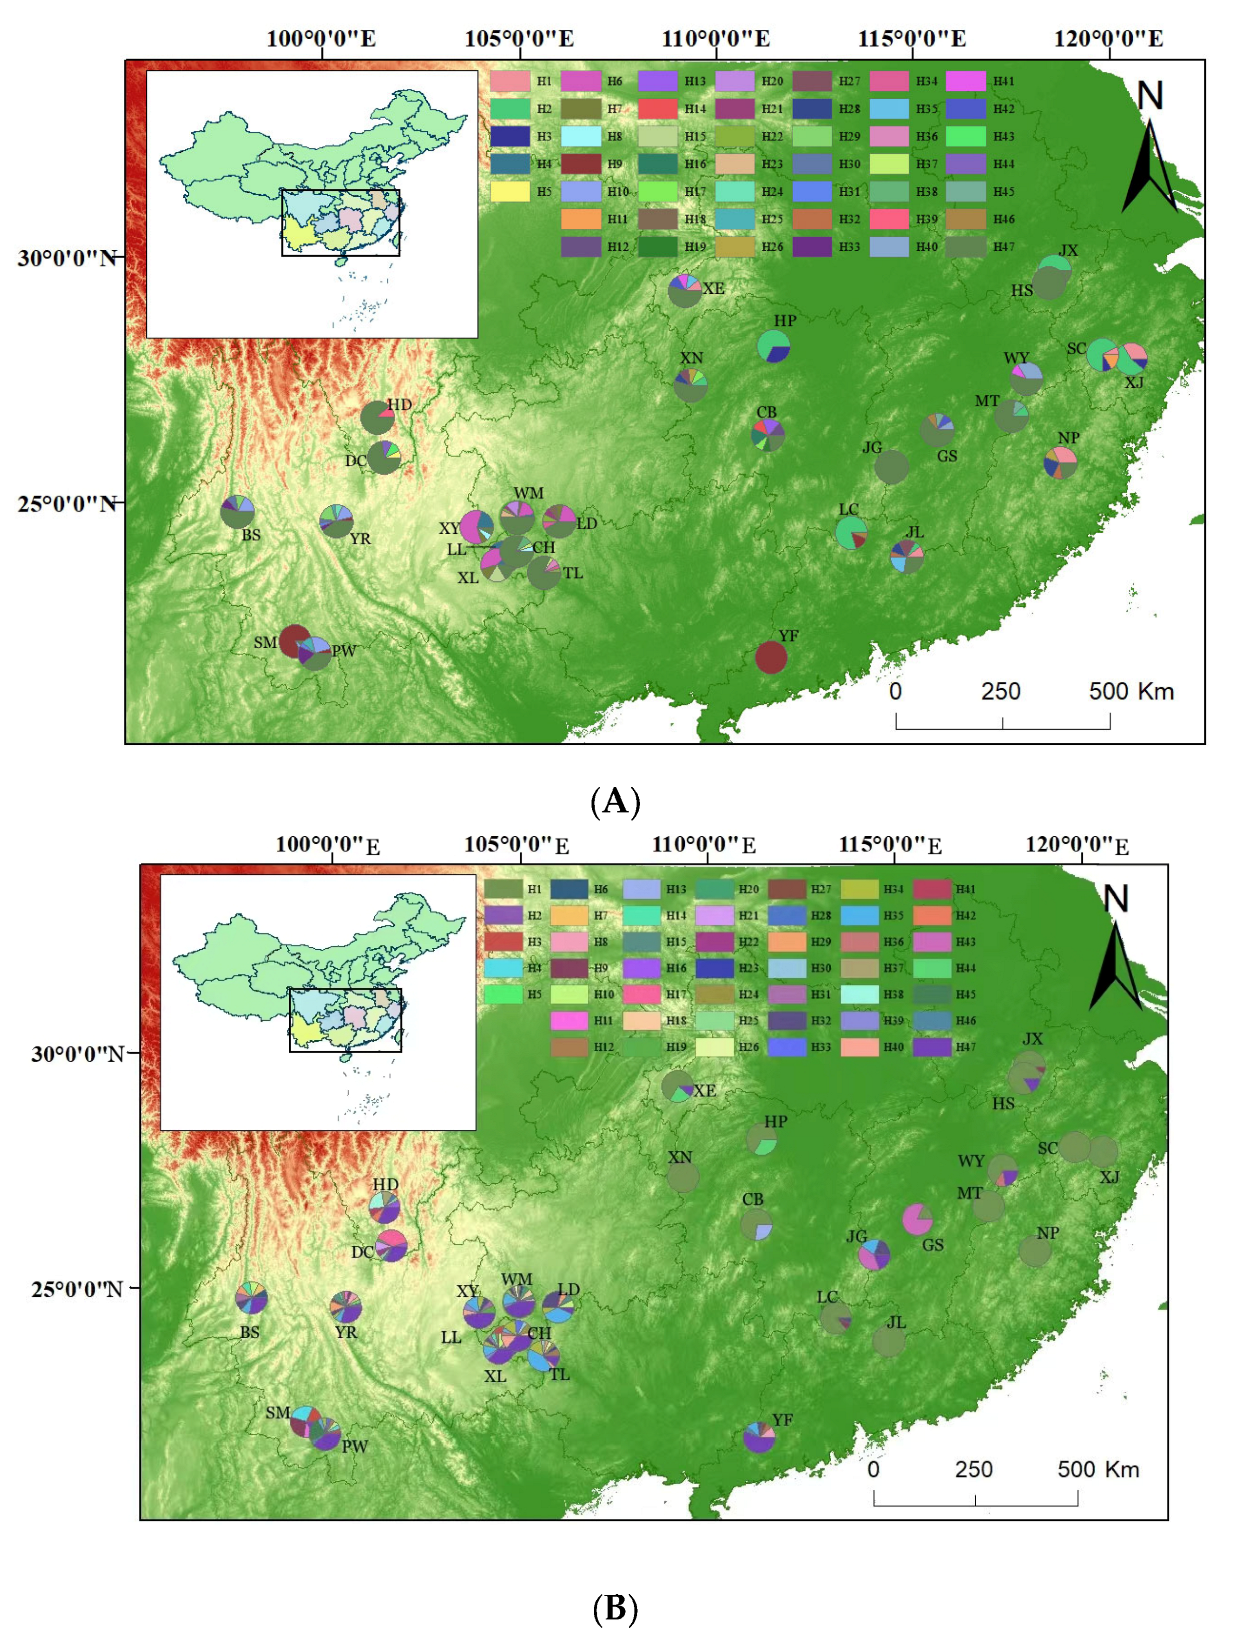
3.1. Haplotype Analysis

The amplified sequences from the psbA-trnH fragment were about 564bp after alignment among 447 individuals. Analysis with DNAsp v5 identified 239 haplotypes among the 447 samples (Table 3). There were 193 haplotypes in total whose abundance was one in overall samples (447 individuals). For simplicity, we used code Hi (i = 1, …, 46) to represent haplotypes whose abundances were not less than two and code H47 to represent all haplotypes occurring only once in the overall samples. Populations DC, TL, CH, and HD possessed more than 20 haplotypes, while population YF was fixed by haplotype H9. Haplotype H2 was the most frequent haplotype, accounting for 9.4% of the overall samples and occurring in eight populations. Figure 1A shows the evolutionary relationship among the 46 haplotypes. Only a few haplotypes were dominant, and most haplotypes were derived from a few main haplotypes with a couple of mutant bases.
For the sequence of the trnL-trnL fragment, we identified 143 haplotypes from 447 samples (Table 4). There were also 46 haplotypes whose abundances were not less than two and denoted by Hi (i = 1, …, 46). There were 97 haplotypes that occurred only once in the overall samples. For simplicity, these single-abundant haplotypes were commonly denoted by code H47. Populations XL, WM, and YR possessed more than 20 haplotypes, while populations XJ, SC, NP, JL, and MT were fixed by haplotype H1. Haplotype H1 was the most frequent haplotype, accounting for 29.8% of the overall samples and occurring in 15 populations. Figure 1B shows that most single-abundant haplotypes were derived from a few domain haplotypes with a couple of mutations.
The analysis of haplotype diversity indicated that the observed haplotype diversity ranged from 0 (YF) to 0.9586 (TL) for the psbA-trnH fragment (Table 3). The mean of observed haplotype diversity across populations was 0.7391 ± 0.2477. The nucleotide diversity per site (π) ranged from 0 (YF) to 0.1398 (HS) with a mean of 0.0303 ± 0.0374 (Table 3). The diversity in the overall samples was h = 0.9767 and π = 0.0303.
For the trnL-trnL fragment (Table 4), the observed haplotype diversity (h) ranged from 0 to 0.9489 (WM) with a mean of 0.5556 ± 0.3739. Multiple populations (XJ, SC, XN, NP, JL, and MT) were fixed by haplotype H1. The nucleotide diversity per site (π) ranged from 0 to 0.0154 (JG) with a mean of 0.0044 ± 0.0039. The diversity in the overall samples was h = 0.8999 and π = 0.0189.
Figure 2 shows the geographical distribution of haplotypes for the psbA-trnH fragment (A) and the trnL-trnL fragment (B). A generally similar pattern of diversity was observed for both fragments. Populations had larger haplotype diversity in the western region than in the eastern region. An explicit phylogeographic structure was present in the natural distribution of the T. ciliata complex.

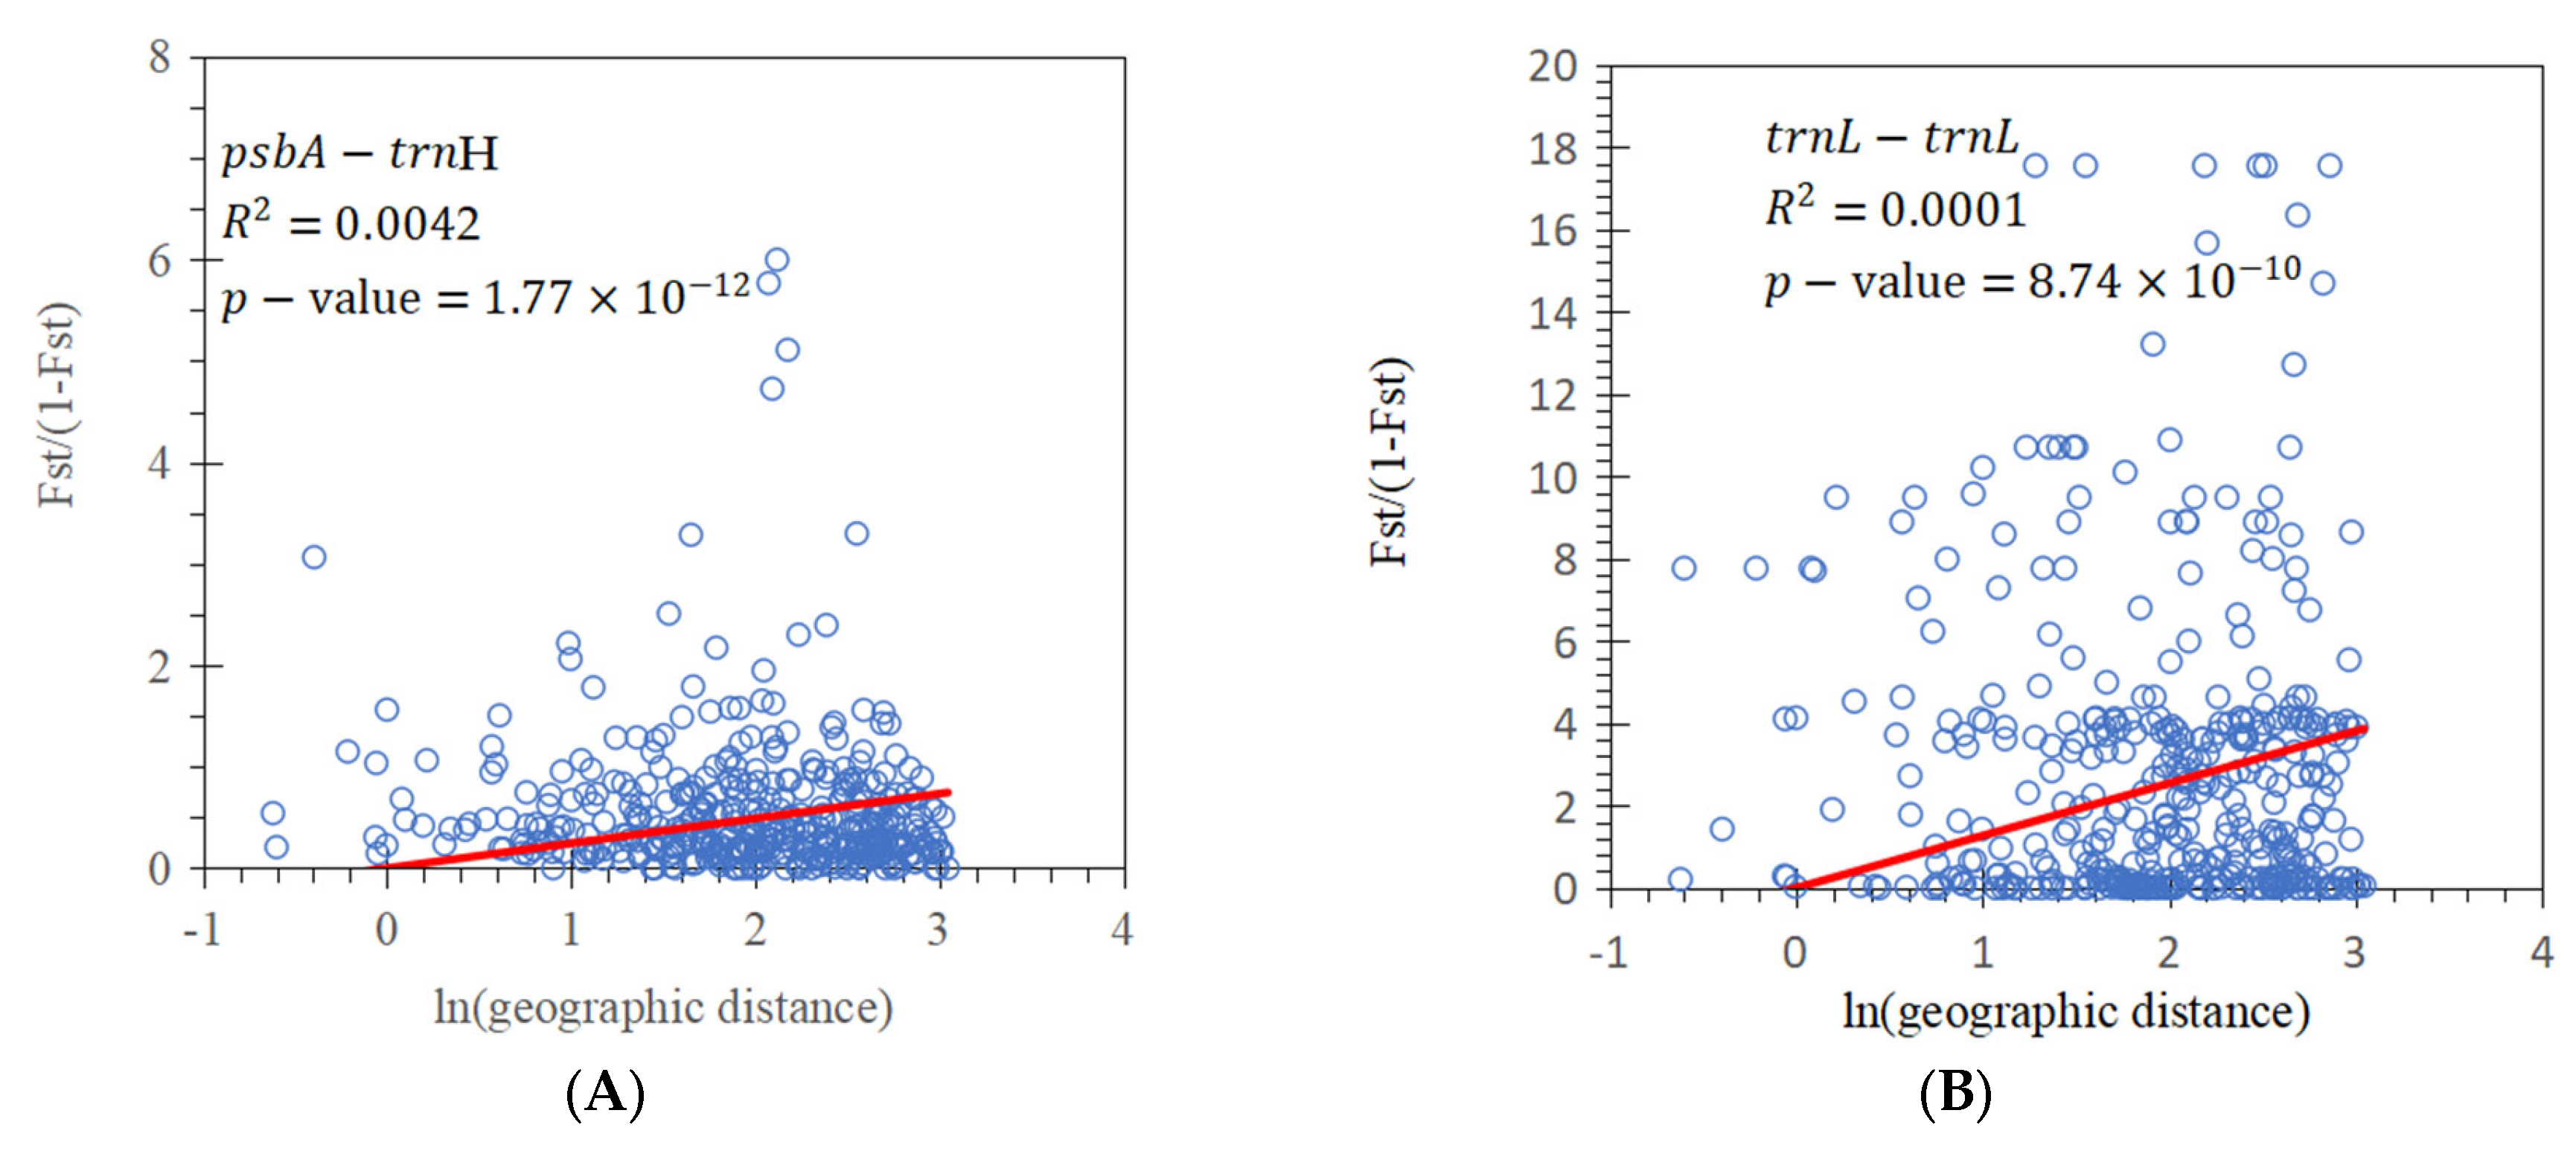
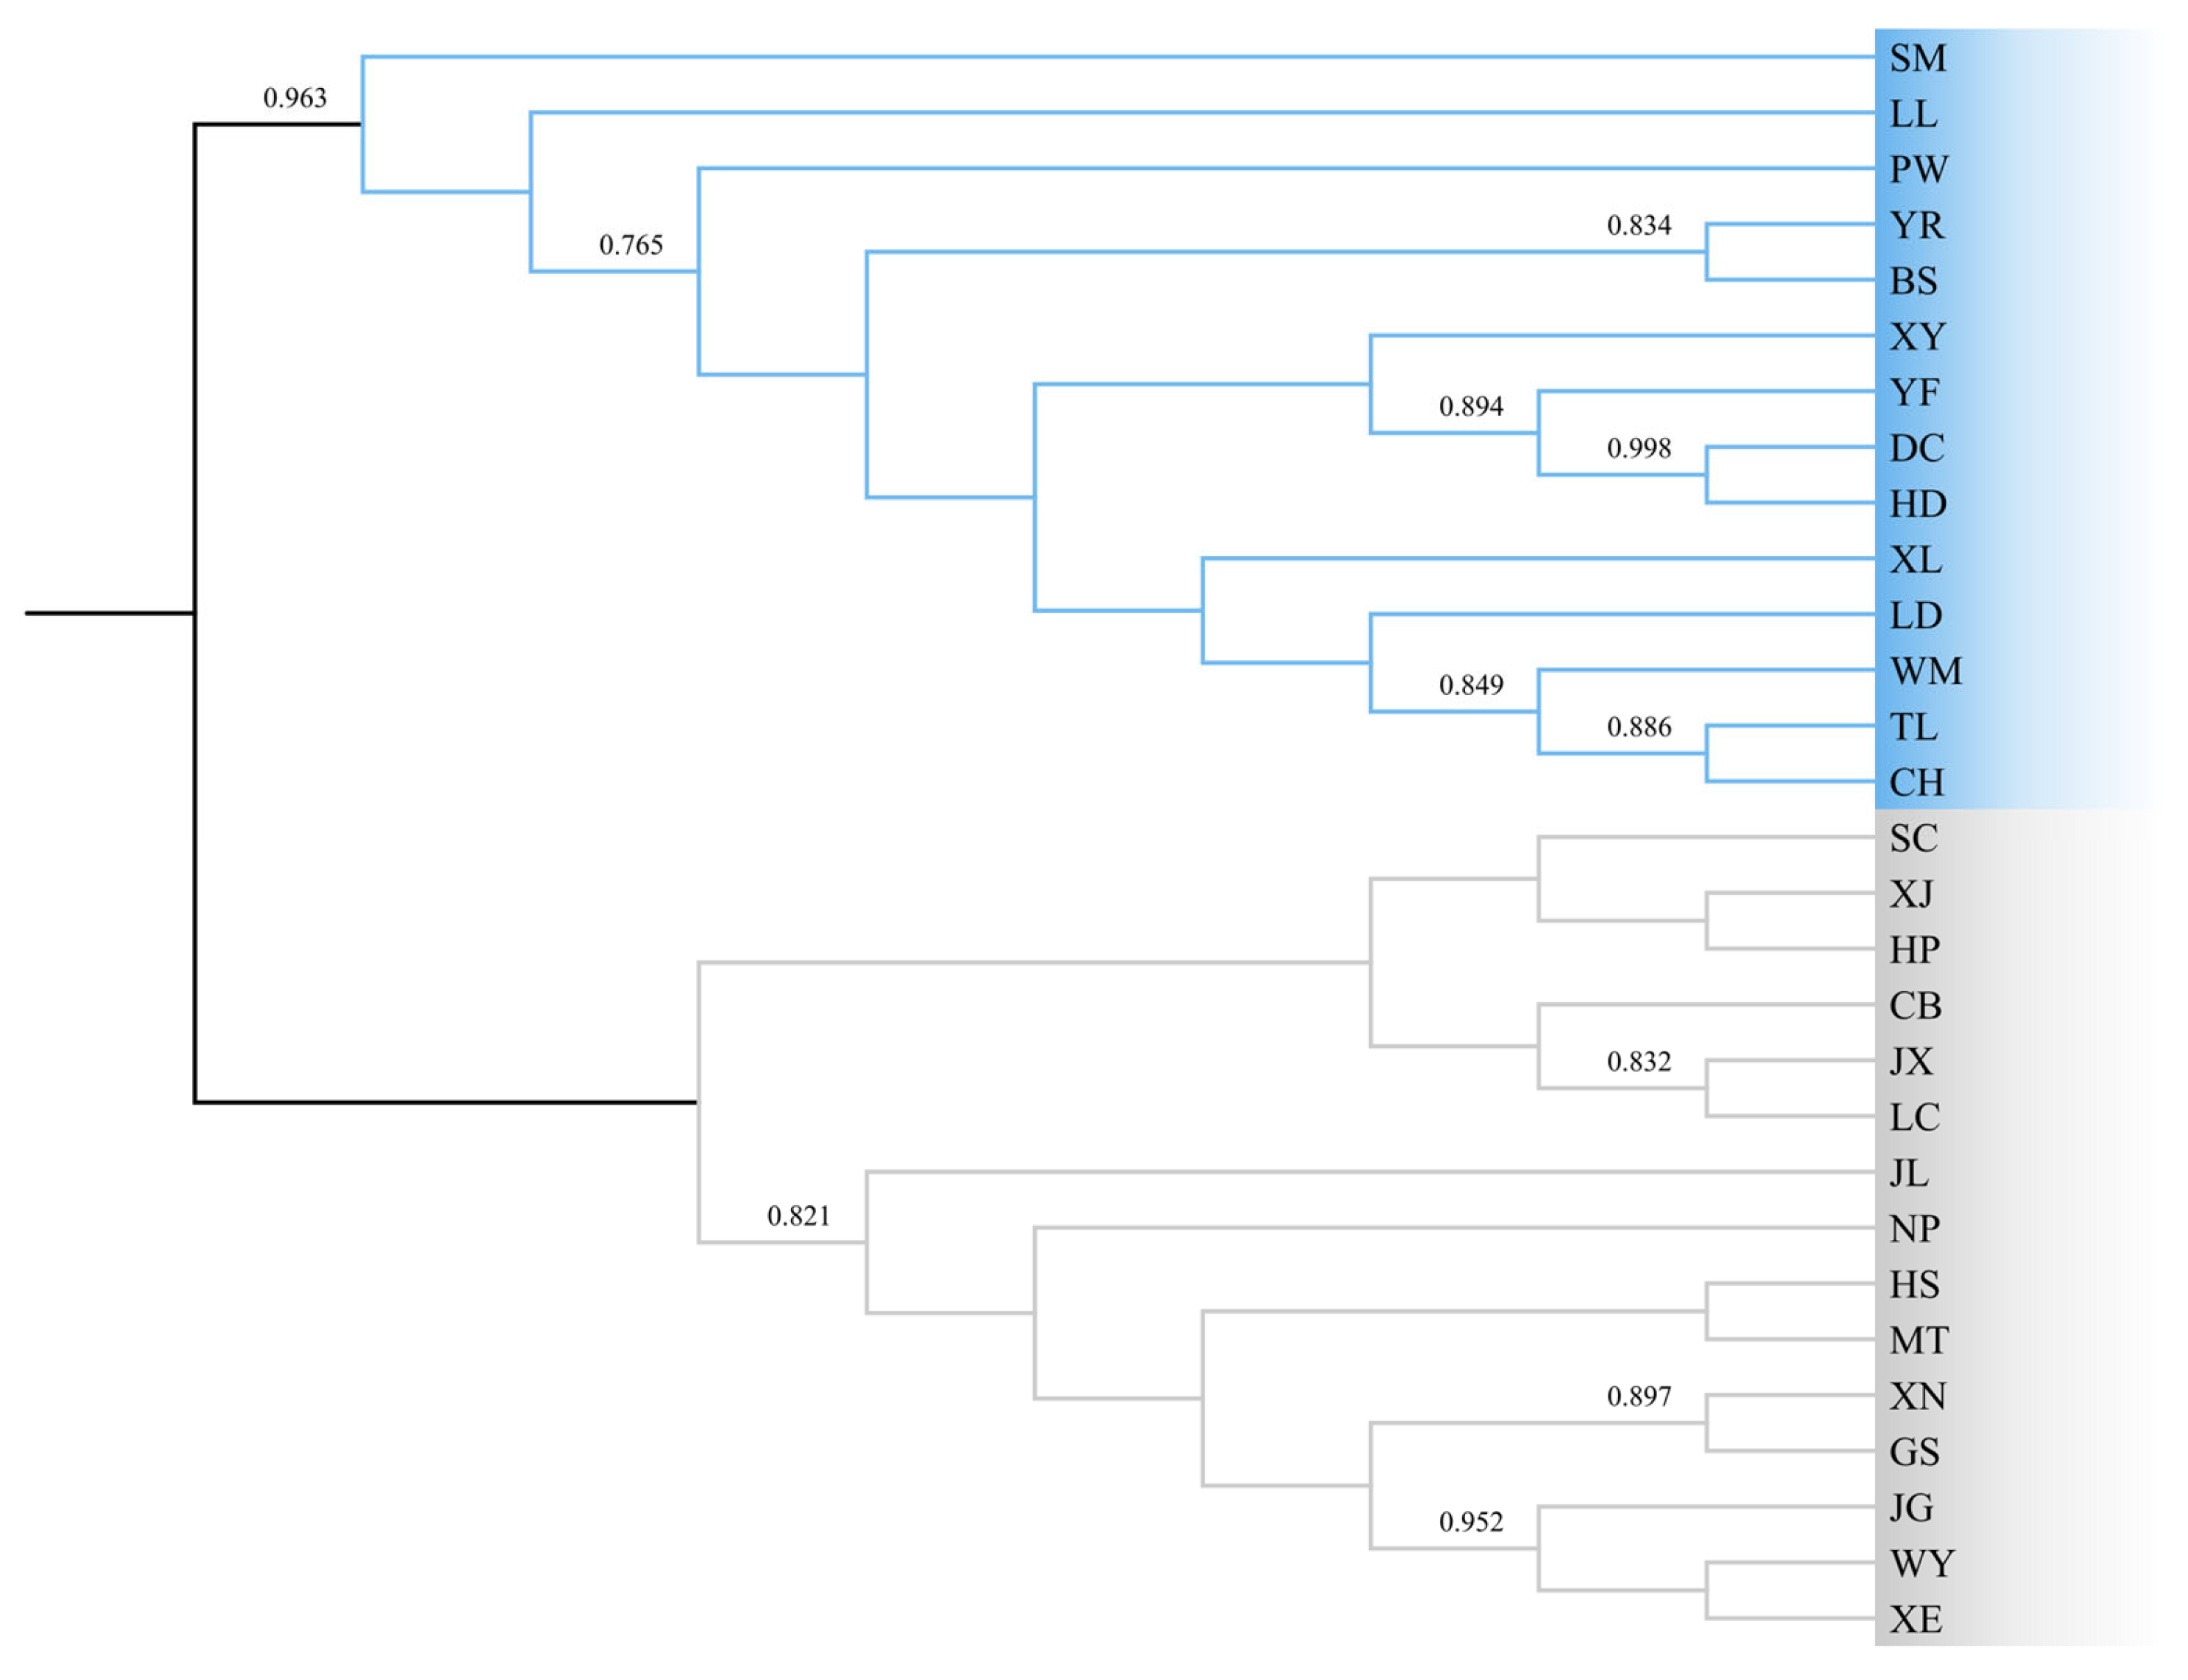
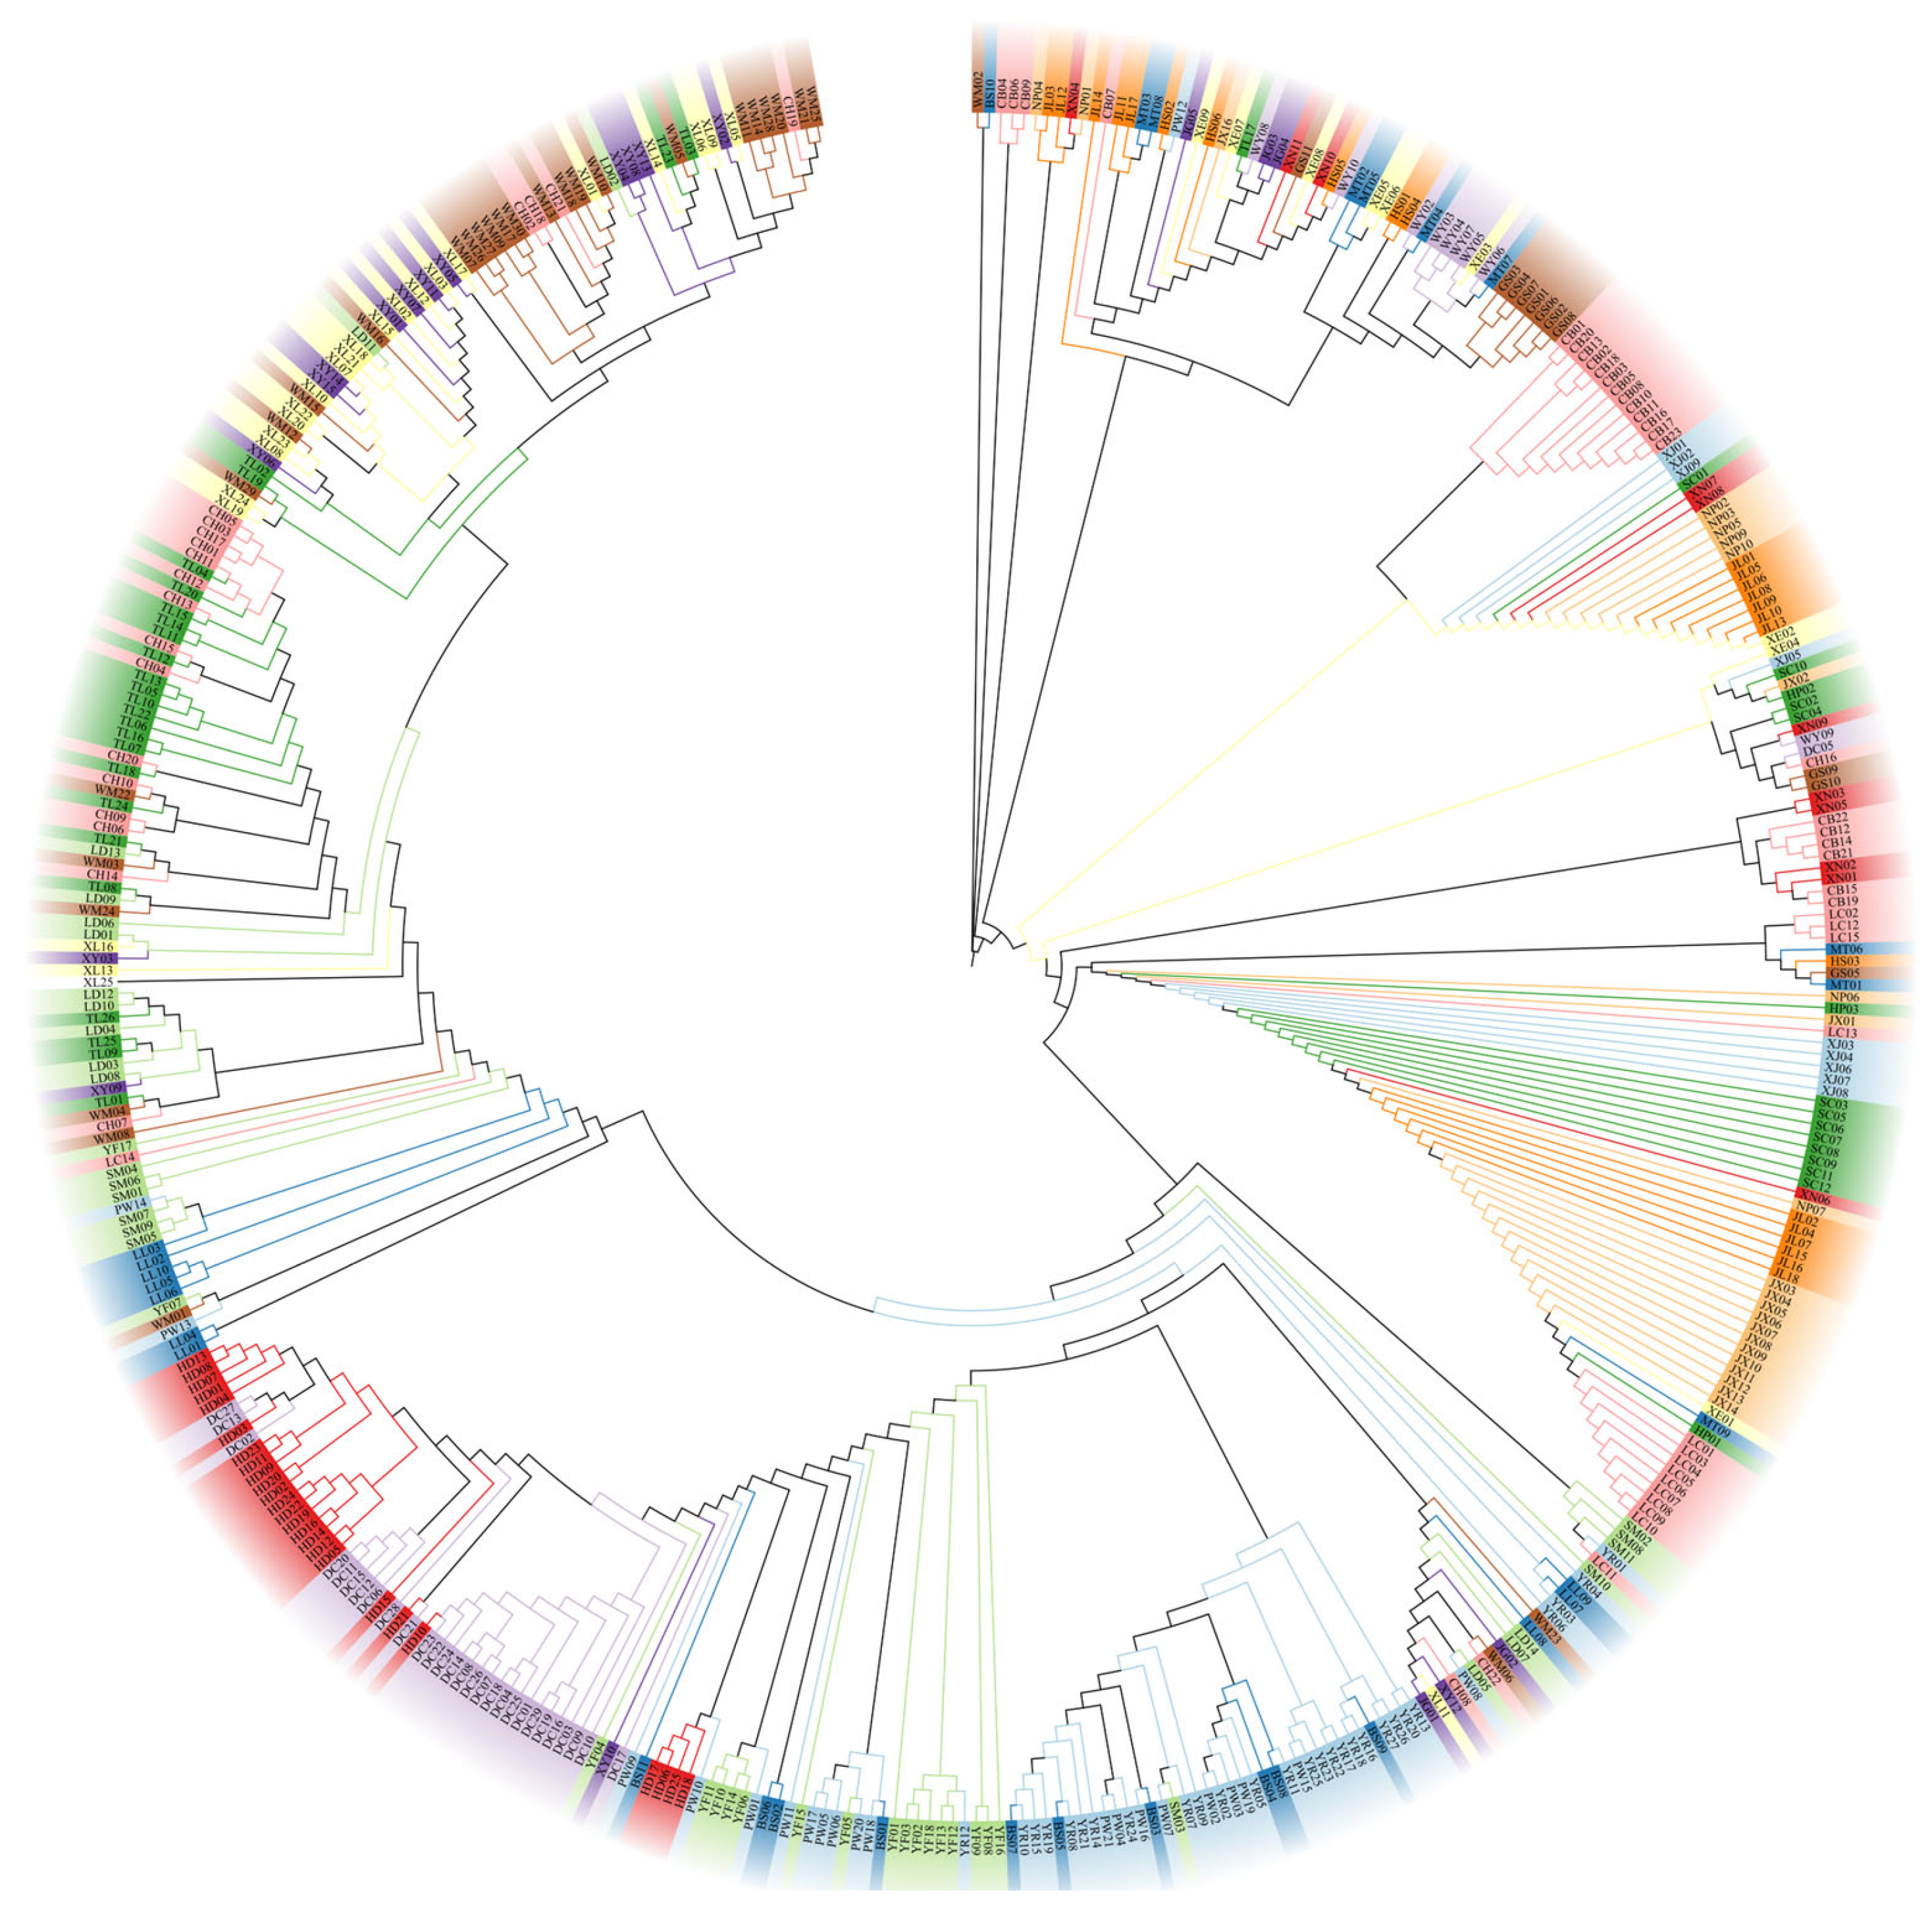
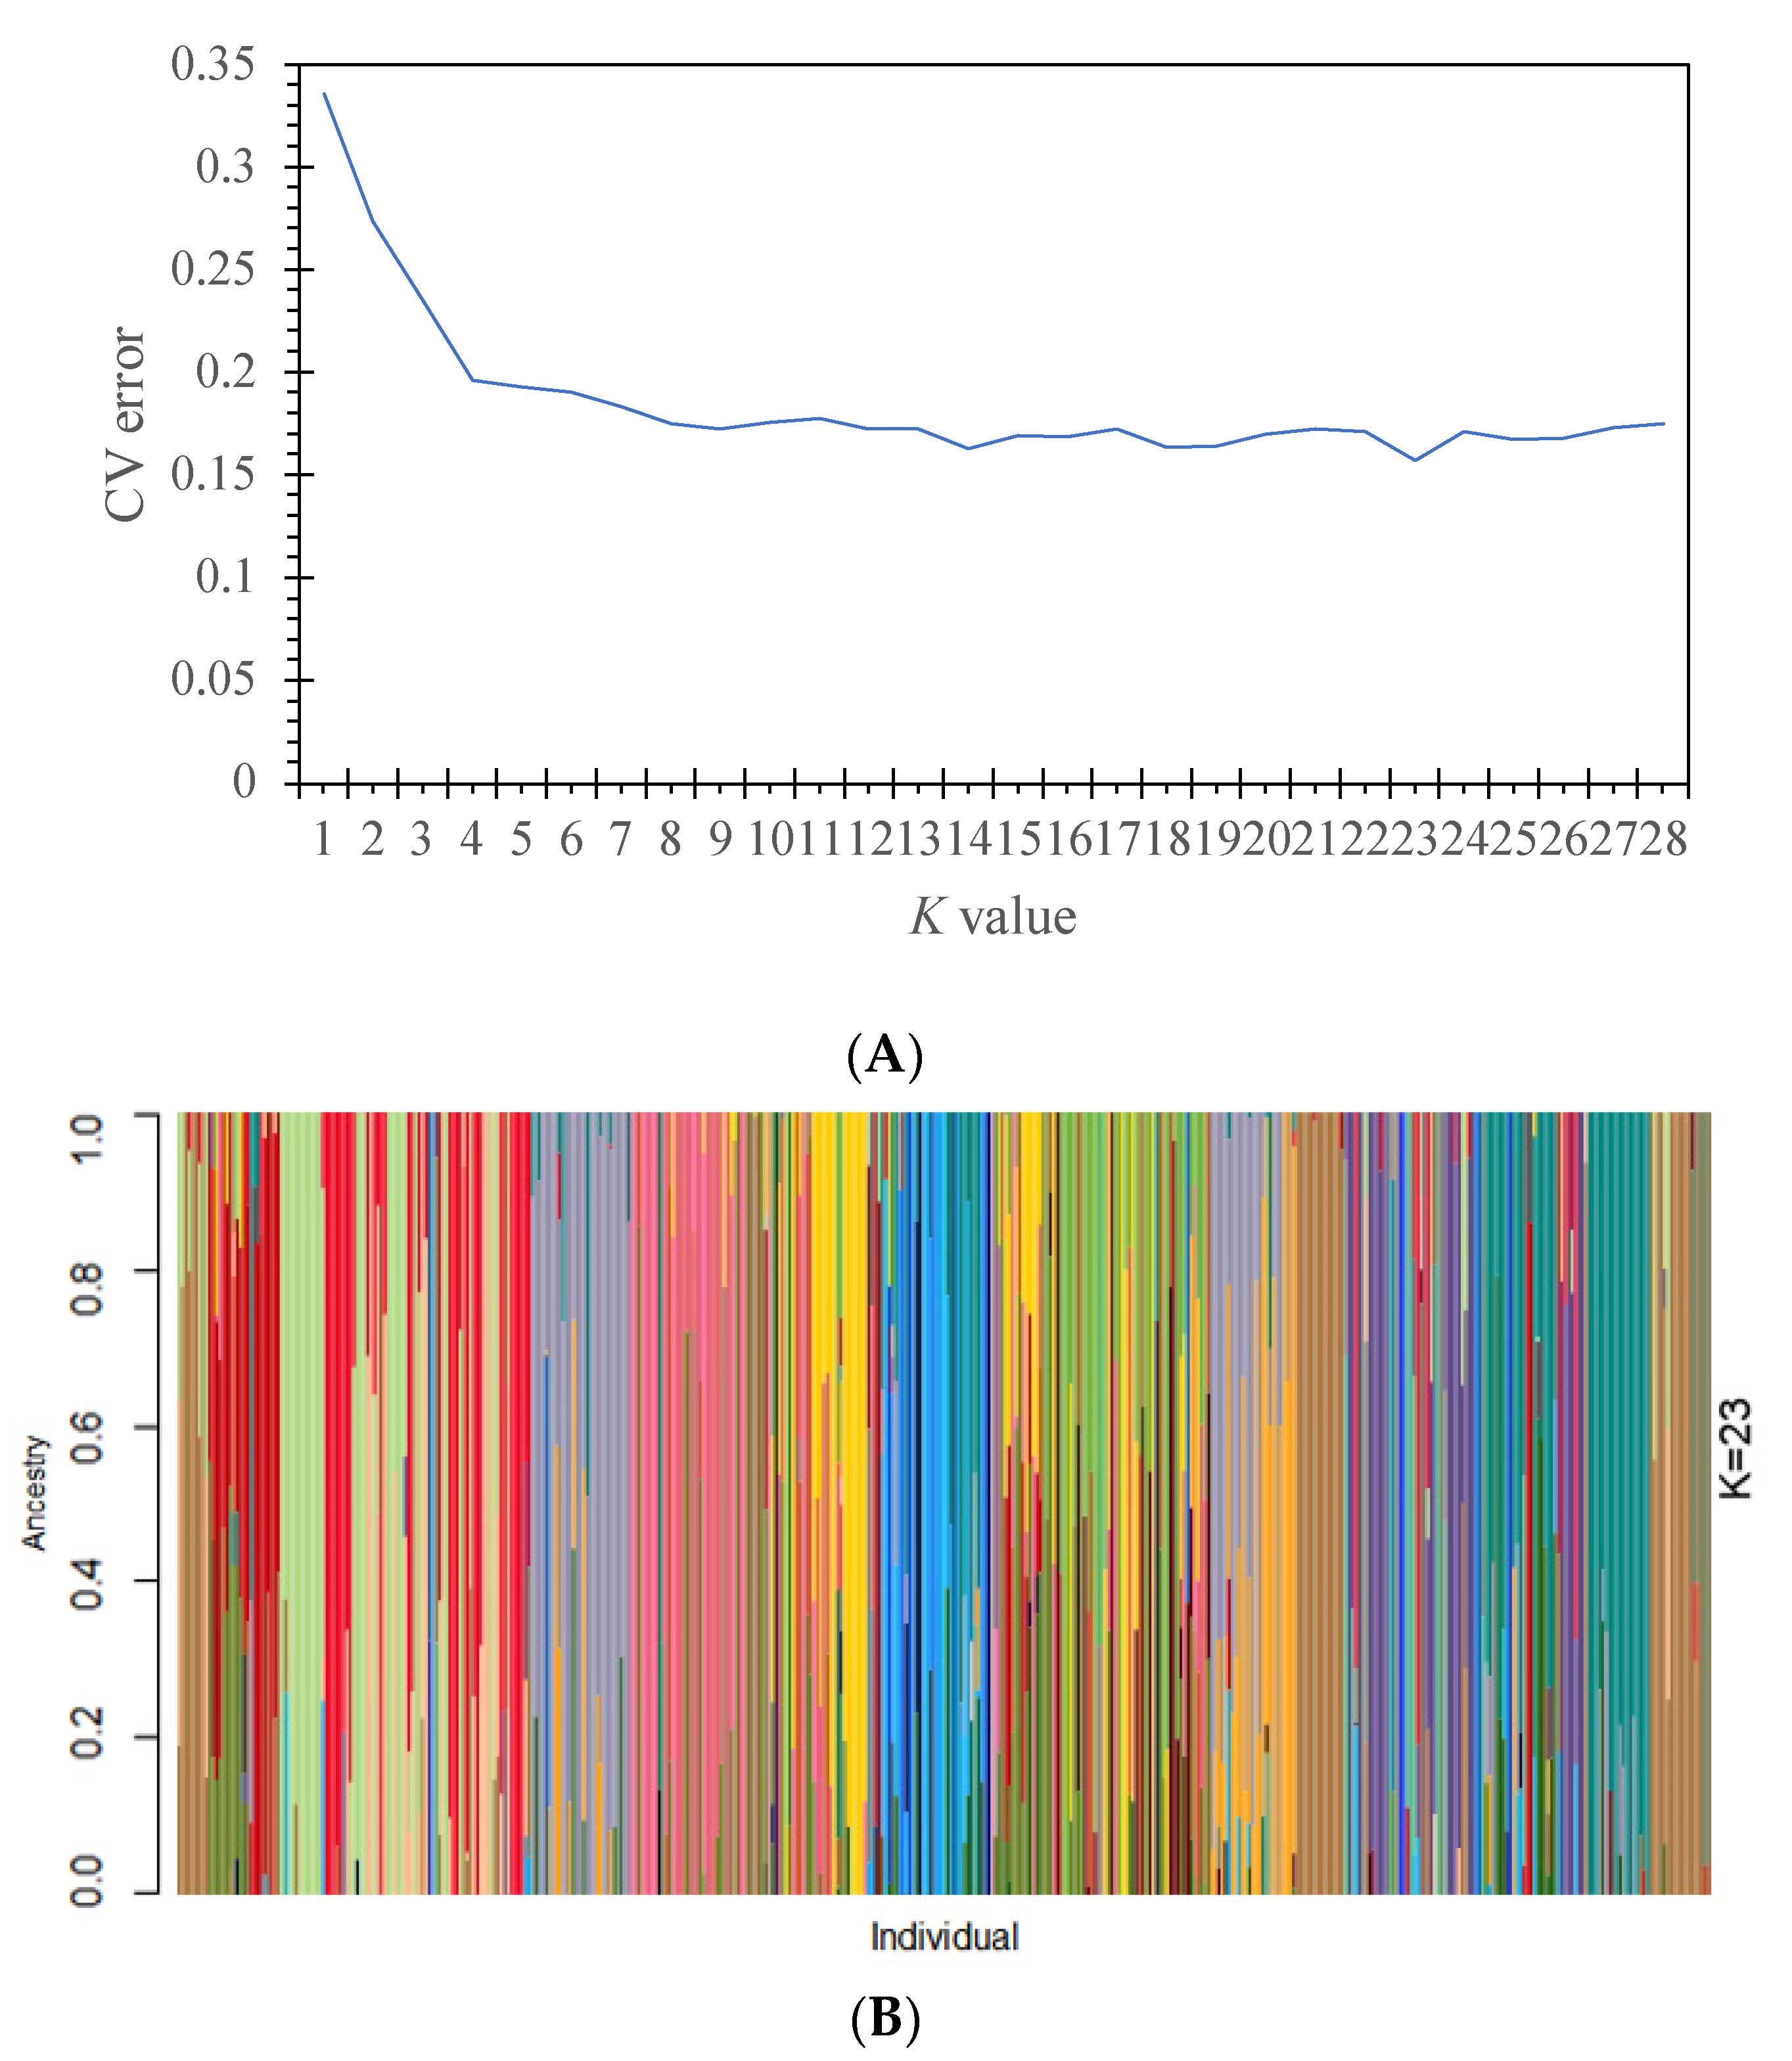
3.2. Population Genetic Structure

For the psbA-trnH fragment, AMOVA showed that 26.55% of the total genetic variation was from among populations (p-value = 0.0000) and 73.45% was from within populations (Table 5). For the trnL-trnL fragment, AMOVA showed that a major proportion of genetic variation occurred among populations, accounting for 70.02% (p-value = 0.0000). For the concatenated sequences of the psbA-trnH and trnL-trnL fragments, AMOVA showed that 42.84% of the genetic variation occurred among populations (p-value = 0.0000) and 57.16% occurred from within populations. All these results indicated a significant level of difference in the genetic variation among populations of the T. ciliata complex.
A comparison of N s t and G s t confirmed the presence of phylogeographic structure in the distribution of haplotype diversity. Analysis with the psbA-trnH sequences showed that Gst (=0.1546) was significantly smaller than N s t (0.2194) (p-value < 5%). Analysis with the trnL-trnL sequences showed that G s t (0.2531) was also significantly smaller than N s t (0.6972). These results were consistent with the pattern of the haplotype diversity distribution (Figure 2). IBD tests indicated significant but small correlations between genetic differentiation and geographical distances (psbA-trnH: R2 = 0.0042, p-value = 2.02 × 10⁻¹²; trnL-trnL: R2 = 0.0001, p-value = 9.02 × 10⁻¹⁰) (Figure 3). Pearson’s correlation tests indicated that the observed haplotype diversity was not significantly correlated with elevation for the psbA-trnH fragment ( r = 0.3528, p-value = 0.0605) but was significantly correlated with elevation for the trnL-trnL fragment ( r = 0.4082, p-value = 0.0279).
Figure 4 shows a consensus tree among 29 populations. Generally, the twenty-nine populations could be divided into two groups: the western and eastern regions. The western region covered Yunnan (SM, PW, BS, YR), Guizhou (XY, WM, CH, LD), Guangxi (TL, XL, LL), Sichuan (DC, HD), and Guangdong (YF, LC) Provinces. The eastern region covered Fujian (NP, WY), Jiangxi (MT, GS, JL, JG), Anhui (HS, JX), Hunan (XN, HP, CB), Zhejiang (SC, XJ), and Hubei (XE) Provinces. Generally, the two regions were connected to each other in the geographical distribution of the T. ciliata complex.
The analysis of genetic relationships showed a good genetic mixture among the 447 individuals (Figure 5). Many individuals from different populations were more genetically related. A further analysis with ADMIXTURE showed that the optimal number of subpopulations was K = 23, with the minimum cross-validation (CV) error (CV error = 0.1574) (Figure 6). Individuals across populations were genetically well mixed by different proportions of the optimal 23 populations, supporting the phylogenetic relationships among individuals (Figure 5).

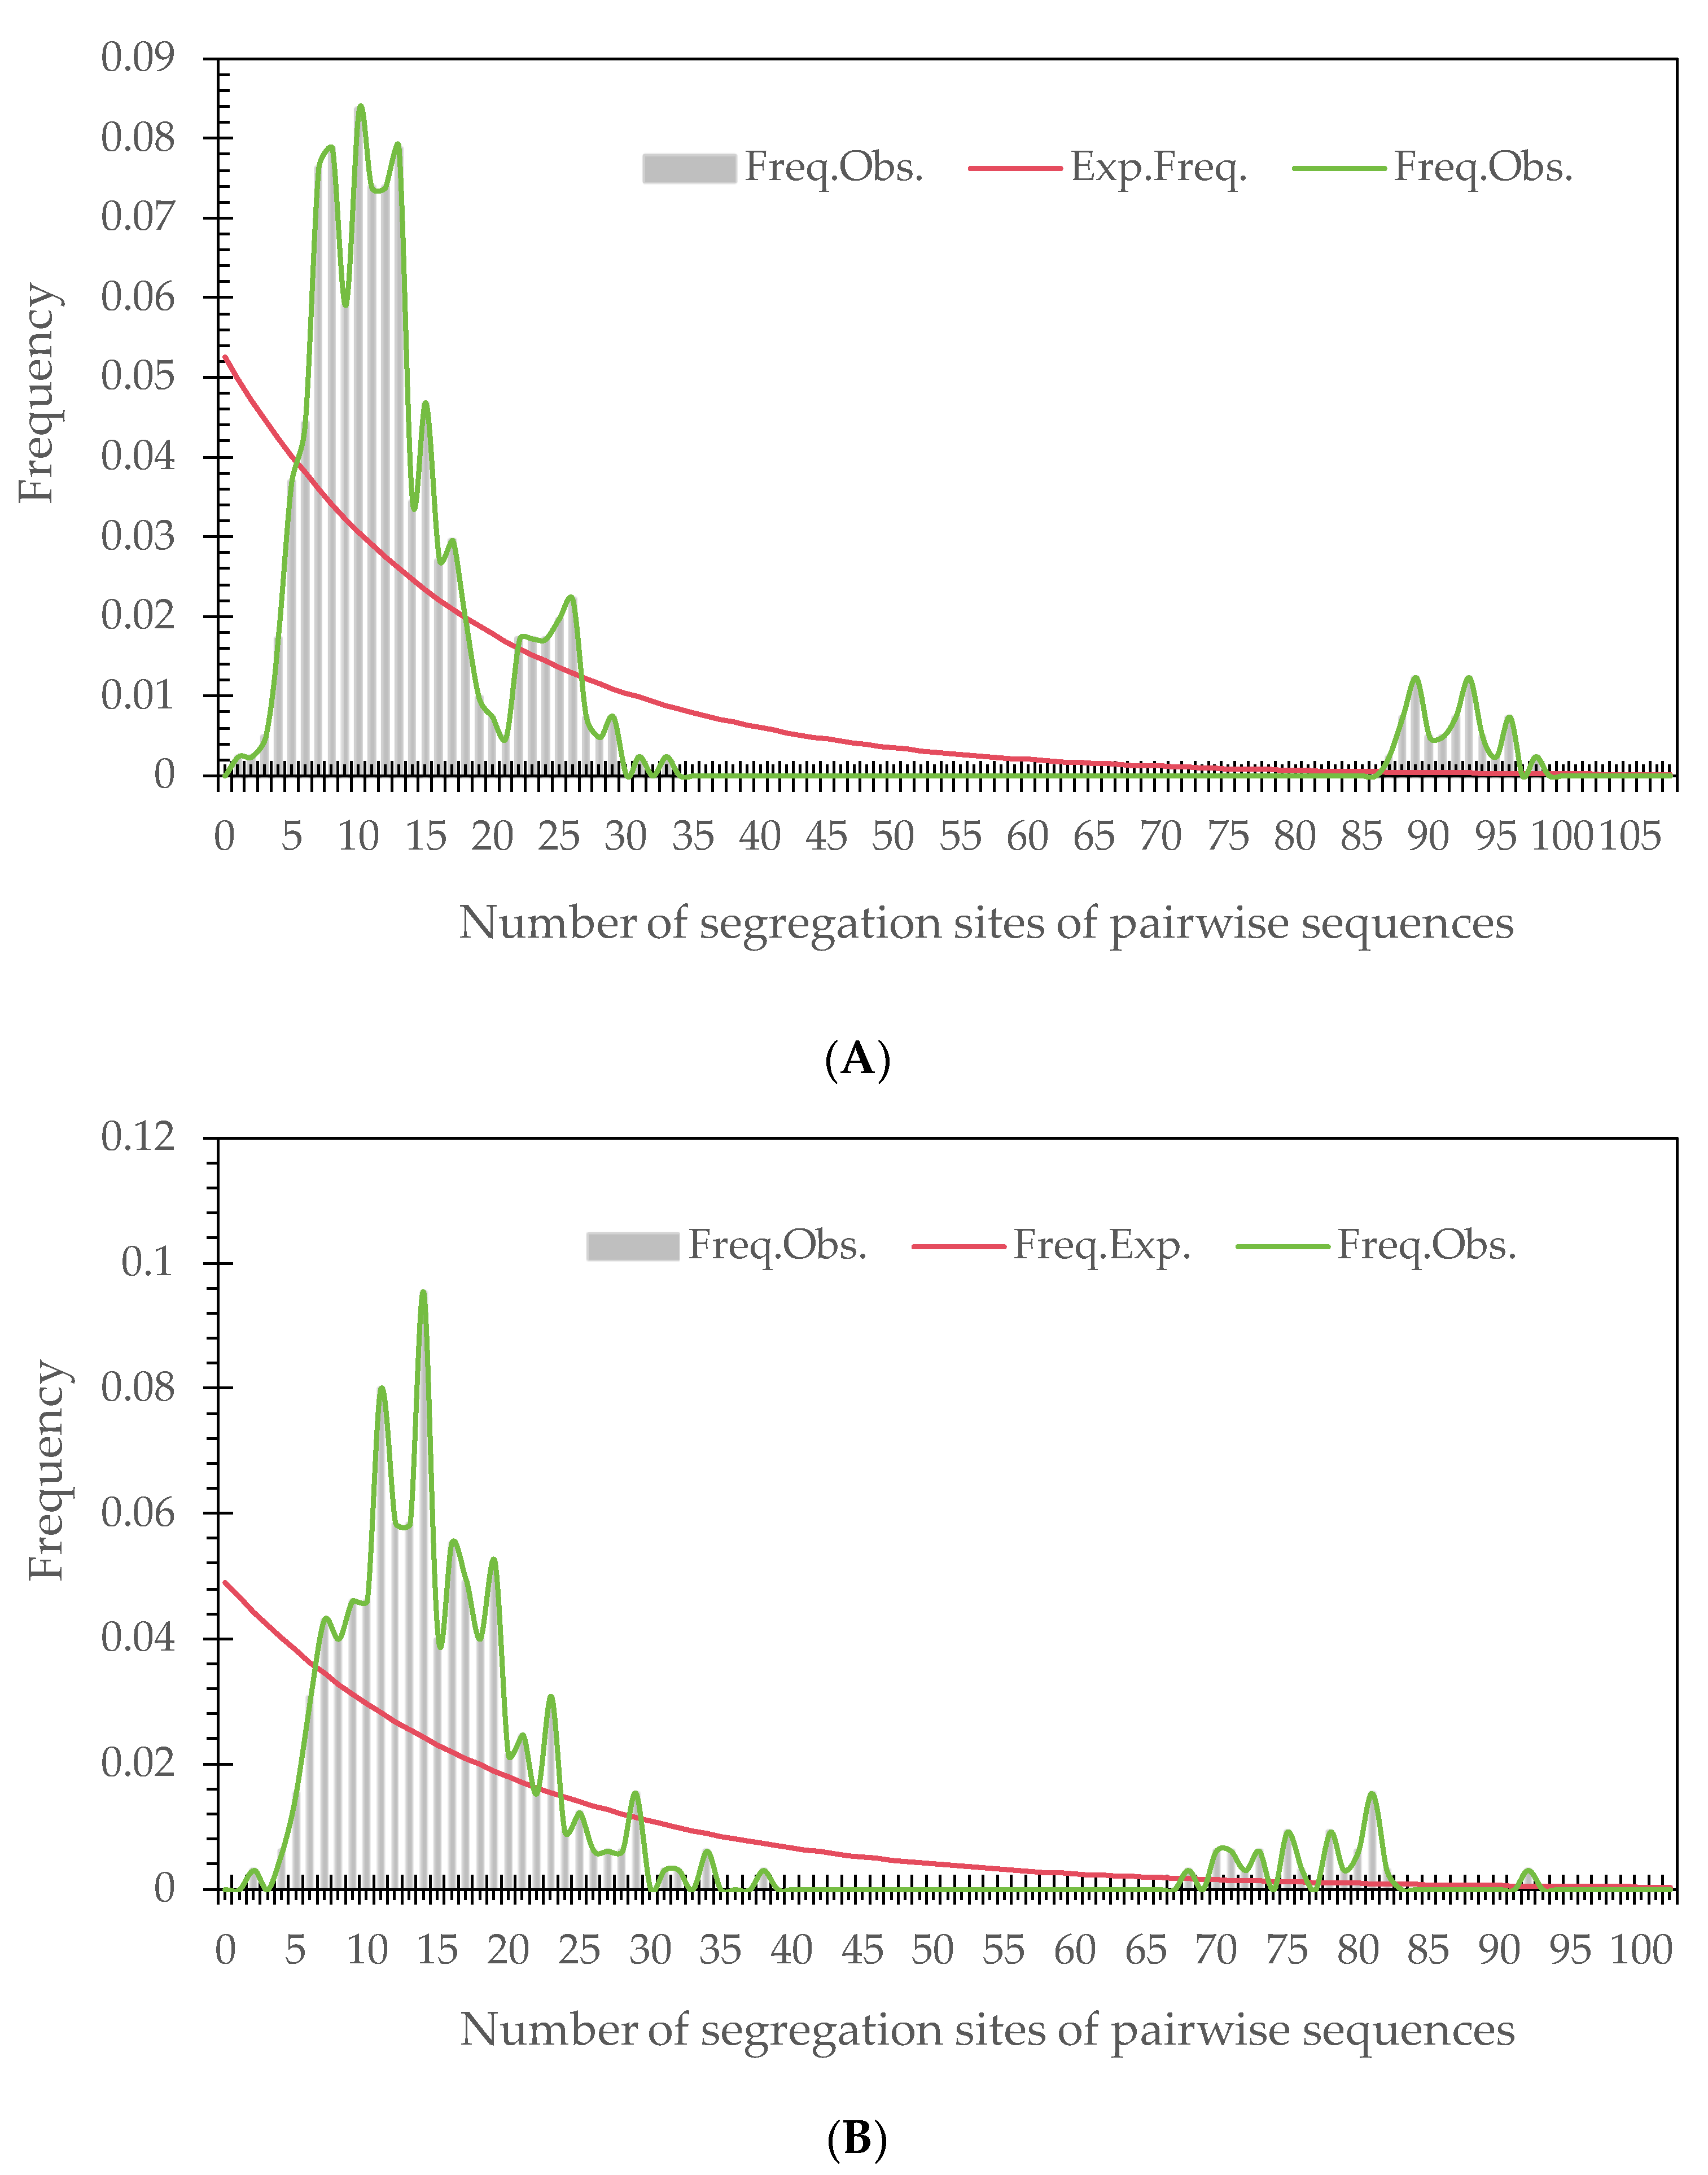
3.3. Analysis of Population Demography

Neutrality tests with the concatenated sequences of the psbA-trnH and trnL-trnL fragments indicated that most populations had negative Tajima’s D or Fu’s F values (Table 6). Eight populations had significant Tajima’s D values (p-value < 0.05), including populations LL, SM, DC, WM, BS, TL, JX, and PW. Seven populations had significant Fu’s F values (p-value < 0.05), including populations DC, YR, LD, TL, CH, HD, and MT. Only two populations (DC and TL) exhibited significant Tajima’s D and Fu’s F values (negative). There were four populations with positive Tajima’s D values, including SC, CB, NP, and JG, suggesting that these populations had not experienced expansion.
Mismatch distribution analyses indicated that populations with significant Tajima’s D or Fu’s F did not expand significantly, with the probabilities of P (expected SSD observed SSD) < 0.95 and P (expected RAG observed RAG) < 0.95 (Table 6). The actual observed curves were essentially multimodal or sawtooth-shaped, indicating that these populations had not recently experienced expansion or a range expansion. Figure 7 shows the mismatch distributions of populations DC and TL with negative Tajima’s D and Fu’s F values, suggesting that these two populations did not expand after bottleneck effects. Taken together, populations of the T. ciliata complex generally did not experience expansion in its natural distribution in China, although a couple of local populations could exhibit potential expansion.

4. Discussion

4.1. Genetic Diversity

This study is complementary to previous studies that used both nuclear and mitochondrial DNA markers [4,18,20]. The results consolidate previous results of genetic diversity derived from SRAP, SSR, and nuclear ITS markers. Combining the results from organelle (mtDNA, cpDNA) and nuclear genome (SRAP, SSR, and ITS) markers, we conclude two common patterns regarding the spatial distribution of genetic diversity: (1) The range-wide distribution can be generally divided into western and eastern regions, although the boundaries between them are difficult to delineate. (2) The western region harbors larger genetic diversity than the eastern region. Note that the western region may be further divided into two regions based on mtDNA markers [4]. It is speculated that the T. ciliata complex could likely initialize in the western region and move forward to the eastern side of China, although the original center of T. cilata remains to be determined. This could likely have a similar origination to T. sinensis in China [49]. Lu et al. [49] thought that Chinese T. sinensis could originate from the regions of northeastern India and Burma. This needs further verification in future studies.
As expected, cpDNA markers had greater haplotype diversity and nucleotide diversity per site than mtDNA markers [4]. The haplotype diversity of these two cpDNA fragments in the overall samples (the observed h = 0.9767 for the psbA-trnH fragment and the observed h = 0.8999 for the trnL-trnL fragment) is also greater than some other plants, such as Camellia huana (h = 0.759) [50], Michelia shiluensis (h = 0.674) [51], Iris loczyi (h = 0.820) [52], Rhododendron rex (h = 0.788) [53], Vouacapoua americana (h = 0.87) [54], and Tilia cordata (h = 0.881) [55]. One main reason is the higher mutation rates occurring in these two fragments, although the general mutation rate over the whole chloroplast genome is not high [27]. Many unique haplotypes with a couple of mutations that are different from major haplotypes likely occurred from recent mutations (Figure 1), which enhances the overall haplotype and nucleotide diversity.
The distribution of haplotypes in the western region was consistent with previous results. Xiao et al. [21] showed well-mixed phylogenetic relationships among individuals of four varieties of T. ciliata in Yunnan Province (T. ciliata var. ciliata, T. ciliata var. yunnanensis, T. ciliata var. pubescens, and T. ciliata var. henryi), implicating close genetic relationships among individuals in the western region in terms of chloroplast genomes. The distribution of haplotypes in the entire region showed an obvious phylogeographic structure, and different haplotypes were not randomly distributed in space. For example, dominant haplotype H1, coded in both fragments, appeared only in the eastern region of the whole distribution, and each was distributed in geographically similar ranges. These consolidate the previous study showing a phylogeographic structure in the T. ciliata complex with nuclear ITS markers [4].

4.2. Population Genetic Structure

The analysis of genetic structure among all populations showed moderate and significant genetic differentiation, accounting for 42.84% of the total genetic variation. This level of differentiation is lower than that derived from haploid nuclear SRAP (79.2%) [18], mtDNA (88.84%), and nuclear ITS (71.43%) [4] but greater than the genetic differentiation derived from SSR markers with the same 29 populations (32.4%) [20] and with six different populations (34.5%) [24]. As expected, the genetic differentiation derived from cpDNA markers is greater than that of some tropical forest species derived from nuclear allozymes [56]. In theory, when gene flow and genetic drift are the only two processes under the neutral hypothesis, population differentiation is expected to be greater for cpDNA markers of maternal inheritance than for nuclear markers of biparental inheritance but comparable between cpDNA and mtDNA markers with maternal inheritance [31]. However, the preceding comparison is not in good agreement with this theoretical expectation, where genetic differentiation with cpDNA markers is smaller than that with ITS and mtDNA markers.
One possible explanation is that high mutation rates in these two cpDNA fragments produced moderate genetic differentiation. This could be inferred in theory from Wright’s formula under equilibrium of drift–migration–mutation in island model [30]: F s t = 1 + 2 N e ( m s + μ ) 1 , where m s is the migration rate of seeds and μ is the mutation rate. A high mutation rate results in small genetic differentiation, which was supported from a comparison of Fst values derived from the SSR versus ITS markers (32.4% vs. 71.43%) with the same populations [4,20]. The mutation rate of SSR markers is often considered to be higher than that of ITS markers. This could explain why the Fst derived from cpDNA markers is smaller than that derived from mtDNA markers or potentially smaller than that derived from nuclear ITS markers despite lower genetic drift effects for nuclear genomes [31]. A comparison of genetic differentiation between the two markers (Table 5) implies that the mutation rate in the psbA-trnH fragment could be greater than that in the trnL-trnL fragment, as was discussed by Zhu et al. [34] in medicinal plants.
A further insight into the effects of high mutation rates on genetic differentiation could be approximated from a comparison of F s t ( c p ) = 1 + 2 N e ( m s + μ c p ) 1 for cpDNA markers and F s t ( m t ) = 1 + 2 N e ( m s + μ m t ) 1 for mtDNA markers under equilibrium. Assuming that the mutation rate for mtDNA markers is negligible ( μ m t 0 ), we can obtain the following expression:
μ c p m s = 1 F s t ( c p ) 1 1 F s t ( m t ) 1 1
Substitution of F s t ( m t ) = 0.8884 [4] and F s t ( c p ) = 0.4284 into Equation (3) yields a point estimate of μ c p / m s = 9.6234 1.0, which is analogous to the genetic variation at copy number variation loci in Homo sapiens [57]. The mutation rates at these two fragments are likely not as small as we generally thought before, and they play an important role in shaping the population genetic structure at these two loci.
Population structure in woody species is affected by multiple ecological and life history traits, including taxonomic status (angiosperm versus gymnosperm), regional distribution, geographical range, mating system, and seed dispersal [58]. The geographical range of the T. ciliata complex involves complicated landscape structure (fragmented) and connectivity. From the results assayed with mtDNA markers [4], the investigated populations were divided into three groups from the elevations of 617.34 ± 264.19 m in the eastern region to 732.37 ± 250.87 m in the central region and 1407.67 ± 321.81 m in the western region. The central populations investigated (XY, LL, WM, XL, CH, TL, LD, and YF) were mainly located in Guizhou and Guangxi Provinces and showed small genetic variation among them due to geographic proximity. However, the overall range harbors diverse habitats that caused population isolation and intensified genetic differentiation among populations of the T. ciliata complex. Significant IBD effects could be an important factor causing substantial genetic differentiation at the range-wide scale, which was detected by both organelle and nuclear genome markers [4]. The result indicating correlations between haplotype diversity and elevation implies that mountain ranges played a certain role in blocking gene flow at the range-wide scale [4]. This is similar to the pattern of subtropical and tropical Machilus pauhoi in South China [59]. The terrain in the eastern region is mostly mountain, which hinders both pollen and seed dispersal, resulting in less obvious pollen flow than that in the western region, in contrast to the western region, where pollen flow is more extensive than seed flow [4].
In addition, T. ciliata is mainly pollinated by insects [7], which could also enhance population structure. A study on the mating system of T. ciliata showed that pollen spread within and between populations was limited in different areas of the species’ distribution [24]. This may partly arise from the over-exploitation that led to low population density or the limited number of pollen donors within or between populations. Predominantly outcrossing with partial selfing and inbreeding facilitates IBD effects and, hence, population differentiation. The phylogenetic relationship among populations was closely linked to the geographical location, indicating an explicit haplotype geographical structure.

4.3. Genetic Conservation

The neutrality tests implied that these two markers were essentially neutral in all populations except for DC and TL based on both Tajima’s D and Wu’s F tests. The whole demography of the T. ciliata complex generally did not expand, although a few local populations likely expanded after bottleneck effects. The analysis of mismatch distribution also supported no general expansion in population demography. Previous analyses of maxent models showed no obvious widespread expansion of T. ciliata in the whole geographic range, although the whole range of T. ciliata could appear with some local expansions to the north but contraction in the south [60,61,62]. Thus, there is no strong evidence to suggest that the natural distribution of the T. ciliata complex will substantially expand in the future [4].
Information on well-mixed genetic relationships among all samples derived from phylogenetic relationships (Figure 5 and Figure 6) is partially consistent with the results of four varieties assayed with chloroplast sequences [21]. This supports the previous recommendation of conserving the genetic variation of this species in terms of the T. ciliata complex rather than individual varieties. Moreover, the differentiation between western and eastern regions coupled with IBD effects implies that multiple populations should be considered in the genetic conservation of the T. ciliata complex. Xiao [4] suggested that only a few of the populations could be appropriate for conservation in the central region based on an analysis with mtDNA and nuclear ITS markers. This is also supported by the analysis with cpDNA markers in the central region (mainly in Guizhou and Guangxi Provinces). Current over-exploitation of land and anthropogenic disturbances have exacerbated geographical and genetic isolation, which further impedes T. ciliata regeneration and fragments the distribution of the T. ciliata complex in China. Therefore, in formulating strategies for the conservation of genetic resources, we need to consider the conservation of multiple populations in the western and eastern regions in addition to the traditional model of extensive development and breeding. As an endangered species at level II in China, it is necessary to strengthen the protection of the existing genetic variation in the T. ciliata complex.

5. Conclusions

T. ciliata, an endangered species at level II in China, has received increasing concern for its genetic conservation. Here, we used cpDNA markers to investigate the genetic diversity and population structure of the T. ciliata complex at the range-wide scale, which is complementary to and consolidates previous studies that examined the phylogeography of the T. ciliata complex using mtDNA and nuclear DNA markers. We analyzed 447 samples from 29 populations across the species’ distribution in China. Our specific conclusions are summarized as follows: (1) The overall haplotype diversity and genetic diversity were high, and their spatial distributions exhibited explicit geographic structure; (2) the haplotype diversity was larger in the western region than in the eastern region; (3) genetic differentiation among populations was intermediate (Φst = 42.84%), and significant effects of isolation by distance were present; and (4) the natural distribution of T. ciliata did not show apparent expansion, although a few local populations might expand after bottleneck effects. By synthesizing the overall results from organelle (mtDNA, cpDNA) and nuclear (SRAP, SSR, and ITS) genome markers, we suggest that a genetic conservation strategy in terms of the T. ciliata complex is appropriate. Attention to more populations in the western region than in the eastern region is suggested for the genetic conservation of the T. cilata complex. This also supports previous recommendations for the genetic conservation of this endangered species.

Supplementary Materials

The following supporting information can be downloaded at: https://www.mdpi.com/article/10.3390/genes15030320/s1. Figure S1: Electrophoresis of PCR amplification products of two primer pairs (psbA-trnH and trnL-trnL); Figure S2: Sequencing peak maps checked using Chromatogram Explorer 3.2 for the psbA-trnH and trnL-trnL fragment amplifications; Table S1: Four hundred and forty-seven samples of concatenated alignment sequences of the psbA-trnH and trnL-trnL fragments; Table S2: Sequences of 239 haplotypes for the psbA-trnH fragment; Table S3: Sequences of 143 haplotypes for the trnL-trnL fragment.

Author Contributions

Z.-Y.W. analyzed data and prepared the original draft; Y.H. conducted experiments and analyzed data; Y.-W.L. and Y.X. participated in the data analysis; Z.-H.H. and C.W. provided logistic assistance; X.-S.H. designed this study and edited this manuscript. All authors have read and agreed to the published version of the manuscript.

Funding

This research was funded by the National Natural Science Foundation of China, grant number 32171819, and South China Agricultural University, grant number 4400-K16013.

Institutional Review Board Statement

Not applicable.

Informed Consent Statement

No applicable.

Data Availability Statement

All data sets used in this study are provided in Tables S1–S3 in the Supplementary Materials.

Acknowledgments

We are grateful to three anonymous reviewers for their constructive comments on this article and to Xiao-Yang Chen and Pei Li for providing most of the experiment samples.

Conflicts of Interest

The authors declare no conflicts of interest. The funders had no role in the design of this study; in the collection, analyses, or interpretation of data; in the writing of this manuscript, or in the decision to publish the results.

References

  1. Chen, S.K.; Li, H.; Chen, B.Y. Meliaceae. Flora Reipublicae Popularis Sinicae; Science Press: Beijing, China, 1997; Volume 43, pp. 40–43. [Google Scholar]
  2. Ferreira, D.M.; Palma-Silva, C.; Neri, J.; Medeiros, M.C.; Pinange, D.S.; Benko-Iseppon, A.M.; Louzada, R.B. Population genetic structure and species delimitation in the Cryptanthus zonatus complex (Bromeliaceae). Bot. J. Linn. Soc. 2021, 196, 123–140. [Google Scholar] [CrossRef]
  3. Freeland, J.R.; Petersen, S.D.; Kirk, H. Molecular Ecology; John Wiley & Sons, Ltd.: West Sussex, UK, 2011. [Google Scholar]
  4. Xiao, Y.; Zhang, X.X.; Hu, Y.; Wang, X.; Li, P.; He, Z.H.; Lv, Y.W.; Chen, X.Y.; Hu, X.S. Phylogeography of Toona ciliata (Meliaceae) complex in China inferred from cytonuclear markers. Genes 2023, 14, 116. [Google Scholar] [CrossRef]
  5. Edmonds, J.M. The potential value of Toona species (Meliaceae) as multipurpose and plantation trees in Southeast Asia. Commonw. For. Rev. 1993, 72, 181–186. [Google Scholar]
  6. Edmonds, J.M.; Staniforth, M. Toona sinensis (Meliaceae). Curtis’s Bot. Mag. 1998, 15, 186–193. [Google Scholar] [CrossRef]
  7. Styles, B.T. The flower biology of Meliaceae and its bearing on tree breeding. Silvae Genet. 1972, 21, 175–182. [Google Scholar]
  8. Liu, J.; Sun, Z.X.; Chen, Y.T.; Jiang, J.M. Isolation and characterization of microsatellite loci from an endangered tree species, Toona ciliata var. Pubescens. Genet. Mol. Res. 2012, 11, 4411–4417. [Google Scholar] [CrossRef] [PubMed]
  9. Cheng, D.S.; Cui, T.L. Utilization value and cultivation techniques of Toona sureni. For. By-Prod. Spec. China 2010, 4, 39–40. [Google Scholar]
  10. Liang, R.L.; Liao, R.Y.; Dai, J. Endangered causes and protection strategy of Toona ciliata. Guangxi For. Sci. 2011, 40, 201–203. [Google Scholar]
  11. Wu, J.Y.; Cheng, Y.; Wang, X.J.; Chen, R.; Liu, Q.; Liu, X.Y.; Yin, H.Y.; Wu, X.W. Softwood cutting propagation of Toona ciliata clones. Hunan For. Sci. Technol. 2012, 38, 5. [Google Scholar]
  12. Chen, K. Technology of Tonna Tissue Cultivation Research. Master’s Thesis, Central South University of Forestry and Technology, Changsha, China, 2016. [Google Scholar]
  13. Zhang, H.B.; Zhang, G.Y.; Huang, G.Y.; Wu, D.; Wang, X.Y. Research on Tonna ciliata seedling and silviculture technology. Sci. Technol. 2016, 26, 83. [Google Scholar]
  14. Li, P.; Que, Q.M.; Wu, L.Y.; Zhu, Q.; Chen, X.Y. Growth rhythms of Toona ciliata seedlings from different provenances. J. South China Agri. Univ. 2017, 38, 96–102. [Google Scholar]
  15. Wen, W.H.; Wu, J.Y.; Chen, M.G.; Chen, J.F.; Cheng, Y.; Wang, X.J.; Liu, Q. Seedling growth performance of Toona ciliata elite trees progeny. China Agric. Sci. Bull. 2012, 28, 36–39. [Google Scholar]
  16. Liao, D.; Wu, J.; Shu, Y.; Cheng, Y.; Chen, M.; Chen, J.; Liu, Q.; Wu, Z. Tissue culture of Toona ciliata. Agric. Sci. Technol. 2017, 18, 2185–2187+2196. [Google Scholar]
  17. Lan, J.H.; Feng, L.X. Study on cutting propagation technology of rare timber species Toona ciliata Roem. J. Guangxi Agric. 2022, 37, 32–36+48. [Google Scholar]
  18. Li, P.; Zhan, X.; Que, Q.M.; Qu, W.T.; Liu, M.Q.; Ouyang, K.X.; Li, J.C.; Deng, X.M.; Zhang, J.J.; Liao, B.Y.; et al. Genetic diversity and population structure of Toona ciliata Roem. based on sequence-related amplified polymorphism (SRAP) markers. Forests 2015, 6, 1094–1106. [Google Scholar] [CrossRef]
  19. Xing, P.Y.; Liu, T.; Song, Z.Q.; Li, X.F. Genetic diversity of Toona sinensis Roem in China revealed by ISSR and SRAP markers. Genet. Mol. Res. 2016, 15, 15038387. [Google Scholar] [CrossRef]
  20. Zhan, X.; Li, P.; Hui, W.K.; Deng, Y.W.; Gan, S.M.; Sun, Y.; Zhao, X.H.; Chen, X.Y.; Deng, X.M. Genetic diversity and population structure of Toona ciliata revealed by simple sequence repeat markers. Biotechnol. Biotechnol. Equip. 2019, 33, 214–222. [Google Scholar] [CrossRef]
  21. Xiao, Y.; Wang, X.; He, Z.H.; Lv, Y.W.; Zhang, C.H.; Hu, X.S. Assessing phylogenetic relationships among varieties of Toona ciliata in sympatry with chloroplast genomes. Ecol. Evol. 2023, 13, e10828. [Google Scholar] [CrossRef]
  22. Liu, J.; Jiang, J.M.; Chen, Y.T. Genetic diversity of central and peripheral populations of Toona ciliata var. pubescens, an endangered tree species endemic to China. Genet. Mol. Res. 2014, 13, 4579–4590. [Google Scholar] [CrossRef]
  23. Liu, J.; Chen, Y.T.; Jiang, J.M.; He, G.P.; Yu, G.M. Study on population genetic structure in Toona ciliata var. pubescens with SSR. For. Res. 2009, 22, 37–41. [Google Scholar]
  24. Zhou, W.; Zhang, X.X.; Ren, Y.; Li, P.; Chen, X.Y.; Hu, X.S. Mating system and population structure in the natural distribution of Toona ciliata (Meliaceae) in South China. Sci. Rep. 2020, 10, 16998. [Google Scholar] [CrossRef]
  25. Wang, X.; Xiao, Y.; He, Z.H.; Li, L.L.; Song, H.Y.; Zhang, J.J.; Cheng, X.; Chen, X.Y.; Li, P.; Hu, X.S. A chromosome-level genome assembly of Toona ciliata (Meliaceae). Genome Biol. Evol. 2022, 14, evac121. [Google Scholar] [CrossRef]
  26. Wang, X.; Xiao, Y.; He, Z.H.; Li, L.L.; Lv, Y.W.; Hu, X.S. Evolutionary divergence between Toona ciliata and Toona sinensis assayed with their whole genome sequences. Genes 2022, 13, 1799. [Google Scholar] [CrossRef]
  27. Wolfe, K.H.; Li, W.H.; Sharp, P.M. Rates of nucleotide substitution vary greatly among plant mitochondrial, chloroplast, and nuclear DNAs. Proc. Natl. Acad. Sci. USA 1987, 84, 9054–9058. [Google Scholar] [CrossRef]
  28. Hu, Y.; Wang, X.; Zhang, X.X.; Zhou, W.; Chen, X.Y.; Hu, X.S. Advancing phylogeography with chloroplast DNA markers. Biodivers. Sci. 2019, 27, 219–234. [Google Scholar]
  29. Palmer, J.D. Comparative organization of chloroplast genomes. Ann. Rev. Genet. 1985, 19, 325–354. [Google Scholar] [CrossRef]
  30. Wright, S. Evolution and the Genetics of Populations; University Chicago Press: Chicago, IL, USA, 1969; pp. 1191–1192. [Google Scholar]
  31. Hu, X.S.; Ennos, R.A. Impacts of seed and pollen flow on population differentiation for plant genomes with three contrasting modes of inheritance. Genetics 1999, 152, 441–450. [Google Scholar] [CrossRef]
  32. Doyle, J.J.; Doyle, J.L. A rapid DNA isolation procedure for small quantities of fresh leaf material. Phytochemistry 1987, 19, 11–15. [Google Scholar]
  33. Taberlet, P.; Fumagalli, L.; Wust-Saucy, A.-G.; Cosson, J.-F. Comparative phylogeography and postglacial colonization routes in Europe. Mol. Ecol. 1998, 7, 453–464. [Google Scholar] [CrossRef]
  34. Zhu, S.; Liu, Q.; Qiu, S.; Dai, J.; Gao, X. DNA barcoding: An efficient technology to authenticate plant species of traditional Chinese medicine and recent advances. Chin. Med. 2022, 17, 112. [Google Scholar] [CrossRef]
  35. Kumar, S.; Stecher, G.; Tamura, K. MEGA7: Molecular evolutionary genetics analysis version 7.0. Mol. Biol. Evol. 2016, 33, 1870–1874. [Google Scholar] [CrossRef]
  36. Librado, P.; Rozas, J. DnaSP v5: A software for comprehensive analysis of DNA polymorphism data. Bioinformatics 2009, 25, 1451–1452. [Google Scholar] [CrossRef]
  37. Nei, M. Molecular Evolutionary Genetics; Columbia University Press: New York, NY, USA, 1987. [Google Scholar]
  38. Pons, O.; Petitt, R.J. Measuring and testing genetic differentiation with ordered versus unordered alleles. Genetics 1996, 144, 1237–1245. [Google Scholar] [CrossRef]
  39. Grivet, D.; Petit, R.J. Chloroplast DNA phylogeography of the hornbeam in Europe: Evidence for a bottleneck at the outset of postglacial colonization. Conserv. Genet. 2002, 4, 47–56. [Google Scholar] [CrossRef]
  40. Wright, S. The genetical structure of populations. Ann. Eugen. 1951, 15, 323–354. [Google Scholar] [CrossRef] [PubMed]
  41. Excoffier, L.; Laval, G.; Schneider, S. Arlequin (version 3.0): An integrated software package for population genetics data analysis. Evol. Bioinform. 2005, 1, 47–50. [Google Scholar] [CrossRef]
  42. Meirmans, P.G. Using the AMOVA framework to estimate a standardized genetic differentiation measure. Evolution 2006, 60, 2399–2402. [Google Scholar] [CrossRef]
  43. Rousset, F. Genetic differentiation and estimation of gene flow from F-statistics under isolation by distance. Genetics 1997, 145, 1219–1228. [Google Scholar] [CrossRef] [PubMed]
  44. Mantel, N. The detection of disease clustering and a generalized regression approach. Cancer Res. 1967, 27, 109–220. [Google Scholar]
  45. Alexander, D.H.; Novembre, J.; Lange, K. Fast model-based estimation of ancestry in unrelated individuals. Genome Res. 2009, 19, 1655–1664. [Google Scholar] [CrossRef] [PubMed]
  46. Tajima, F. Statistical method for testing the neutral mutation hypothesis by DNA polymorphism. Genetics 1989, 123, 585–595. [Google Scholar] [CrossRef]
  47. Fu, Y.X. Statistical tests of neutrality of mutations against population growth, hitchhiking and background selection. Genetics 1997, 147, 915–925. [Google Scholar] [CrossRef]
  48. Rogers, A.R.; Harpending, H. Population growth makes waves in the distribution of pairwise genetic differences. Mol. Biol. Evol. 1992, 9, 552–569. [Google Scholar]
  49. Lu, C.X.; Zhang, D.C.; Wang, D.B. Origin and taxonomic position of Chinese Toona (Toona sinensis (A. Juss.) Roem.). Bull. Bot. Res. 2001, 21, 195–199. [Google Scholar]
  50. Li, S.; Liu, S.L.; Pei, S.Y.; Ning, M.M.; Tang, S.Q. Genetic diversity and population structure of Camellia huana (Theaceae), a limestone species with narrow geographic range, based on chloroplast DNA sequence and microsatellite markers. Plant Divers. 2020, 42, 343–350. [Google Scholar] [CrossRef]
  51. Deng, Y.; Liu, T.; Xie, Y.; Wei, Y.; Xie, Z.; Shi, Y.; Deng, X. High genetic diversity and low differentiation in Michelia shiluensis, an endangered Magnolia species in south China. Forests 2020, 11, 469. [Google Scholar] [CrossRef]
  52. Zhang, G.L.; Han, Y.; Wang, H.; Wang, Z.Y.; Xiao, H.X.; Sun, M.Z. Phylogeography of Iris loczyi (Iridaceae) in Qinghai–Tibet Plateau revealed by chloroplast DNA and microsatellite markers. AoB Plants 2021, 13, plab070. [Google Scholar] [CrossRef]
  53. Zhang, X.; Liu, Y.H.; Wang, Y.H.; Shen, S.K. Genetic Diversity and Population Structure of Rhododendron rex Subsp. rex Inferred from Microsatellite Markers and Chloroplast DNA Sequences. Plants 2020, 9, 338. [Google Scholar] [CrossRef] [PubMed]
  54. Dutech, C.; Maggia, L.; Joly, H.I. Chloroplast diversity in Vouacapoua americana (Caesalpiniaceae), a neotropical forest tree. Mol. Ecol. 2000, 9, 1427–1432. [Google Scholar] [CrossRef]
  55. Fineschi, S.; Salvini, D.; Taurchini, D.; Carnevale, S.; Vendramin, G.G. Chloroplast DNA variation of Tilia cordata (Tiliaceae). Can. J. For. Res. 2003, 33, 2503–2508. [Google Scholar] [CrossRef]
  56. Hamrick, J.L.; Murawski, D.A. The breeding structure of tropical tree populations. Plant Species Biol. 1990, 5, 157–165. [Google Scholar] [CrossRef]
  57. Hu, X.S.; Yeh, F.C.; Hu, Y.; Deng, L.T.; Ennos, R.A.; Chen, X.Y. High mutation rates explain low population genetic divergence at copy-number-variable loci in Homo sapiens. Sci. Rep. 2017, 7, 43178. [Google Scholar] [CrossRef]
  58. Hamrick, J.L.; Godt, M.J.W.; Sherman-Broyles, S.L. Factors influencing levels of genetic diversity in woody plant species. New For. 1992, 6, 95–124. [Google Scholar] [CrossRef]
  59. Zhu, Q.; Liao, B.Y.; Li, P.; Li, J.C.; Deng, X.M.; Hu, X.S.; Chen, X.Y. Phylogeographic pattern suggests a major eastward dispersal in the distribution of Machilus pauhoi in South China. PLoS ONE 2017, 12, e0184456. [Google Scholar] [CrossRef] [PubMed]
  60. Hu, Y. Phylogeographic Structure of Toona ciliata (Meliaceae) in China Inferred from cpDNA Markers and Ecological Niche Model Analyses. Master’s Thesis, South China Agricultural University, Guangzhou, China, 2019. [Google Scholar]
  61. Zhang, C.H.; He, J.; Sun, Y.Y.; Li, K. Prediction of distributional change of Toona ciliata var. ciliata and application in regionalization of introduction based on MaxEnt. J. Yunnan Univ. 2018, 40, 164–173. [Google Scholar]
  62. Zhang, C.H.; He, J.; Sun, Y.Y.; Li, K. Distributional change in suitable areas for T. ciliata var. pubescens based on MaxEnt. For. Res. 2018, 31, 120–126. [Google Scholar]
Figure 1. Phylogenetic relationships among haplotypes H1–H46: (A) psbA-trnH fragment and (B) trnL-trnL fragment. Note that the haplotype sequences for the same code Hi (i = 1, …, 46) were different between the two fragments.
Genes 15 00320 g001
Figure 2. A map showing the twenty-nine sample sites and the geographic distribution of the cpDNA haplotypes of the psbA-trnH and trnL-trnL fragments: (A) the psbA-trnH fragment and (B) the trnL-trnL fragment. The pie charts show different proportions of haplotypes within each population. Different haplotypes are denoted by code Hi (i = 1, 2, … 47). Each color in the pie charts represents one haplotype (H1–H47).
Genes 15 00320 g002
Figure 3. Tests of the effects of isolation by distance (IBD) on population genetic differentiation: (A) the psbA-trnH fragment and (B) the trnL-trnL fragment. Significant but weak IBD effects occurred among populations. The red line in each figure indicated the trend of the relationship between Fst/(1-Fst) and the logarithm of geographic distance.
Genes 15 00320 g003
Figure 4. Phylogenetic relationships among 29 populations of the T. ciliata complex derived from concatenated sequences of the psbA-trnH and trnL-trnL fragments. The maximum likelihood method with 1000 bootstrap resamples was used to draw the consensus tree. Populations in grey and blue were grouped into eastern and western regions, respectively.
Genes 15 00320 g004
Figure 5. Phylogenetic relationships among 447 individuals using the concatenated sequences of the psbA-trnH and trnL-trnL fragments. The tree was drawn by the maximum likelihood method.
Genes 15 00320 g005
Figure 6. Population structure analysis of 447 individuals of the T. ciliata complex. (A) Cross-validation (CV) errors for the number of subpopulations (K) changing from 1 to 28. (B) A partitioned map of individuals with clustering assignments (K = 23) indicated in different colors. The proportions of genetic components from different subpopulations in each individual were indicated in different colors.
Genes 15 00320 g006
Figure 7. Analysis of mismatch distribution using the concatenated sequences of the psbA-trnH and trnL-trnL fragments: (A) population DC and (B) population TL. The grey bar lines and green lines are the observed frequencies under different numbers of segregation sites of pairwise sequences, whereas the red lines are the expected frequencies under a model of sudden population expansion [48].
Genes 15 00320 g007
Table 1. Localities and 447 individuals of 29 populations of the T. ciliata complex analyzed with cpDNA markers.
CodeLocationSample SizeLongitude (E)Latitude (N)Elevation (m)
XJXianju, Zhejiang9119.9228.45600
LLLonglin, Guangxi10105.2024.46624
SMSimao, Yunnan11100.5822.461317
SCSuichang, Zhejiang12119.2528.59510
CBChengbu, Hunan23111.2827.14737
XNXinning, Hunan11109.4428.18650
NPNanping, Fujian9118.1026.38800
JLJiulianshan, Jiangxi18114.4724.54610
DCDechang, Sichuan29102.3226.401325
XYXingyi, Guizhou15104.5425.061160
XLXilin, Guangxi24105.0524.29899
WMWangmo, Guizhou30106.0525.10500
YRYongren, Yunnan27101.3225.011539
BSBaoshan, Yunnan1199.0625.041513
LDLuodian, Guizhou14106.4425.25814
TLTianlin, Guangxi26106.1324.17792
CHCeheng, Guizhou22105.4824.59730
HDHuidong, Sichuan25102.0927.231862
JXJingxian, Anhui15118.2430.41366
HSHuangshan, Anhui6118.0830.16499
WYWuyishan, Fujian9117.4228.181200
JGJinggangshan, Jiangxi5114.1726.44400
XEXuanen, Hubei9109.2830.17632
GSGuanshan, Jiangxi11115.2627.19337
PWPuwen, Yunnan21101.0422.23890
MTMaotoushan, Jiangxi9117.0327.411000
YFYunfu, Guangdong18111.3422.46340
HPHupingshan, Hunan3111.4129.01436
LCLechang, Guangdong15113.2025.07359
Table 2. Tested cpDNA primer sequences in T. ciliata complex.
PrimersSequence 5′-3′
psbA-trnHGTTATGCATGAACGTAATGCTC
CGCGCATGGTGGATTCACAATCC
trnT-trnLCATTACAAATGCGATGCTCT
TCTACCGATTTCGCCATATC
trnL-trnLCGAAATCGGTAGACGCTACG
GGGGATAGAGGGACTTGAAC
trnL-trnFGGTTCAAGTCCCTCTATCCC
ATTTGAACTGGTGACACGAG
Table 3. Haplotypes and haplotype diversity for the psbA-trnH fragment in each population of the T. ciliata complex.
PopulationObserved Haplotype Diversity (h)Nucleotide Diversity per Site (π)Number of
Haplotypes #
Types of Haplotypes
XJ0.56790.00153 + 0H1 H2 H3
LL0.66000.00702 + 2H4 H6 H47
SM0.31400.00112 + 1H9 H10 H47
SC0.51390.00174 + 0H1 H2 H3 H11
CB0.88090.00846 + 5H12 H13 H14 H16 H17 H19 H47
XN0.90910.07125 + 6H2 H17 H26 H27 H28 H47
NP0.80250.00704 + 2H1 H26 H28 H32 H47
JL0.87650.01186 + 5H1 H2 H27 H28 H32 H35 H47
DC0.94890.01863 + 21H5 H43 H44 H47
XY0.58670.00464 + 1H4 H6 H7 H8 H47
XL0.73960.00884 + 4H4 H6 H7 H15 H47
WM0.92890.03217 + 15H4 H6 H18 H20 H21 H22 H23 H47
YR0.91630.00878 + 11H9 H10 H24 H25 H29 H30 H31 H33 H47
BS0.89260.05264 + 6H10 H29 H30 H33 H47
LD0.89800.01546 + 6H6 H7 H18 H21 H22 H34 H47
TL0.95860.02574 + 21H22 H34 H36 H37 H47
CH0.95040.02633 + 18H8 H37 H38 H47
HD0.95040.02141 + 22H39 H47
JX0.34670.01612 + 2H2 H3 H47
HS0.83330.13980 + 6H47
WY0.81480.09222 + 5H40 H41 H47
JG0.80000.07680 + 5H47
XE0.88890.08174 + 5H1 H35 H41 H42 H47
GS0.90910.11334 + 7H40 H42 H45 H46 H47
PW0.87530.01445 + 8H9 H10 H25 H31 H33 H47
MT0.88890.01642 + 7H2 H45 H47
YF0.00000.00001 + 0H9
HP0.44440.00272 + 0H2 H3
LC0.33780.00133 + 0H2 H9 H46
Total0.97670.030346 + 193H1–H47
#: x + y means that there were x haplotypes whose abundances were not less than two and y haplotypes whose abundance was one in overall samples.
Table 4. Haplotypes and haplotype diversity for the trnL-trnL fragment in each population of the T. ciliata complex.
PopulationObserved Haplotype Diversity (h)Nucleotide Diversity per Site (π)Number of
Haplotypes #
Types of Haplotypes
XJ0.00000.00001 + 0H1
LL0.82000.00314 + 3H2 H3 H4 H5 H47
SM0.79340.00764 + 2H3 H4 H9 H11 H47
SC0.00000.00001 + 0H1
CB0.38560.00082 + 0H1 H13
XN0.00000.00001 + 0H1
NP0.00000.00001 + 0H1
JL0.00000.00001 + 0H1
DC0.82520.00497 + 9H16 H17 H19 H21 H22 H25 H28 H47
XY0.92440.00847 + 7H19 H31 H32 H34 H35 H39 H40 H47
XL0.93750.007311 + 9H6 H7 H8 H10 H12 H14 H31 H32 H34 H35 H39 H47
WM0.94890.008512 + 13H8 H15 H18 H20 H23 H24 H26 H31 H32 H34 H35 H39 H47
YR0.94650.007614 + 8H2 H5 H7 H8 H9 H11 H12 H14 H15 H27 H29 H32 H34 H35 H47
BS0.90910.00668 + 3H6 H7 H10 H14 H29 H31 H32 H35 H47
LD0.76530.00286 + 1H10 H15 H29 H32 H34 H35 H47
TL0.77810.00329 + 3H12 H23 H24 H26 H29 H30 H34 H35 H40 H47
CH0.92150.00438 + 8H18 H24 H30 H33 H34 H35 H36 H40 H47
HD0.89280.00797 + 8H16 H25 H28 H37 H38 H41 H42 H47
JX0.12440.00052 + 0H1 H9
HS0.27780.00191 + 1H1 H47
WY0.49380.00862 + 2H1 H36 H47
JG0.72000.01543 + 1H32 H35 H43 H47
XE0.49380.00412 + 1H1 H44 H47
GS0.29750.00062 + 0H1 H43
PW0.90700.00779 + 8H3 H4 H10 H12 H33 H34 H35 H45 H46 H47
MT0.00000.00001 + 0H1
YF0.93210.00846 + 10H8 H12 H27 H32 H35 H46 H47
HP0.77780.00132 + 0H1 H44
LC0.24000.00273 + 0H1 H9 H32
Total0.89990.018946 + 97H1–H47
#: x + y means that there were x haplotypes whose abundances were not less than two and y haplotypes whose abundance was one in overall samples.
Table 5. Analysis of molecular variance (AMOVA) using the psbA-trnH and trnL-trnL sequences and their concatenated sequences of the T. ciliata complex.
MarkerSource of Variationd.f.Sum of SquaresVariance ComponentPercentage of Variance (%)Φstp-Value
psbA-trnH+
trnL-trnL
Among
population
282110.4294.535742.840.42840.0000
Within
population
4182529.5426.051557.16
Total4464639.97110.5873
psbA-trnHAmong
population
28910.7691.802126.550.26550.0000
Within
population
4182083.9324.985573.45
Total4462994.76.7876
trnL-trnLAmong
population
281202.8782.734470.040.70040.0000
Within
population
418488.9111.169629.96
Total4461691.793.9040
Table 6. The neutrality test and mismatch distribution analysis with the concatenated alignment sequences of the psbA-trnH and trnL-trnL fragments in 29 populations of the T. ciliata complex.
PopulationTajima’s D
(p-Value)
Fu’s F
(p-Value)
Mismatch Distribution
SSD
(p-Value)
Rag
(p-Value)
θ0θ1τ
XJ−0.0638 (0.4)−0.2393 (0.346)0.0443 (0.15)0.2677 (0.15)03407.1850.936
LL−1.6802 (0.038)1.6590 (0.811)0.0394 (0.4)0.0523 (0.8)3.0296914.971.172
SM−1.5999 (0.044)−0.5370 (0.129)0.0219 (0.55)0.0575 (0.45)014.165.23
SC0.6879 (0.796)−1.0476 (0.106)0.0079 (0.7)0.0870 (0.85)01.9881.479
CB0.4359 (0.726)−2.046 (0.161)0.0043 (0.85)0.0168 (0.95)06.3923.711
XN−0.6741 (0.244)−1.441 (0.145)0.2121 (0)0.0519 (1)3.0253641.2561.045
NP0.7724 (0.794)−0.8396 (0.24)0.0149 (0.45)0.0709 (0.95)0.0024.9622.135
JL−1.1649 (0.108)−1.967 (0.179)0.0541 (0.55)0.1139 (0.4)02.31715.604
DC−1.8304 (0.015)−12.3959 (0)0.0031 (0.6)0.0098 (0.65)3.76934.9563.33
XY−0.9887 (0.143)0.2473 (0.572)0.0055 (0.6)0.2176 (0.6)0.08355.0296.111
XL−0.8636 (0.202)0.4259 (0.616)0.0038 (0.6)0.0146 (0.85)1.93414.9783.029
WM−2.4485 (0)−3.9285 (0.092)0.0423 (0)0.0072 (1)3.9388040.0896.094
YR−0.3648 (0.424)−14.8439 (0)0.0009 (0.85)0.0072 (0.95)1.2230456.717
BS−2.0701 (0.001)−0.3533 (0.356)0.0367 (0.2)0.0893 (0.05)5.53414.9787.451
LD−0.8212 (0.217)−4.4225 (0.018)0.0085 (0.8)0.0200 (0.7)7.36854.9572.77
TL−1.6168 (0.028)−15.1810 (0)0.0421 (0)0.0079 (1)3.8257174.9835.74
CH−1.0965 (0.129)−10.8408 (0.001)0.0086 (0.5)0.0141 (0.55)064.68811.434
HD−0.4642 (0.378)−13.3933 (0)0.0137 (0.05)0.0089 (0.7)5.43935.01410.283
JX−2.0409 (0)6.0964 (0.989)0.0195 (0.4)0.2302 (0.55)00.5233
HS−0.1419 (0.456)1.2436 (0.423)0.0583 (0.6)0.0889 (0.9)67.4219.36312.262
WY−0.3811 (0.385)3.2794 (0.923)0.0613 (0.7)0.0439 (0.85)0.0029.54580.68
JG0.8909 (0.805)1.1153 (0.466)0.0949 (0.35)0.2200 (0.2)72157.47843.17
XE−0.2181 (0.446)−0.4294 (0.26)0.0371 (0.8)0.0525 (0.75)28.83515.1910.895
GS−1.1527 (0.114)−0.6481 (0.222)0.0562 (0.25)0.0856 (0.25)5.053474.9921.227
PW−1.7853 (0.018)−2.7789 (0.092)0.0029 (0.8)0.0063 (0.95)2.60261.3286.117
MT−0.1726 (0.459)−4.0639 (0.008)0.0152 (0.3)0.0478 (0.35)1.980.9865.871
YF0 (1)0 (1)0.0686 (0)0.0212 (0.9)2.4067354.9972.4
HP0 (1)0.2007 (0.377)0.1643 (0.3)0.6667 (0.6)06829.9571.629
LC−0.9481 (0.22)−0.0064 (0.36)0.3878 (0)0.0863 (1)1.1433414.6220
Disclaimer/Publisher’s Note: The statements, opinions and data contained in all publications are solely those of the individual author(s) and contributor(s) and not of MDPI and/or the editor(s). MDPI and/or the editor(s) disclaim responsibility for any injury to people or property resulting from any ideas, methods, instructions or products referred to in the content.

