Article

Genome-Wide Analysis of the Lateral Organ Boundaries Domain (LBD) Gene Family in Sweet Potato (Ipomoea batatas)

1
College of Coastal Agricultural Sciences, Guangdong Ocean University, Zhanjiang 524088, China
2
Faculty of Chemistry and Environmental Science, Guangdong Ocean University, Zhanjiang 524088, China
*
Authors to whom correspondence should be addressed.
Genes 2024, 15(2), 237; https://doi.org/10.3390/genes15020237
Submission received: 12 January 2024 / Revised: 7 February 2024 / Accepted: 9 February 2024 / Published: 13 February 2024
(This article belongs to the Section Bioinformatics)

Abstract

:
The LBD family is a plant-specific transcription factor family that plays an important role in a variety of biological processes. However, the function of IbLBD genes in sweet potato remains unclear. In this study, we identified a total of 53 IbLBD genes in sweet potato. Genetic structure showed that most of the IbLBD genes contained only two exons. Following the phylogenetic investigation, the IbLBD gene family was separated into Class I (45 members) and Class II (8) members. Both classes of proteins contained relatively conservative Motif1 and Motif2 domains. The chromosomal locations, gene duplications, promoters, PPI network, and GO annotation of the sweet potato LBD genes were also investigated. Furthermore, gene expression profiling and real-time quantitative PCR analysis showed that the expression of 12 IbLBD genes altered in six separate tissues and under various abiotic stresses. The IbLBD genes belonging to Class I were mostly expressed in the primary root, the pencil root, and the leaves of sweet potatoes, while the genes belonging to Class II were primarily expressed in the various sweet potato roots. The IbLBD genes belonging to Class I were mostly expressed in the primary root, the pencil root, and the leaves of sweet potatoes, while the genes belonging to Class II were primarily expressed in the fibrous root, pencil root, and tuber root.

1. Introduction

Lateral organ boundary (LOB) structural domain (LBD) proteins contain a conserved LOB domain [1]. The LBD family is a plant-specific transcription factor family [2], initially discovered to be expressed in the shoot apex of Arabidopsis (Arabidopsis thaliana) seedlings. The LBD protein has a variable C-terminus, a zinc finger-like motif (CX2CX6CX3C) for DNA binding, a GAS (Gly-Ala-Ser) region in the middle, and a leucine zipper-like coiled-coil motif (LX6LX3LX6L) for protein dimerization [3]. According to the integrity of the leucine-like zipper pattern, the LBD family could be divided into Class I and Class II [4]. Class I LBD proteins contain the integrity of the LBD domain, which may be divided into five branches (IA, IB, IC, ID, and IE) [5] while Class II LBD proteins contain only the conservative zinc finger domain, which may be divided into two branches (IIa and IIb) [6]. Since the identification of the first LBD gene in Arabidopsis, numerous LBD families have been identified in a variety of other higher plants [7], such as rice, corn, tea tree, turnip, eucalyptus grandis, soybean, and wheat [8,9,10,11,12,13,14]. Different species have varying quantities of the LBD gene family. The LBD gene family is essential for plant development and growth, and metabolic processes. Currently, extensive research has been conducted on the LBD gene family in Arabidopsis. LBD13 positively regulates lateral root development [15], while LBD16 and LBD29 are expressed mainly in the root stele and lateral root primordia in wild-type seedlings [16]. The ASYMMETRIC LEAVES2 (AS1) gene, a member of the AS2/LOB gene family, participates in the development of a symmetrical, expanded lamina in Arabidopsis [17]. Overexpression of ASL19 and ASL20 induced transdifferentiation of cells from nonvascular tissues to TE-like cells [18]. LBD29 is involved in aspects of auxin signaling that inhibits fiber wall thickening in Arabidopsis stems [19]. In wild-type plants, LBD20 transcripts were abundant detectable in roots, and they were further induced after F. oxysporum inoculation or methyl jasmonate treatment [20]. LBD has control activity of other domains such as DNA binding, AF1 activity, and the role of the F domain in inter-domain communication and control of SERM agonist activity [21,22]. LBD37 and its two close homologs act as novel repressors of anthocyanin biosynthesis and N availability signals in general [23]. Lateral root initiation involves the sequential induction of transcription factors LBD16 and PUCHI [24]. As a transcriptional activator, LBD18 directly binds to the EXPANSIN14 promoter in promoting lateral root emergence of Arabidopsis [25]. LBD20 acts as a repressor of a subset of jasmonate mediated defenses and in susceptibility to the root-infecting fungal pathogen Fusarium oxysporum [26]. The Arabidopsis LBD25/ASL3 gene functions in both auxin signaling and aspects of photomorphogenesis [27].
Meanwhile, related investigations have been conducted on other plants. In potato, upregulation of StLBD2-6 and StLBD3-5 may improve their metabolism and resistance to drought [28]. In Gossypium, expression and functional characterization indicated the involvement of GhLBDs in abiotic stresses responses, especially in drought conditions [29]. In Brassica rapa, the LBD gene is mainly expressed in roots, and most genes of Class II were expressed in each tissue with a high expression level [30]. According to latest reports, overexpressing ZmLBD5 increased drought sensitivity by increasing the stomatal number and apertures in Arabidopsis under drought conditions [31]. CsLBD37 affected the response to nitrate and flowering of tea plants [32]. MeASLBD47 can resist the toxic effect of bacterial blight on cassava [33]. In Arabidopsis, the overexpression of PheLBD29 enhanced the tolerance to drought stresses [34]. GmLBD9 and GmLBD88 in soybean exerted negative immunomodulatory effects on plant immunity; while GmLBD16 and GmLBD23 exerted positive immunomodulatory effects on plant immunity [35]. These results have provided significant theoretical support for identifying LBD family members, exploring bioinformatics, and investigating gene function.
Sweet potato (Ipomoea batatas L.) is widely cultivated because it is not only rich in starch, carbohydrate, protein, vitamin, cellulose, and various amino acids but also characterized by drought resistance, barren resistance, and saline-alkali resistance [36]. Sweet potato, as the seventh-most significant food crop in the world, is not only an important and extensively utilized crop of tubers, but also a raw material for fuel generation, providing an alternative source of bioenergy [37]. At present, although genome-wide identification of the LBD gene family has been conducted for a variety of crops, there remains no report on the genome-wide identification of the LBD gene family in sweet potato. As sequencing technology has advanced, the sweet potato genome has been sequenced, offering a valuable resource for in-depth whole-genome research of gene families in this plant.
In this paper, we conducted a comprehensive bioinformation analysis of the sweet potato LBD family, including the identification and screening of gene families, phylogenetic relationships, analysis of gene structure, conserved motif, cis-acting regulatory elements, collinearity analysis, and LBD gene expression under salt stress or drought stress. The purpose of this research endeavor is to investigate the expression patterns of LBD genes in various tissues of sweet potato under different abiotic stresses. The results provide a theoretical basis for understanding the functions of LBD genes in sweet potato and for molecular breeding of sweet potato.

2. Materials and Methods

2.1. Identification and Physicochemical Properties of IbLBD Gene Family Members

The genomic data of sweet potato were obtained from the Ipomoea Genome Hub (https://sweetpotao.com/, accessed on 15 June 2023) website [38]. For the downloaded protein sequences, BLAST was used to construct a local database, while the gene and protein sequences of the Arabidopsis LBD gene family were obtained from the TAIR database (https://www.arabidopsis.org/, accessed on 15 June 2023). To identify the LBD genes, two methods were utilized. First, Arabidopsis LBD protein sequences were used as queries in a BLASTP (ver. 2.10.0+) search against the protein database of sweet potato with an E-value threshold of 1 × 10⁻¹⁰ [39]. Second, HMMsearch (ver. 3.1b2) with default settings was used to search the protein sequences of sweet potato for the LBD domain (PF03195) [40]. The candidate proteins identified through the previously mentioned methods were further analyzed using SnapGene software 6.0.2. Incomplete reading frame sequences and redundant sequences were manually eliminated. The remaining candidate protein domains were validated using SMART online analysis tools (http://smart.emblheidelberg.de/, accessed on 15 June 2023) [41]. Gene sequences that did not contain the LBD gene family domain or had incomplete LBD domains were removed from the analysis. Finally, 53 sweet potato LBD genes were obtained and all the genes contained the CX2CX6CX3C characteristic domain. The ExPASy ProtParam tool (http://web.expasy.org/protparam/, accessed on 15 June 2023) was used to predict protein physicochemical parameters [42]. WoLF PSORT (https://wolfpsort.hgc.jp/, accessed on 15 June 2023) was used to create subcellular localization predictions [43].

2.2. Gene Structure and Conserved Motif Analysis

MEME online software (http://meme-suite.org/tools/meme, accessed on 23 June 2023) was used to predict the conservative domains in LBD protein sequences of sweet potato [44]. For this analysis, the number of motifs to be identified was set to 10, while default settings were adopted for other parameters and the results were visualized using TBtools. MEGA 11 software was used for performing multiple sequence alignment of 53 sweet potato LBD proteins; the visualization was achieved with GeneDoc software 2.7. The LBDs’ gene structure was shown using the TBtools software 1.098 [45].

2.3. Phylogenetic Analysis of IbLBD Proteins

The TAIR database (https://www.arabidopsis.org/, accessed on 15 June 2023) was used to obtain the Arabidopsis LBD protein sequences and ClustalW was employed for a multiple sequence alignment of LBD protein sequences between sweet potato and Arabidopsis. The phylogenetic tree was constructed using the MEGA11 adjacency method (NJ) with the bootstrap set to 1000 times [46]. The results of the evolutionary tree were visualized by MEGA 11.

2.4. Chromosome Localization and Duplication Events

The locations of 53 sweet potato LBD genes on chromosomes were obtained based on the information annotated for the sweet potato genome and analyzed through the gene location visualization function of TBtools based on the genome information of Arabidopsis, tomato, pepper, corn, and rice downloaded from NCBI. Analysis of genome collinearity between sweet potato and these species was performed using MCScanX [47]. Circos and the dual synteny plot tool in TBtools were used for visualized mapping of the collinear gene pairs [48].

2.5. Cis-Acting Elements Analysis of IbLBD Genes

According to the information annotated for the sweet potato genome and the corresponding whole genome sequence, the region 2000 bp upstream of the IbLBD gene transcription start site was selected as the putative promoter region of sweet potato and the results were visualized using TBtools [45]. Subsequently, the extracted LBD promoter sequences of sweet potato were submitted to the PlantCare website (http://bioinformatics.psb.ugent.be/webtools/plantcare/html/, accessed on 8 July 2023) [49] for the prediction of the promoter cis-acting element. The results were visualized using TBtools and AI.

2.6. Plant Material and Treatments

The sweet potato cultivar Jishu 26 used in the experiment was obtained from the experimental field of the College of Coastal Agriculture, Guangdong Ocean University (21°15′ N, 110°30′ E). For tissue expression, the flower, leaf, stem, fibrous root, pencil root and tuber root tissues were sampled from 3-month-old Jishu 26 planted in the field. For the abiotic stress treatments, twigs about 30 cm in length from 3-month-old field-grown Jishu 26 were cultured in the Hoagland solution for 14 days to treat them. For salt stress treatment, the twigs were cultured in the Hoagland solution with 0 and 200 mM NaCl, and for drought stress treatments, the twigs were cultured in Hoagland solution with 0 and 300 mM mannitol. The flower, leaf, stem, fibrous root, pencil root, and tuber root tissues were covered with dry ice after being quickly frozen with liquid nitrogen and then sent to Biomarker Technologies for total RNA extraction, library construction, and full-length transcriptome sequencing. The primary root, stem, and leaf samples were collected at 0, 6, 12, and 24 h and frozen with liquid nitrogen after the treatments.
For qRT-PCR analysis, the 10 μL total reaction quantity of each sample contained 1 μL cDNA template, 0.5 μL (10 μmol L−1) forward and reverse gene-specific primers, 5 μL 2 × SYBR Green qPCR mix, and 3 μL ddH2O. The RT-PCR reaction was conducted using the BIO-RAD system with the following thermal cycle conditions: 3 min of pre-degeneration at 95 °C, followed by 40 cycles of denaturation at 95 °C for 10 s and annealing at 60 °C for 30 s. The reaction was completed with a 5 s step at 65 °C and a cooling rate of 0.5 °C to reach 95 °C. Each sample replicated 3 times, referring to Dingfa’s method [50] using the IbARF gene as an internal reference. The primers are listed in Table S1. FPKM values were calculated to reflect the expression of genes with the TBtools heatmap and Excel tools were used for the mapping of gene expression levels.

2.7. Protein–Protein Interaction Network and GO Annotation Analysis of IbLBDs

The LBD protein sequences were uploaded to the STRING database (https://string-db.org/, accessed on 8 July 2023) for node comparison, and relationships among important proteins were predicted based on Arabidopsis protein interactions. Cytoscape (V3.7.1) was used to visualize the resulting network [51]. GO annotation of LBD proteins in sweet potato was available from the Biomarker platform (https://www.biocloud.net/, accessed on 8 July 2023). The numbers of the IbLBD gene transcripts annotated and categorized into three categories and their subcategories (Level 2) were analyzed. The GO annotation results were visualized using the online software tool (https://www.bioinformatics.com.cn/, accessed on 8 July 2023).

3. Results

3.1. Identification of LBD Genes in Sweet Potato

The 53 sweet potato LBD genes were assigned names from IbLBD1 to IbLBD53 based on their chromosomal positions. The proteins encoded by the 53 LBD genes contained 149 (IbLBD31) to 520 (IbLBD50) amino acids with molecular weights (MWs) ranging from 16.16 kD (IbLBD31) to 57.51 kD (IbLBD50). Predicted protein isoelectric points (pI) ranged from 4.58 (IbLBD24) to 10.08 (IbLBD6). Among them, 28 proteins had isoelectric points higher than 7, resulting in a positive charge in acidic solutions. The hydrophilicity of the proteins ranged from −1.033 (IbLBD45) to 0.361 (IbLBD49), indicating different degrees of hydrophilicity. Additionally, all LBD proteins were predicted to be located in the nucleus using Cell-PLoc (Table 1).

3.2. Motif Compositions and Gene Structure of the LBD Gene Family in Sweet Potato

Through a conservative motif analysis on the LBD protein sequence of sweet potato based on the MEME online tool, ten conservative motifs were predicted and several differences in the number and distribution of motifs were found for different sweet potato LBD proteins (Figure 1A,B). Each gene contained three to six motifs and all of the sweet potato LBD proteins contained conservative LOB domain Motif1 and Motif2. The N-terminal of sweet potato LBD protein was highly conservative and for most of the proteins, the N-terminal contained Motif2 and Motif3, while the C-terminal was less conservative. In all Class I members, Motif10 exclusively appeared in Class Ia, Motif8 exclusively appeared in Class Ic, and Motif7 was present in both Class Ia and Class Ic. In addition, the Motif3 and Motif4 domains appeared in most Class I members but both did not appear in Class II. Motif6 and Motif9 domains were only found in Class II, indicating that LBD gene family members were not only highly conservative but also had several differences. Different subclasses contained motifs varying in type and order, which contributed to the functional diversity of the LBD gene family.
We analyzed the composition of the exon–intron structures of the coding sequences of all 53 LBD genes with a yellow box indicating the CDS sequence of LBD gene family members (Figure 1C). As shown, the LBD gene family members of sweet potato contained 1~5 CDS sequences. The number of exons ranged from one to five, although the majority of genes (70%) had two exons. After further analysis, all of the genes in Class II were found to have only two extrons except for IbLBD26, which contained three extrons. Similarly, this pattern was observed in the subclasses of Class I. The results indicate that most of the LBD genes in sweet potato were similar in structure while a few were differentiated.

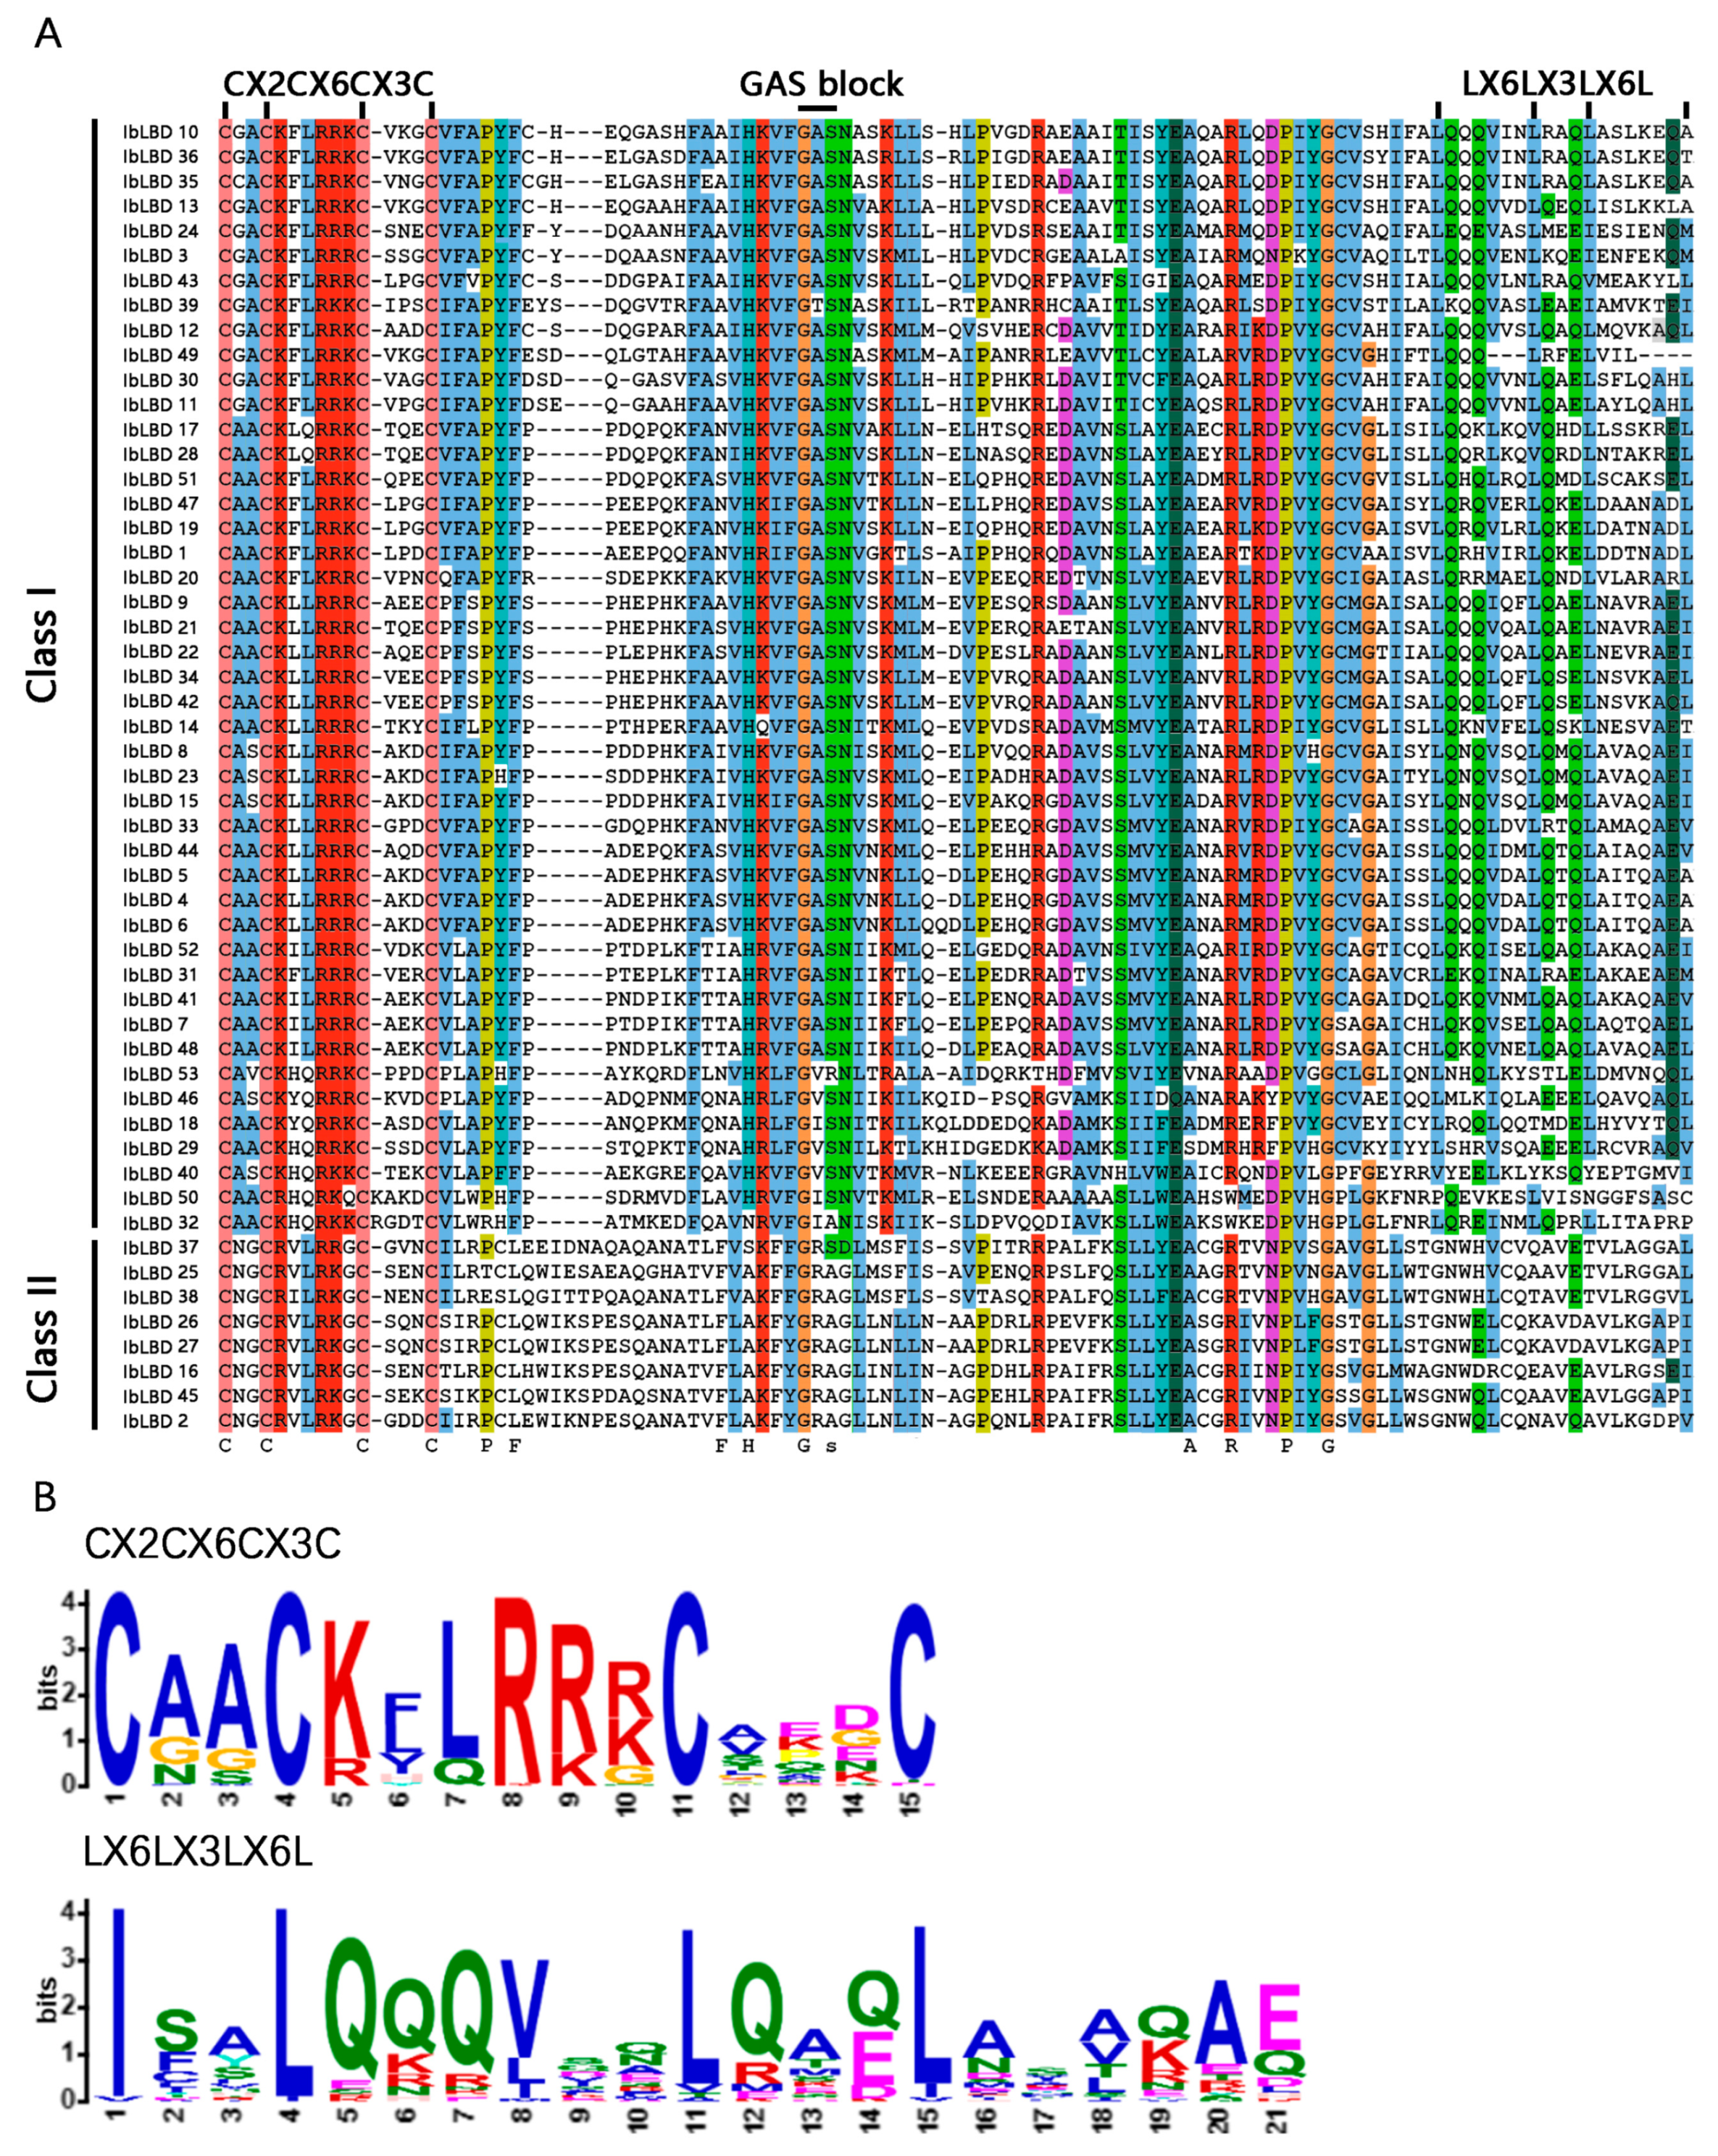
3.3. Conserved Sequence Alignment of LBD Gene Family in Sweet Potato

ClustalW was utilized to conduct multiple sequence alignment on 53 IbLBD proteins. The analysis indicated that all LBD proteins have a highly conserved LOB region of roughly 100 amino acids at the N-terminus (Figure 2A), of which 45 IbLBDs (84.90%) belonged to Class I and 8 IbLBDs (15.10%) belonged to Class II. Among them, all proteins contained the CX2CX6CX3C motif, whereas the leucine zipper-like domain (LX6LX3LX6L) was only found in Class I IbLBD proteins, similar to the results observed in other plants (Figure 2B), further indicating that the two classes of IbLBD proteins were different in biological function.

3.4. Phylogenetic Analysis

To investigate the evolutionary connection between the LBD gene family of sweet potato and Arabidopsis, we reconstructed a phylogenetic tree of LBD protein sequences (Figure 3). The results showed that Class I is divided into four groups, Ia, Ib, Ic, and Id, with twenty, six, twelve, and seven LBD gene family members, respectively. Class II is divided into two groups, IIa and IIb, with three and five LBD gene family members, respectively. The bootstrap values of Class Ia (IbLBD20/AT3G11090), Class Ib (IbLBD51/AT1G65620) and Class Id (IbLBD40/AT1G06280) orthologous gene pairs were higher than 90, and the IbLBD proteins containing the same motif were assigned to the same branch. These results indicated that the LBD gene in adjacent branches had similar functions.

3.5. Chromosome Locations and Gene Duplication Analysis

A chromosomal localization analysis found 53 LBD genes on 13 of the 15 chromosomes (Figure 4). Among them, chromosomes 2 (LG2) and 7 (LG7) had the most indispensable genes, containing eight LBD genes followed by chromosomes 3 (LG3) and 5 (LG5), containing five LBD genes. Chromosomes 11 and 12 contained four LBD genes. In contrast, other chromosomes had the fewest members, with only 1~3 genes localized at the chromosomes. At the same time, the LBD gene contained three tandem duplication gene pairs, namely chromosome 2 (IbLBD5/IbLBD6), chromosome 3 (IbLBD12/IbLBD13), and chromosome 10 (IbLBD35/IbLBD36), which were substantially close to each other on their chromosomes. They were also clustered together on the phylogenetic tree, which might be caused by the replication of gene fragments, suggesting their similar functions. Tandem duplication and segment duplication have been identified as the main mechanism of gene family expansion [52,53]. Through MCScanX collinearity analysis, there were 14 duplicate gene pairs of the LBD gene segment, distributed on different chromosomes (Figure 5), indicating the occurrence of tandem duplication and segment duplication during the expansion of LBD genes.

3.6. Evolutionary Analysis of the IbLBD Genes

To further investigate the evolutionary relationships between the sweet potato LBD family and other species, an evolutionary relationship analysis of LBD genes between sweet potato and other species was performed (Figure 6) including three dicotyledonous plants (Arabidopsis, tomato, and pepper) and two monocotyledonous plants (maize and rice). As shown in the figure, there were 38 collinear genes in sweet potato and Arabidopsis, while there were 52, 50, 19, and 12 collinear genes in tomato, capsicum, rice, and maize respectively. These results indicated that the LBD gene of sweet potato had a close evolutionary relationship with that of dicotyledonous plants and had a closer evolutionary relationship with tomato and capsicum of Solanaceae.

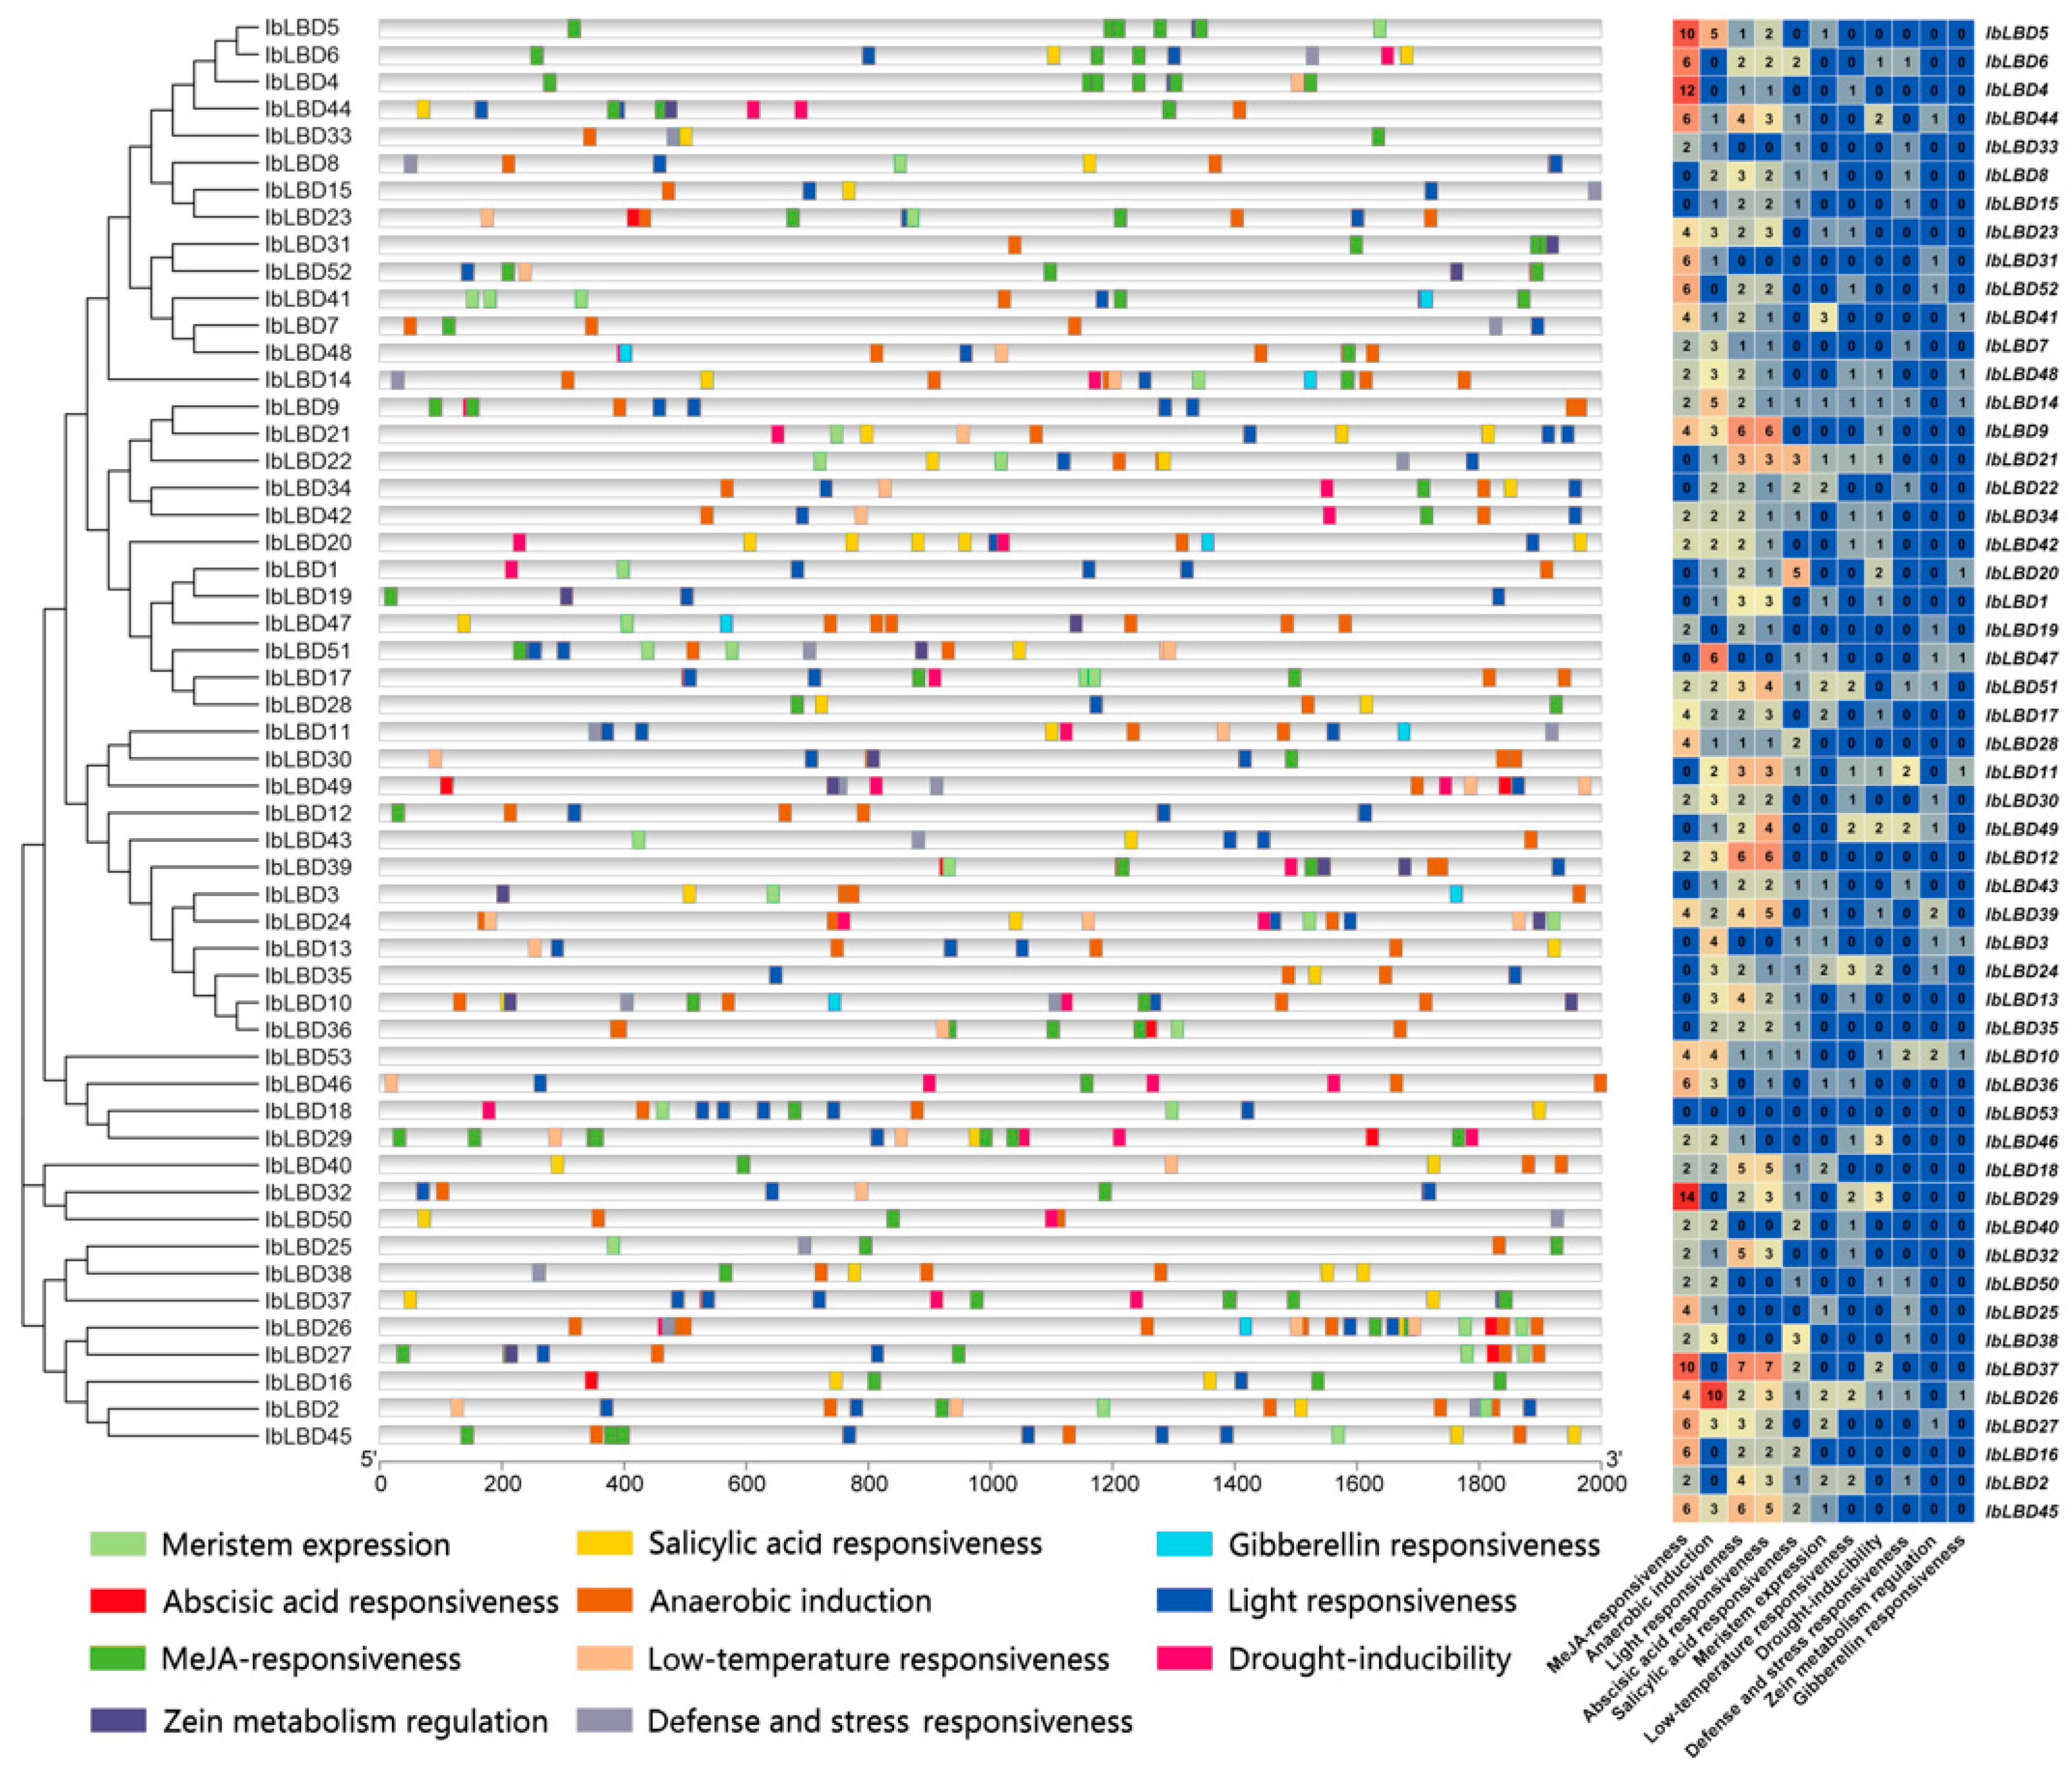
3.7. Analysis of Cis-Regulatory Element Distribution in IbLBD Promoters

The promoter region comprises cis-acting elements that influence gene expression. The genomic sequence located 2000 bp upstream of 53 IbLBD genes was analyzed in order to discover putative cis-acting elements (Figure 7). The IbLBD gene family has a variety of cis-acting elements, as shown in the figure. Some of these elements are important for plant growth and development, while others are important for hormone responses and abiotic stress responses. Among the analyzed genes, it was found that 43 genes contained either one or seven abscisic acid response elements, 38 genes contained either two or fourteen methyl jasmonate response elements, 9 genes contained one gibberellin response element, and 13 genes contained either one or two zein metabolism regulation elements. There were many light response elements and anaerobic induction elements in most of the genes. The light response elements included G-Box and G-box types and the anaerobic induction elements were all of the ARE type, while the remaining two types of environmental change response elements were less distributed. In summary, multiple classes of cis-elements were identified in the promoter regions, indicating that these IbLBDs may be involved in a wide range of biological processes and regulatory pathways.

3.8. Expression Patterns of IbLBD Gene Family in Sweet Potato

Transcriptome data were used to evaluate the function of the LBD gene in plant tissue growth and development by studying the expression patterns of seven different tissues (flower, fruit, leaf, stem, fibrous root, pencil root, and tuber root). The gene expression levels were quantified as fragments per kilobase of exon model per million mapped fragments (FPKM). The results show that 52 IbLBD genes (the expression levels of IbLBD40 in tissues were extremely low) had significantly different expression patterns in tissues (Figure 8A). The cluster analysis results show that many highly expressed genes were mainly in the stem, including seven genes with relative expression levels above 2. The relative expression levels of these genes were low in other parts. However, in flowers, three genes showed high expression levels while in fruits, six genes were highly expressed. Such results suggest that these genes may have significant roles in the development processes of flowers and fruits. Notably, IbLBD33 exhibited high expression specifically in leaves, while the other genes displayed low expression levels in leaves. Meanwhile, the expression levels of IbLBD44 and IbLBD37 were all upregulated in different roots, suggesting that they might play an important role in root growth. In addition to these specific genes, IbLBD in the same subclass showed similar expression patterns in the development of some tissues. For instance, some of the genes in Ia, Ib, and Ic all showed high expression levels in the stem, as well as an increasing trend, while their expression levels in other parts were relatively low. Most of the members of Class II were highly expressed in the roots and leaves, showing an upregulated expression result in the roots and a downregulated expression result in the leaves. IbLBD genes were differently expressed in different tissues. Different IbLBD gene subclasses may perform functions in the development of the same tissue, implying functional redundancy, while other genes may have specialized functions in corresponding tissues.
The expression levels of IbLBD genes in sweet potato tissues were analyzed under conditions of salt stress and drought stress (Figure 8B). A total of 45 IbLBD genes in tissues had significantly different expression patterns under salt stress and drought stress (the expression levels of the other eight genes in tissues were extremely low under different stress conditions). Under both stress conditions, IbLBD genes were mostly expressed on primary roots, followed by stems with leaves having the least number of genes expressed. There were 16 genes with relatively high relative expression levels in sweet potato roots under salt stress. Six genes had relative expression levels higher than 2, including IbLBD26 and IbLBD27, which were highly expressed in stems and IbLBD33, which was highly expressed in leaves. There were 20 genes with relatively high expression levels in sweet potato roots under drought stress and four genes with relative expression levels higher than 2. Among them, IbLBD41 was highly expressed in leaves and IbLBD24 was highly expressed in stems. There were seven genes in Class I and four genes in Class II respectively that were upregulated in primary roots. The results indicate that these genes are mainly upregulated in the roots under stress conditions. Overall, most of the genes responded under different stress conditions.

3.9. Quantitative qPCR Analysis of IbLBD Genes in Different Tissues

To demonstrate the reliability of the transcriptome data, 12 genes with notable expression variations under salt and drought stress were chosen for qRT-PCR investigation (Figure 9). The results of the expression analysis of IbLBD genes in different parts of sweet potato were consistent with the transcriptome data. Overall, the expression of these IbLBD genes was mostly detected in the primary root and leaves of sweet potato. Meanwhile, there were significant differences in the expression of IbLBD genes in different parts. Class I IbLBD genes were substantially expressed in the primary root, pencil root, and leaves of sweet potato. Among them, IbLBD7 and IbLBD21 had also a high expression level in the stem and flower of sweet potato. IbLBD genes in Class II were highly expressed in the primary root.

3.10. Quantitative qPCR Analysis of IbLBD Genes under Abiotic Stresses

We used qRT-PCR to determine the expression levels of the LBD gene in various tissues of the sweet potato under various stress conditions (Figure 10A–C). According to the findings of the investigation, different parts of the sweet potato showed increased expression of LBD genes after being subjected to the stresses of salt and drought. Under these two stresses, the expression levels of most IbLBD genes in the primary root and stem of sweet potato were upregulated first and then downregulated, presenting a consistent expression trend. However, the expression of these IbLBD genes in leaves presented a downward trend. The sensitivity of different expression genes in roots was higher than that in the stems with the lowest sensitivity detected in the leaves. Further, the expression of different genes was the highest in stems, followed by roots, and the lowest expression of these genes was found in leaves. Notably, the maximum expression level of IbLBD7 in roots was 82 times higher than that of the control group at 6 h under salt stress and 13 times higher than that of the control group at 12 h under drought stress. The maximum expression level of IbLBD12 in the stem was 628 times higher than that of the control group at 6 h under salt stress and 46 times higher than that of the control group at 12 h under drought stress.

3.11. Regulatory Network in Sweet Potato

Potential interactions between IbLBD proteins were predicted using the STRING database (Figure 11). The IbLBD protein interaction network consisted of 27 nodes, each of which communicated with other nodes. There were direct contacts between proteins such as IbLBD1 and IbLBD40, and more complicated multigene interactions between proteins such as IbLBD16, IbLBD18, and IbLBD38. Notably, IbLBD40 was predicted to be central to nodes, radiating eight and nine connections to other genes, respectively.

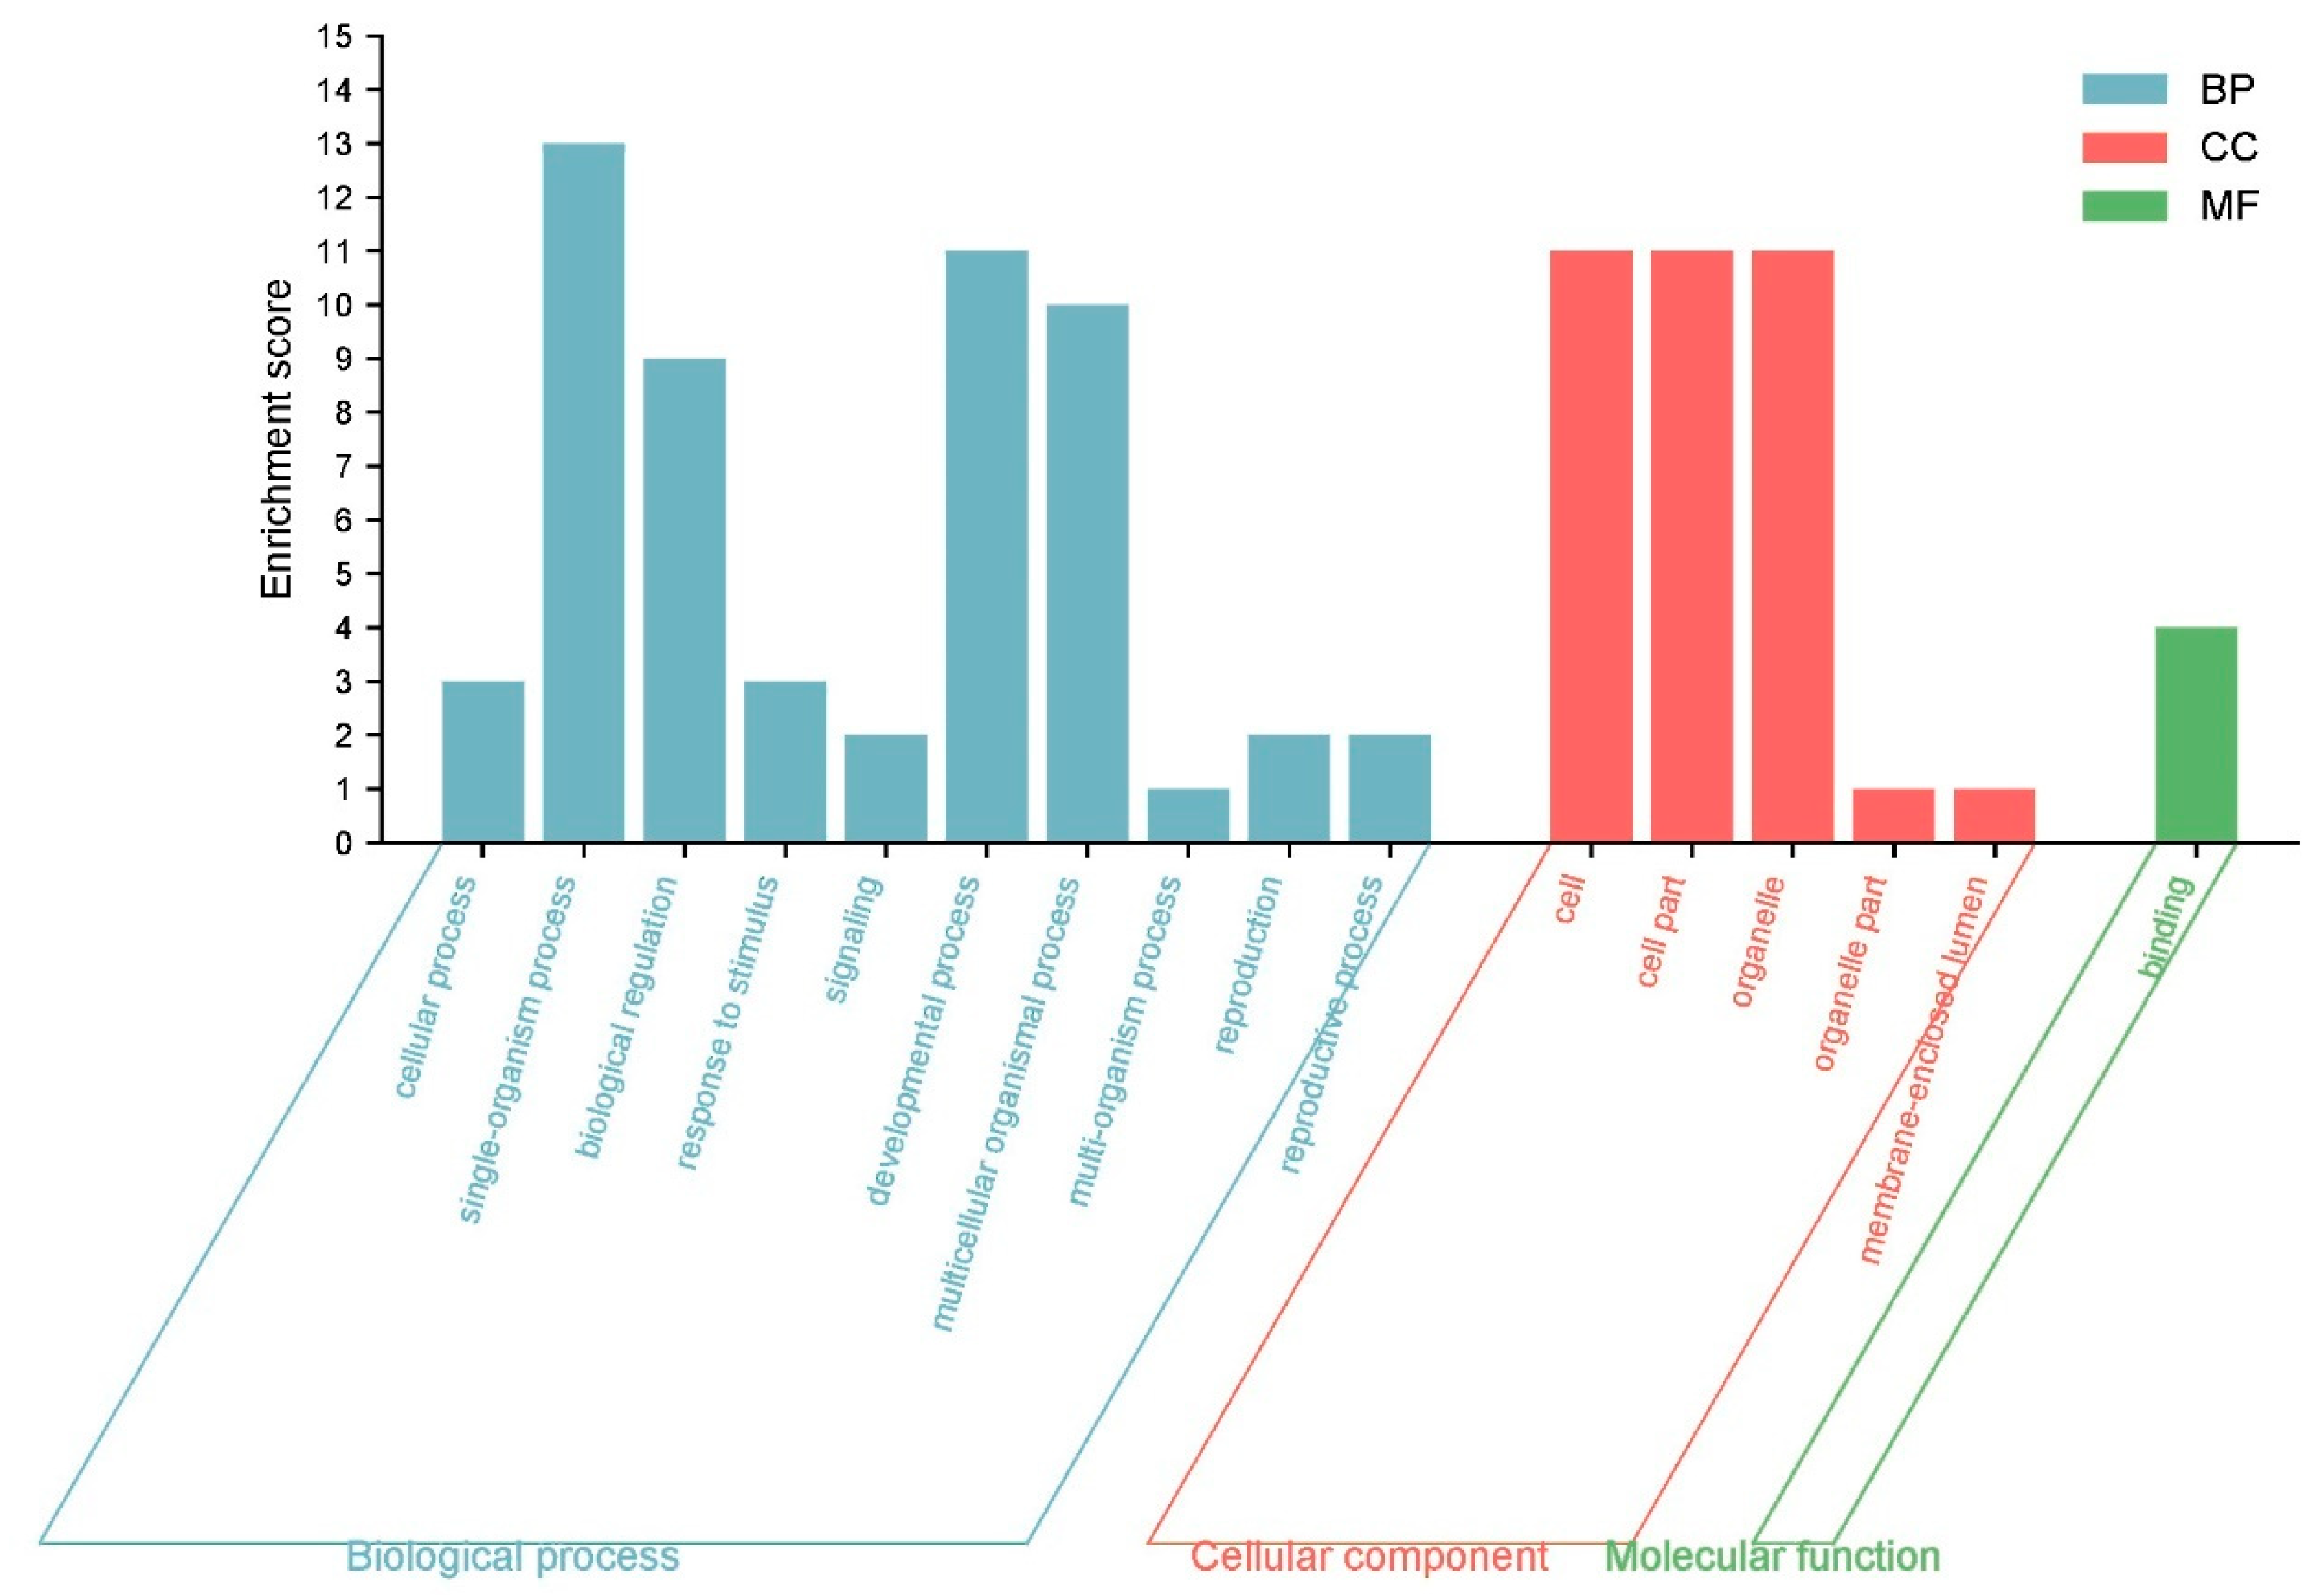
3.12. GO Annotation and Enrichment Analysis

To predict their biological functions, we performed GO annotation analysis of the 53 IbLBD proteins, revealing that they may participate in a range of cellular components, molecular functions, and biological processes (Figure 12). The 53 IbLBD proteins were assigned a total of 16 GO terms; most of the GO terms belong to biological processes and many proteins were enriched in this category. Under the biological processes category, the most highly enriched categories were related to single-organism processes, developmental processes, and multicellular organismal processes. There were 10 IbLBD proteins that can participate in these three processes. Under the cellular component category, the most highly enriched categories were related to cell, cell part, and organelle. Among them, 11 genes were annotated separately, indicating that these 11 genes play an important role in the composition of these three categories. Regarding molecular function, there were only four IbLBD proteins having the capacity to bind to other molecules; additionally, it also was the only GO term in molecular function. The top 20 GO terms are shown in Figure 13. The strongest enrichment and the highest enrichment factor (800.33) were observed for the process of adventitious root development, followed by the process of lateral root formation (442.29). In addition, the largest number of genes (nine) was associated with the GO term “anatomical structure development”.

4. Discussion

The gene families of sweet potatoes have been extensively explored using genome sequencing. In this study, in the sweet potato genome, we found 53 IbLBD genes (Table 1), which were divided into two major classes and six subclasses (Ia~Id, IIa, and IIb). There was a considerable variance in LBD protein family members across species, and diploid plants often contained fewer LBD genes, for instance, Arabidopsis, tomato [54], rice [8], and corn [9], whereas other diploid plants contained fewer than 50 LBD genes. Contrarily, the number of LBD genes in polyploid plants was much larger. For instance, 90 LBD genes were found in soybeans [13] and wheat [14]. Although the sweet potato is an allohexaploid plant, the number of identified LBD gene families was less than in most polyploid plants. This may be because the differences between the two genomes that comprise the sweet potato were insignificant [55]. Meanwhile, there are some heterogeneities between sweet potato chromosomes, so it is difficult to assemble the genome, thereby inducing incomplete sequencing results. Results from the gene structure analysis revealed that most LBD genes had less than four exons, which was similar to the findings related to angiosperms such as Arabidopsis and rice. After the phylogenetic tree was constructed, all IbLBD genes were categorized into Class I or Class II, comprising 45 and 8 LBD genes, respectively. We found that the number of LBD genes in Class I of Arabidopsis, moso bamboo [56], and pears [57] was high in Class II, which was consistent with previous studies. There was also a difference in the Class I classification. Specifically, Class I in the common bean was subdivided into 11 subclasses [58], while wheat contained eight subclasses. However, there were relatively similar classification results for sweet potato, passion fruit, and moso bamboo.
Performing a collinearity analysis within a certain species reveals the homology of genes among different chromosomes. The chromosome localization and collinearity analysis results confirmed that IbLBD contains 17 duplicated gene pairs, including 3 tandem duplicated gene pairs and 14 segmental duplicated gene pairs. Therefore, we speculated that in the evolution process, the LBD gene family expansion was dominated by the segmental duplication mechanism and supplemented by the tandem duplication mechanism. This contributed to the development of novel gene functions and may also explain the comparatively conservative number of IbLBD gene family members. A collinearity analysis among different species also exposes gene evolution and genetic relationships among them. The evolutionary relationship between sweet potato and other species was explored from the perspective of LBD family genes through a collinear analysis. The results indicated that the LBD family genes of sweet potato were more closely related to the same Solanales plant, tomato and pepper. Furthermore, a total of 52 and 50 collinear gene pairs were found in these two plants, respectively. However, the genetic relationship between sweet potato and gramineous plants (maize and rice) was insignificant with only a few collinear gene pairs. These findings were consistent with the results of the genetic relationship analysis.
The cis-acting element of promoters is critical in gene expression control. Okushima et al. reported that LBD16/ASL18 in Arabidopsis participated in lateral root formation and growth hormone response [16]. Louise et al. found that AtLBD20 contributed to the plant disease resistance process mediated by COI-dependent jasmonate (JA) [26]. In this study, we verified that the LBD promoter region of sweet potato contained several elements related to the hormone regulation pathway. Moreover, the photoresponsive elements, abscisic acid-responsive elements, methyl jasmonate-responsive elements, and drought-inducing elements at the MYB binding sites were the most extensively distributed. Among them, the photoresponsive elements and abscisic acid-responsive elements were detected in most genes. Therefore, we inferred that light and abscisic acid may influence IbLBD gene expression, thereby affecting the growth and development of sweet potato. More specifically, IbLBD37, IbLBD9, and IbLBD12 had seven, six, and six ABRE elements, respectively. These elements may be involved in the regulation of ABA metabolism in sweet potato. Huang et al. [56] discovered that all LBD gene promoters in moso bamboo contained drought-inducing elements at the MYB binding sites. These drought-inducing elements were detected in 22 sweet potato genes with certain differences in quantity. Results from the heatmap analysis revealed that IbLBD6, IbLBD24, and IbLBD48 were highly expressed under drought stress, while IbLBD41 in Class I and IbLBD2 in Class II were highly expressed under both abiotic stresses. This may be related to the internal cis-acting elements that were involved in defense and stress responses. These findings indicated that LBD gene expression in sweet potato was regulated by cis-elements related to plant development and abiotic stress tolerance.
We discovered that 25% of the IbLBD genes were highly expressed in sweet potato stems when we analyzed the expression patterns of the IbLBD genes, which was consistent with the findings related to turnips [11], cotton [29], and pears [57]. Additionally, StLBD3-5 and StLBD2-6 were highly expressed in potato stems under drought stress [28], which improved their drought resistance. This was consistent with the expression of IbLBD25 under drought stress. Furthermore, Bra035860 was relatively highly expressed in turnip roots and stems [11]. The results of the evolutionary analysis suggested that IbLBD47, which had high homology with Bra035860, was specifically expressed in the stem. As a result, we speculated that the IbLBD genes were principally involved in the functions of plant stem development and they were also highly expressed in flowers and fruits. As reported in a previous study, AtASL1 regulated flower development in Arabidopsis by controlling the development orientation of petal cells [59]. The expression of Solyc01g091420.1.1, Solyc03g119530.1.1, and Solyc04g050010.1.1 was also upregulated in tomatoes between the flowering and ripening periods [54]. According to the findings of this research, IbLBD17 and IbLBD28 were also shown to be highly expressed in sweet potato flowers and fruits but not in other parts of the plant. Therefore, we concluded that these genes had a role in developing sweet potato flowers and fruits. Moreover, LOB was found to be expressed in the base of lateral roots [60]. The findings of the heatmap analysis indicated that all of the highly expressed genes in the primary roots belonged to Class I. This further demonstrated that the LBD genes in Class I were mainly involved in the development of the lateral roots in plants, consistent with the results of GO enrichment analysis studies. More than half of the top 20 enriched GO terms in the IbLBDs were related to plant organ development and formation, among which morphogenic functions involving lateral root formation and root development were the most significant. However, IbLBD genes were expressed at a lower level in the foliage, which was consistent with the findings of research on the vast majority of plants, including cotton, common beans, and pears.
Under environmental stress, IbLBD genes also assert a regulatory role. Usually, the root system is the first part to be affected by environmental stress. As the heatmap shows, LBD genes were commonly significantly expressed in the primary root under diverse stress. Most of the promoters of IbLBD genes contained MBS elements, indicating that these genes played a regulatory role in plants under drought stress. Among them, 11 IbLBD genes were upregulated under salt and drought stresses. These genes are likely to respond to salt and drought stress, playing a crucial role in regulating stress responses. They may also exhibit functional redundancy. The tissue expression analysis results confirmed that different LBD family members had specific tissue expression patterns in the aspects of temporal and spatial expression. Furthermore, some LBD family members exhibited functional specificity. The expression of some LBD genes varied for different root morphological profiles, therefore affecting sweet potato root systems differently. However, it is necessary to further clarify the specific function of these genes. Generally, genes with high homology have similar functions. Under salt stress, the expression of IbLBD46 and IbLBD47 was downregulated in different parts of sweet potato. This was highly homologous with Solyc02g087570.1.1 and Solyc03g112430.1.1 in tomatoes [54], which exhibited similar results. Under drought stress, the expression of StLBD26 was upregulated in potato stems [28], which was consistent with the results of IbLBD25. As the core signal transduction component in Arabidopsis, LBD15 regulated the water loss rate of plants through stomata. Meanwhile, the overexpression of LBD15 enhanced the drought resistance of plants [61]. Additionally, there was high homology between AtLBD15 and IbLBD21, while IbLBD21 was highly expressed under drought stress. The PCR findings demonstrated that IbLBD21 expression under drought stress was identical to the transcriptome data, suggesting a similar function.

5. Conclusions

In this study, we systematically analyzed and identified 53 IbLBD genes in sweet potato, which were dispersed across 13 chromosomes and classified into 6 categories. According to studies of sweet potato evolution, segment duplication may have a more significant impact than tandem duplication in expending LBD gene growth in the sweet potato genome. Collinear analysis verified the significant degree of similarity between the sweet potato and plants in the Solanales family. Based on the RNA-seq data, the tissue and abiotic stress of IbLBD gene expression pattern was revealed, which was also supported by quantitative analysis and GO annotation. It was discovered that most LBD genes are expressed far more highly in some tissues than others: some gene expression levels were very high in specific tissues such as IbLBD30/39/43, which were specifically expressed in the fruit, while IbLBD47 was only highly expressed in the stem, indicating a special function in the development of some tissues. The qRT-PCR was conducted to certify the expression levels of twelve IbLBDs in diverse tissues and different abiotic stresses. Under drought stress, IbLBD21 and IbLBD15 were upregulated in the stem and had a high degree of homology between them. The PCR results demonstrated that the expression of IbLBD21 under drought stress was consistent with the transcriptome data. Further research will be conducted on IbLBD21. Overall, we believed that IbLBD2, IbLBD7, IbLBD12, and IbLBD21 genes in sweet potato have important research value. These results help explain IbLBD gene family formation. Research to study the biological process of IbLBD transcription factors under different stress conditions is required to further investigate the functions of sweet potato LBD genes.

Supplementary Materials

The following supporting information can be downloaded at: https://www.mdpi.com/article/10.3390/genes15020237/s1, Table S1: The primer sequences of 12 IbLBD genes for qRT-PCR analysis; Table S2: The relative expressions of 12 representative LBD genes in different tissues under qRT-PCR analysis; Table S3: The relative expressions of 12 representative LBD genes in primary roots under salt and drought stress by qRT-PCR; Table S4: The relative expressions of 12 representative LBD genes in stem under salt and drought stress by qRT-PCR; Table S5: The relative expressions of 12 representative LBD genes in leaf under salt and drought stress by qRT-PCR.

Author Contributions

Conceptualization, L.S.; methodology, L.S.; software, L.S., X.L. and B.T.; formal analysis, X.L. and B.T.; investigation, R.Z. and Y.W.; resources, Y.L. and L.W.; writing—original draft preparation, L.S.; writing—review and editing, C.Z. and H.Z.; visualization, L.S. and X.L.; supervision, C.Z.; project administration, C.Z. and H.Z. All authors have read and agreed to the published version of the manuscript.

Funding

This research was funded by the Innovation Team Project of ordinary colleges of Educational Commission of Guangdong Province (2021KCXTD011), and the “Ling Hang” Program of Zhan-jiang Innovation and Entrepreneurship Team Introduction (2020LHJH01).

Institutional Review Board Statement

Not applicable.

Informed Consent Statement

Not applicable.

Data Availability Statement

Data are contained within the article or Supplementary Materials.

Acknowledgments

We thank the Ipomoea Genome Hub project team for sharing the Ipomoea batatas genome annotation data (https://sweetpotao.com/, accessed on 15 June 2023). Thanks to all authors for their contribution in this study.

Conflicts of Interest

The authors declare no conflict of interest.

References

  1. Zhang, Y.; Li, Z.; Ma, B.; Hou, Q.; Wan, X. Phylogeny and Functions of LOB Domain Proteins in Plants. Int. J. Mol. Sci. 2020, 21, 2278. [Google Scholar] [CrossRef]
  2. Liang, J.; Hou, Z.; Liao, J.; Qin, Y.; Wang, L.; Wang, X.; Su, W.; Cai, Z.; Fang, Y.; Aslam, M.; et al. Genome-Wide Identification and Expression Analysis of LBD Transcription Factor Genes in Passion Fruit (Passiflora edulis). Int. J. Mol. Sci. 2022, 23, 4700. [Google Scholar] [CrossRef] [PubMed]
  3. Majer, C.; Hochholdinger, F. Defining the boundaries: Structure and function of LOB domain proteins. Trends Plant Sci. 2011, 16, 47–52. [Google Scholar] [CrossRef] [PubMed]
  4. Yang, T.; Fang, G.Y.; He, H.; Chen, J. Genome-Wide Identification, Evolutionary Analysis and Expression Profiles of Lateral Organ Boundaries Domain Gene Family in Lotus japonicus and Medicago truncatula. PLoS ONE 2016, 11, e0161901. [Google Scholar] [CrossRef] [PubMed]
  5. Guo, B.; Wang, J.; Lin, S.; Tian, Z.; Zhou, K.; Luan, H.; Lyu, C.; Zhang, X.; Xu, R. A genome-wide analysis of the Asymmetric Leaves2/Lateral Organ Boundaries (AS2/LOB) gene family in barley (Hordeum vulgare L.). J. Zhejiang Univ. Sci. B 2016, 17, 763–774. [Google Scholar] [CrossRef] [PubMed]
  6. Chanderbali, A.S.; He, F.; Soltis, P.S.; Soltis, D.E. Out of the Water: Origin and Diversification of the LBD Gene Family. Mol. Biol. Evol. 2015, 32, 1996–2000. [Google Scholar] [CrossRef] [PubMed]
  7. Shuai, B.; Reynaga-Pena, C.G.; Springer, P.S. The lateral organ boundaries gene defines a novel, plant-specific gene family. Plant Physiol. 2002, 129, 747–761. [Google Scholar] [CrossRef]
  8. Zhao, D.; Chen, P.; Chen, Z.; Zhang, L.; Wang, Y.; Xu, L. Genome-wide analysis of the LBD family in rice: Gene functions, structure and evolution. Comput. Biol. Med. 2023, 153, 106452. [Google Scholar] [CrossRef]
  9. Taramino, G.; Sauer, M.; Stauffer, J.L., Jr.; Multani, D.; Niu, X.; Sakai, H.; Hochholdinger, F. The maize (Zea mays L.) RTCS gene encodes a LOB domain protein that is a key regulator of embryonic seminal and post-embryonic shoot-borne root initiation. Plant J. 2007, 50, 649–659. [Google Scholar] [CrossRef]
  10. Zhang, X.; He, Y.; He, W.; Su, H.; Wang, Y.; Hong, G.; Xu, P. Structural and functional insights into the LBD family involved in abiotic stress and flavonoid synthases in Camellia sinensis. Sci. Rep. 2019, 9, 15651. [Google Scholar] [CrossRef]
  11. Yu, Q.; Hu, S.; Du, J.; Yang, Y.; Sun, X. Genome-wide identification and characterization of the lateral organ boundaries domain gene family in Brassica rapa var. rapa. Plant Divers. 2019, 42, 52–60. [Google Scholar] [CrossRef] [PubMed]
  12. Lu, Q.; Shao, F.; Macmillan, C.; Wilson, I.W.; van der Merwe, K.; Hussey, S.G.; Myburg, A.A.; Dong, X.; Qiu, D. Genomewide analysis of the lateral organ boundaries domain gene family in Eucalyptus grandis reveals members that differentially impact secondary growth. Plant Biotechnol. J. 2018, 16, 124–136. [Google Scholar] [CrossRef] [PubMed]
  13. Yang, H.; Shi, G.; Du, H.; Wang, H.; Zhang, Z.; Hu, D.; Wang, J.; Huang, F.; Yu, D. Genome-Wide Analysis of Soybean Lateral Organ Boundaries Domain-Containing Genes: A Functional Investigation of GmLBD12. Plant Genome 2017, 10. [Google Scholar] [CrossRef] [PubMed]
  14. Wang, Z.; Zhang, R.; Cheng, Y.; Lei, P.; Song, W.; Zheng, W.; Nie, X. Genome-wide Identification Evolution and Expression Analysis of LBD Transcription Factor Family in Bread Wheat (Triticum aestivum L.). Front. Plant Sci. 2021, 12, 721253. [Google Scholar] [CrossRef] [PubMed]
  15. Cho, C.; Jeon, E.; Pandey, S.K.; Ha, S.H.; Kim, J. LBD13 positively regulates lateral root formation in Arabidopsis. Planta 2019, 249, 1251–1258. [Google Scholar] [CrossRef] [PubMed]
  16. Okushima, Y.; Fukaki, H.; Onoda, M.; Theologis, A.; Tasaka, M. Arf7 and arf19 regulate lateral root formation via direct activation of LBD/ASL genes in Arabidopsis. Plant Cell 2007, 19, 118–130. [Google Scholar] [CrossRef] [PubMed]
  17. Iwakawa, H.; Iwasaki, M.; Kojima, S.; Ueno, Y.; Soma, T.; Tanaka, H.; Semiarti, E.; Machida, Y.; Machida, C. Expression of the asymmetric leaves 2 gene in the adaxial domain of Arabidopsis leaves represses cell proliferation in this domain and is critical for the development of properly expanded leaves. Plant J. 2007, 51, 173–184. [Google Scholar] [CrossRef] [PubMed]
  18. Soyano, T.; Thitamadee, S.; Machida, Y.; Chua, N.H. Asymmetric Leaves2-Like19/Lateral Organ Boundaries DOMAIN30 and ASL20/LBD18 Regulate Tracheary Element Differentiation in Arabidopsis. Plant Cell 2008, 20, 3359–3373. [Google Scholar] [CrossRef]
  19. Lee, K.H.; Du, Q.; Zhuo, C.; Qi, L.; Wang, H. LBD29-involved auxin signaling represses nac master regulators and fiber wall biosynthesis. Plant Physiol. 2019, 181, 595–608. [Google Scholar] [CrossRef]
  20. Thatcher, L.F.; Powell, J.J.; Aitken, E.A.B.; Kazan, K.; Manners, J.M. The lateral organ boundaries domain transcription factor LBD20 functions in fusarium wilt susceptibility and jasmonate signaling in Arabidopsis. Plant Physiol. 2012, 160, 407–418. [Google Scholar] [CrossRef]
  21. Montano, M.M.; Muller, V.; Trobaugh, A.; Katzenellenbogen, B.S. The carboxy-terminal F domain of the human estrogen receptor: Role in the transcriptional activity of the receptor and the effectiveness of antiestrogens as estrogen antagonists. Mol. Endocrinol. 1995, 9, 814–825. [Google Scholar] [CrossRef] [PubMed]
  22. Patel, S.R.; Skafar, D.F. Modulation of nuclear receptor activity by the F domain. Mol. Cell. Endocrinol. 2015, 418, 298–305. [Google Scholar] [CrossRef]
  23. Rubin, G.; Tohge, T.; Matsuda, F.; Saito, K.; Scheible, W.R. Members of the LBD Family of Transcription Factors Repress Anthocyanin Synthesis and Affect Additional Nitrogen Responses in Arabidopsis. Plant Cell 2009, 21, 3567–3584. [Google Scholar] [CrossRef] [PubMed]
  24. Goh, T.; Toyokura, K.; Yamaguchi, N.; Okamoto, Y.; Uehara, T.; Kaneko, S.; Takebayashi, Y.; Kasahara, H.; Ikeyama, Y.; Okushima, Y.; et al. Lateral root initiation requires the sequential induction of transcription factors LBD16 and PUCHI in Arabidopsis thaliana. New Phytol. 2019, 224, 749–760. [Google Scholar] [CrossRef] [PubMed]
  25. Lee, H.W.; Kim, M.J.; Kim, N.Y.; Lee, S.H.; Kim, J. LBD18 acts as a transcriptional activator that directly binds to the expansin14 promoter in promoting lateral root emergence of Arabidopsis. Plant J. 2013, 73, 212–224. [Google Scholar] [CrossRef] [PubMed]
  26. Thatcher, L.F.; Kazan, K.; Manners, J.M. Lateral organ boundaries domain transcription factors: New roles in plant defense. Plant Signal Behav. 2012, 7, 1702–1704. [Google Scholar] [CrossRef] [PubMed]
  27. Mangeon, A.; Bell, E.M.; Lin, W.C.; Jablonska, B.; Springer, P.S. Misregulation of the LOB domain gene DDA1 suggests possible functions in auxin signalling and photomorphogenesis. J. Exp. Bot. 2011, 62, 221–233. [Google Scholar] [CrossRef]
  28. Liu, H.; Cao, M.; Chen, X.; Ye, M.; Zhao, P.; Nan, Y.; Li, W.; Zhang, C.; Kong, L.; Kong, N.; et al. Genome-wide analysis of the lateral organ boundaries domain (LBD) gene family in Solanum tuberosum. Int. J. Mol. Sci. 2019, 20, 5360. [Google Scholar] [CrossRef]
  29. Yu, J.; Xie, Q.; Li, C.; Dong, Y.; Zhu, S.; Chen, J. Comprehensive characterization and gene expression patterns of LBD gene family in Gossypium. Planta 2020, 251, 81. [Google Scholar] [CrossRef]
  30. Huang, X.; Liu, G.; Zhang, W. Genome-wide analysis of LBD (LATERAL ORGAN BOUNDARIES Domain) gene family in Brassica rapa. Braz. Arch. Biol. Technol. 2018, 61. [Google Scholar] [CrossRef]
  31. Xiong, J.; Zhang, W.; Zheng, D.; Xiong, H.; Feng, X.; Zhang, X.; Wang, Q.; Wu, F.; Xu, J.; Lu, Y. ZmLBD5 Increases drought sensitivity by suppressing ROS accumulation in Arabidopsis. Plants 2022, 11, 1382. [Google Scholar] [CrossRef] [PubMed]
  32. Teng, R.; Yang, N.; Liu, C.; Chen, Y.; Wang, Y.; Zhuang, J. CsLBD37, a LBD/ASL transcription factor, affects nitrate response and flowering of tea plant. Sci. Hortic. 2022, 306, 111457. [Google Scholar] [CrossRef]
  33. Mao, Y.; Abdoulaye, A.H.; Song, J.; Yao, X.; Zhang, Y.; Gao, Y.; Ye, Y.; Luo, K.; Xia, W.; Chen, Y. Genome-wide analyses of LATERAL ORGAN BOUNDARIES in cassava reveal the role of LBD47 in defence against bacterial blight. PLoS ONE 2023, 18, e0282100. [Google Scholar] [CrossRef] [PubMed]
  34. Wu, M.; He, W.; Wang, L.; Zhang, X.; Wang, K.; Xiang, Y. PheLBD29, an LBD transcription factor from Moso bamboo, causes leaf curvature and enhances tolerance to drought stress in transgenic Arabidopsis. J. Plant Physiol. 2023, 280, 153865. [Google Scholar] [CrossRef] [PubMed]
  35. Feng, S.; Shi, J.; Hu, Y.; Li, D.; Guo, L.; Zhao, Z.; Lee, G.S.; Qiao, Y. Genome-Wide Analysis of Soybean Lateral Organ Boundaries Domain Gene Family Reveals the Role in Phytophthora Root and Stem Rot. Front. Plant Sci. 2022, 13, 865165. [Google Scholar] [CrossRef] [PubMed]
  36. Sun, H.; Zhang, P.; Zhu, Y.; Lou, Q.; He, S. Antioxidant and prebiotic activity of five peonidin-based anthocyanins extracted from purple sweet potato (Ipomoea batatas (L.) Lam.). Sci. Rep. 2018, 8, 5018. [Google Scholar] [CrossRef] [PubMed]
  37. Liu, Q. Improvement for agronomically important traits by gene engineering in sweetpotato. Breed Sci. 2017, 67, 15–26. [Google Scholar] [CrossRef]
  38. Hou, F.; Du, T.; Qin, Z.; Xu, T.; Li, A.; Dong, S.; Ma, D.; Li, Z.; Wang, Q.; Zhang, L. Genome-wide in silico identification and expression analysis of β-galactosidase family members in sweetpotato [Ipomoea batatas (L.) Lam]. BMC Genom. 2021, 22, 140. [Google Scholar] [CrossRef]
  39. Altschul, S.F.; Gish, W.; Miller, W.; Myers, E.W.; Lipman, D.J. Basic local alignment search tool. J. Mol. Biol. 1990, 215, 403–410. [Google Scholar] [CrossRef]
  40. Krejci, A.; Hupp, T.R.; Lexa, M.; Vojtesek, B.; Muller, P. Hammock: A hidden Markov model-based peptide clustering algorithm to identify protein-interaction consensus motifs in large datasets. Bioinformatics 2016, 32, 9–16. [Google Scholar] [CrossRef]
  41. Schultz, J.; Copley, R.R.; Doerks, T.; Ponting, C.P.; Bork, P. SMART: A web-based tool for the study of genetically mobile domains. Nucleic Acids Res. 2000, 28, 231–234. [Google Scholar] [CrossRef] [PubMed]
  42. Wilkins, M.R.; Gasteiger, E.; Bairoch, A.; Sanchez, J.C.; Williams, K.L.; Appel, R.D.; Hochstrasser, D.F. Protein identification and analysis tools in the ExPASy server. Methods Mol. Biol. 1999, 112, 531–552. [Google Scholar] [CrossRef] [PubMed]
  43. Horton, P.; Park, K.J.; Obayashi, T.; Fujita, N.; Harada, H.; Adams-Collier, C.J.; Nakai, K. WoLF PSORT: Protein localization predictor. Nucleic Acids Res. 2007, 35, W585–W587. [Google Scholar] [CrossRef] [PubMed]
  44. Bailey, T.L.; Boden, M.; Buske, F.A.; Frith, M.; Grant, C.E.; Clementi, L.; Ren, J.; Li, W.W.; Noble, W.S. Meme Suite: Tools for motif discovery and searching. Nucleic Acids Res. 2009, 37, W202–W208. [Google Scholar] [CrossRef] [PubMed]
  45. Chen, C.; Chen, H.; Zhang, Y.; Thomas, H.R.; Frank, M.H.; He, Y.; Xia, R. TBtools: An Integrative Toolkit Developed for Interactive Analyses of Big Biological Data. Mol. Plant 2020, 13, 1194–1202. [Google Scholar] [CrossRef] [PubMed]
  46. Wang, Y.; Tang, H.; Debarry, J.D.; Tan, X.; Li, J.; Wang, X.; Lee, T.H.; Jin, H.; Marler, B.; Guo, H.; et al. MCScanX: A toolkit for detection and evolutionary analysis of gene synteny and collinearity. Nucleic Acids Res. 2012, 40, e49. [Google Scholar] [CrossRef]
  47. Yang, X.; Zhou, T.; Wang, M.; Li, T.; Wang, G.; Fu, F.F.; Cao, F. Systematic investigation and expression profiles of the GbR2R3-MYB transcription factor family in ginkgo (Ginkgo biloba L.). Int. J. Biol. Macromol. 2021, 172, 250–262. [Google Scholar] [CrossRef]
  48. Tamura, K.; Stecher, G.; Kumar, S. MEGA11: Molecular Evolutionary Genetics Analysis Version 11. Mol. Biol. Evol. 2021, 38, 3022–3027. [Google Scholar] [CrossRef]
  49. Lescot, M.; Dehais, P.; Thijs, G.; Marchal, K.; Moreau, Y.; Van de Peer, Y.; Rouze, P.; Rombauts, S. PlantCARE, a database of plant cis-acting regulatory elements and a portal to tools for in silico analysis of promoter sequences. Nucleic Acids Res. 2002, 30, 325–327. [Google Scholar] [CrossRef]
  50. Ding, N.; Wang, A.; Zhang, X.; Wu, Y.; Wang, R.; Cui, H.; Huang, R.; Luo, Y. Identification and analysis of glutathione S-transferase gene family in sweet potato reveal divergent GST-mediated networks in aboveground and underground tissues in response to abiotic stresses. BMC Plant Biol. 2017, 17, 225. [Google Scholar] [CrossRef]
  51. Otasek, D.; Morris, J.H.; Boucas, J.; Pico, A.R.; Demchak, B. Cytoscape Automation: Empowering workflow-based network analysis. Genome Biol. 2019, 20, 185. [Google Scholar] [CrossRef] [PubMed]
  52. Moore, R.C.; Purugganan, M.D. The early stages of duplicate gene evolution. Proc. Natl. Acad. Sci. USA 2003, 100, 15682–15687. [Google Scholar] [CrossRef] [PubMed]
  53. Cannon, S.B.; Mitra, A.; Baumgarten, A.; Young, N.D.; May, G. The roles of segmental and tandem gene duplication in the evolution of large gene families in Arabidopsis thaliana. BMC Plant Biol. 2004, 4, 10. [Google Scholar] [CrossRef] [PubMed]
  54. Wang, X.; Liu, X.; Su, L.; Sun, Y.; Zhang, S.; Hao, Y.; You, C. Identification, evolution and expression analysis of the LBD gene family in tomato. Sci. Agric. Sin. 2013, 46, 2501–2513. [Google Scholar] [CrossRef]
  55. Yang, J.; Moeinzadeh, M.H.; Kuhl, H.; Helmuth, J.; Xiao, P.; Haas, S.; Liu, G.; Zheng, J.; Sun, Z.; Fan, W.; et al. Haplotype-resolved sweet potato genome traces back its hexaploidization history. Nat. Plants 2017, 3, 696–703. [Google Scholar] [CrossRef] [PubMed]
  56. Huang, B.; Huang, Z.; Ma, R.; Ramakrishnan, M.; Chen, J.; Zhang, Z.; Yrjala, K. Genome-wide identification and expression analysis of LBD transcription factor genes in Moso bamboo (Phyllostachys edulis). BMC Plant Biol. 2021, 21, 296. [Google Scholar] [CrossRef] [PubMed]
  57. Song, B.; Tang, Z.; Li, X.; Li, J.; Zhang, M.; Zhao, K.; Liu, H.; Zhang, S.; Wu, J. Mining and evolution analysis of lateral organ boundaries domain (LBD) genes in Chinese white pear (Pyrus bretschneideri). BMC Genom. 2020, 21, 644. [Google Scholar] [CrossRef]
  58. Du, Y.; Zhao, Q.; Li, W.; Geng, J.; Li, S.; Yuan, X.; Gu, Y.; Zhong, J.; Zhang, Y.; Du, J. Genome-wide identification of the LBD transcription factor genes in common bean (Phaseolus vulgaris L.) and expression analysis under different abiotic stresses. J. Plant Interact. 2022, 17, 731–743. [Google Scholar] [CrossRef]
  59. Chalfun, A.; Franken, J.; Mes, J.; Marsch-Martinez, N.; Pereira, A.; Angenent, G. ASYMMETRIC LEAVES2-LIKE1 gene, a member of the AS2/LOB family, controls proximal-distal patterning in Arabidopsis petals. Plant Mol. Biol. 2005, 57, 559–575. [Google Scholar] [CrossRef]
  60. Mangeon, A.; Lin, W.; Springer, P. Functional divergence in the Arabidopsis LOB domain gene family. Plant Signal. Behav. 2012, 7, 1544–1547. [Google Scholar] [CrossRef]
  61. Guo, Z.; Xu, H.; Lei, Q.; Du, J.; Li, C.; Wang, C.; Yang, Y.; Yang, Y.; Sun, X. The Arabidopsis transcription factor LBD15 mediates ABA signaling and tolerance of water-deficit stress by regulating ABI4 expression. Plant J. 2020, 104, 510–521. [Google Scholar] [CrossRef]
Figure 1. Phylogenetic tree, conservative motif, and gene structure of IbLBD family in sweet potato. (A) A maximum likelihood (ML) phylogenetic tree of sweet potato protein with 1000 bootstrap replicates was constructed based on the full-length sequence in MEGA11. (B) Distribution of conservative motifs in IbLBD proteins with colored boxes representing motifs 1–10 and scale representing 50 amino acids. (C) The genetic structure of the IbLBD gene, including intron (black line), exon (yellow rectangle), and untranslated region (UTR, green rectangle), with scale representing 1 kb.
Genes 15 00237 g001
Figure 2. Multiple sequence alignment and conservative domains of sweet potato IbLBD proteins. (A) The zinc finger domain (CX2CX6CX3C) was present in all 53 predicted IbLBD protein sequences, while the leucine zipper-like motif (LX6LX3LX6L) was present only in Class Ⅰ IbLBD proteins. (B) Alignment of conservative motifs generated by MEME online website for the two protein domains.
Genes 15 00237 g002
Figure 3. Phylogenetic trees of LBD proteins for sweet potato and Arabidopsis. Arabidopsis LBD protein sequences were downloaded from the TAIR database. A phylogenetic tree was constructed by the maximum likelihood method based on MEGA11 with 1000 bootstrap replicates performed. The tree was divided into six subfamilies represented by outer rings with different colors; black circles and white circles represent the sweet potato and Arabidopsis LBD genes.
Genes 15 00237 g003
Figure 4. Locations of sweet potato LBD genes on chromosomes. The basic unit indicated a chromosome length of 5.0 Mb. For each chromosome, the number was labeled on the upper side with red indicating a gene pair with tandem duplication.
Genes 15 00237 g004
Figure 5. Distribution and collinearity of the IbLBD gene family in the sweet potato genome. IbLBDs labeled with red had collinearity, while those labeled with black had no collinearity. The two rings in the middle represented the gene density of each chromosome. The gray background lines represent collinear background and the red lines indicate a collinearity relationship between IbLBD members.
Genes 15 00237 g005
Figure 6. Collinearity analysis of LBD protein in sweet potato among species. The species were Arabidopsis, tomato, capsicum, maize, and rice. The red line represents the homologous LBD gene pair of the plant genome and the gray line represents the collinear block of the plant genome.
Genes 15 00237 g006
Figure 7. Distribution of cis-acting elements of IbLBD gene family in sweet potato. Distribution of cis-acting elements identified in the 2000 bp upstream promoter region of sweet potato IbLBD gene and the number of cis-acting element types for the IbLBD gene on the promoter.
Genes 15 00237 g007
Figure 8. Expression patterns of the IbLBD gene family in sweet potato. (A) IbLBD gene expression heatmap in various sweet potato tissues. (B) Expression heatmap of sweet potato root, stem, and leaf tissues induced by salt and drought. Red and blue indicated the intensity of genes in the heatmap: the more intense the red, the higher the gene expression level, and the more intense the blue, the lower the gene expression level.
Genes 15 00237 g008aGenes 15 00237 g008b
Figure 9. Expression patterns of twelve IbLBD genes in different tissues. The x axes represent different tissues including primary root, pencil root, tuber root, stem, leaf, and flower; the y axes indicate the relative expression of IbLBD genes. The different letters of a, b, c, and d indicate significant differences at p < 0.05, as determined by one-way ANOVA with SPSS single factor tests.
Genes 15 00237 g009
Figure 10. Changes in the expression levels of twelve IbLBD genes in different tissues under salt and drought treatments. (A) 12 IbLBD gene expression levels in primary root under salt and drought treatments. (B) 12 IbLBD gene expression levels in stem under salt and drought treatments. (C) 12 IbLBD gene expression levels in leaf under salt and drought treatments. The different letters of a, b, c, and d indicate significant differences at p < 0.05, as determined by one-way ANOVA with SPSS single factor tests.
Genes 15 00237 g010aGenes 15 00237 g010c
Figure 11. Sweet potato IbLBD functional interaction networks based on Arabidopsis orthologs. Proteins serve as network nodes and protein–protein relationships are represented by lines. The size of the node denotes the number of proteins that interacted with one another.
Genes 15 00237 g011
Figure 12. GO annotations for IbLBD proteins. The GO annotation is divided into three main categories: biological process, cellular component, and molecular function. The y axis represents the enrichment score of the number of genes in each category.
Genes 15 00237 g012
Figure 13. The top 20 enriched GO terms of candidate IbLBD target genes. The black circles indicate the number of target genes, and different colors indicate the −log10 (p-value), ranging from 0 to 17.5.
Genes 15 00237 g013
Table 1. Identification of LBD genes and analysis of physicochemical properties of proteins in sweet potato.
Gene NameAccession NumberChromosome
Location
Size (aa)Mw
(kD)
pIGRAVYPredicted Location
IbLBD1OR1336451687306168887318820.726.5−0.311Nucleus
IbLBD2OR1336468494464849612024927.226.6−0.447Nucleus
IbLBD3OR133647270147602701575520923.875.21−0.431Nucleus
IbLBD4OR13364827153427505817419.078.97−0.411Nucleus
IbLBD5OR1336491039868104320616718.277.72−0.411Nucleus
IbLBD6OR1336501069879107414319121.4410.08−0.717Nucleus
IbLBD7OR1336513938571393992021523.256.14−0.039Nucleus
IbLBD8OR1336525639554564080219120.686.99−0.117Nucleus
IbLBD9OR1336535829105583034524225.657.660.173Nucleus
IbLBD10OR1336547327214732860323626.036.2−0.534Nucleus
IbLBD11OR133655365684893657386233435.229.28−0.256Nucleus
IbLBD12OR1336561456672145860521423.118.36−0.817Nucleus
IbLBD13OR1336571466969146918722524.326.48−0.534Nucleus
IbLBD14OR1336583005283300754516017.776.710.322Nucleus
IbLBD15OR1336593278659328002917218.947.63−0.211Nucleus
IbLBD16OR133660226847602268608622424.468.6−0.628Nucleus
IbLBD17OR1336614128151412974327731.016.160.000Nucleus
IbLBD18OR1336625451750545297422625.484.68−0.700Nucleus
IbLBD19OR1336635662166566443919722.238.15−0.278Nucleus
IbLBD20OR133664278015122780227818019.998.28−0.445Nucleus
IbLBD21OR133665279674622796859421423.518.6−0.445Nucleus
IbLBD22OR1336661121586112638324626.198.670.122Nucleus
IbLBD23OR1336671261129126252121223.445.79−0.584Nucleus
IbLBD24OR1336682016696201948830734.004.58−0.080Nucleus
IbLBD25OR133669275582922756059818720.189.27−0.284Nucleus
IbLBD26OR133670288422172884339820421.828.17−0.417Nucleus
IbLBD27OR133671292660262926721723625.748.52−0.528Nucleus
IbLBD28OR133672337911083379705332636.476.66−0.462Nucleus
IbLBD29OR133673348772613487827621023.586.65−0.745Nucleus
IbLBD30OR13367485068885258321822.778.47−0.250Nucleus
IbLBD31OR1336754610655461156214916.168.75−0.017Nucleus
IbLBD32OR1336763472142347575732236.239.58−0.739Nucleus
IbLBD33OR1336776217307622139736639.294.59−0.306Nucleus
IbLBD34OR133678148209111482287421423.469.11−0.261Nucleus
IbLBD35OR1336794501947450316222624.895.39−0.273Nucleus
IbLBD36OR1336804532985453446024527.274.97−0.233Nucleus
IbLBD37OR1336813579351358031220922.478.67−0.101Nucleus
IbLBD38OR133682131308431313170720122.177.64−0.336Nucleus
IbLBD39OR133683224978852250006224026.205.47−0.062Nucleus
IbLBD40OR133684399509253995209322325.268.77−0.966Nucleus
IbLBD41OR1336858697591869916620221.896.11−0.084Nucleus
IbLBD42OR1336869909480991164921423.439.25−0.284Nucleus
IbLBD43OR133687283166252831869217518.916.71−0.007Nucleus
IbLBD44OR133688294344362943868718319.958.58−0.578Nucleus
IbLBD45OR133689119506271195186728030.175.64−1.033Nucleus
IbLBD46OR133690182161741821755731434.945.46−0.580Nucleus
IbLBD47OR133691198217431982408218520.186.88−0.728Nucleus
IbLBD48OR13369229178829523447552.486.250.084Nucleus
IbLBD49OR1336938713728871471815717.299.970.361Nucleus
IbLBD50OR133694267823242678574352057.518.81−0.730Nucleus
IbLBD51OR1336955492804549483822724.668.56−0.495Nucleus
IbLBD52OR1336965850533585154221322.895.47−0.056Nucleus
IbLBD53OR133697180625601806373927731.149.69−0.403Nucleus
Disclaimer/Publisher’s Note: The statements, opinions and data contained in all publications are solely those of the individual author(s) and contributor(s) and not of MDPI and/or the editor(s). MDPI and/or the editor(s) disclaim responsibility for any injury to people or property resulting from any ideas, methods, instructions or products referred to in the content.

