Article

Evaluation of Suitable Reference Genes for Quantitative Real-Time PCR in Various Tissues of Apocynum venetum

1
Key Laboratory of Saline-Alkali Vegetation Ecology Restoration, Ministry of Education, Northeast Forestry University, Harbin 150040, China
2
State Key Laboratory of Desert and Oasis Ecology, Xinjiang Institute of Ecology and Geography, Chinese Academy of Sciences, Urumqi 830011, China
*
Authors to whom correspondence should be addressed.
Genes 2024, 15(2), 231; https://doi.org/10.3390/genes15020231
Submission received: 28 December 2023 / Revised: 27 January 2024 / Accepted: 7 February 2024 / Published: 11 February 2024
(This article belongs to the Section Technologies and Resources for Genetics)

Abstract

:
Apocynum venetum L. is an economically valuable plant with tolerance to drought and salinity. Its leaves are utilized in tea production and pharmaceuticals, while the stem bark serves as a high-quality fiber material. To gain insights into the gene expression patterns of A. venetum using quantitative real-time PCR (qRT-PCR), it is crucial to identify appropriate reference genes. This study selected nine candidate genes, including α-tubulin (TUA), β-tubulin (TUB), actin (ACT), cyclophilin (CYP), elongation factor-1α (EF-1α), the B family of regulatory subunits of protein phosphatase (PPP2R2, PPP2R3, and PPP2R5), and phosphoglycerate kinase (PGK), to determine the most appropriate reference genes in the leaf, stem, and root tissues of A. venetum. A comprehensive ranking by geNorm, NormFinder, BestKeeper, and RefFinder software and Venn diagrams was used to screen more stable reference genes in different tissues. The two most stable reference genes were CYP and TUA in leaves, PGK and PPP2R3 in stems, and TUA and EF-1α in roots, respectively. The relative expression values of the four genes involved in proline metabolism under polyethylene glycol treatment were used to validate the screened reference genes, and they exhibited highly stable expression levels. These findings represent the first set of stable reference genes for future gene expression studies in A. venetum. They significantly contribute to enhancing the accuracy and reliability of gene expression analyses in this economically important plant species.

1. Introduction

The exploration of gene expression patterns in biology is expected to offer valuable insights into intricate regulatory networks, thereby assisting in the identification of genes that are pertinent to various biological processes [1]. Quantification of specific mRNA is a fundamental requirement for analyzing gene expression. At present, Northern blotting, microarray analysis, quantitative real-time PCR (qRT-PCR), and RNA sequencing are employed to quantify specific mRNA levels in diverse tissues of an organism [2,3,4]. Among them, qRT-PCR emerges as a highly dependable technique for analyzing gene expression, primarily owing to its sensitivity, reproducibility, specificity, and capacity for high yield [5,6]. Additionally, it underscores the importance of data normalization for obtaining reliable gene expression values in qRT-PCR analysis. The preferred method for error control mentioned is normalization to either a solitary internal reference gene or a group of multiple reference genes. This normalization step is crucial to mitigate errors and ensure the accuracy of the gene expression data obtained through qRT-PCR [7,8,9]. For reference genes, no universal gene is suitable for every species [10,11]. Hence, it is crucial to validate appropriate reference genes under diverse conditions to ensure the acquisition of biologically meaningful expression data.
Apocynum venetum, which belongs to the Apocynaceae family, is widely distributed across salt-barren zones, desert steppes, and alluvial flats in the Mediterranean region and Northwestern China [12,13,14]. A. venetum has the reputation of “king of wild fiber” and has been extensively utilized in traditional Chinese and Uygur medicine because of its anti-inflammation, antioxidative, antihypertensive, anticancer, antiviral, and bactericidal effects [15,16,17]. Despite its medicinal significance, limited attention has been given to the exploration of A. venetum genes and their expression patterns to unveil their biological functions [14]. Identifying stable candidate reference genes is essential for uncovering the pivotal genes linked to stress resistance or the biosynthesis of active components in A. venetum at the gene expression level. However, there is a deficiency in research focused on the screening of candidate reference genes for this purpose.
In this study, nine reported genes, α-tubulin (TUA), β-tubulin (TUB), actin (ACT), cyclophilin (CYP), elongation factor-1α (EF-1α), B family of regulatory subunits of the protein phosphatase (PPP2R2, PPP2R3, and PPP2R5), and phosphoglycerate kinase (PGK), were used to identify the most stable reference genes for the normalizing of gene expression data in different tissues (leaf, stem, and root) of A. venetum. The stability ranking of potential reference genes was conducted using geNorm, NormFinder, BestKeeper, and RefFinder software. This research will establish a strong empirical basis for future investigations into gene expression in A. venetum through the utilization of qRT-PCR.

2. Materials and Methods

2.1. Plant Materials and PEG6000 Treatment

In vitro-cultured plantlets of A. venetum were cultured on woody plant medium (WPM) supplemented with a sucrose concentration of 20 g L−1. The plantlet culture was nurtured from germinated seeds collected in Xinjiang, China, in 2017. Prior to autoclaving, the pH of the medium was adjusted to 5.8 ± 0.1. All explants were cultured under controlled conditions at a temperature range of 25 ± 2 °C and subjected to a light/dark cycle of 16 h/8 h.
Plantlets that were approximately 15 cm in height were selected to treatment by 20% polyethylene glycol (PEG) 6000 for 24 h. Leaves, stems, and roots were individually harvested and rapidly frozen using liquid nitrogen for RNA extraction.

2.2. Total RNA Extraction and cDNA Synthesis

The CTAB method was employed to extract the total RNA from the samples [18], followed by treatment with RNase-free DNase I (Takara, San Jose, CA, USA) as per the manufacturer’s instructions to eliminate genomic DNA. The concentration and quality of the RNA samples were determined using a DS-11 spectrophotometer (Denovix, Wilmington, DE, USA), assessing both their concentration and 260/280 ratio. Furthermore, confirmation of RNA sample integrity was achieved through agarose gel electrophoresis using a 1.5% (w/v) gel. For cDNA synthesis, we utilized the PrimeScript™ RT reagent kit from Takara Bio Inc., Shiga, Japan, following the manufacturer’s guidelines.

2.3. qRT-PCR Primer Design and Analysis

Six traditional (TUA, TUB, ACT, CYP, EF-1α, and PGK) and three potential (PPP2R2, PPP2R3, and PPP2R5) reference genes were chosen based on the full-length transcriptome data of A. venetum (PRJNA650225). To validate the transcriptome data, we cloned five of the above genes, namely CYP (MW012394), TUA (MW012395), PGK (MW012392), PPP2R3 (MW012393), and AvEF-1α (MW187080), whose sequences were consistent with the transcriptome-sequencing data.
The primer pairs were designed according to specific criteria to ensure optimal performance. These criteria included amplicon lengths ranging from 100 bp to 300 bp, guanine–cytosine contents between 40% and 60%, primer lengths spanning from 20 bp to 22 bp, a temperature difference of less than 1 °C for each pair, and a melting temperature (Tm) within the recommended range of 59–62 °C as suggested by previous studies [7,19]. Detailed information about the primer pairs developed in this study can be found in Table 1. The qRT-PCR reactions were performed using the Applied Biosystems 7500 RT-PCR System (Thermo Fisher, Waltham, MA, USA). PCR amplification followed standard cycling conditions, which involved an initial denaturation step at 95 °C for 30 s, followed by 40 cycles consisting of denaturation at 95 °C for 5 s and annealing/extension at 60 °C for 34 s.

2.4. Stability Analysis

The expression levels of the candidate reference genes in various tissues were determined by analyzing the cycle threshold values (Ct). The stability analysis of these nine candidate reference genes was conducted using geNorm (version 3.5), NormFinder (version 20), and BestKeeper (version 1). Additionally, we utilized the RefFinder web tool (https://www.heartcure.com.au/reffinder/) (accessed on 15 March 2021), which integrated geNorm, NormFinder, BestKeeper, and the comparative ΔCt method algorithms, to comprehensively evaluate the qRT-PCR data and generate a ranking of transcript stability [20]. A smaller ranking value indicated higher stability for a given reference gene. Furthermore, we employed a Venn diagram approach (http://bioinformatics.psb.ugent.be/webtools/Venn/) (accessed on 15 March 2021) to summarize the consensus among all algorithms in selecting the best reference genes.
The upregulation of key enzyme genes involved in plant proline metabolism was observed during drought conditions [21]. Therefore, four key enzyme genes of proline metabolism, namely, Δ1-pyrroline-5-carboxylate synthase (P5CS), ornithine δ-aminotransferase (OAT), proline hydroxylase (PHD), and glutamic acid decarboxylase (GAD), were selected to assess the stability of potential reference genes under 20% PEG 6000 treatment. The primer details for these genes are provided in Table 1. Gene expression data were calculated with the 2−ΔΔCt method [22].

2.5. Statistical Analysis

All experiments were conducted with 3 biological replicates and 3 technical replicates. The figures present the average values ± standard error. Tukey’s tests were employed for conducting multiple comparisons among means. Statistical significance was determined at a threshold of p < 0.05.

3. Results

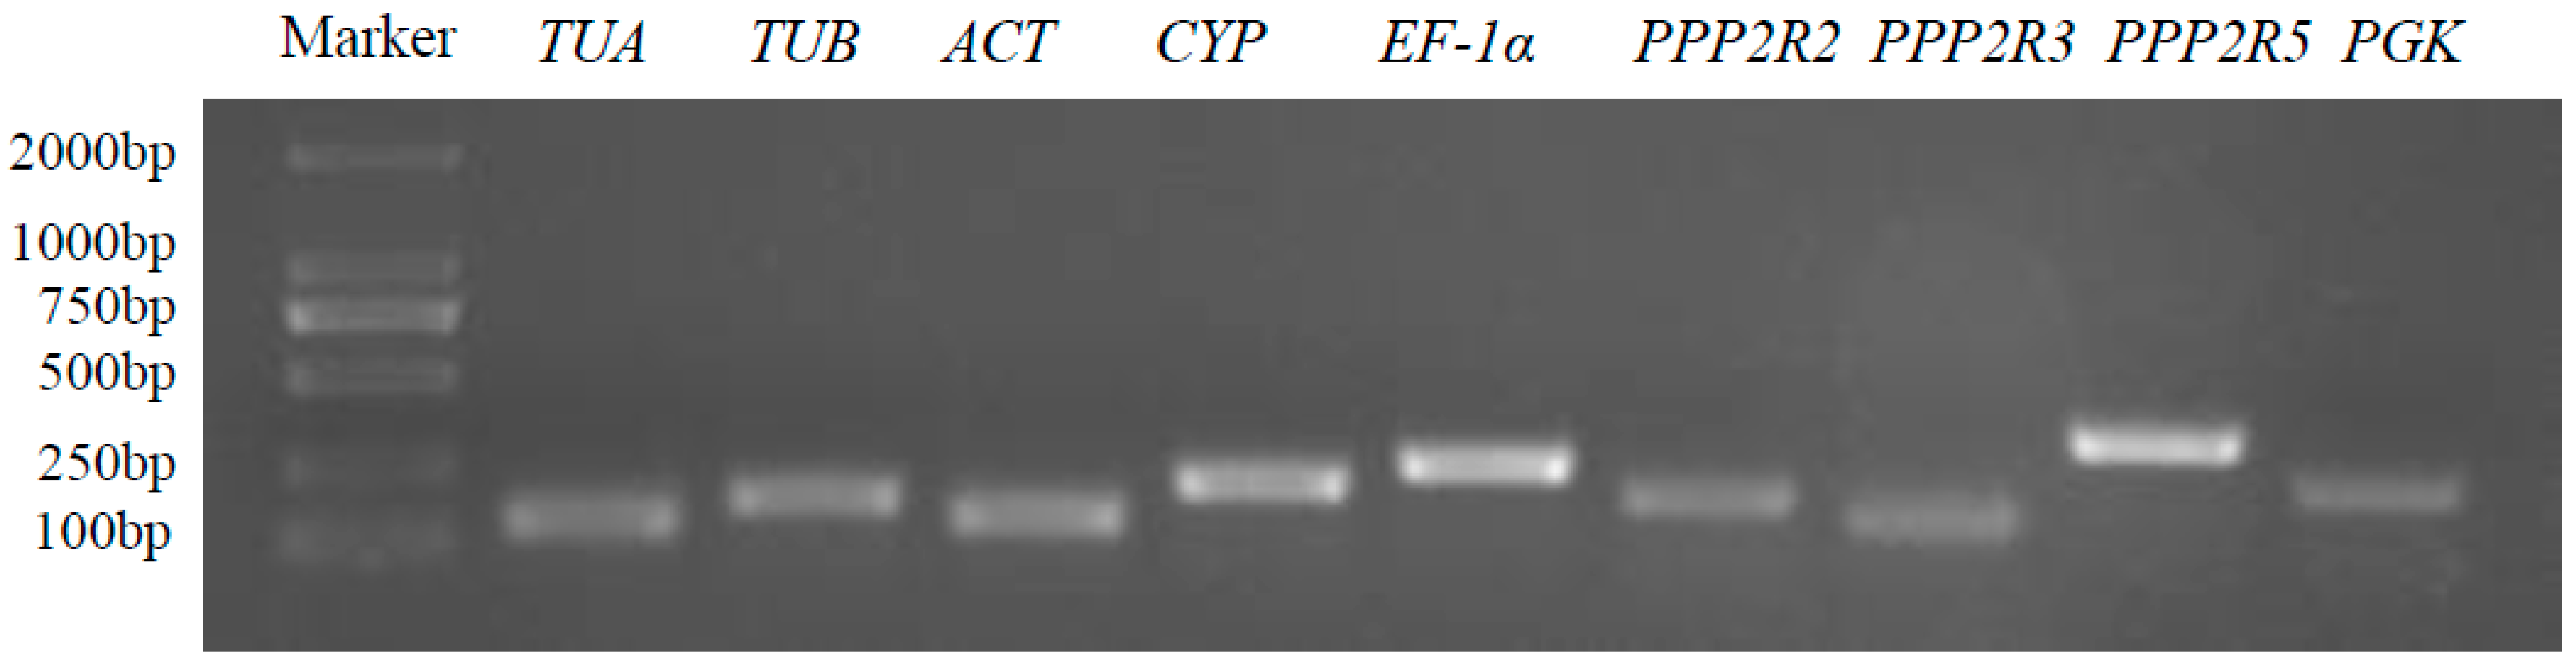
3.1. Selection of Candidate Reference Genes of A. venetum

Nine potential reference genes (TUA, TUB, ACT, CYP, EF-1α, PPP2R2, PPP2R3, PPP2R5, and PGK) were selected from A. venetum transcriptome datasets according to the criteria of published papers. The details of these candidate reference genes can be found in Table 1. The qRT-PCR products of candidate reference genes ranged from 135 bp (ACT) to 279 bp (PPP2R5), and their electrophoresis bands were bright and clear without primer dimers or impurities (Figure 1). Furthermore, the specificity of the primer pairs was further confirmed by melt curve analysis, which showed a single peak for each gene amplification product (Figure S2). The confirmed specificity of the primers for all nine candidate reference genes solidified their suitability and reliability for qRT-PCR applications.

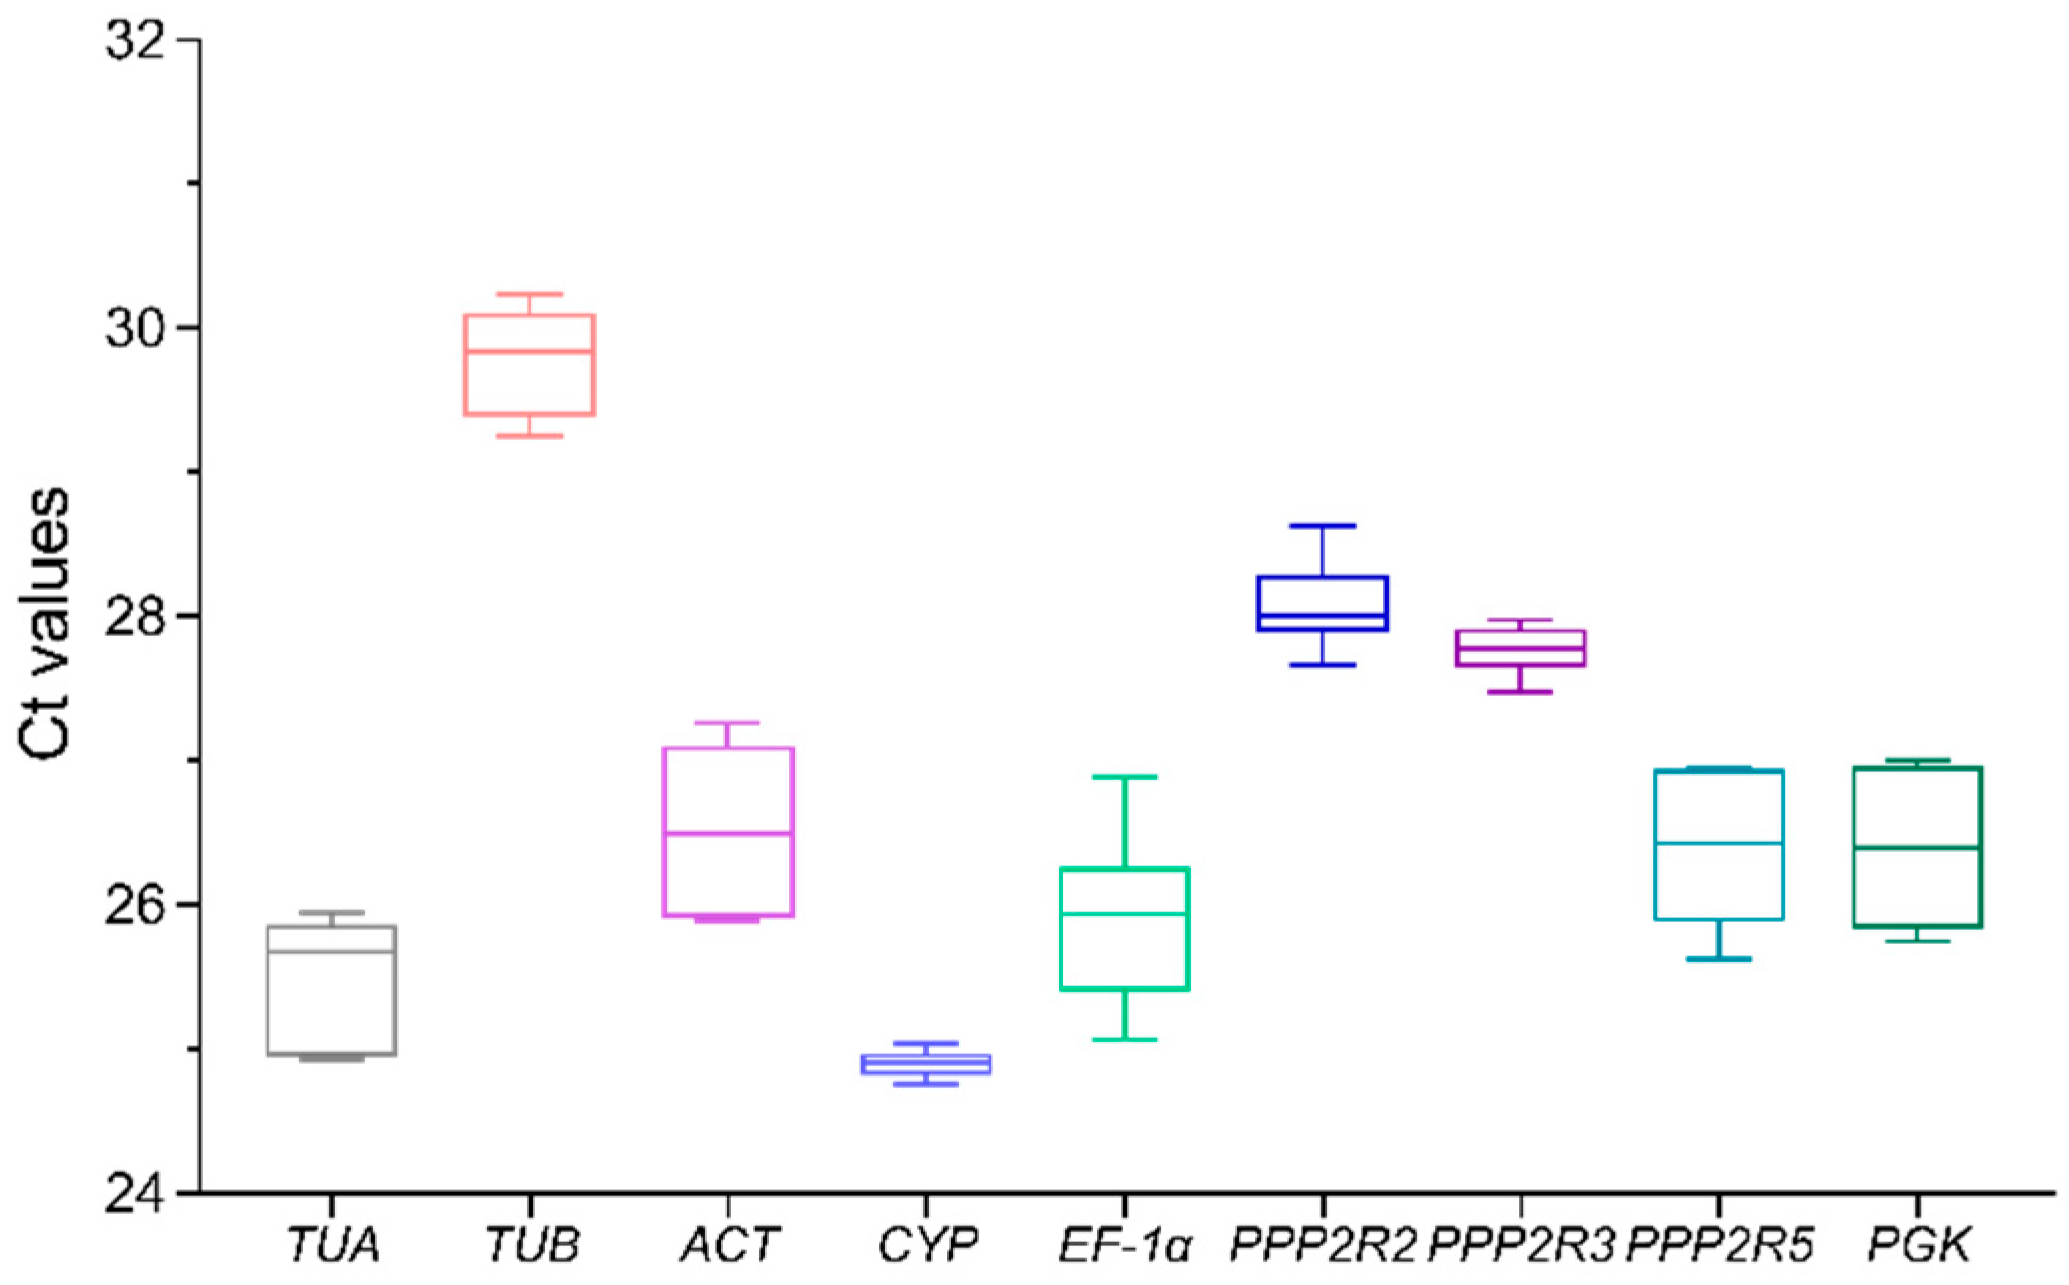
3.2. Expression Levels of Candidate Reference Genes

The assessment of expression levels of the candidate reference genes in A. venetum plantlets’ leaves, stems, and roots was conducted using cycle threshold (Ct) values. These Ct values represent the number of cycles required for fluorescence to reach a predetermined detection threshold. Figure 2 displays the Ct data from three replicated reactions with nine primer pairs. The mean Ct values ranged from 24.90 (CYP) to 29.78 (TUB). It is worth noting that among the nine candidate reference genes, CYP demonstrated the highest level of gene expression.

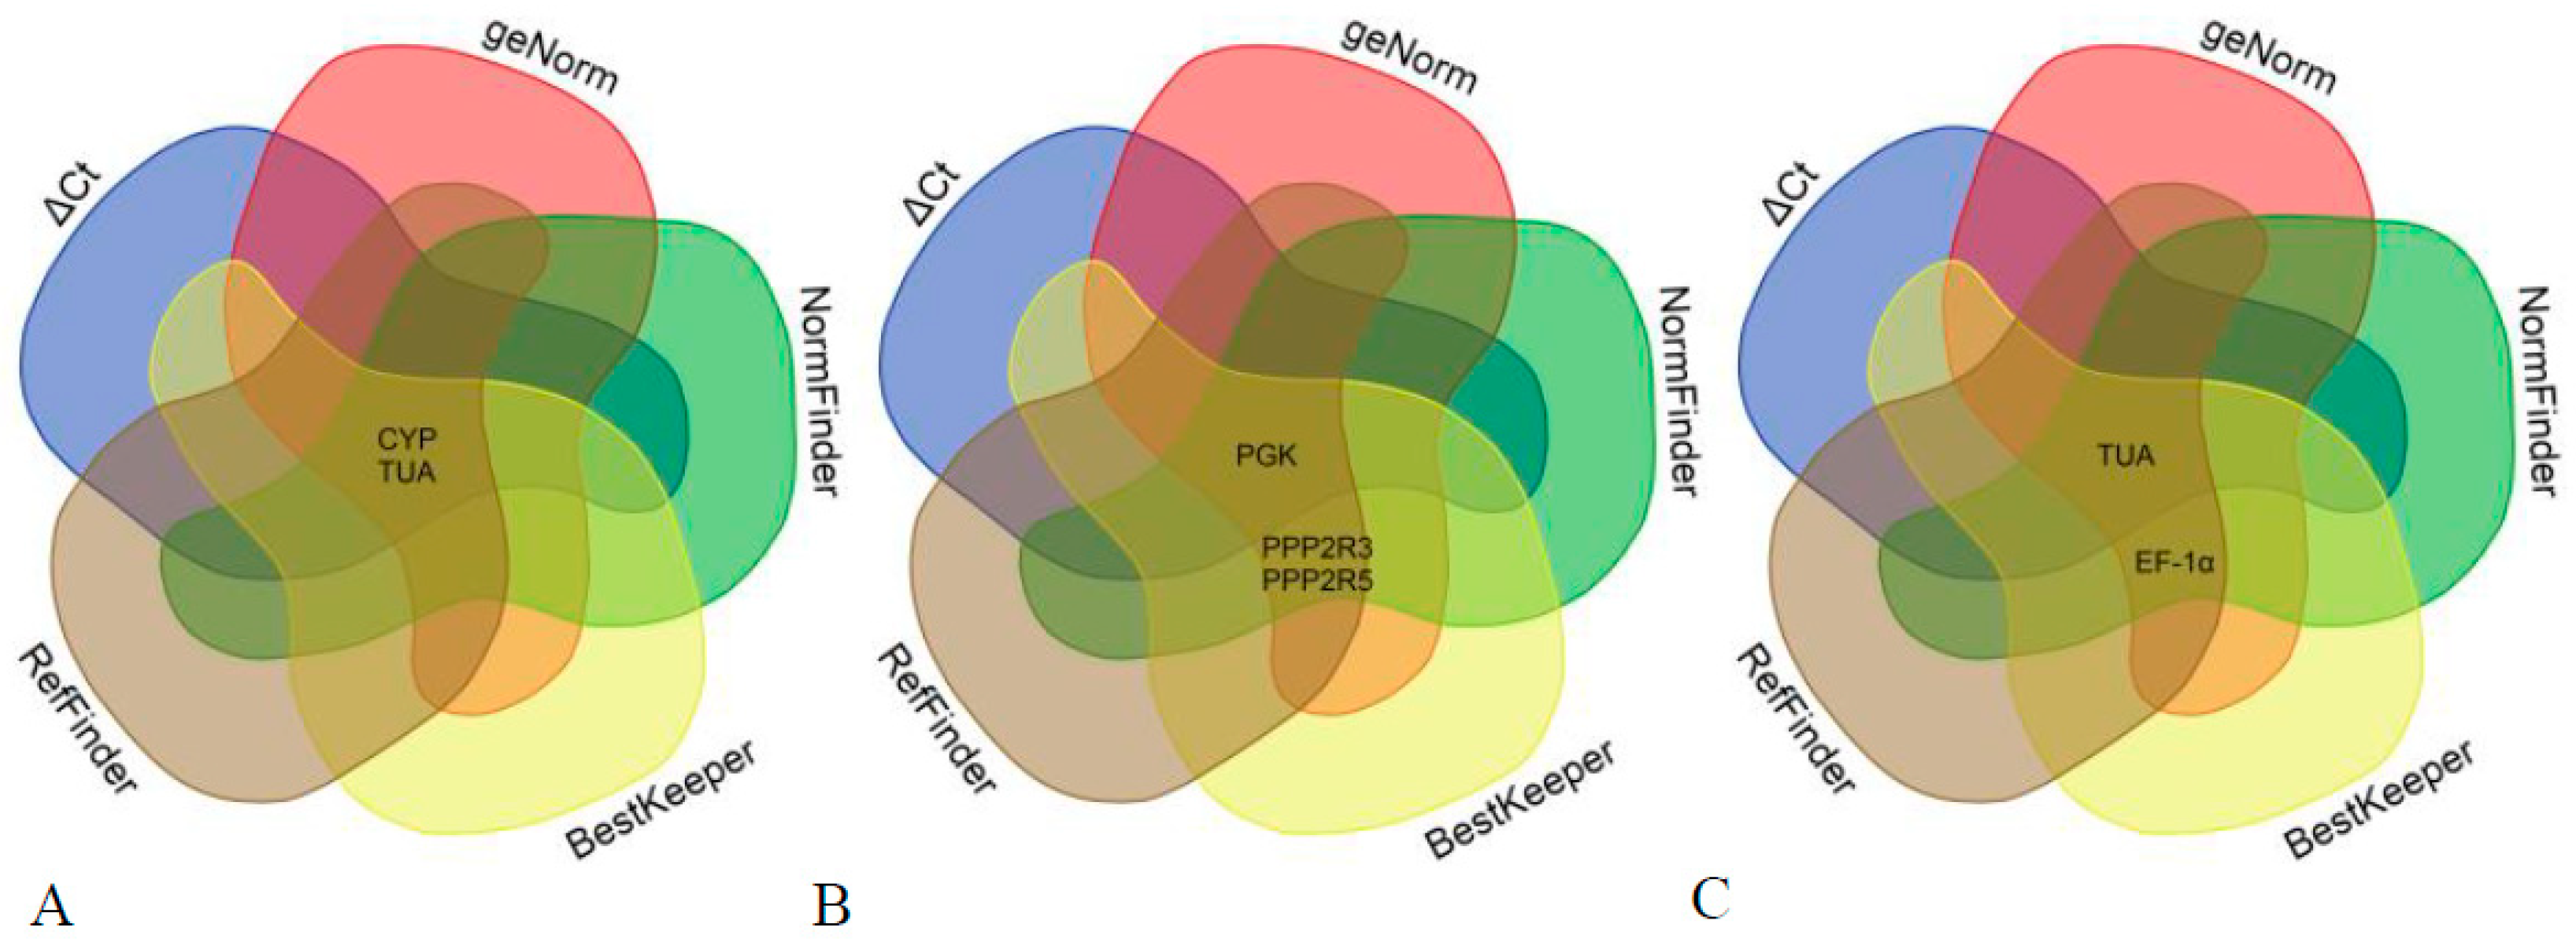
3.3. Stability Analysis of Candidate Reference Genes

The gene expression stability of nine potential reference genes was extensively evaluated and ranked using geNorm, NormFinder, and BestKeeper software (Figures S3–S5). The ultimate ranking was determined through the utilization of RefFinder software and a Venn diagram generated from the aforementioned programs (Table 2 and Figure 3).
Lower values measured in geNorm, NormFinder, and BestKeeper software represented higher expression stability in reference genes. As shown in Table 2, the selection of the most stable reference genes differed among various plant tissues: PGK and CYP in leaves, PGK and PPP2R3 in stems, and EF-1α and TUA in roots. The two most stable reference genes varied across different plant tissues: PPP2R5 and CYP in leaves, PPP2R3 and PGK in stems, CYP and TUA in roots. The most two stable reference genes were CYP and PGK in leaves, PPP2R5 and PPP2R3 in stems, ACT and TUA in roots.
The selection of the two most reliable reference genes differed slightly among the three algorithms mentioned above. Therefore, it was crucial to obtain a comprehensive ranking. The results obtained from RefFinder software and Venn diagram analysis using all algorithms were nearly identical. In leaf samples, CYP and TUA were identified as the two most stable reference genes, while in stem samples, PGK and PPP2R3 showed high stability. In root samples, TUA and EF-1α were found to be the most stable reference genes.
The M values were obtained from geNorm, the SV values were determined by NormFinder, SD represented standard deviation in BestKeeper, CV indicated the coefficient of variation in BestKeeper, and the ultimate comprehensive ranking was computed using RefFinder.

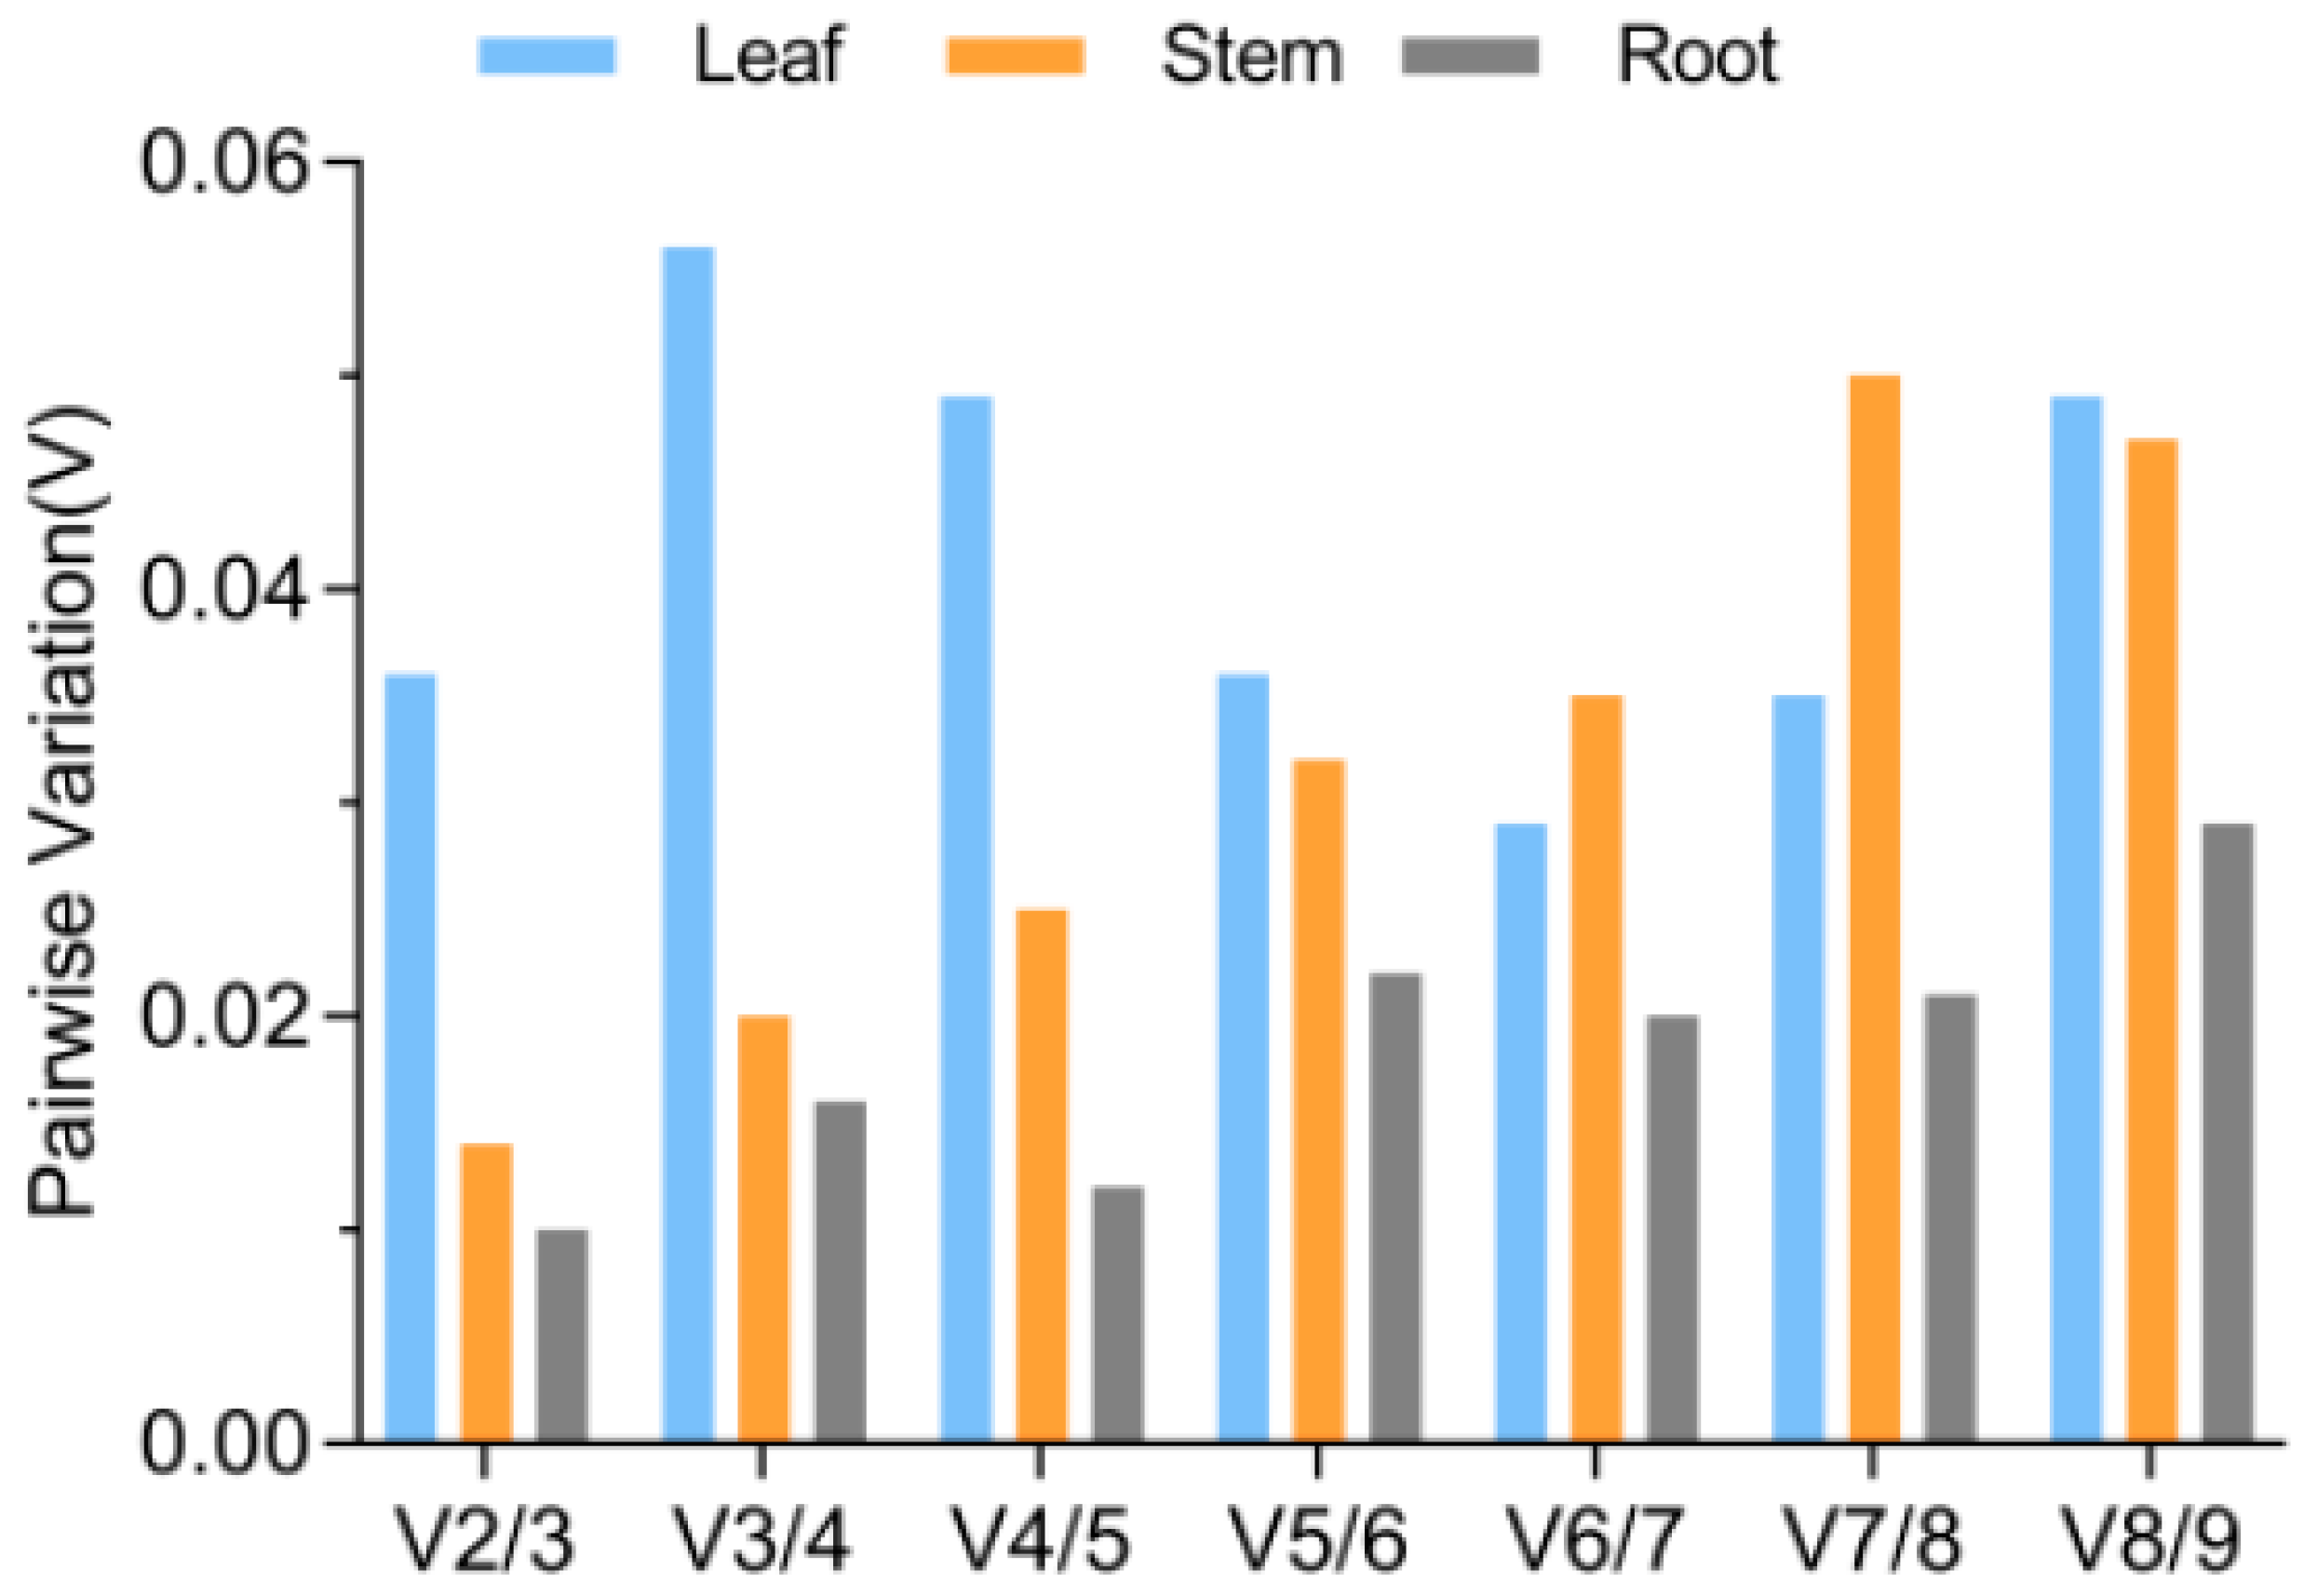
3.4. Determination of the Optimal Number of Reference Genes for Normalization

The optimal number of reference genes was determined using the geNorm software through a pairwise comparison (Vn/n + 1). According to Gong et al. (2016) [23], if the threshold value is lower than 0.15, there is no need for additional reference genes for normalization. Figure 4 illustrates that the V-values in leaves, stems, and roots were all below 0.15. Hence, two reference genes were sufficient to normalize qRT-PCR data across all analyzed tissues.

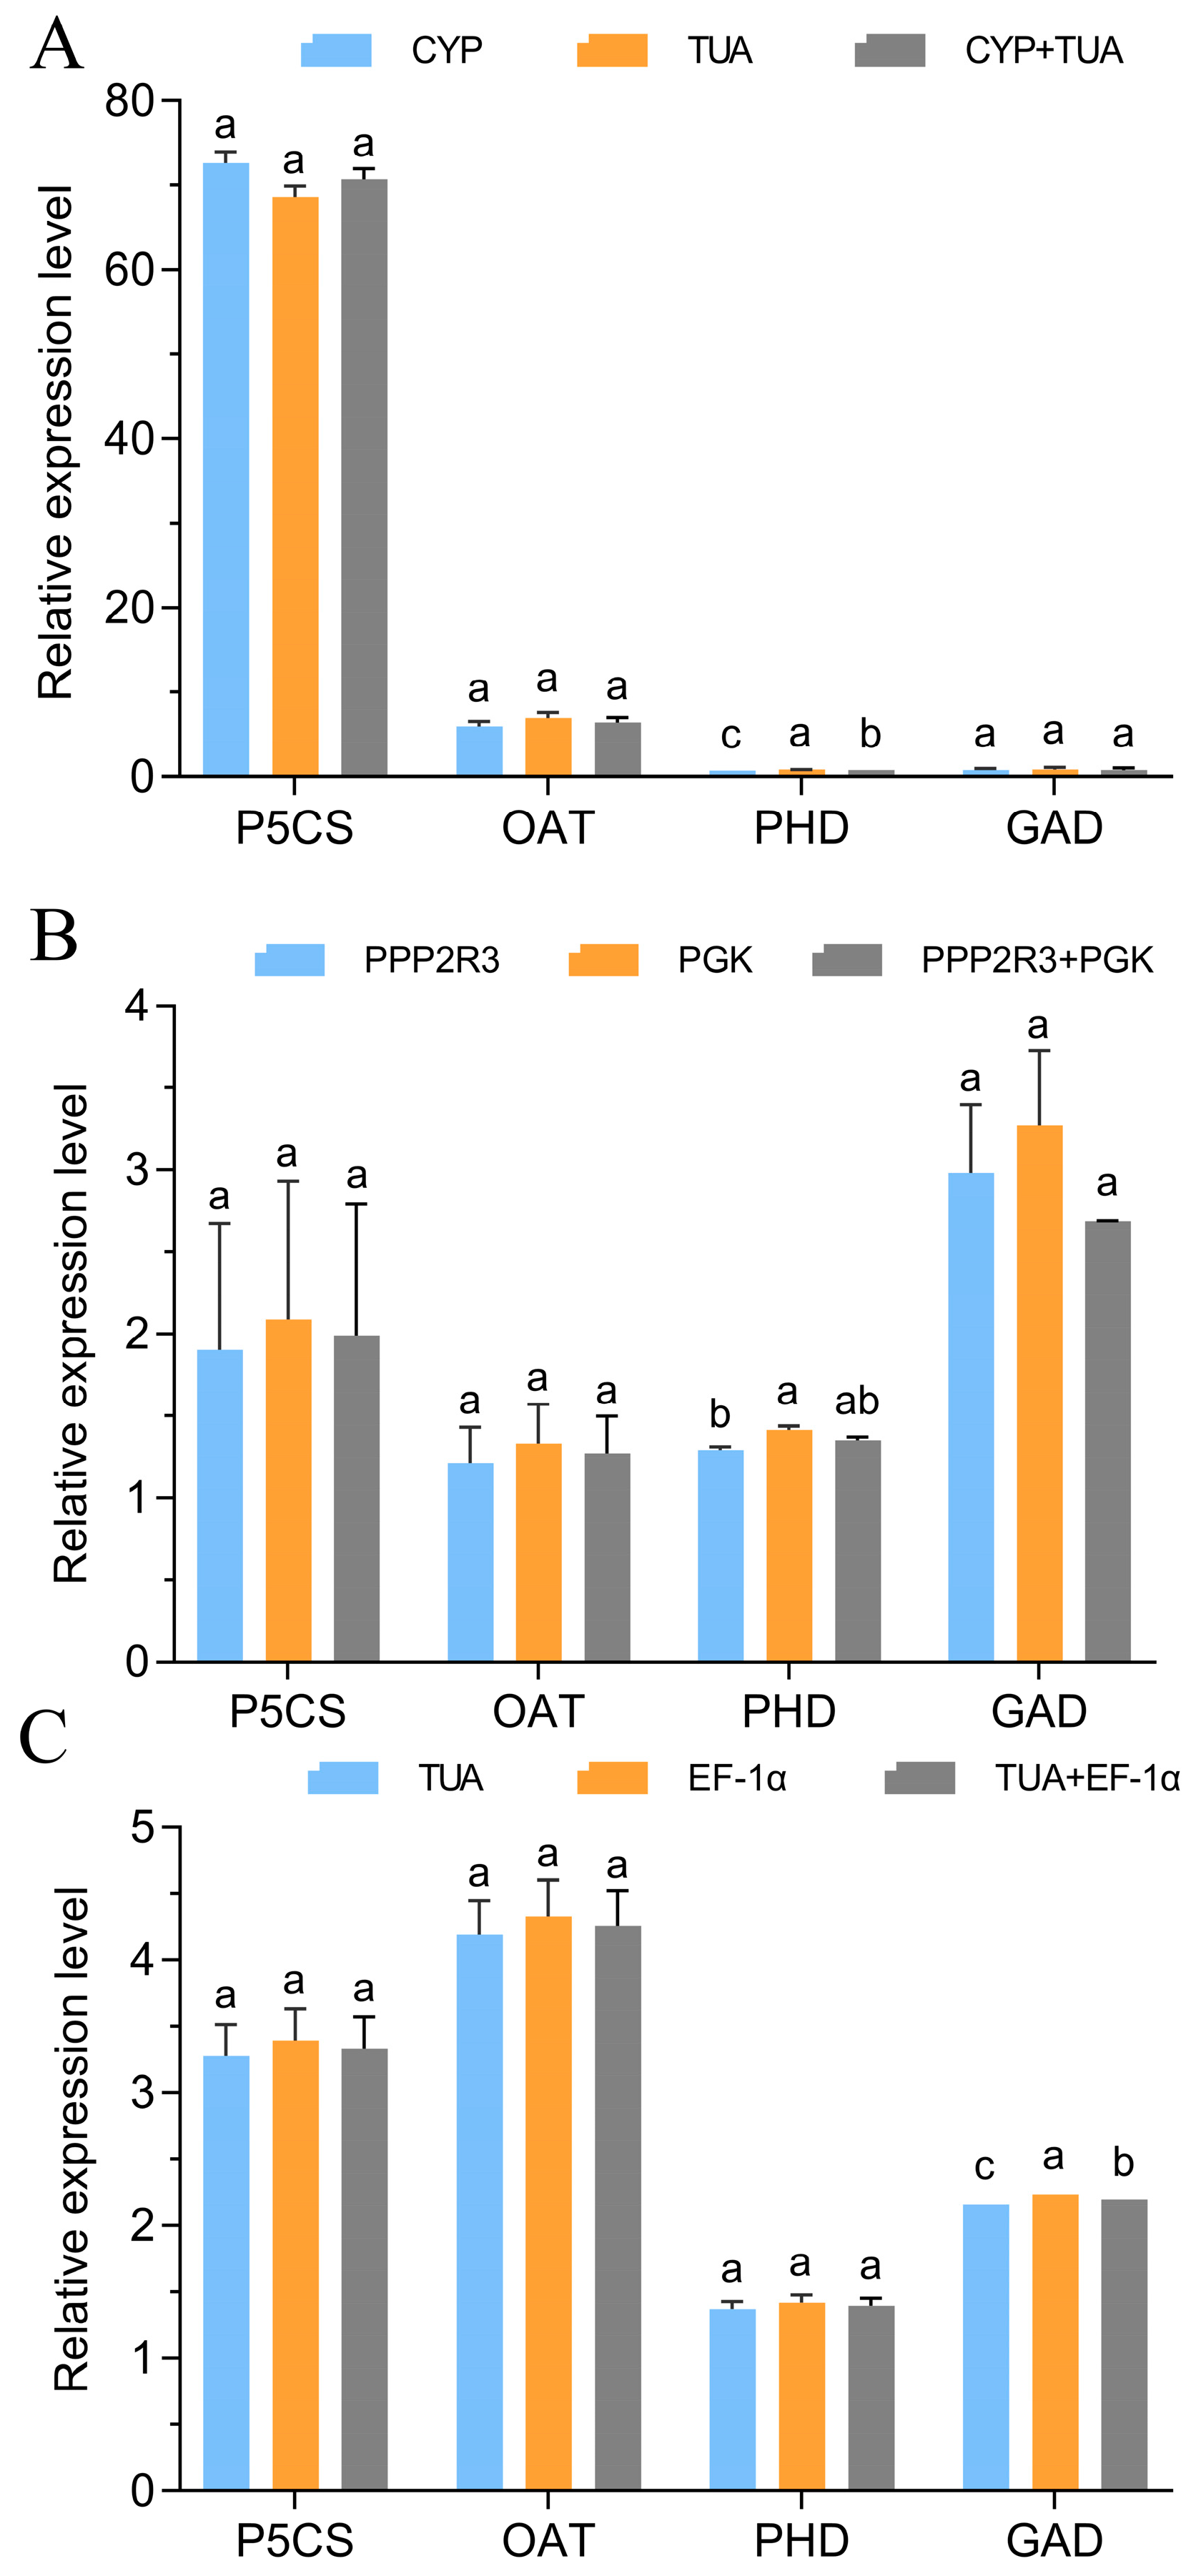
3.5. Validation of the Stability of the Chosen Reference Genes

The gene expression levels of four genes (P5CS, OAT, PHD, and GAD) associated with proline metabolism were investigated across various tissues subjected to 20% PEG treatment for 24 h. This analysis aimed to validate the previously selected reference genes. As shown in Figure 5, except for PHD in leaves and stems and GAD in roots, the gene expression normalized by two selected reference genes had no remarkable differences individually and jointly. For example, the gene expression of P5CS normalized by CYP or TUA in leaves under 20% PEG treatment was almost similar. The results also exhibited higher expression stability of selected normalizing reference genes in their corresponding tissues. Additionally, gene expression of P5CS was higher than that of the other three genes in leaves or whole plantlets under 20% PEG treatment for 24 h.

4. Discussion

The genomic and transcriptomic information for A. venetum has been extensively documented [24,25]. qRT-PCR is widely recognized as a powerful technique that enables the accurate quantification of gene expression, providing more precise expression profiles of genes of interest. To minimize biological interferences and remove variation, it is essential to employ reference genes as internal controls to normalize mRNA levels during qRT-PCR analysis [7,8,26]. However, the suitability of a single reference gene may vary across different plant species, tissues, and environmental conditions [10,11]. Therefore, it is crucial to validate candidate reference genes for their stability before implementing them in qRT-PCR experiments.
TUA, TUB, ACT, CYP, EF-1α, PPP2R2, PPP2R3, PPP2R5, and PGK have been validated as stable reference genes in plants [8,9,26,27]. Based on a lack of qRT-PCR reference genes in A. venetum, the above nine candidate genes were screened and identified by stability analysis in order to determine the optimal reference genes in the leaves, stems, and roots of A. venetum. All nine genes exhibited varying levels of expression across different tissues in A. venetum. Suitable reference genes in different tissues were found using a comprehensive ranking by geNorm, NormFinder, BestKeeper, and RefFinder software and Venn diagrams. The two most stable reference genes in leaves, stems, and roots were CYP and TUA, PGK and PPP2R3, and TUA and EF-1α, respectively. Similar results of varied expressions in different tissues have been reported in some plant species [4,9,28]. From the above results, we also found that the expression levels of reference genes were not always stable across different tissues in A. venetum.
The “traditional” reference gene TUA has been substantiated as an equally suitable reference gene for gene expression analysis in the leaves and roots of A. venetum. Similar results have been reported in the leaves and roots of Allium sativum, Eucalyptus globulus, Solanum aculeatissimum, and Actinidia delicious [10,29,30,31]. Conversely, TUA was the most unstable one in Primula forbesii and Prunus persicav [32,33]. It can be seen that the screening and identification of reference genes are the prerequisite to ensure the comparison of relative gene expression levels in different tissues.
PP2A is a trimeric enzyme consisting of three distinct subunits—the scaffold A subunit (PP2AA), the regulatory B subunit (PP2AB), and the catalytic C subunit (PP2AC). Its main function is to selectively remove phosphate groups from serine and threonine residues in proteins [27]. Recent studies have identified PP2A as a stable reference gene in Momordica charantia [19] and Codonopsis pilosula [34]. In this study, we focused on analyzing the transcriptional expression levels of three genes within the B subunit of PP2A. Our findings suggest that PPP2R3 is the most suitable reference gene in A. venetum stems. Therefore, we propose that genes within the B subunit of PP2A can serve as a reliable set of reference genes for future studies.
A single reference gene may lead to inaccurate quantification of target genes [10,28]. Hence, the geNorm algorithm recommends a threshold value of 0.15 to identify the minimum number of reference genes required for precise normalization across diverse tissues and different external stress conditions [8]. Figure 4 demonstrates that the V-values in leaf, stem, and root tissues of A. venetum were all below 0.15. Previous studies on Allium wallichii flower development stages [35] and kiwifruit roots [36] have shown that two reference genes effectively stabilize the relative expression levels of target genes. In our study, both single and paired reference genes were chosen to validate and analyze the expression of genes associated with proline metabolism (P5CS, OAT, PHD, and GAD). The chosen normalized reference genes exhibited higher stability in their respective tissues when assessed individually or together. Therefore, only two reference genes were sufficient for normalizing qRT-PCR data across all examined tissues in A. venetum. These tissue-specific stable reference genes also proved suitable for accurate normalization under PEG treatment.

5. Conclusions

In this investigation, CYP and TUA, PGK and PPP2R3, and TUA and EF-1α were identified as the two most reliable reference genes in the leaf, stem, and root of A. venetum, respectively. Additionally, these tissue-specific stable reference genes were found to be suitable for accurate normalization under PEG treatment in A. venetum. A. venetum has a longstanding history of utilization in China for both tea and medicinal purposes. The chosen stable reference genes are poised to facilitate research on the gene function of A. venetum at the transcript level.

Supplementary Materials

The following supporting information can be downloaded at: https://www.mdpi.com/article/10.3390/genes15020231/s1, Figure S1. Agarose gel electrophoresis of total RNA, Figure S2. Melting curve analysis of 9 reference genes in A. venetum, Figure S3. Expressional stability of candidate reference genes made by geNorm analysis, Figure S4. Expressional stability of candidate reference genes made by NormFinder analysis, Figure S5. Expressional stability of candidate reference genes made by BestKeeper analysis

Author Contributions

G.F. and T.Z. conceived and designed the experiments. T.Z. performed the research. X.L. analyzed the data. G.F., X.L. and L.J. wrote the paper. All authors have read and agreed to the published version of the manuscript.

Funding

This work was supported by the National Natural Science Foundation of China (32270400) and the Foundation of State Key Laboratory of Desert and Oasis Ecology, Xinjiang Institute of Ecology and Geography, Chinese Academy of Sciences (G2018-02-07).

Institutional Review Board Statement

Not applicable.

Informed Consent Statement

Not applicable.

Data Availability Statement

The data presented in this study are available in article.

Conflicts of Interest

The authors declare no conflicts of interest.

Abbreviations

qRT-PCRReal-time quantitative polymerase chain reaction
TUAα-tubulin actin
TUBβ-tubulin
ACTActin
CYPCyclophilin
EF-1αElongation factor-1α
PPP2RB family of regulatory subunits of the protein phosphatase
PGKPhosphoglycerate kinase
P5CSΔ1-pyrroline-5-carboxylate synthase
OATOrnithine δ-aminotransferase
PHDProline hydroxylase
GADGlutamic acid decarboxylase

References

  1. Yan, X.; Qian, C.J.; Yin, X.Y.; Fan, X.K.; Zhao, X.Y.; Gu, M.H.; Wang, T.; Ma, X.F. A whole-transcriptome approach to evaluate reference genes for quantitative diurnal gene expression studies under natural field conditions in Tamarix ramosissima leaves. Electron. J. Biotechnol. 2018, 35, 48–56. [Google Scholar] [CrossRef]
  2. Gan, Y.B.; Zhou, Z.J.; An, L.J.; Bao, S.J.; Forde, B.G. A comparison between northern blotting and quantitative real-time PCR as a means of detecting the nutritional regulation of genes expressed in roots of Arabidopsis thaliana. Agr. Sci. China 2011, 3, 335–342. [Google Scholar] [CrossRef]
  3. Nashima, K.; Shimizu, T.; Nishitani, C.; Yamamoto, T.; Takahashi, H.; Nakazono, M.; Itai, A.; Isuzugawa, K.; Hanada, T.; Takashina, T.; et al. Microarray analysis of gene expression patterns during fruit development in European pear (Pyrus communis). Sci. Hortic. 2013, 164, 466–473. [Google Scholar] [CrossRef]
  4. Liu, X.; Gao, Y.B.; Zhao, X.Y.; Zhang, X.X.; Ben, L.L.; Li, Z.L.; Dong, G.C.; Zhou, J.; Huang, J.Y.; Yao, Y.L. Validation of Novel Reference Genes in Different Rice Plant Tissues through Mining RNA-Seq Datasets. Plants 2023, 12, 3946. [Google Scholar] [CrossRef]
  5. Hindson, C.M.; Chevillet, J.R.; Briggs, H.A.; Gallichotte, E.N.; Ruf, I.K.; Hindson, B.J.; Vessella, R.L.; Tewari, M. Absolute quantification by droplet digital PCR versus analog real-time PCR. Nat. Methods 2013, 10, 1003–1005. [Google Scholar] [CrossRef]
  6. Zeng, A.; Xu, Y.Y.; Song, L.X.; Li, J.Q.; Yan, J.Y. Validation of suitable reference genes for qRT-PCR in cabbage (Brassica oleracea L.) under different abiotic stress experimental conditions. J. Plant Biochem. Biotechnol. 2021, 30, 184–195. [Google Scholar] [CrossRef]
  7. Jiang, Q.; Wang, F.; Li, M.Y.; Ma, J.; Tan, G.F.; Xiong, A.S. Selection of suitable reference genes for qPCR normalization under abiotic stresses in Oenanthe javanica (BI.) DC. PLoS ONE 2014, 9, 92262. [Google Scholar] [CrossRef] [PubMed]
  8. Petriccione, M.; Mastrobuoni, F.; Zampella, L.; Scortichini, M. Reference gene selection for normalization of qRT-PCR gene expression data from Actinidia deliciosa leaves infected with Pseudomonas syringae pv. actinidiae. Sci. Rep. 2015, 5, 16961. [Google Scholar] [CrossRef]
  9. Aminfar, Z.; Rabiei, B.; Tohidfar, M.; Mirjalili, M.H. Selection and validation of reference genes for quantitative real-time PCR in Rosmarinus officinalis L. in various tissues and under elicitation. Biocatal. Agric. Biotechnol. 2019, 20, 101246. [Google Scholar] [CrossRef]
  10. de Almeida, M.R.; Ruedell, C.M.; Ricachenevsky, F.K.; Sperotto, R.A.; Pasquali, G.; Fett-Neto, A.G. Reference gene selection for quantitative reverse transcription-polymerase chain reaction normalization during in vitro adventitious rooting in Eucalyptus globulus Labill. BMC Mol. Biol. 2010, 11, 73. [Google Scholar] [CrossRef]
  11. Jia, D.H.; Wang, B.; Li, X.L.; Tan, W.; Gan, B.C.; Peng, W.H. Validation of reference genes for quantitative gene expression analysis in Auricularia cornea. J. Microbiol. Methods 2019, 163, 105658. [Google Scholar] [CrossRef]
  12. Xie, W.Y.; Zhang, X.Y.; Wang, T.; Hu, J.J. Botany, traditional uses, phytochemistry and pharmacology of Apocynum venetum L. (Luobuma): A review. J. Ethnopharmacol. 2012, 141, 1–8. [Google Scholar] [CrossRef] [PubMed]
  13. Xu, Z.C.; Zhou, J.H.; Zhang, C.S.; Li, Y.Q. Review of Current Research and Utilization Status of Apocynum venetum Germplasm in China. Chin. Bull. Bot. 2018, 53, 382–390. [Google Scholar]
  14. Yang, J.L.; Zhang, L.X.; Jiang, L.; Zhan, Y.G.; Fan, G.Z. Quercetin alleviates seed germination and growth inhibition in Apocynum venetum and Apocynum pictum under mannitol-induced osmotic stress. Plant Physiol. Biotechnol. 2021, 159, 268–276. [Google Scholar] [CrossRef] [PubMed]
  15. Kong, N.N.; Fang, S.T.; Liu, Y.; Wang, J.H.; Yang, C.Y.; Xia, C.H. Flavonoids from the halophyte Apocynum venetum and their antifouling activities against marine biofilm-derived bacteria. Nat. Prod. Res. 2014, 28, 928–931. [Google Scholar] [CrossRef] [PubMed]
  16. Zhang, W.; Dong, Z.; Chang, X.J.; Zhang, C.H.; Rong Gh Gao, X.D.; Zeng, Z.; Wang, C.P.; Chen, Y.; Rong, Y.H.; Qu, J.H.; et al. Protective effect of the total flavonoids from Apocynum venetum L. on carbon tetrachloride-induced hepatotoxicity in vitro and in vivo. J. Physiol. Biochem. 2018, 74, 301–312. [Google Scholar] [CrossRef] [PubMed]
  17. Jiang, L.; Wang, L.; Tanveer, M.; Tian, C.Y. Lithium biofortification of medicinal tea Apocynum venetum. Sci. Rep. 2019, 9, 8182. [Google Scholar] [CrossRef] [PubMed]
  18. Fan, G.Z.; Nie, T.T.; Huang, Y.T.; Zhan, Y.G. GSNOR deficiency enhances betulin production in Betula platyphylla. Trees 2018, 32, 847–853. [Google Scholar] [CrossRef]
  19. Wang, Z.L.; Xu, J.Y.; Liu, Y.H.; Chen, J.Y.; Lin, H.F.; Huang, Y.L.; Bian, X.H.; Zhao, Y.C. Selection and validation of appropriate reference genes for real-time quantitative PCR analysis in Momordica charantia. Phytochemistry 2019, 164, 1–11. [Google Scholar] [CrossRef]
  20. Xie, F.L.; Wang, J.Y.; Zhang, B.H. RefFinder: A web-based tool for comprehensively analyzing and identifying reference genes. Funct. Integr. Genom. 2023, 23, 125. [Google Scholar] [CrossRef]
  21. Per, T.S.; Khan, N.A.; Reddy, P.S.; Masood, A.; Hasanuzzaman, M.; Khan, M.I.R.; Anjum, N.A. Approaches in modulating proline metabolism in plants for salt and drought stress tolerance: Phytohormones, mineral nutrients and transgenics. Plant Physiol. Biochem. 2017, 115, 126–140. [Google Scholar] [CrossRef]
  22. Livak, K.J.; Schmittgen, T.D. Analysis of relative gene expression data using real-time uantitative PCR and the 2-ΔΔCt method. Methods 2001, 25, 402–408. [Google Scholar] [CrossRef]
  23. Gong, H.; Sun, L.; Chen, B.D.; Han, Y.W.; Pang, J.; Wu, W.; Qi, R.M.; Zhang, T.M. Evaluation of candidate reference genes for qRT-PCR studies in three metabolism related tissues of mice after caloric restriction. Sci. Rep. 2016, 6, 38513. [Google Scholar] [CrossRef]
  24. Zhang, T.T.; Li, M.; Zhan, Y.G.; Fan, G.Z. Dataset of full-length transcriptome assembly and annotation of apocynum venetum using pacbio sequel II. Data Brief 2020, 33, 106494. [Google Scholar] [CrossRef]
  25. Xiang, T.; Wu, L.J.; Isah, M.B.; Chen, C.; Zhang, X.Y. Apocynum venetum, a medicinal, economical and ecological plant: A review update. PeerJ 2023, 11, e14966. [Google Scholar] [CrossRef]
  26. Zhang, Y.; Liu, F.J.; Guo, H.Y.; Ma, H.; Chen, H.; Song, Y.Y.; Chen, P.; Xu, Q.L. Selection of reference genes for quantitative real-time PCR analysis in Lathyrus sativus L. under different development stages and drought stress. Genet. Resour. Crop Evol. 2022, 69, 2319–2330. [Google Scholar] [CrossRef]
  27. Clark, A.R.; Ohlmeyer, M. Protein phosphatase 2A as a therapeutic target in inflammation and neurodegeneration. Pharmacol. Therapeut 2019, 201, 181–201. [Google Scholar] [CrossRef]
  28. Luo, X.Y.; Shi, T.; Sun, H.L.; Song, J.; Ni, Z.J.; Gao, Z.H. Selection of suitable inner reference genes for normalisation of microRNA expression response to abiotic stresses by qRT-PCR in leaves, flowers and young stems of peach. Sci. Hortic. 2014, 165, 281–287. [Google Scholar] [CrossRef]
  29. Liu, M.; Wu, Z.; Jiang, F.L. Selection and validation of garlic reference genes for quantitative real-time PCR normalization. Plant Cell Tissue Organ Cult. (PCTOC) 2015, 122, 435–444. [Google Scholar] [CrossRef]
  30. Zhou, X.H.; Liu, J.; Zhuang, Y. Selection of Appropriate Reference Genes in Solanum aculeatissimum for Quantitative Gene Expression Studies Under Different Experimental Conditions. Acta Hortic. Sin. 2014, 41, 1731–1738. [Google Scholar]
  31. Jia, Y.; Liu, S.C.; Zhao, J.; Chen, X.X.; Sun, L.X.; Yu, X.F.; Li, X. Reference gene selection and validation by qRT-PCR during flower development and in different organs of Primula forbesii. J. Hortic. Sci. Biotech. 2020, 95, 383–394. [Google Scholar] [CrossRef]
  32. da Silva, F.L.; Lucho, S.R.; Klumb, E.K.; Bianchi, V.J. Selection of reference genes and expression of key genes involved in response to short-term soil flooding stress in Prunus persica rootstock ‘Tsukuba 1’. Gene Rep. 2023, 33, 101843. [Google Scholar] [CrossRef]
  33. Yuan, X.Y.; Jiang, S.H.; Wang, M.F.; Ma, J.; Zhang, X.Y.; Cui, B. Evaluation of Internal Control for Gene Expression in Phalaenopsis by Quantitative Real-Time PCR. Appl. Biochem. Biotechnol. 2014, 173, 1431–1445. [Google Scholar] [CrossRef]
  34. Cao, L.Y.; Li, X.X.; Wang, D.; Sun, H.F.; Gao, J.P. Validation of reliable reference genes for accutrate for accurate normalization in qRT-PCR analysis of Codonopsis pilosula. Chin. Herbal. Med. 2017, 9, 226–235. [Google Scholar] [CrossRef]
  35. Lin, Y.; Liu, G.F.; Rao, Y.; Wang, B.; Tian, R.F.; Tan, Y.Y.; Peng, T. Identification and validation of reference genes for qRT-PCR analyses under different experimental conditions in Allium wallichii. J. Plant Physiol. 2023, 281, 153925. [Google Scholar] [CrossRef]
  36. Chen, Y.L.; Yuan, Y.T.; Qiu, Z.H.; Hong, W.J.; Mao, K.; Yao, C.C.; Liu, Z.D.; Wang, N.N. Identification of reference genes for RT-qPCR analysis across kiwifruit species under iron deficiency conditions. Sci. Hortic. 2023, 312, 111865. [Google Scholar] [CrossRef]
Figure 1. PCR amplification outcomes of 9 potential reference genes from A. venetum. The integrity of all RNA samples was verified using agarose gel electrophoresis with a concentration of 1.5% (w/v) (Figure S1).
Genes 15 00231 g001
Figure 2. Ct values for nine potential reference genes in all plantlet samples of A. venetum. The bigger the box, the greater the variation. The maximum and minimum Ct values are represented by whiskers, while the median values are indicated by a line across the box.
Genes 15 00231 g002
Figure 3. Candidate reference genes in various tissues of A. venetum using a Venn diagram. (A) Venn diagram of candidate reference genes in leaves of A. venetum; (B) Venn diagram of candidate reference genes in stems of A. venetum; (C) Venn diagram of candidate reference genes in roots of A. venetum.
Genes 15 00231 g003
Figure 4. Assessment of potential reference genes through pairwise comparison calculated by the geNorm software. The analysis involved comparing the normalization factors NFn and NFn + 1 in all tested conditions to determine their pairwise variation (Vn/Vn + 1).
Genes 15 00231 g004
Figure 5. Relative expression levels of P5CS, OAT, PHD, and GAD. (A) Expression level of P5CS, OAT, PHD, and GAD normalized by CYP and TUA in leaves. (B) Expression level of P5CS, OAT, PHD, and GAD normalized by PGK and PPP2R3 in stems. (C) Expression level of P5CS, OAT, PHD, and GAD normalized by TUA and EF-1α in roots. The error bars represent the mean of three biological replicates ± SD. Different letters show significant differences among gene expression levels normalized by two selected reference genes, individually and jointly (p < 0.05, Tukey’s test).
Genes 15 00231 g005
Table 1. The qRT-PCR primers of reference genes and the verification genes.
GeneGene NamePrimer Sequences (5′-3′)Amplicon Product
Length (bp)
Abbreviation (Forward/Reverse)
TUAα-tubulinF:CTTCTTCAGCGAAACTGGGTC;152
R:TGTTAGCGGCGTCTTCCTTT
TUBβ-tubulinF:GTGGTCGTTATGTCCCTCGTG;176
R:ATCAATCAACTCGGCACCCT
ACTActinF:TTATCATTACCTACACCACCTCC;135
R:TGTAAGACTGAAGCCATCTCG
CYPCyclophilinF:AGGGTGAAAAGGAAGATGAAG;206
R:GTACAACAAGTTCTGGGGTGATA
EF-1αElongation factor-1αF:TTGGAGGTATTGACAAGCGAGTA;252
R:TCAACACAGCACAATCAGCCTG
PPP2R2Encoding B/R2/PR55F:TTACATGACCCTTAAGTTATGGG;173
R:AGGAACCAGTTGCTACACGCA
PPP2R3Encoding B″/R3/PR72F:TTTCTTATTCGTCAGGAGCGT;129
R:CCAAACATCTGCACTTCCGT
PPP2R5Encoding B′/R5/PR61/B56F:CTTTCTTCCGTGATGTTCCAGTC;279
R:GGTCCACATTCTCAGACCCTGTA
PGK3-phosphoglycerat kinaseF:TGGCAGACAAGTTTGCTCCT;181
R:AAAAACTCCCATAGGTCCATT
P5CSΔ1-pyrroline-5-carboxylate
synthase
F:CTTCATCAATCCCAGAAAGAGTT;
R:ATGTCCAAGAACTGGAATTTTTGTG
173
OATOrnithine
δ-aminotransferase
F:GAAGTCCACCCTGATGTCGT
R:AAATGTGCTTCCATGCTCCC
126
PHDProline hydroxylaseF:TTTGATTATGTGCCGGAAGC
R:TCTTCGGACAACCATCTCG
242
GADGlutamic acid
decarboxylase
F:CAAGCAGACTGGATGGGATA
R:CAATGGCAACCTAAAGTCCC
106
Table 2. The ranking of gene expression stability for 9 potential reference genes across various tissues of A. venetum using geNorm, NormFinder, BestKeeper, and RefFinder.
TreatmentsgeNorm NormFinderBestkeeper RefFinder Rank
GeneStabilityGeneStabilityGeneCVSDGeneValue
LeafPGK0.057PPP2R50.052CYP0.040.17CYP1.411
CYP0.057CYP0.079PGK0.070.26TUA2.002
TUA0.092TUA0.080TUA0.070.28PGK2.513
PPP2R50.161PGK0.115PPP2R50.120.46PPP2R53.004
ACT0.198ACT0.124TUB0.180.59ACT4.955
TUB0.213TUB0.152ACT0.190.70TUB5.736
PPP2R30.220PPP2R30.175PPP2R30.190.70PPP2R37.007
PPP2R20.242PPP2R20.184PPP2R20.210.74PPP2R28.008
EF-1α0.289EF-1ɑ0.300EF-1α0.271.08EF-1α9.009
StemPGK0.027PPP2R30.009PPP2R50.000.02PPP2R31.411
PPP2R30.027PGK0.009PPP2R30.030.10PGK1.732
PPP2R50.037PPP2R50.010PGK0.050.20PPP2R52.063
CYP0.059ACT0.031CYP0.050.20CYP4.234
ACT0.088CYP0.048ACT0.070.27ACT4.735
PPP2R20.124PPP2R20.126PPP2R20.140.50PPP2R26.006
TUA0.159TUA0.198TUA0.190.76TUA7.007
EF-1α0.223EF-1α0.284TUB0.260.88EF-1α8.248
TUB0.271TUB0.289EF-1α0.281.05TUB8.749
RootEF-1α0.025CYP0.004ACT0.010.04ACT1.861
TUA0.025TUA0.008TUA0.020.06TUA2.112
ACT0.031EF-1α0.009EF-1α0.020.09EF-1α2.283
CYP0.047ACT0.011CYP0.040.17CYP2.384
PGK0.052PGK0.018PGK0.050.19PGK4.735
TUB0.080TUB0.102PPP2R50.110.43TUB6.246
PPP2R50.099PPP2R50.103TUB0.120.46PPP2R56.747
PPP2R20.119PPP2R20.121PPP2R20.120.43PPP2R28.008
PPP2R30.153PPP2R30.182PPP2R30.170.59PPP2R39.009
Disclaimer/Publisher’s Note: The statements, opinions and data contained in all publications are solely those of the individual author(s) and contributor(s) and not of MDPI and/or the editor(s). MDPI and/or the editor(s) disclaim responsibility for any injury to people or property resulting from any ideas, methods, instructions or products referred to in the content.

