Article

Transcriptome Analysis of Key Genes Involved in the Initiation of Spermatogonial Stem Cell Differentiation

Key Laboratory of Fertility Preservation and Maintenance of Ministry of Education, Key Laboratory of Reproduction and Genetics of Ningxia Hui Autonomous Region, School of Basic Medical Science, Ningxia Medical University, Yinchuan 750004, China
*
Author to whom correspondence should be addressed.
Genes 2024, 15(2), 141; https://doi.org/10.3390/genes15020141
Submission received: 25 November 2023 / Revised: 10 January 2024 / Accepted: 19 January 2024 / Published: 23 January 2024
(This article belongs to the Section Animal Genetics and Genomics)

Abstract

:
Purpose: The purpose of this study was to screen the genes and pathways that are involved in spermatogonia stem cell (SSC) differentiation regulation during the transition from Aundiff to A1. Methods: RNA sequencing was performed to screen differentially expressed genes at 1 d and 2 d after SSC differentiation culture. KEGG pathway enrichment and GO function analysis were performed to reveal the genes and pathways related to the initiation of early SSC differentiation. Results: The GO analysis showed that Rpl21, which regulates cell differentiation initiation, significantly increased after 1 day of SSC differentiation. The expressions of Fn1, Cd9, Fgf2, Itgb1, Epha2, Ctgf, Cttn, Timp2 and Fgfr1, which are related to promoting differentiation, were up-regulated after 2 days of SSC differentiation. The analysis of the KEGG pathway revealed that RNA transport is the most enriched pathway 1 day after SSC differentiation. Hspa2, which promotes the differentiation of male reproductive cells, and Cdkn2a, which participates in the cell cycle, were significantly up-regulated. The p53 pathway and MAPK pathway were the most enriched pathways 2 days after SSC differentiation. Cdkn1a, Hmga2, Thbs1 and Cdkn2a, microRNAs that promote cell differentiation, were also significantly up-regulated. Conclusions: RNA transport, the MAPK pathway and the p53 pathway may play vital roles in early SSC differentiation, and Rpl21, Fn1, Cd9, Fgf2, Itgb1, Epha2, Ctgf, Cttn, Timp2, Fgfr1, Hspa2, Cdkn2a, Cdkn1a, Hmga2 and Thbs1 are involved in the initiation of SSC differentiation. The findings of this study provide a reference for further revelations of the regulatory mechanism of SSC differentiation.

1. Introduction

Spermatogonial stem cells (SSCs), which are adult stem cells that can stably transmit genetic information to the next generation, are the foundation of spermatogenesis and male reproduction [1]. In mammalian spermatogenesis, the differentiation of SSCs into functional spermatozoa that fertilize the egg and ultimately produce offspring is a highly coordinated and dynamically evolving process [2]. Spermatogenesis is a continuous process that is divided into three main stages: mitosis of spermatogonia, meiosis of spermatocytes and metamorphosis of spermatocytes. The normal conduct of self-renewal and differentiation of SSCs can ensure the continuous production of large numbers of sperm throughout the reproductive life cycle, in which precise gene regulation is essential.
SSCs residing inside the basal lamina of the seminiferous tubules originate from primordial germ cells (PGCs). Asingle (As)-type SSCs are generally considered to be the least differentiated spermatogonocytes. Spermatogonia undergo incomplete cell division during differentiation. If an As spermatogonium divides into two and no intercellular bridges are produced, the division pattern is a symmetric self-renewal division, and they remain undifferentiated. Two As spermatogonia that produce intercellular bridges are referred to as Apr spermatogonia and subsequently produce Aaligned-4, Aaligned-8 and Aaligned-16 (Aal). Aal spermatogonia undergo ulteriorly differentiation to form A1, A2, A3, A4, intermediate (Int) and B spermatogonia before entering meiosis [3]. As, Apr, and Aal spermatogonia are called undifferentiated spermatogonia (Aundiff), while A1, A2, A3, A4, intermediate (Int) and B spermatogonia are called differentiated spermatogonia (Adiff). As spermatogonia are generally recognized as SSCs, and their number is extremely low in the entire adult testicular cell population, comprising only 0.03% of the total [4]. The ‘revised As model’ proposes that As spermatogonia maintain their numbers by undergoing complete cytokinesis [5]. During spermatogenesis, a subset of Aundiff becomes irreversible at a specific stage of the spermatogonium cycle, and differentiated spermatogonia cells are regulated by spermatogenic programs to undergo orderly mitosis [4,6]. In contrast, the ‘dynamic SSC model’, in which the fate of Aundiff cells is context-dependent and plastic, supports that Aundiff cells reversibly transition between differentiation-primed and self-renewing states based on the availability of niche-derived cues [7,8,9,10,11]. Due to the small number of SSCs, we cannot accurately identify the above two models, which has greatly hindered our understanding of SSC biology and the complexity of spermatogenesis.
Maintaining male fertility and maintaining a high enough level of spermatogenesis in the long term can be achieved only through a relative balance of various factors between different ecological niches, and these factors determine the fate of SSC development by promoting self-renewal, differentiation initiation or the spermatogenic commitment of undifferentiated spermatogonocytes (Aundiff). To become sensitive to a differentiation-inducing stimulus (RA), Aundiff need to exit the self-renewing state and perform differentiation priming [12,13]. The activation of the mTORC1 pathway is essential for the self-renewal and differentiation of SSCs [14,15,16,17]. Exiting from the GFRa1 positive state requires cell size growth and the induction of a transcriptional program typical of differentiation-primed undifferentiated spermatogonia or progenitors [12,15,16]. The WNT/β-catenin signaling pathway plays a key role in the initiation of differentiation, facilitating Aundiff’s transition from the self-renewing state upon perceiving the RA response [13,18,19,20]. It is generally considered that the induction of RAR in a subset of Aundiff gives cells the capacity to respond to RA [12,21,22]. RA is the inducer of differentiation in the germline, and to prevent a premature exit from the progenitor state that displays a latent self-renewal capacity, the enzyme CYP26B1, expressed by peritubulogenic myoid cells, degrades RA outside the tubule, preventing it from affecting the appropriate timing of spermatogenic initiation [23,24,25].
During the transition from Aal to A1 spermatogonia, the morphology and mitotic behavior of spermatogonial cells change irreversibly. This transformation is controlled by at least one external factor, the RA, and multiple intrinsic factors [26,27]. RA is required early on for the differentiation of the Aal-to-A1 transition and then again for mature spermatid release. The RA-induced differentiation of spermatogonia occurs specifically during stages VII-VIII of the mouse seminiferous epithelial cycle [6]. Due to the effect of the RA, the Aundiff subpopulation of RAR-positive cells will transform into A1-differentiated spermatogonocytes, especially in stages VII-VIII, and at this time, they begin to express KIT, STRA 8 and other markers of spermatogenic differentiation [12,28,29,30]. Stra8 is a gene that is stimulated by RA to initiate meiosis. c-Kit expression is activated in mouse differentiated SSCs cultured in vitro [31]. SCF is produced by supporting cells and activates the phosphoinositoI3 kinase (PI3-K) signaling pathway by binding to c-Kit receptor tyrosine kinase to control cell growth, proliferation and differentiation. SCF was shown to improve the in vitro differentiation of SSCs by up-regulating differentiation genes (PRTM1, STRA8, c-KIT, PIWIL2) in OA rats [32]. The widely expressed growth factor activin A plays an important regulatory role in the fetus and testes, and its production and action are strictly controlled [33]. Activin A governs the development and proliferation of both germ and somatic cells during fetal life. In vitro studies have shown that activin A supports the differentiation of mouse and human SSCs [34,35]. Bone morphogenetic protein 4 (BMP4), belonging to the transforming growth factor-β(TGF-β) family, plays an essential role in spermatogenesis. BMP4 stimulates the differentiation of SSCs by up-regulating the transcription factor sohlh2 [36].
In recent years, research in this area has been committed to reproducing the entire process of spermatogenesis in vitro, which will hopefully present a solution to infertility in patients with azoospermia. The growth and development of SSCs, which serve as the basis for the entire process of spermatogenesis, are crucial aspects in reproducing this process. With the advancements in stem cell technology, the system of in vitro-induced differentiation culture has been further improved by adding growth factors or inducing a high expression of related genes, and then co-culturing with testicular somatic cells, among other methods [37,38,39]. Min Sun established a three-dimensional induction system to induce the differentiation of human SSCs into functional spermatozoa in vitro [40]. Peng Wang isolated SSCs from mouse testes and differentiated them into haploid male germ cells via RA induction [41]. However, the complex mechanism of the transition of SSCs to A1 spermatogonia is not fully understood, and the genes and pathways involved in the regulation of RA differentiation during this transition are still unknown. Therefore, in this study, we established an in vitro early differentiation culture system for SSCs and analyzed the key regulatory genes and signaling pathways during the transition of SSC to A1. The results of this study provide a reference for better understanding the pathogenesis of patients with transformation failure of Aundiff into Adiff spermatogonocytes.

2. Materials and Methods

2.1. SSC Self-Renewal and Differentiation Culture

CD1+ SSCs were donated by Professor Ji Wu from Shanghai Jiao Tong University [42]. The medium for the self-renewal of SSCs was the same as used in the previous work of our lab. To be specific, SSCs were inoculated on feeder-layer Sandos inbred mouse (SIM)-derived 6-thioguanine- and ouabain-resistant (STO) embryonic fibroblast cells treated with mitomycin (M0503, Sigma, St Louis, MO, USA) [39]. The SSCs were cultured in Minimum Essential Medium α(MEM-α, 12571-063, Gibco, Grand Island, NY, USA) containing 10% fetal bovine serum (FBS) (16000-36, Gibco, Grand Island, NY, USA), 2mM glutamine (G7012, Sigma, St Louis, MO, USA), 1× nonessential amino acid (NEAA, 11140-050, Gibco, Grand Island, NY, USA) solution, 0.5× pen/strep (15240-062, Invitrogen, Grand Island, NY, USA), 1× β-mercaptoethanol (β-ME, M3148, Sigma, St Louis, MO, USA), 100 μg/mL transferrin (T1428, Sigma, MO, USA), 25 μg/mL insulin (I1882, Sigma, St Louis, MO, USA), 60 ng/mL progesterone (P8783, Sigma, MO, USA), 60 μM putrescine (P5780, Sigma, St Louis, MO, USA) and 8 ng/mL basic fibroblast growth factor (bFGF, F0291, Sigma, St Louis, MO, USA) and grown in a humidified atmosphere in an incubator with 5% CO2 at 37 °C. For the differentiation culture, stem cells were cultured in differentiation medium at a constant 34 °C with 5% CO2 [43]. The differentiation culture medium was prepared by adding differentiation factor SCF (100 ng/mL, R&D Systems, Minnneapolis, MN, USA), BMP4 (20 ng/mL, R&D Systems, Minnneapolis, MN, USA), RA (10−6 M, Sigma, MO, USA) and activin A (100 ng/mL, R&D Systems, Minnneapolis, MN, USA) on the basis of the self-renewal culture medium [44].
In order to simulate the optimal temperature for sperm generation in vivo, we cultured SSCs in an incubator at 34 °C. Factors that promote SSC differentiation, namely SCF, BMP4, RA and activin A, were added into the differentiation medium. Previous studies have shown that Stra8 expression increases significantly 24 h after differentiation induced by RA and BMP4 [45,46]. Thus, we selected SSCs after 1 d and 2 d of induction for RNA sequencing analysis.

2.2. Quantitative Real-Time PCR

Quantitative real-time PCR (qPCR) was used to detect the differentiation genes of SSCs. The primers were synthesized by Sango biotech (Shanghai, China) Co., Ltd.: GAPDH, Forward: AACGGATTTGGCCGTATTGG, Reverse: CATTCTCGGCCTTGACTGTG; ID4, Forward: TGCAGTGCGATATGAACGAC, Reverse: GCAGGATCTCCACTTTGCTG; Thy-1, Forward: GCTCTCCTGCTCTCAGTCTT, Reverse: GCTGAACTCATGCTGGATGG; c-kit, Forward: GGGACACATTTACGGTGGTG, Reverse: GCTTTACCTGGGCTATGTGC; Stra8, Forward: TTGACGTGGCAAGTTTCCTG, Reverse: GGGCTCTGGTTCCTGGT TTA; Rec8, Forward: CCCGCTTCTCCCTCTATCTC, Reverse: CGATGTAGGT GCTCCAGGAT; Sycp3, Forward: CCAATCAGCAGAGAGCTTGG, Reverse: CC TCGAAGCATCTGAGGAAA; Ovol1, Forward: TGTCTTACAGGCAGAGCACA, Reverse: GGCCTGTCTCTGTAAGTGGT. Tip Green qPCR SuperMix (Q311-02, Vazyme Biotech, Nanjing, China) was used to detect the differentiated genes in accordance with the instructions. The 2−ΔΔCT methods were adopted for data analysis.

2.3. RNA Sequencing and GO and KEGG Enrichment Analyses

Illumina sequencing was performed on different libraries after qualified library inspection. The basic principle of sequencing was Sequencing by Synthesis. Four fluorescently labeled dNTPs, DNA polymerase and adaptor primers were added to the sequenced flow cell for amplification. When cDNA is used as a template and primers and dNTPs are used for PCR amplification, fluorescent dyes or probes are added to the reaction system. These fluorescent molecules can be combined with the amplified sequence, and the fluorescence signal intensity can then be monitored in real time using a fluorescence quantitative PCR instrument (qPCR). The light signal is converted into sequencing peaks using computer software. The sequence information of the fragment to be tested was thus obtained.
ClusterProfiler software was used for GO functional enrichment analysis and KEGG pathway enrichment analysis. All enriched differentially expressed genes (DEGs) were mapped to terms in the GO database and KEGG database.

2.4. Statistics

Data were recorded in the form of mean ± standard error of the mean. One-way ANOVA was utilized to probe the discrepancies between different groups, and all analyses with a p-value < 0.05 or 0.01 were deemed to be significant.

3. Results

3.1. Establishment of SSCs in In Vitro Differentiation Culture System

In order to investigate the transcriptomic differences of spermatogonial stem cells during the initiation of their differentiation, we established an in vitro SSC differentiation culture system to avoid the limitations of the small number and asynchronous development of spermatogonial stem cells in vivo. The results show that the differentiated SSCs cultured at 34 °C showed obvious colony-like growth on the second day of culture in the differentiation media supplemented with SCF, BMP4, RA and activin A (Figure 1A). The expression of undifferentiated spermatogonial marker genes Id4 and Thy-1 was inhibited from the first day after differentiation culture, and the expression of spermatogonial differentiation marker gene c-kit was up-regulated. Except for Rec8, the expression of genes involved in meiosis, namely Stra8, Sycp3 and Ovol1 showed no significant change on the first day of differentiation, but the expressions of all indicators were significantly up-regulated on the second day of differentiation culture. (Figure 1B). Together, the above results verify that the SSC differentiation system was successfully established.

3.2. Analysis of Differentially Expressed Genes after Differentiation Culture

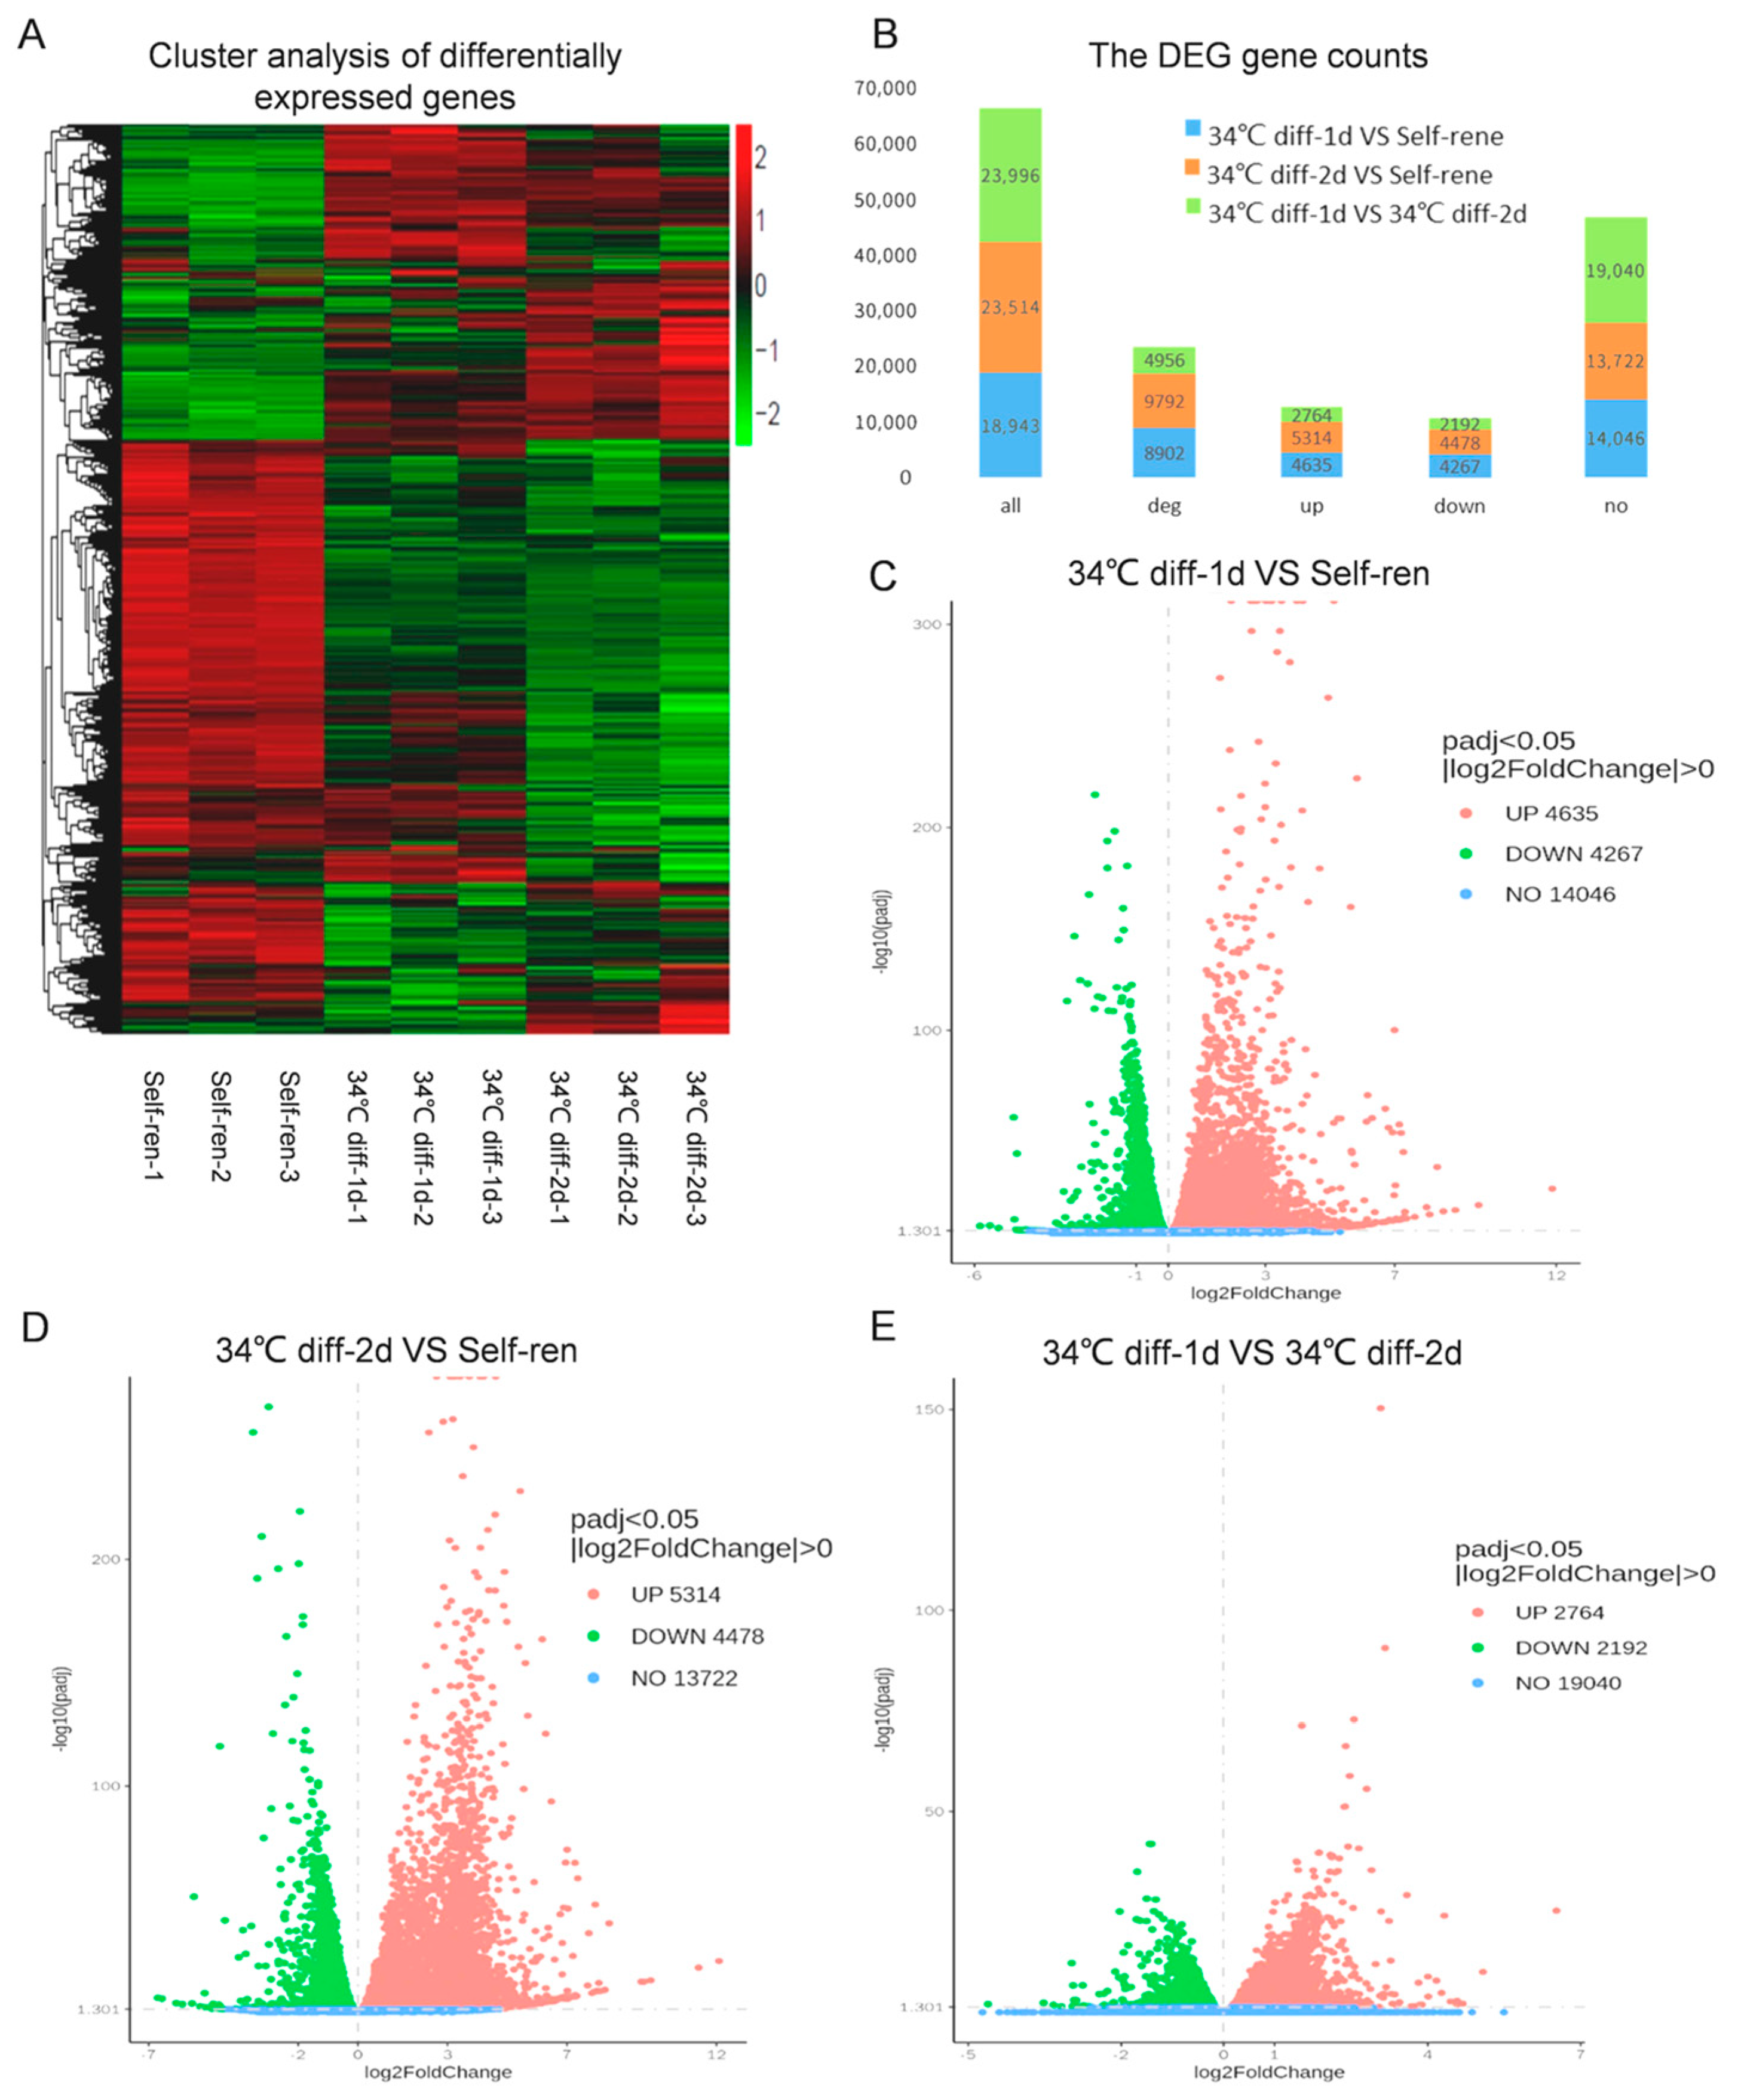
To investigate transcriptome expression changes after initiation of SSC differentiation, RNA-Seq analysis was performed on the SSCs 1 and 2 days after in vitro differentiation. Cluster analysis was conducted on the differential gene set (Figure 2A, where the red represents highly expressed genes, and the green represents a relatively low expression of genes). The expression patterns of the three repeated samples in the self-continuation group, 34 °C diff-1d group and 34 °C diff-2d group were similar, and the expression differences were obvious among the self-continuation group, 34 °C diff-1d group and 34 °C diff-2d group (Figure 2A). The total number of genes identified in the self-ren group vs. 34 °C diff-1d group, self-ren group vs. 34 °C diff-2d group and 34 °C diff-1d group vs. 34 °C diff-2d group were 18,943, 23,514 and 23,996, respectively (Figure 2B). Compared with the self-renewal group, we found that the expression of 8902 genes changed significantly (two-fold difference between two stages with an FDR less than 0.05) after 1 day of differentiation culture, among which, 4635 were significantly up-regulated and 4267 were down-regulated in the 37 °C self-renewal group (Figure 2B,C). Moreover, 9792 genes had significantly changed expressions (two-fold difference between two stages with an FDR less than 0.05) after 2 days of differentiation culture, among which, 5314 were significantly up-regulated and 4478 were down-regulated in the self-ren group (Figure 2B,D). In the 34 °C diff-1d group, 4956 gene expressions changed significantly (two-fold difference between two stages with an FDR less than 0.05) after 2 days of differentiation culture, among which, 2764 were significantly up-regulated and 21,192 were down-regulated in the self-ren group (Figure 2B,E).

3.3. Gene Ontology (GO) Analysis of the Differentially Expressed Genes

The dynamic processes of the DEGs obtained from RNA-Seq during SSC differentiation were analyzed via GO from three aspects: biological process (BP), cell component (CC) and molecular function (MF).
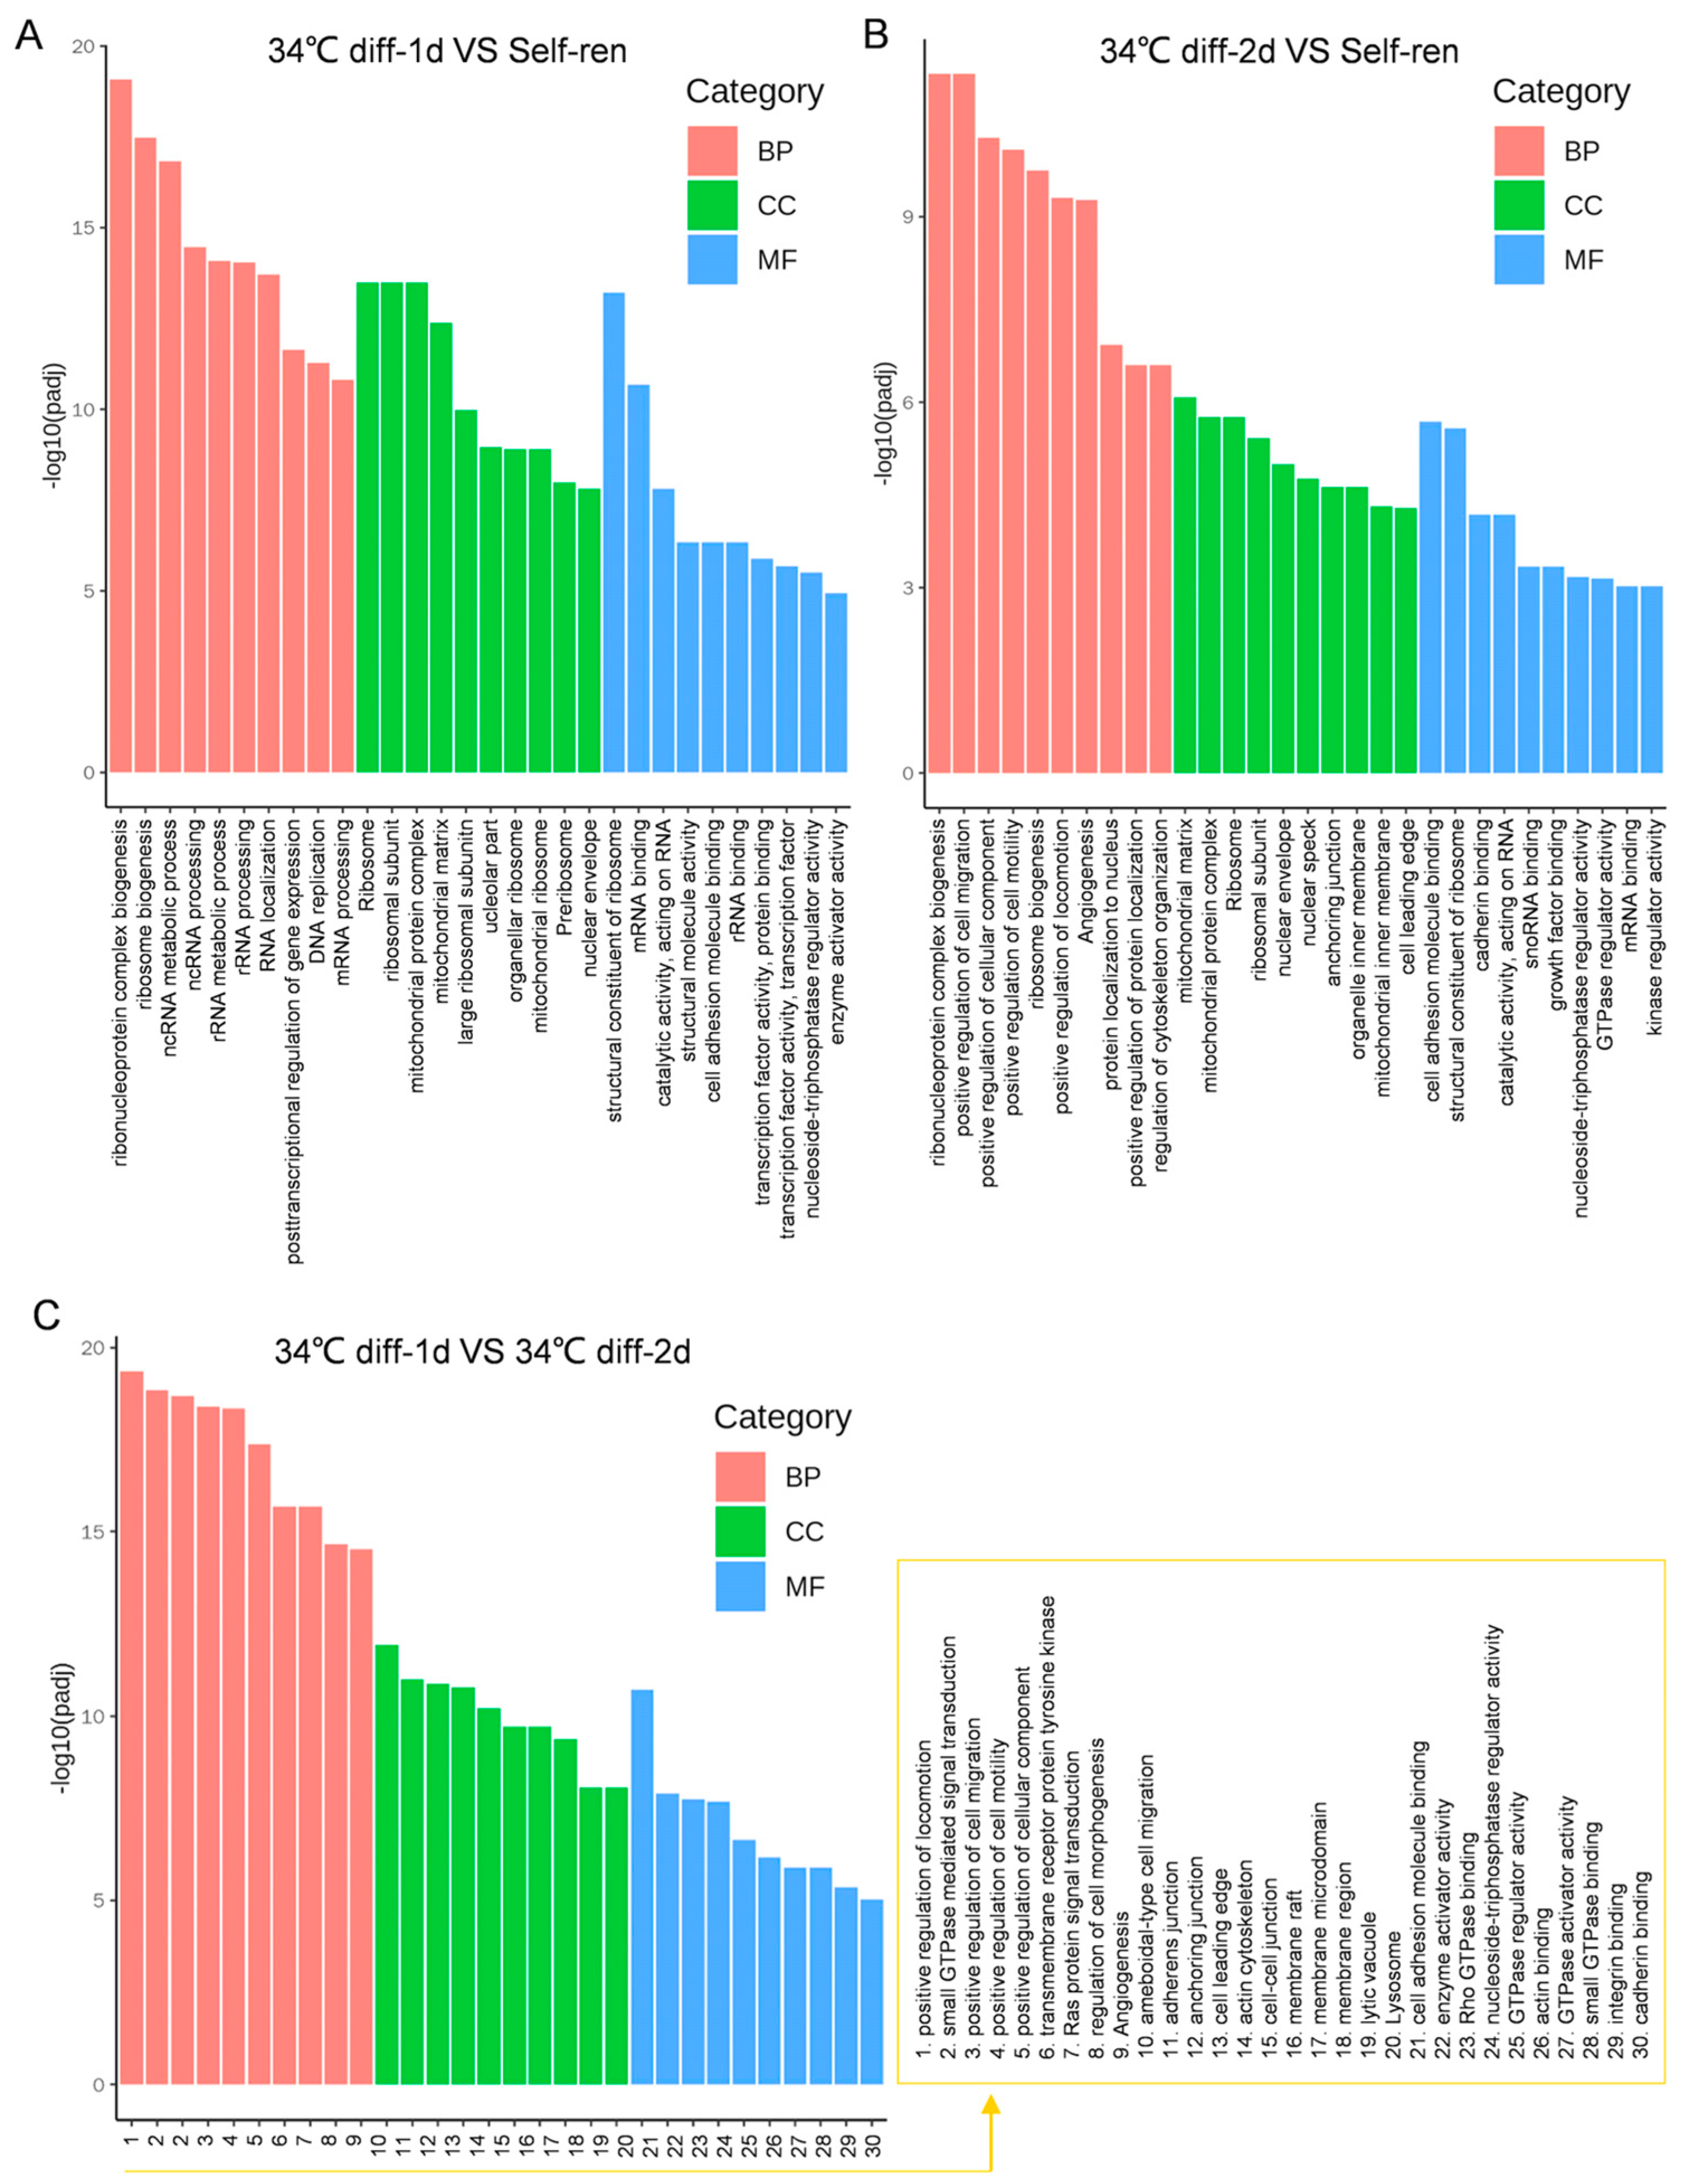
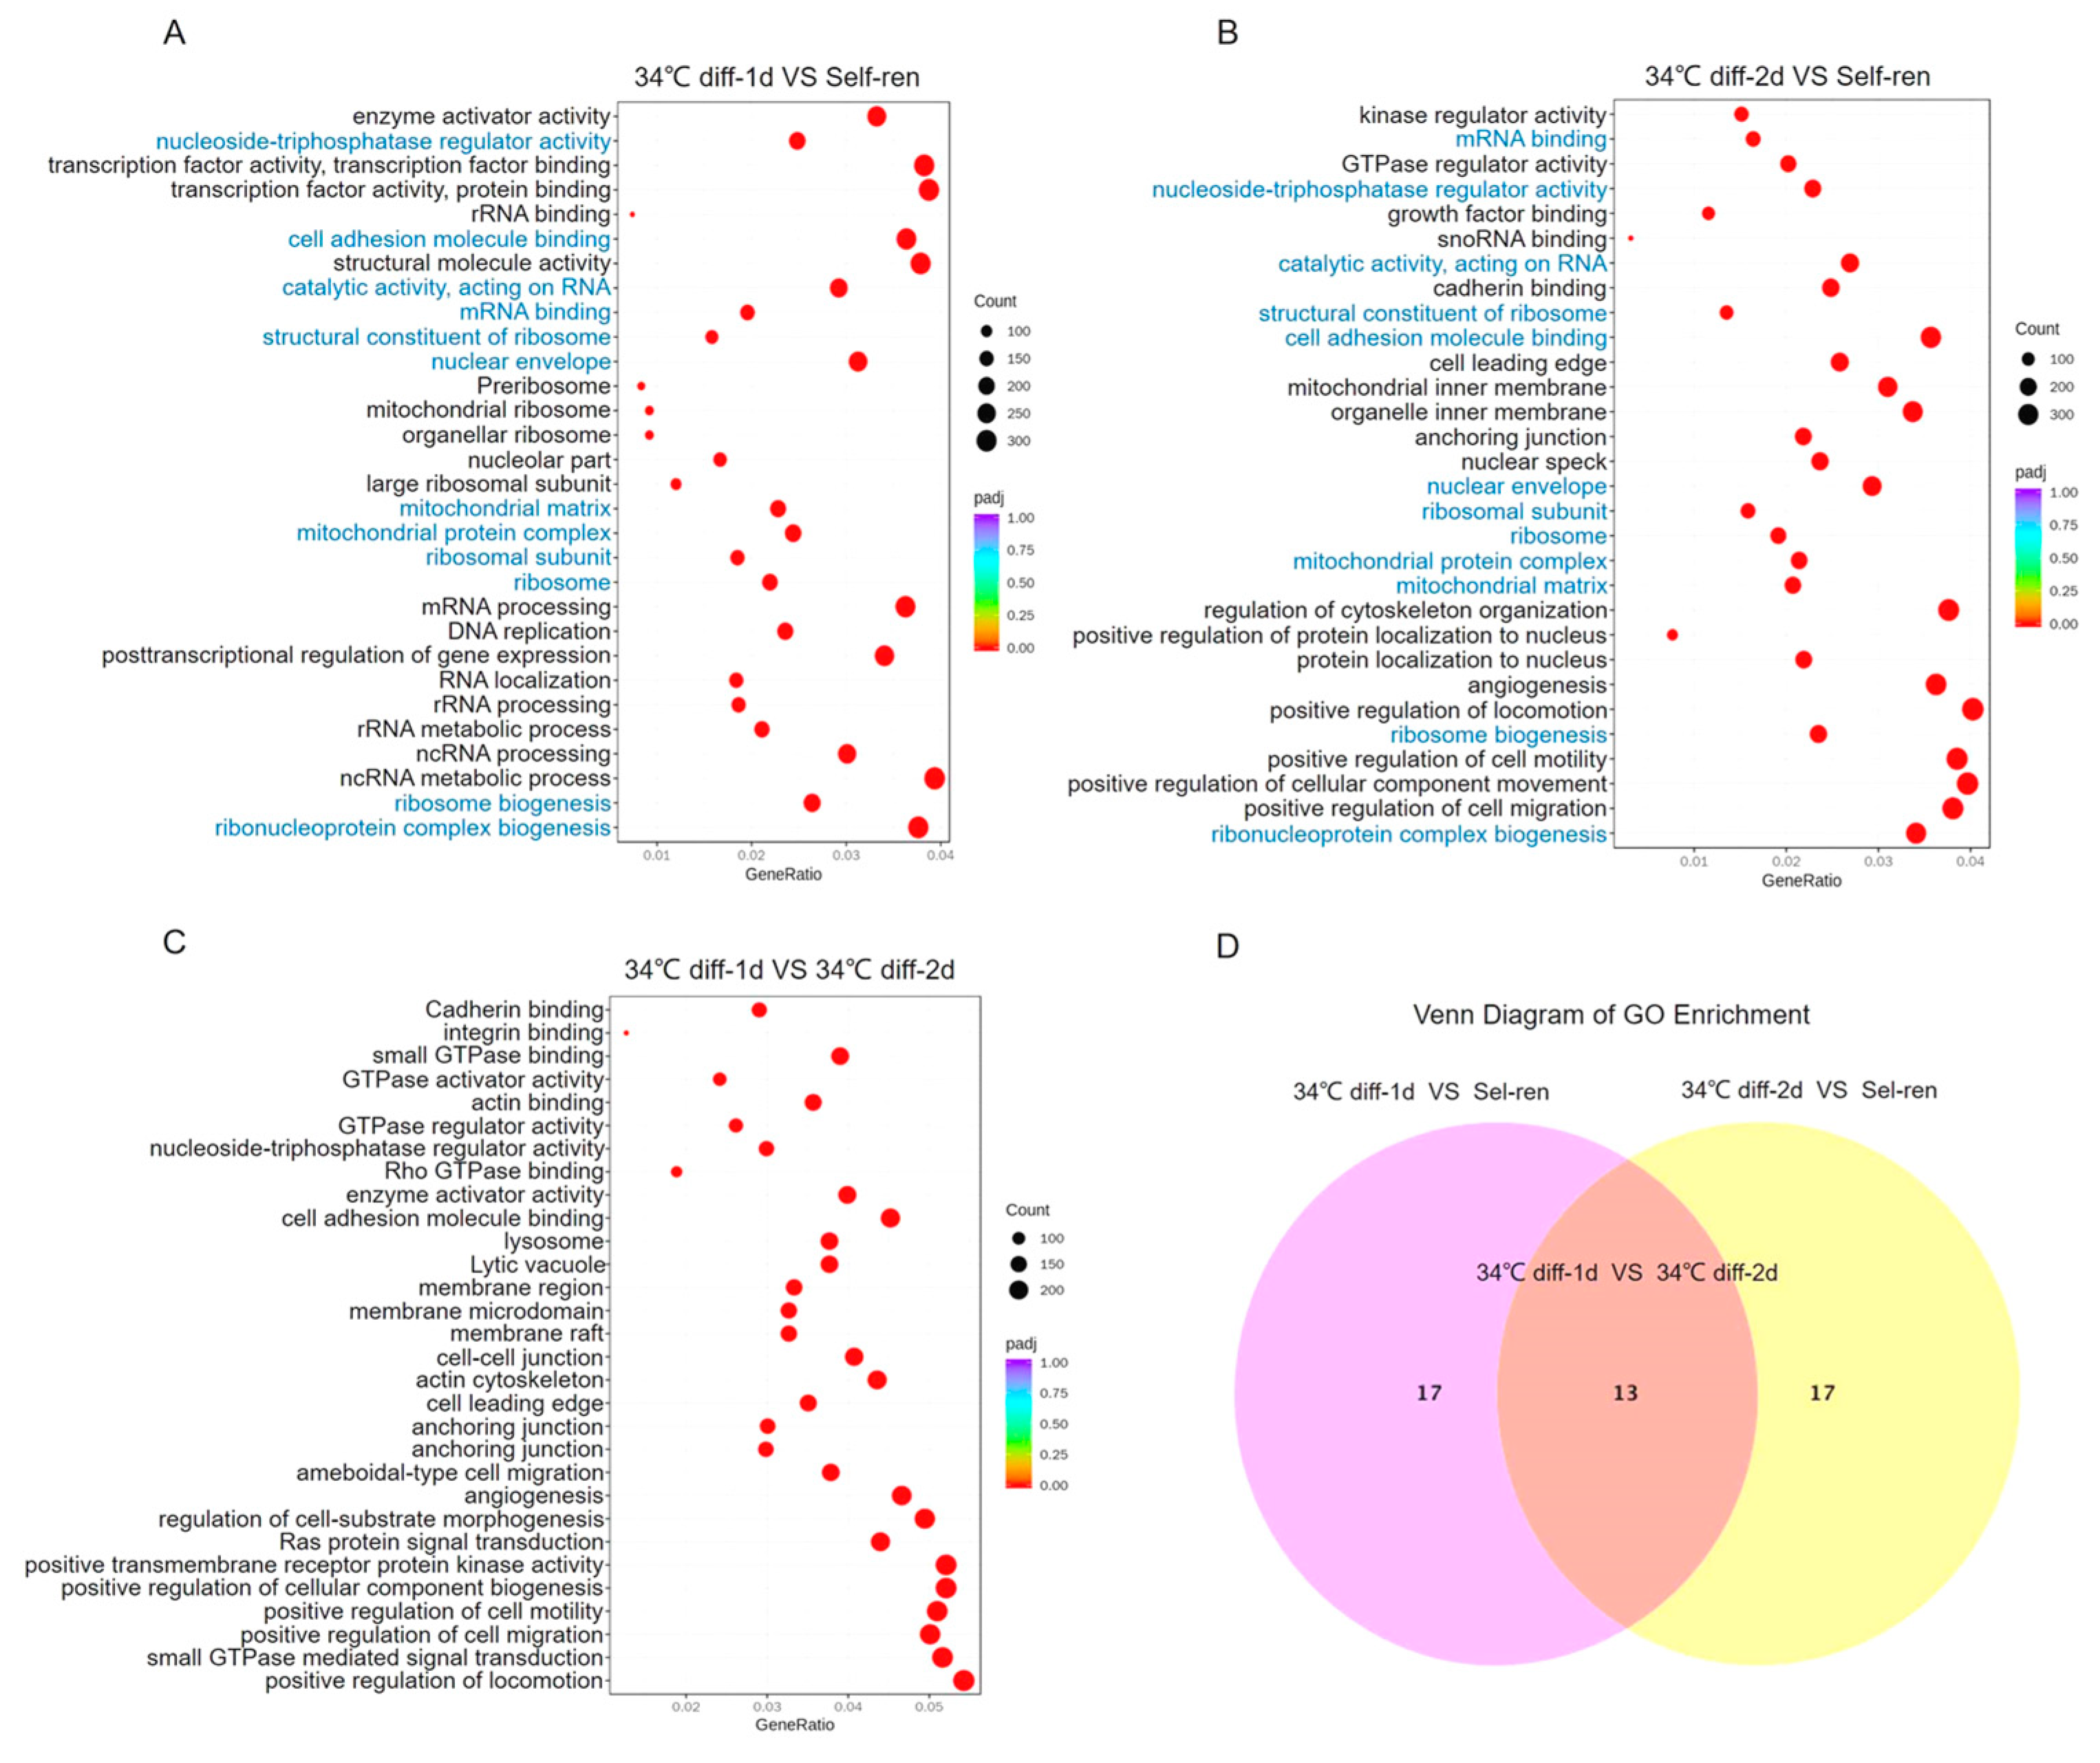
Compared with self-renewing SSCs, the BP items with the highest enrichment after 1 day of SSC differentiation included ribonucleoprotein complex biogenesis, ribosome biogenesis and ncRNA metabolic processes (Figure 3A and Figure 4A). Some up-regulated genes participated in the increase in metabolism, including Cdkn2a, Mrpl10, Rnasel, Rpsa and Ago4 (Table 1). Ribosomes and ribosome subunits are enriched in CC terms (Figure 3A and Figure 4A). The expressions of Rbm3, Lcmt2 and Hsd17b10 genes related to protein synthesis are significantly up-regulated (Table 1). The most enriched MF terms are structural constituents of ribosome and mRNA binding (Figure 3A and Figure 4A). Rpl21, which regulates cell differentiation initiation, significantly increased (Table 1).
Compared with self-renewing SSCs, the BP terms with the highest enrichment after 2 days of SSC differentiation were ribonucleoprotein complex biogenesis and the positive regulation of cell migration (Figure 3B and Figure 4B). The Anxa1 gene, which promotes differentiation, and the Eif2a gene, which promotes cell development, were significantly up-regulated (Table 2). The mitochondrial matrix is mainly enriched in the CC term (Figure 3B and Figure 4B). Cell adhesion molecule binding was enriched in the MF term (Figure 3B and Figure 4B). The expressions of Fn1, Cttn, Timp2 and Fgfr1, which are related to promoting differentiation, were up-regulated. The Venn diagram in Figure 4C shows 12 signaling pathways co-enriched on the first and second day of SSC differentiation, including ribonucleoprotein complex biogenesis and ribosome biogenesis, etc.
A GO enrichment analysis of the DEGs was performed on the second day of SSC differentiation, and the results were compared with those from the first day of differentiation, and the top 30 GO pathways were screened out (Figure 3C and Figure 4D). The results showed that BP terminology mainly focused on the positive regulation of motor, small GTPase-mediated signal transduction and the positive regulation of cell migration. Adhesion junction was mainly enriched in the CC terms. Genes related to promoting differentiation, including Jag1, Afap1, Itgb1, Itgav, Tns3, etc. were significantly up-regulated (Table 3). The most enriched MF term was cell adhesion molecule binding. Genes related to promoting differentiation, including Fn1, Cd9, Fgf2, Itgb1, Epha2, Ctgf, etc., were also significantly up-regulated (Table 3).

3.4. Kyoto Encyclopedia of Genes and Genomes (KEGG) Analysis of the Differentially Expressed Genes

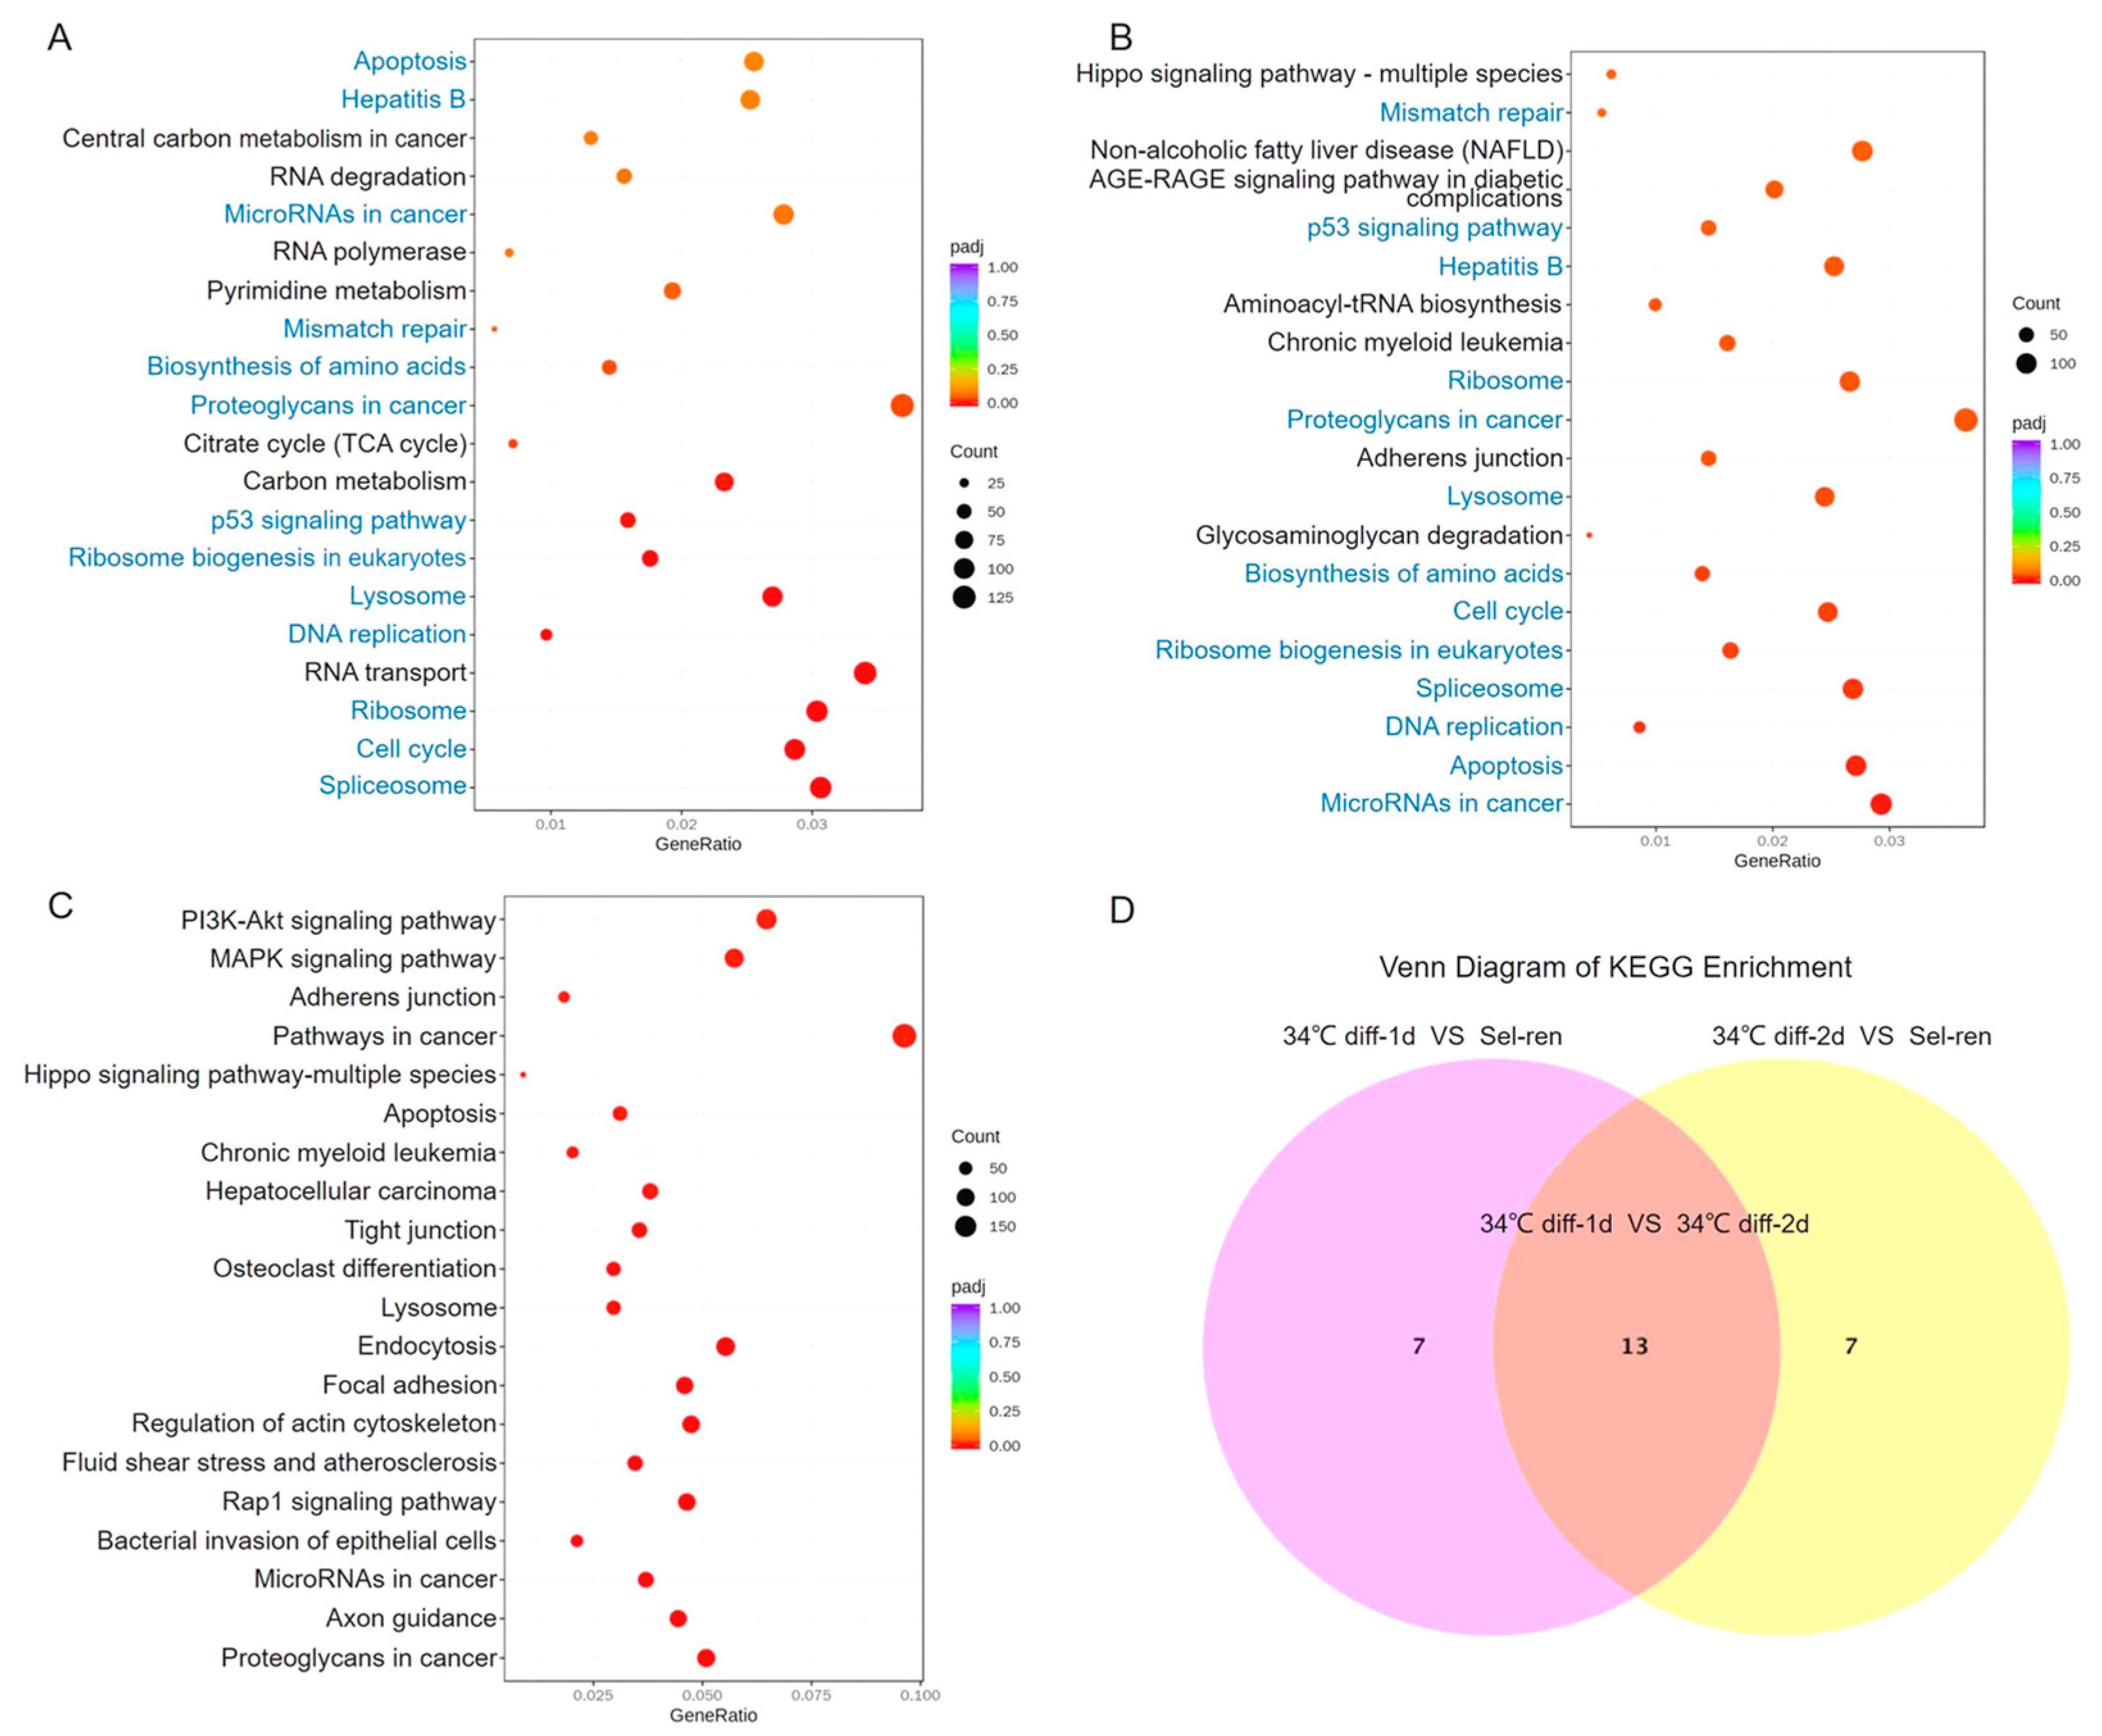
The KEGG database was used to evaluate the enrichment of the DEGs in order to identify the most significantly enriched pathways and then determine whether genes related to SSC differentiation participate in those specific pathways. Compared with the self-renewal culture, the top 20 KEGG pathways after 1 d of induced differentiation culture are shown in Figure 5A. According to the enrichment results, ribosome, cell cycle, spliceosome, apoptosis and RNA transport are the most enriched pathways. Among them, Ncbp1, which mediates RNA in the spliceosome pathway; Hspa2, which promotes the differentiation of male reproductive cells; and Cdkn2a, which participates in the cell cycle, were significantly up-regulated (Table 4), indicating strong cell metabolism.
The 2 d of induced differentiation culture group was enriched for the top 20 KEGG pathways compared to the self-renewal group, as shown in Figure 5B. The study revealed that the apoptosis, spliceosome and p53 pathways were the most enriched pathways. Among them, the expressions of Cdkn1a, Hmga2, Thbs1 and Cdkn2a in MicroRNAs that promote cell differentiation in cancer pathways increased (Table 5), indicating that the differentiation of SSCs is dominant.
The Venn diagram in Figure 5D shows 13 signaling pathways co-enriched on the first and second day of induced differentiation, including the p53 signaling pathway, spliceosome pathway, etc. The expressions of downstream genes Thbs1, Rrm2b, Ccnd1, Cdkn1a and Mdm2 of the p53 signaling pathway were up-regulated. KEGG enrichment analysis was performed on differentially expressed genes on the second day of differentiation taking the first day of differentiation as the control, and the top 20 KEGG pathways were screened out (Figure 5C). The PI3K-Akt pathway, MAPK signaling pathway and proteoglycans in cancer were the most enriched pathways. Among them, Map2k1, Kras, Pak1, Akt3 and Fgf2 were up-regulated (Table 6), and Map2k1, Kras, Pak1, Akt3 and Fgf2 were up-regulated (Table 6), suggesting that the MAPK signaling pathway may regulate SSC differentiation.

4. Discussion

SSCs account for just 0.02–0.03% of all testicular germ cells, and SSCs in testicular tissues are affected by many factors, such as Sertoli cells, spermatogenic cells at all levels and the testicular microenvironment [47]. The differentiation of SSCs is an extremely complex process involving the interaction of multiple genes and the regulation of signaling pathways. It is difficult to study spermatogonial stem cell differentiation in vivo. Therefore, we used in vitro-cultured SSCs to find the genes and pathways involved in the regulation of RA differentiation during the transition from Aundiff to A1.
The cell morphology was observed on the first and second days to be progressing in a colony-like manner in this study, which is consistent with the previously reported morphology of stem cells after induced differentiation [48]. Subsequently, we found that the expressions of the SSC-specific marker genes Thy-1 and Id4 decreased, while the differentiated spermatogonial cell-specific marker gene c-kit, meiosis-initiating gene Stra8, meiosis-specific gene Rec8 and primary spermatocyte-specific marker gene Sycp3 were all up-regulated, and the effect was more pronounced on the second day of induced differentiation. Above all, these results indicate that the induced SSC differentiation system was established successfully. SSCs have a key gene, SCF, which contributes to the homeostasis of self-renewal and differentiation and plays a key role in binding with c-kit [49]. Activin A is essential for the growth and maturation of spermatogonial stem cells [50], and activin A is a cytokine widely used in the differentiation of stem cells in vitro [51,52,53]. We can further study the differentiation process of SSCs in vitro by using the above culture system. In this study, we compared and analyzed RNA-seq data from the self-renewal group and the induced differentiation system on day 1 and day 2 to understand the regulatory mechanism of SSC differentiation initiation. RNA-seq, a high-throughput sequencing technology, can be applied to investigate, characterize and quantify the transcriptome. Transcriptome sequencing technology is widely used in basic medical research, clinical diagnosis and drug development because of its ability to quickly and comprehensively detect specific cells in the specific tissues of a certain species [54]. RNA-seq technology can accurately detect the mRNA involved in the initiation of SSC differentiation. The GO enrichment analysis in our study found that differentiation-promoting genes Jag1, Afap1, Itgb1, Itgav, Tns3, Fn1, Cd9, Fgf2, Itgb1, Epha2 and Ctgf were significantly up-regulated. Notch’s ligand Jag1 has been reported to possibly stimulate the differentiation of stem cells [55]. When human mesenchymal stem cells differentiate into cartilage, Itgb1 activates the ERK signaling pathway [56]. Tns3 mediates the excitation of ITGβ1 to irritate the differentiation of MSCs [57]. Fn1 facilitates the differentiation of osteocyte by activating the TGF-β/PI3K/Akt pathway [58]. Cd9 mediates the activation of the PI3K/Akt pathway to accelerate the differentiation of keratinocyte [59]. In summary, these genes are essential for the differentiation of spermatogonial stem cells, suggesting that we should pay close attention to their regulatory role in the differentiation of SSCs.
KEGG analysis showed that the p53 pathway and MAPK pathway were the most enriched pathways 2 days after SSC differentiation. The MAPK pathway is integral for eukaryotic cell growth and proliferation by transducing extracellular signals into the inside, causing intracellular responses [45]. At present, the MAPK pathway has been found to be reflected in a variety of cell differentiation processes. Lian-mei Zhao [46] demonstrated that the activation of the p38-MAPK pathway can promote the differentiation of melanoma cells. Peng Zhang [49] found that the differentiation of bone marrow mesenchymal stem cells is mediated by the p38-MAPK pathway. Yeon-Jeong Jang [50] found that the MAPK and ERK/JNK pathways inhibit the differentiation of adipocytes by regulating the expression of PPAR+ and C/EBP. Tilo Kunath [51] found that the Ras-Mek-Erk pathway, a downstream signaling pathway of MAPK, plays an essential role in the process of differentiation of mouse embryonic stem cells. We investigated whether the MAPK signaling pathway is involved in the regulation of the differentiation of SSCs cultured in vitro. Transcriptome sequencing revealed that the expression of Rbm3, which is associated with protein synthesis, was significantly up-regulated 1 day after SSC differentiation compared to self-renewing SSCs. RNA-binding motif protein 3 (RBM3) is a specific cold shock protein, a member of the RNA-binding protein family, and is rapidly up-regulated at low temperatures and low oxygen [60,61]. It has been shown that the expression of RBM 3 is essential for the orderly progression of some cell cycles and the onset of mitosis [62]. RBM3 is able to stimulate osteoblast differentiation through the ERK signaling pathway, and it also regulates the expression of mitogen-activated protein kinase (MAPK) [63]. In addition, we found that Vegfa, Akt3, Fgf2, Met, Egfr and Igf1r were significantly up-regulated in the MAPK pathway of differentiated SSCs induced after 2 d compared with after 1 d through transcriptome sequencing. MAP2K1, the ERK kinase gene responsible for encoding ERK kinase activation, is an essential component of MAP kinase transduction [53]. Studies show that MAP2K1 is vital for the development of embryonic ectoderm. Vickram Bissonauth [52] reported that MAP2K1 deficiency can lead to mouse embryonic death. MAP2K1ip1 is a MAP2K1 interacting protein that promotes the differentiation of embryonic stem cells through the activation of the Ras-Mek-Erk pathway [64]. However, the mechanism behind promoting the differentiation of SSCs needs further study. As early as 2011, it was discovered that vascular endothelial growth factor A (Vegfa) can promote the differentiation of SSCs cultured in vitro [65], which is consistent with our sequencing results. One of the signaling pathways of human embryonic stem cell differentiation is facilitated by FGF2 through the activation of the MEK-ERK pathway [66]. In our sequencing results, the expression of Fgf2 was notably up-regulated, so we speculate it may have a vital function in promoting the differentiation of SSCs.
RNA sequencing demonstrated that the p53 pathway was enriched in differentiated SSCs induced after 1 d and 2 d. It was reported that p53 regulates self-renewal, differentiation, autophagy and other normal life activities [67]. Studies show that p53 promotes the differentiation of human embryonic stem cells by regulating the cell cycle and microRNA and can stimulate mouse embryonic stem cells to differentiate into embryoid bodies [68,69]. During the differentiation of normal erythrocyte, p53 promotes differentiation through ribosomal biogenesis [70]. By sequencing differentiated SSCs induced after 1 d and 2 d, we observed that the expressions of Thbs1, Rrm2b, Ccnd1, Cdkn1a, Mdm2, etc. of p53 downstream molecules were up-regulated.
MDM2, the strongest p53-negative regulator discovered so far, can bind to the p53 protein and exert corresponding biological regulation [71]. Many studies show that MDM2 promotes the self-renewal and differentiation of mouse and human airway epithelial basal stem cells by regulating p53 protein and induces cell cycle arrest and apoptosis [72], which implies that MDM2 may regulate the differentiation and self-renewal of SSCs through the activated p53 pathway. The CDKN1a (cyclin-dependent kinase inhibitor 1a)-encoding p21 protein executes a negative regulatory function on the cell cycle by stopping the cell cycle in the G1 phase [73]. As an important downstream target gene of p53, p21 is actively involved in the growth and development of spermatogonial stem cells. Studies indicate that in acute myeloid leukemia, lncRNA HOTAIR promotes myeloid differentiation by up-regulating p21 [74]. However, whether CDKN1a promotes the differentiation of SSCs requires further verification. CCND1 is a cyclin that mainly regulates the cell cycle transition from the pre-DNA synthesis phase (G1 phase) to the DNA synthesis phase (S phase), promoting cell proliferation and differentiation [75]. The abnormal expression of CCND1 is related to the occurrence and development of various tumors [76]. Studies show that inhibiting autophagy by silencing CCND1 in turn inhibits the differentiation of liver cancer [77]. However, whether CCND1 promotes the differentiation of SSCs through autophagy requires further research.
Male infertility has always been an important issue in the field of reproductive health research. Obtaining mature and functional sperm through in vitro culture is the key to achieving effective treatment, especially for azoospermia patients. SSCs are crucial as the basis for the entire spermatogenesis process. Therefore, in this study, we constructed an early in vitro differentiation system for SSCs, and identified some key regulators and signaling pathways for self-renewal and differentiation during the transition from SSCs to A1 spermatogonial cells using RNA-seq analysis. This will provide a new perspective for patients whose Audiff to Adiff spermatogonial differentiation has failed.

5. Conclusions

The RNA transport, MAPK pathway and p53 pathway may play vital roles in early SSC differentiation, and Rpl21, Fn1, Cd9, Fgf2, Itgb1, Epha2, Ctgf, Cttn, Timp2, Fgfr1, Hspa2, Cdkn2a, Cdkn1a, Hmga2 and Thbs1 are involved in the initiation of SSC differentiation, which provide a reference for further revelations of the regulatory mechanism of SSC differentiation.

Author Contributions

X.L., P.Y., H.L. and W.G. were responsible for the experiments, data analysis and editing of the manuscript. H.J. participated in the design of the study and edited the manuscript. W.M. contributed to the conception, supervision and editing of the manuscript. All authors have read and agreed to the published version of the manuscript.

Funding

This work was supported by the Key Research and Development Program of the Ningxia Hui Autonomous Region (2021BEG02029) and National Natural Science Foundation of China (82260634).

Institutional Review Board Statement

The experiments using mice were approved by the ethics committee of Ningxia Medical University, and all animal care and experiments were carried out in accordance with the institutional ethical guidelines for animal experiments.

Informed Consent Statement

Not applicable.

Data Availability Statement

The datasets used and/or analyzed during the current study are available from the corresponding author upon reasonable request.

Conflicts of Interest

The authors declare no conflicts of interest.

References

  1. Kanatsu, S.M.; Shinohara, T. Spermatogonial stem cell self-renewal and development. Annu. Rev. Cell Dev. Biol. 2013, 29, 163–187. [Google Scholar] [CrossRef]
  2. Kubota, H.; Brinster, R.L. Spermatogonial stem cells. Biol. Reprod. 2018, 99, 52–74. [Google Scholar] [CrossRef] [PubMed]
  3. Chen, S.; Liu, Y. Regulation of spermatogonial stem cell self-renewal and spermatocyte meiosis by Sertoli cell signaling. Reproduction 2015, 149, R159–R167. [Google Scholar] [CrossRef] [PubMed]
  4. Tagelenbosch, R.A.; de Rooij, D.G. A quantitative study of spermatogonial multiplication and stem cell renewal in the C3H/101 F1 hybrid mouse. Mutat. Res. 1993, 290, 193–200. [Google Scholar] [CrossRef]
  5. Lord, T.; Oatley, J.M. A revised A(single) model to explain stem cell dynamics in the mouse male germline. Reproduction 2017, 154, R55–R64. [Google Scholar] [CrossRef] [PubMed]
  6. Mäkelä, J.; Toppari, J.; Rivero-Müller, A.; Ventelä, S. Reconstruction of mouse testicular cellular microenvironments in long-term seminiferous tubule culture. PLoS ONE 2014, 9, e90088. [Google Scholar] [CrossRef]
  7. Hara, K.; Nakagawa, T.; Enomoto, H.; Suzuki, M.; Yamamoto, M.; Simons, B.D.; Yoshida, S. Mouse spermatogenic stem cells continually interconvert between equipotent singly isolated and syncytial states. Cell Stem Cell 2014, 14, 658–672. [Google Scholar] [CrossRef]
  8. Carrieri, C.; Comazzetto, S.; Grover, A.; Morgan, M.; Buness, A.; Nerlov, C.; O’Carroll, D. A transit-amplifying population underpins the efficient regenerative capacity of the testis. J. Exp. Med. 2017, 214, 1631–1641. [Google Scholar] [CrossRef]
  9. Garbuzov, A.; Pech, M.F.; Hasegawa, K.; Sukhwani, M.; Zhang, R.J.; Orwig, K.E.; Artandi, S.E. Purification of GFRα1+ and GFRα1- Spermatogonial Stem Cells Reveals a Niche-Dependent Mechanism for Fate Determination. Stem Cell Rep. 2018, 10, 553–567. [Google Scholar] [CrossRef]
  10. Hermann, B.; Cheng, K.; Singh, A.; Roa-De La Cruz, L.; Mutoji, K.; Chen, I.; Gildersleeve, H.; Lehle, J.; Mayo, M.; Westernströer, B.; et al. The Mammalian Spermatogenesis Single-Cell Transcriptome, from Spermatogonial Stem Cells to Spermatids. Cell Rep. 2018, 25, 1650–1667.e1658. [Google Scholar] [CrossRef]
  11. Mäkelä, J.; Hobbs, R. Molecular regulation of spermatogonial stem cell renewal and differentiation. Reproduction 2019, 158, R169–R187. [Google Scholar] [CrossRef]
  12. Ikami, K.; Tokue, M.; Sugimoto, R.; Noda, C.; Kobayashi, S.; Hara, K.; Yoshida, S. Hierarchical differentiation competence in response to retinoic acid ensures stem cell maintenance during mouse spermatogenesis. Development 2015, 142, 1582–1592. [Google Scholar] [CrossRef]
  13. Tokue, M.; Ikami, K.; Mizuno, S.; Takagi, C.; Miyagi, A.; Takada, R. SHISA6 Confers Resistance to Differentiation-Promoting Wnt/β-Catenin Signaling in Mouse Spermatogenic Stem Cells. Stem Cell Rep. 2017, 8, 561–575. [Google Scholar] [CrossRef]
  14. Zhou, Z.; Kawabe, H.; Suzuki, A.; Shinmyozu, K.; Saga, Y. NEDD4 controls spermatogonial stem cell homeostasis and stress response by regulating messenger ribonucleoprotein complexes. Nat. Commun. 2017, 8, 15662. [Google Scholar] [CrossRef]
  15. Hobbs, R.; La, H.; Mäkelä, J.; Kobayashi, T.; Noda, T.; Pandolfi, P. Distinct germline progenitor subsets defined through Tsc2-mTORC1 signaling. EMBO Rep. 2015, 16, 467–480. [Google Scholar] [CrossRef]
  16. Hobbs, R.; Seandel, M.; Falciatori, I.; Rafii, S.; Pandolfi, P. Plzf regulates germline progenitor self-renewal by opposing mTORC1. Cell 2010, 142, 468–479. [Google Scholar] [CrossRef]
  17. La, H.; Chan, A.; Legrand, J.; Rossello, F.; Gangemi, C.; Papa, A.; Cheng, Q.; Morand, E.; Hobbs, R. GILZ-dependent modulation of mTORC1 regulates spermatogonial maintenance. Development 2018, 145, 165324. [Google Scholar] [CrossRef]
  18. Yeh, J.; Zhang, X.; Nagano, M. Indirect effects of Wnt3a/β-catenin signalling support mouse spermatogonial stem cells in vitro. PLoS ONE 2012, 7, e40002. [Google Scholar] [CrossRef] [PubMed]
  19. Takase, H.; Nusse, R. Paracrine Wnt/β-catenin signaling mediates proliferation of undifferentiated spermatogonia in the adult mouse testis. Proc. Natl. Acad. Sci. USA 2016, 113, E1489–E1497. [Google Scholar] [CrossRef] [PubMed]
  20. Chassot, A.; Le Rolle, M.; Jourden, M.; Taketo, M.; Ghyselinck, N.; Chaboissier, M. Constitutive WNT/CTNNB1 activation triggers spermatogonial stem cell proliferation and germ cell depletion. Dev. Biol. 2017, 426, 17–27. [Google Scholar] [CrossRef] [PubMed]
  21. Gely-Pernot, A.; Raverdeau, M.; Célébi, C.; Dennefeld, C.; Feret, B.; Klopfenstein, M.; Yoshida, S.; Ghyselinck, N.; Mark, M. Spermatogonia differentiation requires retinoic acid receptor γ. Endocrinology 2012, 153, 438–449. [Google Scholar] [CrossRef] [PubMed]
  22. Lord, T.; Oatley, M.; Oatley, J. Testicular Architecture Is Critical for Mediation of Retinoic Acid Responsiveness by Undifferentiated Spermatogonial Subtypes in the Mouse. Stem Cell Rep. 2018, 10, 538–552. [Google Scholar] [CrossRef] [PubMed]
  23. Vernet, N.; Dennefeld, C.; Rochette-Egly, C.; Oulad-Abdelghani, M.; Chambon, P.; Ghyselinck, N.; Mark, M. Retinoic acid metabolism and signaling pathways in the adult and developing mouse testis. Endocrinology 2006, 147, 96–110. [Google Scholar] [CrossRef]
  24. MacLean, G.; Li, H.; Metzger, D.; Chambon, P.; Petkovich, M. Apoptotic extinction of germ cells in testes of Cyp26b1 knockout mice. Endocrinology 2007, 148, 4560–4567. [Google Scholar] [CrossRef]
  25. DeFalco, T.; Potter, S.; Williams, A.; Waller, B.; Kan, M.; Capel, B. Macrophages Contribute to the Spermatogonial Niche in the Adult Testis. Cell Rep. 2015, 12, 1107–1119. [Google Scholar] [CrossRef] [PubMed]
  26. Ghyselinck, N.; Duester, G. Retinoic acid signaling pathways. Development 2019, 146, 167502. [Google Scholar] [CrossRef] [PubMed]
  27. Griswold, M. Spermatogenesis: The Commitment to Meiosis. Physiol. Rev. 2016, 96, 1–17. [Google Scholar] [CrossRef]
  28. Schrans-Stassen, B.; van de Kant, H.; de Rooij, D.; van Pelt, A. Differential expression of c-kit in mouse undifferentiated and differentiating type A spermatogonia. Endocrinology 1999, 140, 5894–5900. [Google Scholar] [CrossRef]
  29. Zhou, Q.; Li, Y.; Nie, R.; Friel, P.; Mitchell, D.; Evanoff, R.; Pouchnik, D.; Banasik, B.; McCarrey, J.; Small, C.; et al. Expression of stimulated by retinoic acid gene 8 (Stra8) and maturation of murine gonocytes and spermatogonia induced by retinoic acid in vitro. Biol. Reprod. 2008, 78, 537–545. [Google Scholar] [CrossRef]
  30. Pellegrini, M.; Filipponi, D.; Gori, M.; Barrios, F.; Lolicato, F.; Grimaldi, P.; Rossi, P.; Jannini, E.; Geremia, R.; Dolci, S. ATRA and KL promote differentiation toward the meiotic program of male germ cells. Cell Cycle 2008, 7, 3878–3888. [Google Scholar] [CrossRef]
  31. Yang, Y.; Feng, Y.; Feng, X.; Liao, S.; Wang, X.; Gan, H.; Wang, L.; Lin, X.; Han, C. BMP4 Cooperates with Retinoic Acid to Induce the Expression of Differentiation Markers in Cultured Mouse Spermatogonia. Stem Cells Int. 2016, 2016, 9536192. [Google Scholar] [CrossRef] [PubMed]
  32. Nasimi, M.; Jorsaraei, S.; Fattahi, E.; Tabari, M.; Neyshaburi, E. SCF Improves In Vitro Differentiation of SSCs Through Transcriptionally Up-regulating PRTM1, STRA8, c-KIT, PIWIL2, and OCT4 Genes. Reprod. Sci. 2021, 28, 963–972. [Google Scholar] [CrossRef] [PubMed]
  33. Wijayarathna, R.; de Kretser, D. Activins in reproductive biology and beyond. Hum. Reprod. Update 2016, 22, 342–357. [Google Scholar] [CrossRef] [PubMed]
  34. Nagano, M.; Ryu, B.; Brinster, C.; Avarbock, M.; Brinster, R. Maintenance of mouse male germ line stem cells in vitro. Biol. Reprod. 2003, 68, 2207–2214. [Google Scholar] [CrossRef] [PubMed]
  35. Whiley, P.; Nathaniel, B.; Stanton, P.; Hobbs, R.; Loveland, K. Spermatogonial fate in mice with increased activin A bioactivity and testicular somatic cell tumours. Front. Cell Dev. Biol. 2023, 11, 1237273. [Google Scholar] [CrossRef] [PubMed]
  36. Li, Y.; Zhang, Y.; Zhang, X.; Sun, J.; Hao, J. BMP4/Smad signaling pathway induces the differentiation of mouse spermato-gonial stem cells via upregulation of Sohlh2. Anat. Rec. 2014, 297, 749–757. [Google Scholar] [CrossRef] [PubMed]
  37. Cui, Y.; Chen, W.; Wu, S.; Wan, C.; He, Z. In Vitro generation of male germ cells from the stem cells. Asian J. Androl. 2023, 25, 13–20. [Google Scholar] [CrossRef]
  38. Yuan, Y.; Li, L.; Cheng, Q.; Diao, F.; Zeng, Q.; Yang, X.; Wu, Y.; Zhang, H.; Huang, M.; Chen, J.; et al. In vitro testicular organogenesis from human fetal gonads produces fertilization-competent spermatids. Cell Res. 2020, 30, 244–255. [Google Scholar] [CrossRef]
  39. Murakami, T.; Saitoh, I.; Inada, E.; Kurosawa, M.; Iwase, Y.; Noguchi, H.; Terao, Y.; Yamasaki, Y.; Hayasaki, H.; Sato, M. STO Feeder Cells Are Useful for Propagation of Primarily Cultured Human Deciduous Dental Pulp Cells by Eliminating Contaminating Bacteria and Promoting Cellular Outgrowth. Cell Med. 2013, 6, 75–81. [Google Scholar] [CrossRef]
  40. Sun, M.; Yuan, Q.; Niu, M.; Wang, H.; Wen, L.; Yao, C.; Hou, J.; Chen, Z.; Fu, H.; Zhou, F.; et al. Efficient generation of functional haploid spermatids from human germline stem cells by three-dimensional-induced system. Cell Death Differ. 2018, 25, 749–766. [Google Scholar] [CrossRef]
  41. Wang, P.; Suo, L.; Shang, H.; Li, Y.; Li, G.; Li, Q.; Hu, J. Differentiation of spermatogonial stem cell-like cells from murine testicular tissue into haploid male germ cells in vitro. Cytotechnology 2014, 66, 365–372. [Google Scholar] [CrossRef]
  42. Li, J.; Liu, X.; Hu, X.; Tian, G.; Ma, W.; Pei, X.; Wang, Y.; Wu, J. MicroRNA-10b regulates the renewal of spermatogonial stem cells through Kruppel-like factor 4. Cell Biochem. Funct. 2017, 35, 184–191. [Google Scholar] [CrossRef]
  43. Zhou, Q.; Wang, M.; Yuan, Y.; Wang, X.; Fu, R.; Wan, H. Complete Meiosis from Embryonic Stem Cell-Derived Germ Cells In Vitro. Cell Stem Cell 2016, 18, 330–340. [Google Scholar] [CrossRef]
  44. Gao, W.; Li, H.; Feng, J.; Lu, X.; Yin, P.; Jia, H.; Ma, W. Transcriptome Analysis in High Temperature Inhibiting Spermatogonial Stem Cell Differentiation In Vitro. Reprod. Sci. 2023, 30, 1938–1951. [Google Scholar] [CrossRef]
  45. Sun, Y.; Liu, W.; Liu, T.; Feng, X.; Yang, N.; Zhou, H. Signaling pathway of MAPK/ERK in cell proliferation, differentiation, migration, senescence and apoptosis. J. Recept. Signal Transduct. Res. 2015, 35, 600–604. [Google Scholar] [CrossRef]
  46. Zhao, L.; Sun, G.; Han, L.; Liu, L.; Ren, F.; Li, L.; Ma, M.; Shan, B. P-Hydroxycinnamaldehyde Induces B16-F1 Melanoma Cell Differentiation via the RhoA-MAPK Signaling Pathway. Cell. Physiol. Biochem. Int. J. Exp. Cell. Physiol. Biochem. Pharmacol. 2016, 38, 2247–2260. [Google Scholar] [CrossRef]
  47. Phillips, B.; Gassei, K.; Orwig, K. Spermatogonial stem cell regulation and spermatogenesis. Philos. Trans. R. Soc. London. Ser. B Biol. Sci. 2010, 365, 1663–1678. [Google Scholar] [CrossRef]
  48. Yeh, J.; Zhang, X.; Nagano, M. Establishment of a short-term in vitro assay for mouse spermatogonial stem cells. Biol. Reprod. 2007, 77, 897–904. [Google Scholar] [CrossRef]
  49. Zhang, P.; Wu, Y.; Dai, Q.; Fang, B.; Jiang, L. p38-MAPK signaling pathway is not involved in osteogenic differentiation during early response of mesenchymal stem cells to continuous mechanical strain. Mol. Cell. Biochem. 2013, 378, 19–28. [Google Scholar] [CrossRef]
  50. Jang, Y.; Koo, H.; Sohn, E.; Kang, S.; Rhee, D.; Pyo, S. Theobromine inhibits differentiation of 3T3-L1 cells during the early stage of adipogenesis via AMPK and MAPK signaling pathways. Food Funct. 2015, 6, 2365–2374. [Google Scholar] [CrossRef] [PubMed]
  51. Kunath, T.; Saba-El-Leil, M.; Almousailleakh, M.; Wray, J.; Meloche, S.; Smith, A. FGF stimulation of the Erk1/2 signalling cascade triggers transition of pluripotent embryonic stem cells from self-renewal to lineage commitment. Development 2007, 134, 2895–2902. [Google Scholar] [CrossRef]
  52. Bissonauth, V.; Roy, S.; Gravel, M.; Guillemette, S.; Charron, J. Requirement for Map2k1 (Mek1) in extra-embryonic ectoderm during placentogenesis. Development 2006, 133, 3429–3440. [Google Scholar] [CrossRef]
  53. Crews, C.; Alessandrini, A.; Erikson, R. The primary structure of MEK, a protein kinase that phosphorylates the ERK gene product. Science 1992, 258, 478–480. [Google Scholar] [CrossRef]
  54. Chu, Y.; Corey, D. RNA sequencing: Platform selection, experimental design, and data interpretation. Nucleic Acid Ther. 2012, 22, 271–274. [Google Scholar] [CrossRef]
  55. Ali, N.; Zirak, B.; Rodriguez, R.; Pauli, M.; Truong, H.; Lai, K.; Ahn, R.; Corbin, K.; Lowe, M.; Scharschmidt, T.; et al. Regulatory T Cells in Skin Facilitate Epithelial Stem Cell Differentiation. Cell 2017, 169, 1119–1129.e1111. [Google Scholar] [CrossRef]
  56. Luo, S.; Shi, Q.; Li, W.; Wu, W.; Zha, Z. ITGB1 promotes the chondrogenic differentiation of human adipose-derived mesenchymal stem cells by activating the ERK signaling. J. Mol. Histol. 2020, 51, 729–739. [Google Scholar] [CrossRef]
  57. Park, G.; Kim, H.; Park, H.; Seo, Y.; Kim, J.; Shin, S.; Kwon, H.; Sung, E.; Lee, J.; Lee, B. Tensin-3 Regulates Integrin-Mediated Proliferation and Differentiation of Tonsil-Derived Mesenchymal Stem Cells. Cells 2019, 9, 89. [Google Scholar] [CrossRef]
  58. Zhang, H.; Chen, X.; Xue, P.; Ma, X.; Li, J.; Zhang, J. FN1 promotes chondrocyte differentiation and collagen production via TGF-β/PI3K/Akt pathway in mice with femoral fracture. Gene 2021, 769, 145253. [Google Scholar] [CrossRef]
  59. Jiang, X.; Teng, M.; Ji, R.; Zhang, D.; Zhang, Z.; Lv, Y.; Zhang, Q.; Zhang, J.; Huang, Y. CD9 regulates keratinocyte differentiation and motility by recruiting E-cadherin to the plasma membrane and activating the PI3K/Akt pathway. Biochim. Et Biophys. Acta. Mol. Cell Res. 2020, 1867, 118574. [Google Scholar] [CrossRef]
  60. Liu, Y.; Shi, H.; Hu, Y.; Yao, R.; Liu, P.; Yang, Y.; Li, S. RNA binding motif protein 3 (RBM3) promotes protein kinase B (AKT) activation to enhance glucose metabolism and reduce apoptosis in skeletal muscle of mice under acute cold exposure. Cell Stress Chaperones 2022, 27, 603–618. [Google Scholar] [CrossRef] [PubMed]
  61. Kim, D.; Kim, K.; Kim, E.; Jang, W. Hypothermia-induced RNA-binding motif protein 3 (RBM3) stimulates osteoblast differentiation via the ERK signaling pathway. Biochem. Biophys. Res. Commun. 2018, 498, 459–465. [Google Scholar] [CrossRef]
  62. Wellmann, S.; Truss, M.; Bruder, E.; Tornillo, L.; Zelmer, A.; Seeger, K.; Bührer, C. The RNA-binding protein RBM3 is required for cell proliferation and protects against serum deprivation-induced cell death. Pediatr. Res. 2010, 67, 35–41. [Google Scholar] [CrossRef]
  63. Yang, H.; Ju, F.; Guo, X.; Ma, S.; Wang, L.; Cheng, B.; Zhuang, R.; Zhang, B.; Shi, X.; Feng, Z.; et al. RNA-binding protein RBM3 prevents NO-induced apoptosis in human neuroblastoma cells by modulating p38 signaling and miR-143. Sci. Rep. 2017, 7, 41738. [Google Scholar] [CrossRef]
  64. Westerman, B.; Braat, A.; Taub, N.; Potman, M.; Vissers, J.; Blom, M.; Verhoeven, E.; Stoop, H.; Gillis, A.; Velds, A.; et al. A genome-wide RNAi screen in mouse embryonic stem cells identifies Mp1 as a key mediator of differentiation. J. Exp. Med. 2011, 208, 2675–2689. [Google Scholar] [CrossRef]
  65. Caires, K.; de Avila, J.; Cupp, A.; McLean, D. VEGFA family isoforms regulate spermatogonial stem cell homeostasis in vivo. Endocrinology 2012, 153, 887–900. [Google Scholar] [CrossRef]
  66. Yu, P.; Pan, G.; Yu, J.; Thomson, J. FGF2 sustains NANOG and switches the outcome of BMP4-induced human embryonic stem cell differentiation. Cell Stem Cell 2011, 8, 326–334. [Google Scholar] [CrossRef]
  67. Hager, K.; Gu, W. Understanding the non-canonical pathways involved in p53-mediated tumor suppression. Carcinogenesis 2014, 35, 740–746. [Google Scholar] [CrossRef]
  68. Jain, A.; Allton, K.; Iacovino, M.; Mahen, E.; Milczarek, R.; Zwaka, T.; Kyba, M.; Barton, M. p53 regulates cell cycle and microRNAs to promote differentiation of human embryonic stem cells. PLoS Biol. 2012, 10, e1001268. [Google Scholar] [CrossRef]
  69. Lhee, S.; Song, E.; Kim, Y.; Han, M. SIRT1 Inhibits p53 but not NF-κB Transcriptional Activity during Differentiation of Mouse Embryonic Stem Cells into Embryoid Bodies. Int. J. Stem Cells 2012, 5, 125–129. [Google Scholar] [CrossRef] [PubMed]
  70. Le Goff, S.; Boussaid, I.; Floquet, C.; Raimbault, A.; Hatin, I.; Andrieu-Soler, C.; Salma, M.; Leduc, M.; Gautier, E.; Guyot, B.; et al. p53 activation during ribosome biogenesis regulates normal erythroid differentiation. Blood 2021, 137, 89–102. [Google Scholar] [CrossRef] [PubMed]
  71. Aptullahoglu, E.; Ciardullo, C.; Wallis, J.; Marr, H.; Marshall, S.; Bown, N.; Willmore, E.; Lunec, J. Splicing Modulation Results in Aberrant Isoforms and Protein Products of p53 Pathway Genes and the Sensitization of B Cells to Non-Genotoxic MDM2 Inhibition. Int. J. Mol. Sci. 2023, 24, 2410. [Google Scholar] [CrossRef]
  72. Garrido-Jimenez, S.; Barrera-Lopez, J.; Diaz-Chamorro, S.; Mateos-Quiros, C.; Rodriguez-Blanco, I.; Marquez-Perez, F.; Lorenzo, M.; Centeno, F.; Roman, A.; Carvajal-Gonzalez, J. p53 regulation by MDM2 contributes to self-renewal and differentiation of basal stem cells in mouse and human airway epithelium. FASEB J. Off. Publ. Fed. Am. Soc. Exp. Biol. 2021, 35, e21816. [Google Scholar] [CrossRef]
  73. El-Deiry, W. p21(WAF1) Mediates Cell-Cycle Inhibition, Relevant to Cancer Suppression and Therapy. Cancer Res. 2016, 76, 5189–5191. [Google Scholar] [CrossRef]
  74. Hu, L.; Liu, J.; Meng, Y.; Zheng, H.; Ding, C.; Wang, H.; Charwudzi, A.; Li, M.; Li, J.; Zhai, Z.; et al. Long non-coding RNA HOTAIR regulates myeloid differentiation through the upregulation of p21 via miR-17-5p in acute myeloid leukaemia. RNA Biol. 2021, 18, 1434–1444. [Google Scholar] [CrossRef]
  75. Tchakarska, G.; Sola, B. The double dealing of cyclin D1. Cell Cycle 2020, 19, 163–178. [Google Scholar] [CrossRef]
  76. Montalto, F.; De Amicis, F. Cyclin D1 in Cancer: A Molecular Connection for Cell Cycle Control, Adhesion and Invasion in Tumor and Stroma. Cells 2020, 9, 2648. [Google Scholar] [CrossRef]
  77. Zhang, H. CCND1 silencing suppresses liver cancer stem cell differentiation through inhibiting autophagy. Hum. Cell 2020, 33, 140–147. [Google Scholar] [CrossRef]
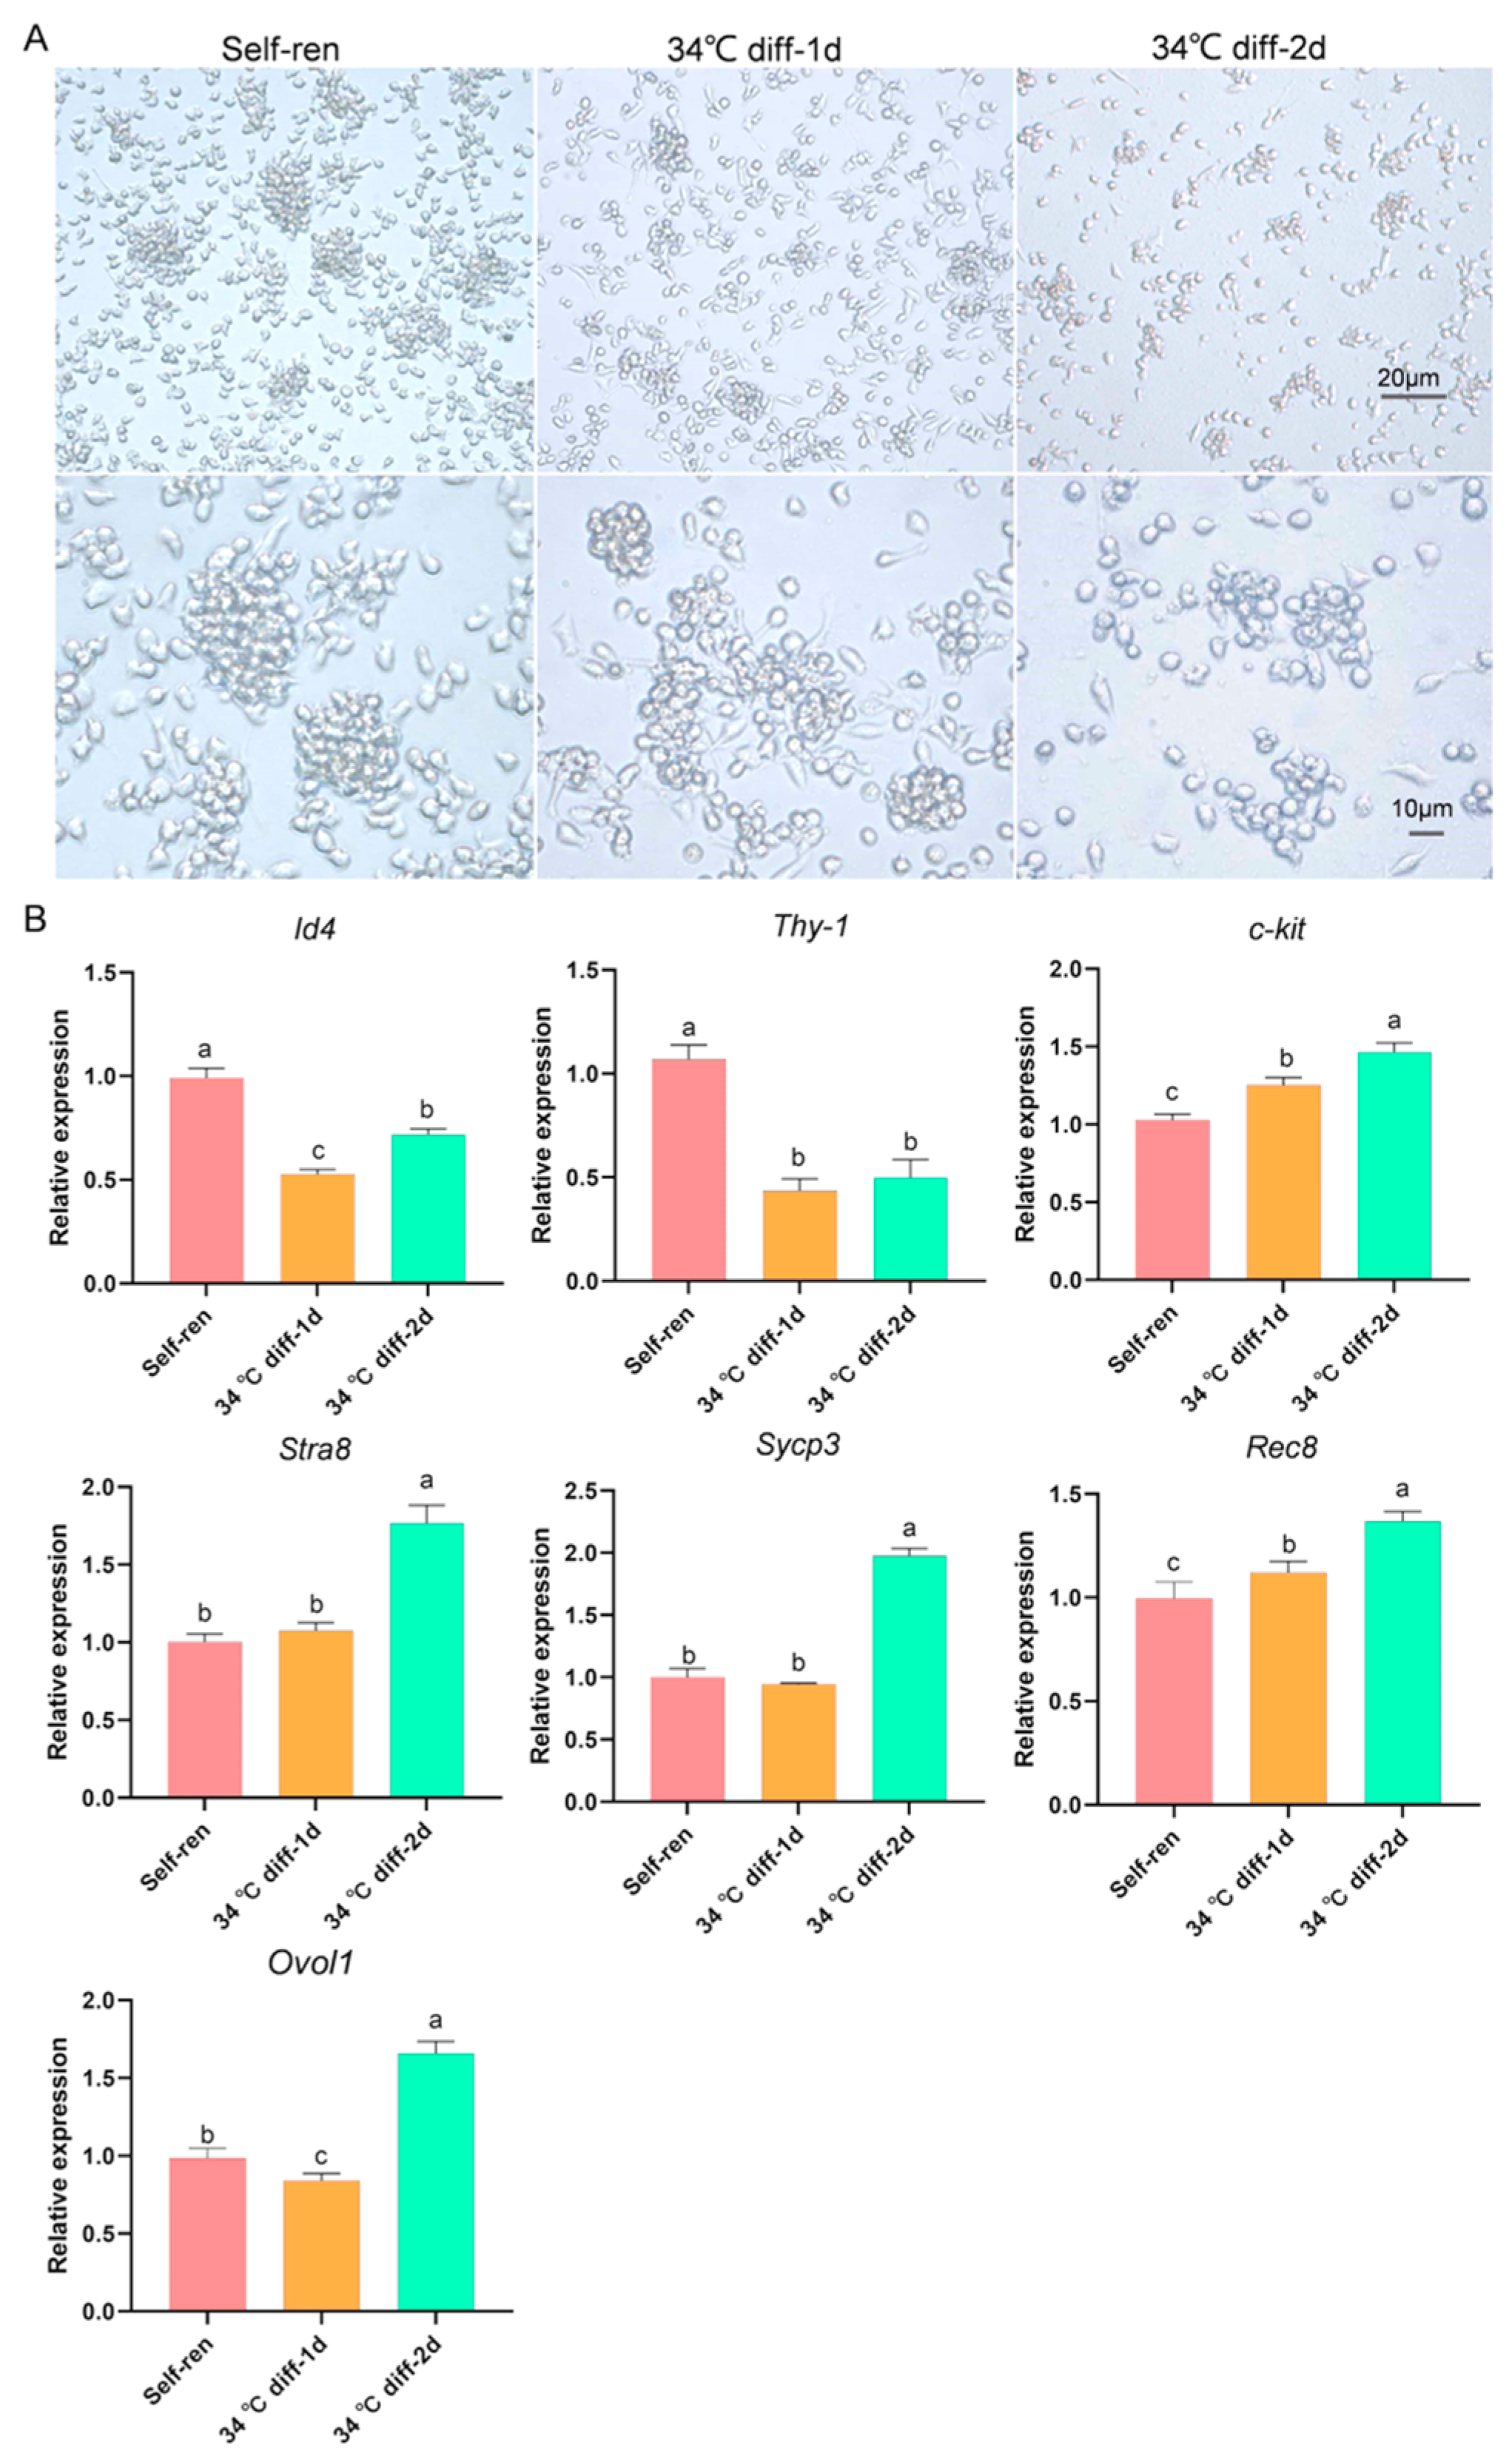
Figure 1. Establishment of SSCs in an in vitro differentiation culture system. (A). SSCs grew well in the 37 °C self-renewal culture group and in the 34 °C differentiation culture group. (B). The expressions of undifferentiated spermatogonial marker genes Id4 and Thy-1, differentiated spermatogonial marker gene c-kit, and meiosis-related genes Stra8, Rec8 and Sycp3 after differentiation and culture. Self-ren, self-renewal; 34 °C diff, differentiation culture at 34 °C; 34 °C diff-1d, day one of differentiation culture at 34 °C; 34 °C diff-2d, day two of differentiation culture at 34 °C. a, b, c, different letters indicate a significant difference (p < 0.05).
Genes 15 00141 g001
Figure 2. Analysis of differentially expressed genes during SSC differentiation. (A). Heatmap of differentially expressed genes among the self-continuation group, 34 °C diff−1d group and 34 °C diff−2d group. Red stripes represent highly expressed genes, while green stripes represent low-expression genes. (B). The total number of genes and differentially expressed genes (DEGs) identified from self-ren group vs 34 °C diff−1d group, self-ren group vs 34 °C diff−2d group and 34 °C diff−1d group vs. 34 °C diff−2d group. (C). Volcano map of DEGs between the self-renewal and 34 °C diff−1d groups. (D). Volcano map of DEGs between the self-renewal and 34 °C diff−2d groups. (E). Volcano map of DEGs between the 34 °C diff−1d and 34 °C diff−2d groups. The x-axis is the log2 scale of the fold change of gene expression in the self-renewal and differentiation groups (log2(fold change)). Negative values indicate down-regulation; positive values indicate up-regulation. The y-axis is the minus log10 scale of the adjusted p values (elog10 (padj)), which indicate the significance levels of expression difference. The red dots represent significantly up-regulated genes with at least a two-fold change, while the green dots represent significantly down-regulated genes with at least a two-fold change.
Genes 15 00141 g002
Figure 3. The GO term is enriched between the self-renewal and differentiation groups. The abscissa is the GO term, and the ordinate represents the GO term significance level in the GO enrichment analysis. Higher values mean greater significance. The red stripes represent the BP subset, the green stripes represent the CC subset, and the blue stripes represent the MF subset. (A). The top 30 GO terms in the enrichment analysis of the self-renewal group and on the first day of differentiation. (B). The top 30 GO terms in the enrichment analysis of the self-renewal group and on the second day of differentiation. (C). The top 30 GO terms in the enrichment analysis of the first-day group and on the second day of differentiation.
Genes 15 00141 g003
Figure 4. GO analysis of the differentially expressed genes. (A). The top 30 enriched GO terms on the first day of differentiation compared with self-renewal. (B). The 30 enriched GO terms on the second day of differentiation compared with self-renewal. (C). Venn diagram of GO terms in the 34 °C differentiation after 1 d vs. self-ren groups and 34 °C differentiation after 2 d vs. self-ren groups. Twelve GO terms were co-enriched. (D). The top 30 enriched GO terms on the second day of differentiation compared with the first day of differentiation. The abscissa is the ratio of the number of differential genes enriched on the GO terms to the totality, and the ordinate is the GO term. The size of the dot indicates the number of genes enriched on the GO term. The degree of enrichment from small to large is represented by the color from purple to red.
Genes 15 00141 g004
Figure 5. KEGG analysis of the differentially expressed genes. (A). The top 20 enriched KEGG pathway on the first day of differentiation compared with self-renewal. (B). On day 2 of differentiation, the top 20 KEGG pathways enriched compared to the self-renewal group. (C). Venn diagram of KEGG pathway in the 34 °C differentiation-1d group vs. self-ren group and 34 °C differentiation-2d group vs. self-ren group. Thirteen KEGG signaling pathways were co-enriched. (D). The top 20 enriched KEGG pathway on the second day of differentiation compared with the first day of differentiation. The abscissa is the ratio of the number of differential genes enriched on the KEGG pathway terms to the totality, and the ordinate is the functional pathway. The signaling pathways labeled in blue were enriched on both the first and second day of SSC differentiation.
Genes 15 00141 g005
Table 1. Significantly enriched GO terms and DEGs in SSCs on the first day of differentiation compared with self-renewal.
GO-IDGO TermUP-GenesDOWN-Genesp-ValueType
GO:0022613ribonucleoprotein complexbiogenesisCdkn2a, Mrpl10Gemin5, Nhp2, Mrto4, Rpl3, Rpl12, Rps231.48 × 10−23BP
GO:0042254Ribosome biogenesisRnasel, RpsaRps27l, Surf6, Mrpl20, Rps2, Mrps7, Rpl7l1, Rsl24d11.17 × 10−21BP
GO:0034660ncRNA metabolic processAgo4Snu13, Npm1, Rpl11, Rpl35a, Mrpl447.85 × 10−21BP
GO:0034470ncRNA processingNsun3, Riok3Rps24, Rpl10a, Rps7, Rpl14, Rpl72.40 × 10−18BP
GO:0016072rRNA metabolic processNsun4, Wdr37Mrps11, Rpl5, Rps21, Rps6, Rps167.24 × 10−18BP
GO:0006364rRNA processingTsr3Mrps9, Rps19, Rps17, Rpl269.46 × 10−18BP
GO:0003735structural constituent of ribosomeRpl17, Rpl21Mrpl11, Rps15, Rps14, Rps8, Rpl27, Rpl345.78 × 10−17MF
GO:0005840ribosomeRbm3Rpl10, Rps25, Rpl38, Rpl35, Rsl1d19.91 × 10−17CC
GO:0044391ribosomal subunitLcmt2, Hsd17b10Mrpl1, Imp3, Rpl6, Rps5, Rps18, Rpl23a, Rpl13a, Ddx3x9.91 × 10−17CC
Table 2. Significantly enriched GO terms and DEGs in SSCs on the second day of differentiation compared with self-renewal.
GO-IDGO TermUP-GenesDOWN-Genesp-ValueType
GO:0042254ribosome biogenesisCdkn2a, Riok3, RnaselNpm1, C1qbp, Nop531.54 × 10−13BP
GO:0022613ribonucleoprotein complex biogenesisEif2a, Nmd3Hsp90ab1, Dicer11.21 × 10−15BP
GO:0030335positive regulation of cell migrationFn1, Fgfr1, Thbs1, Anxa1Tert, Mapk14, Akt11.71 × 10−15BP
GO:0001667ameboidal-type cell migrationEpha2, Ilk, JupPdcd6, Itgb3, Prkd28.48 × 10−10BP
GO:0034504Protein localization to nucleusLrrk2, Ptgs2, Lif, BMP4, Cd2apCdk5rap3, Tmem173, Park71.65 × 10−10BP
GO:1900182positive regulation of protein localization to nucleusSmo, Src, Cdkn2aJak2, Sesn2, Hyal2, Stk114.64 × 10−10BP
GO:0010608posttranscriptional regulation of gene expressionEp300, Parp9Tgfb1, Mapk1, Tpr8.42 × 10−10BP
GO:0050839cell adhesion molecule bindingFn1, Cttn, Timp2, Fgfr1Pdlim1, Twf22.06 × 10−6MF
GO:0051098regulation of bindingJak2, Nmd3 Tgfb2Parp14.78 × 10−10BP
GO:0001525angiogenesisCard10, Ngfr, Eif2ak3, TekGpld15.36 × 10−10BP
Table 3. Significantly enriched GO terms and DEGs in SSCs on the second day of differentiation compared with the first day of differentiation.
GO-IDGO TermUP-Genesp-ValueType
GO:0001525angiogenesisPtgs2, Plau4.05 × 10−30BP
GO:0040017positive regulation of locomotionPrl2c2, Hbegf2.67 × 10−28BP
GO:0001667ameboidal-type cell migrationGrem1, Vegfa, Ccbe12.76 × 10−27BP
GO:0030335positive regulation of cell migrationSpry2, Jun, Sphk15.15 × 10−27BP
GO:2000147positive regulation of cell motilityFn1, Thbs16.66 × 10−27BP
GO:0071363cellular response to growth factor stimulusAdgra2, Ccl28.38 × 10−27BP
GO:0051272positive regulation of cellular component movementAmotl1, Itgb11.10 × 10−26BP
GO:0070848response to growth factorEts1, Fgf21.38 × 10−26BP
GO:0005912adherens junctionJag1, Afap1, Itgb1, Itgav Tns31.12 × 10−19CC
GO:0050839cell adhesion molecule bindingFn1, Cd9, Fgf2, Itgb1, Epha2, Ctgf2.88 × 10−16MF
Table 4. Significantly enriched KEGG pathway and DEGs in SSCs on the first day of differentiation compared with self-renewal.
KWGG-IDKEGG PathwayUP-GenesDOWN-Genesp-Value
mmu03040SpliceosomeNcbp1, Hspa2, Hspa1aDdx39b, Ncbp2, Alyref, Snu132.65 × 10−9
mmu04110Cell cycleCdkn2a, Gadd45bCcne1, Ccnd2, Ccnb1, Cdk14.87 × 10−9
mmu03010RibosomeMrpl10, Rpsa, Rpl21, Rpl17, Rpl34-ps1Mrpl12, Rpl35a1.06 × 10−7
mmu03013RNA transportMagohb, Lig1, Nxt2Pop5, Pop4, Pop1, Nxt1, Nxf1, Nvl1.53 × 10−7
mmu03030DNA replicationRfc2, Pold4Pola1, Pole4, Prim2, Pola2, Pole3.50 × 10−7
mmu04142LysosomeSmo, Src, Cdkn2aManba, Atp6v1h, Gga2, Ap1g22.12 × 10−6
mmu03008Ribosome biogenesis in eukaryotesXrn1, Nxt2Ran, Rpp25, Xpo16.79 × 10−6
mmu04115p53 signaling pathwayThbs1, Rrm2b, Ccnd1, Mdm2, FasMcm5, Mcm2, Mcm6, Bub1b, Cdk4, Cdk6, Bax, Cdk25.27 × 10−5
mmu01200Carbon metabolismIdh1, OgdhlShmt2, Psat1, Pfkl, Eno1b8.96 × 10−5
mmu05205Proteoglycans in cancerMdm2, Ctsl, Cd63Casp3, Myc6.44 × 10−4
Table 5. Significantly enriched KEGG pathway and DEGs in SSCs on the second day of differentiation compared with self-renewal.
KWGG-IDKEGG PathwayUP-GenesDOWN-Genesp-Value
mmu05206MicroRNAs in cancerCdkn1a, Hmga2, Thbs1, Cdkn2aE2f2, Ccne11.06 × 10−5
mmu04210ApoptosisCtsd, Ctsb, Gzmb, Tnfrsf1aHras, Ptpn13, Map3k144.28 × 10−5
mmu03030DNA replicationLig1, Pold4Mcm2, Mcm5, Pold1, Mcm61.15 × 10−4
mmu03040SpliceosomeMagohb, Slu7, Ddx5, Prpf40aU2af2, Srsf7, Hnrnpc, Hspa81.68 × 10−4
mmu03008Ribosome biogenesis in eukaryotes Riok2, Riok1Heatr1, Nat10, Emg1, Rcl13.15 × 10−4
mmu04110Cell cycleCdkn2a, Ep300, Tgfb2Mcm2, Mcm53.62 × 10−4
mmu01230Biosynthesis of amino acidsIdh1, Eno2Mcm4, Mcm64.36 × 10−4
mmu00531Glycosaminoglycan degradationHexb, SgshGusbHyal2, Hyal3, Idua5.37 × 10−4
mmu04142Lysosome Ctsd, Ctsb, CtslHyal2, Hyal3, Idua, Gusb7.53 × 10−4
Table 6. Comparison of the DEGs significantly enriched in KEGG pathways for 1 d and 2 d of induced differentiation.
KWGG-IDKEGG PathwayUP-Genesp-Value
mmu05205Proteoglycans
in cancer
Cdkn1a, Fgf21.21 × 10−14
mmu04510Focal adhesionSrc, Thbs1, Itga52.21 × 10−13
mmu04360Axon guidanceMet, Ptk2, Rhoa1.46 × 10−10
mmu05418Fluid shear stress and atherosclerosisEgfr, Pdgfa4.24 × 10−10
mmu04151PI3K-Akt signaling
pathway
Akt3, Jak1, Osm1.90 × 10−9
mmu05206MicroRNAs
in cancer
Vegfa, Cdkn1a6.37 × 10−9
mmu04015Rap1 signaling
pathway
Itgb1, Igf1r, Pik3cb, Rap1b1.59 × 10−8
mmu04010MAPK signaling
pathway
Map2k1, Kras, Pak13.44 × 10−8
mmu04390Hippo signaling
pathway
Ctnnb1, Ccnd14.35 × 10−8
Disclaimer/Publisher’s Note: The statements, opinions and data contained in all publications are solely those of the individual author(s) and contributor(s) and not of MDPI and/or the editor(s). MDPI and/or the editor(s) disclaim responsibility for any injury to people or property resulting from any ideas, methods, instructions or products referred to in the content.