Abstract
The regulation of the hypothalamic-pituitary-adrenal (HPA) axis is associated with polymorphisms and the methylation degree of the glucocorticoid receptor gene (NR3C1) and is potentially involved in the development of metabolic syndrome (MetS). In order to evaluate the association between MetS with the polymorphisms, methylation, and gene expression of the NR3C1 in the genetically isolated Brazilian Mennonite population, we genotyped 20 NR3C1 polymorphisms in 74 affected (MetS) and 138 unaffected individuals without affected first-degree relatives (Co), using exome sequencing, as well as five variants from non-exonic regions, in 70 MetS and 166 Co, using mass spectrometry. The methylation levels of 11 1F CpG sites were quantified using pyrosequencing (66 MetS and 141 Co), and the NR3C1 expression was evaluated via RT-qPCR (14 MetS and 25 Co). Age, physical activity, and family environment during childhood were associated with MetS. Susceptibility to MetS, independent of these factors, was associated with homozygosity for rs10482605*C (OR = 4.74, pcorr = 0.024) and the haplotype containing TTCGTTGATT (rs3806855*T_ rs3806854*T_rs10482605*C_rs10482614*G_rs6188*T_rs258813*T_rs33944801*G_rs34176759*A_rs17209258*T_rs6196*T, OR = 4.74, pcorr = 0.048), as well as for the CCT haplotype (rs41423247*C_ rs6877893*C_rs258763*T), OR = 6.02, pcorr = 0.030), but not to the differences in methylation or gene expression. Thus, NR3C1 polymorphisms seem to modulate the susceptibility to MetS in Mennonites, independently of lifestyle and early childhood events, and their role seems to be unrelated to DNA methylation and gene expression.
Keywords:
NR3C1; HPA; glucocorticoid receptor; haplotype; anabaptist population; methylation; epigenetics 1. Introduction
Metabolic syndrome (MetS) is a complex disease and a steeply rising cause of morbidity and death worldwide, increasing by more than two times the risk of mortality from cardiovascular diseases [1], which are the world’s leading cause of death [2]. Due to the intricate gene–environmental interactions, the common cause for MetS components, such as central adiposity, systemic arterial hypertension, insulin resistance, and dyslipidemia, is still unclear. The deregulated activity of the hypothalamic–pituitary–adrenal (HPA) axis is an emerging explanation, due to its influence on glucose and lipid metabolism, as well as anti-inflammatory and immune reactions [3]. The glucocorticoid receptor (GR) is responsible for mediating the negative feedback of the HPA axis, driven by cortisol levels [4]. To uncover its role in MetS development, higher environmental and genetic homogeneity, similar to the levels in animal models and isolated human populations, are desirable. The investigation of genetically isolated populations sharing the environment and demographic history for several generations benefits from the reduced variability and similar long-term exposure to confounding risk factors. The Mennonite population presents almost 500 years of isolation and three historical demographic bottlenecks (promoted by migrations mostly due to political–religious persecution), which increases the frequencies of uncommon alleles and allows for the use of smaller sample sizes for the identification of the loci associated with phenotypes [5,6], providing a unique opportunity to investigate the association of MetS with several parameters, like age, diet, physical activity, and paternal warmth in childhood.
Stress activates the sympathetic autonomic nervous system, followed by the HPA axis, which triggers the release of corticotropin-releasing hormone (CRH) and arginine vasopressin (AVP) by the paraventricular nucleus of the hypothalamus. In turn, they induce the pituitary gland to secrete adrenocorticotropic hormone (ACTH), which stimulates the adrenal cortex to secrete glucocorticoids (such as cortisol) into the bloodstream. Glucocorticoids bind GRs in the pituitary gland, hypothalamus, and hippocampus to regulate the production of CRH and ACTH, stabilizing their circulating levels [7]. Upon binding to glucocorticoids, GRs associate with co-chaperones and translocate to the nucleus, where they bind to glucocorticoid-responsive elements (GREs) and activate the expression of genes related to metabolic processes and immunity. Simultaneously, they interact with transcription factors, such as nuclear factor-kB (NF-kB) and activating protein-1 (AP-1), to reduce the expression of proinflammatory genes [3,4,8,9]. The deregulation of the HPA axis has indeed been related to MetS development, which is characterized by abdominal obesity, high triglycerides, low high density lipoproteins (HDL) cholesterol, arterial hypertension, and high fasting glucose [10]. MetS presents an interface with genetic and environmental factors, with physical inactivity and excessive caloric intake standing out among the latter [11]. The HPA axis in patients with MetS has reduced sensitivity to GR-mediated negative feedback, highlighting the potential role of the dysregulation of this system in the disease [12], with excess cortisol being associated with hypertension, visceral obesity, and diabetes/resistance to insulin, in addition to mood and cognition disorders [13].
The glucocorticoid receptor gene (NR3C1) (nuclear receptor subfamily 3 group C member 1) encodes GR and is of particular interest in investigating the association between genetic factors and diseases that involve HPA axis imbalance [14,15,16]. This gene is located on the reverse strand of chromosome 5q31.3 (GRCh38.p13:chr5:143,277,931-143,435,512), contains eight coding exons (2 to 9) and nine non-coding exons (1A, 1I, 1D, 1J, 1E, 1B, 1F, 1C and 1H), located in the proximal regulatory region (5’UTR), and each one has its own promoter region. There are two main isoforms resulting from the alternative splicing of NR3C1 pre-mRNA: GRα and GRβ. GRα is the most frequent isoform, while GRβ has about 1% of the expression of the GRα variant and acts as its dominant inhibitor [17]. NR3C1 is epigenetically regulated by DNA methylation, presenting a CpG island in its 5’UTR region that comprises multiple exons “1”, except for exons 1A and 1I [18,19]. Differential 1F exon methylation has been associated with bipolar disorder, borderline disorder, depression, and post-traumatic stress disorder, which, in turn, are also related to HPA axis dysregulation [7,16,20,21]. These DNA methylation alterations have been widely attributed to the influence of stressors during critical periods, mainly in childhood, such as child maltreatment (neglect; exposure to violence by an intimate partner or to physical, emotional, and sexual abuses) and pain-related stress [16,22,23]. In rats, it has been shown that enhanced pup licking and grooming and arched-back nursing by mothers alters the offspring epigenome in exon 17 of NR3C1 (homologous to exon 1F in humans) [24], and maternal caregiving behaviors in humans reduced early stress exposure [23].
NR3C1 promoter methylation is also associated with lower GR expression, reducing sensitivity to the HPA axis negative feedback [25]. While studies on NR3C1 methylation focus on psychopathologies, with scarce studies on MetS or its components, several polymorphisms have already been associated with them, with emphasis on the single-nucleotide polymorphisms (SNPs) rs56149945 (p.N363S), rs41423247 (BclI), rs6189/6190 (ER22/23EK), rs10052957 (TthIIII), and rs6198 (GR-9β), which seem to modulate the sensitivity to glucocorticoids [3,26]. However, many of these studies lack expression analysis, and the functional impacts of these SNPs are still poorly understood.
In this work, we gained important insights into the association of GR genetic polymorphisms/haplotypes, DNA methylation markers, and gene expression in the leukocytes of South Brazilian Mennonites with MetS, where we investigated 25 NR3C1 polymorphisms, the methylation levels of 11 CpGs mapped to the 1F region, and NR3C1 mRNA levels.
Exome sequencing enabled the investigation of 20 NR3C1 polymorphisms, not yet investigated in the literature in relation to MetS or its risk factors, giving rise to a new possible genetic variation role in MetS etiology. The other five NR3C1 SNPs were selected based on their association with factors related to MetS, e.g., in the European population, rs6877893 was associated with reduced waist circumference adjusted for body mass index (BMI) [27] and rs258763*T, rs7701443*G, and rs72802813*A alleles were associated with reduced hip circumference adjusted for BMI [28]. Furthermore, rs41423247*G polymorphism was associated with hypersensitivity to glucocorticoids [29], higher blood pressure, and insulin and glucose levels in obese northern Indians [30], as well as increased BMI, waist circumference, and systolic blood pressure in congenital adrenal hyperplasia Brazilian patients [31]. In addition, rs41423247*G/G homozygotes exhibited an increased risk of developing MetS in the Turkish [32] and Chinese [33] populations and presented higher BMI, body weight, abdominal obesity, fasting glucose, and insulin in Swedish men [34].
2. Materials and Methods
2.1. Research Participants
This research was approved in two instances by the Ethics Committee of the UFPR Health Sciences Sector (CAAE 55528222.9.0000.0102 and 55297916.6.0000.0102). After informed consent, we collected peripheral blood from 349 Mennonite volunteers from three southern Brazilian communities, from 2016 to 2022: 126 from the urban community of Curitiba (CWB, PR) and 84 and 139 from the two rural settlements of Colônia Witmarsum (CWI; Palmeira, PR) and Colônia Nova (CON; Aceguá, RS), respectively. All participants had their biometric parameters measured and were interviewed with a questionnaire based on the National Healthy Survey [35] to evaluate health and lifestyle conditions, as well as familial disease aggregation. Inclusion criteria were the Mennonite origin for at least one of the parents (sharing a common migratory route from the Netherlands to Poland, then to Ukraine, and from there again to Germany and later to Brazil or Paraguay); more than 12 years of age; and capacity to understand and answer the questions of the questionnaire. Individuals with MetS were classified based on the modified Joint Interim Statement (JIS) [10] and should have at least three of the criteria listed in Table 1. Exclusion criteria were controls with first-degree ascending relatives with patients. The demographics and epidemiologic data of the participants are shown in Table 2. In total, 112 individuals presented MetS, and 237 were considered healthy controls. As of August 2021, blood samples were also collected in PAXgene Blood RNA tubes (Becton Dickinson, Vaud, Switzerland).

Table 1.
Diagnostic criteria for MetS.
Table 2.
Distribution of characteristics in Mennonite population samples.
2.2. NR3C1 Genotyping
Peripheral blood was collected in tubes containing EDTA, and DNA was extracted from the buffy coat, using a Wizard® Genomic DNA Purification Kit (Promega, Fitchburg, WI, USA), according to the manufacturer’s instructions. We selected 05 single-nucleotide polymorphisms (SNPs) based on previous studies showing their association with some of the MetS criteria and a minor allele frequency (MAF) higher than 0.10 in the European population (Utah, USA) [36]. We evaluated the following SNPs: rs72802813 (5:143423467, in intron 1, ENST00000343796.6:c.-14+11065C>t), rs7701443 (5:143413085, in intron 1, ENST00000343796.6:c.-13-12233T>c), rs41423247 (BclI; 5:143399010, in intron 2, ENST00000343796.6:c.1184+646C>g), rs6877893 (5:143347628, in intron 2, ENST00000343796.6:c.1185-33460C>t), and rs258763 (5:143272796, in intergenic region ARHGAP26, NR3C1, NC_000005.10:g.143272796T>a). Up to 166 controls and 70 patients were genotyped using the iPLEX MassARRAY Platform (Agena Bioscience, San Diego, CA, USA).
In addition, 212 exomes from Mennonites were previously generated by our research group with >30× coverage (Illumina HiSeq) (Illumina, San Diego, CA, USA). From these data, we performed screening, selecting the variants located in the NR3C1 gene after filtering with the VEP (Variant Effect Predictor) tool—Ensembl! [37], so we evaluated 20 NR3C1 polymorphisms (Table 3) in 74 additional individuals with MetS and compared them with 138 controls.
Table 3.
NR3C1 SNPs investigated through exome analysis.
2.3. Quantitative Pyrosequencing DNA Methylation Assay
We evaluated DNA methylation in the buffy coat in up to 141 controls and 66 individuals with MetS, investigating 11 CpG sites mapped to a CpG island within the NR3C1 1F region, whose differential methylation was previously associated with HPA axis dysregulation. CpG sites were selected according to the standard numbering sites described by Palma-Gudiel et al. [20] and position based on the GRCh38 genomic sequence: 35 (5:143404075), 36 (5:143404073), 37 (5:143404063), 38 (5:143404057), 39 (5:143404043), 40 (5:143404020), 43 (5:143403983), 44 (5:143403976), 45 (5:143403973), 46 (5:143403967), and 47 (5:143403964) (Figure 1). The bisulfite conversion of genomic DNA was performed using an EZ DNA Methylation Kit (Zymo Research, Irvine, CA, USA), following the manufacturer’s recommendations. Amplicons were generated using primers designed using the PyroMark Assay Design Software v. 2.0.1.15 (Qiagen, Hilden, Germany) (amplification primers and sequencing primer 1) or manually designed (sequencing primers 2 and 3) according to the reported recommendations for pyrosequencing primers [38]. Primers are shown in Table S1.
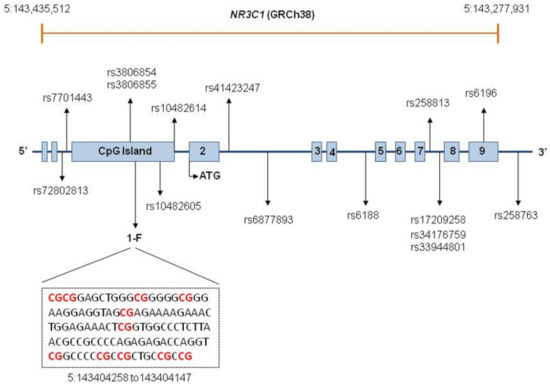
Figure 1.
NR3C1 structure and location of the SNPs comprising the investigated haplotypes and CpGs.
Polymerase chain reaction (PCR) tests were performed in a final volume of 50 µL, containing 25 ng of bisulfite-treated genomic DNA, 0.2 mM of each dNTP and 0.2 µM of each PCR primer, 1 U/rxn Taq Platinum (Invitrogen Life Technologies, CA, USA), and 1× CoralLoad PCR buffer (Qiagen, Hilden, Germany). Thermal cycling started at 95 °C for 15 min, followed by 50 cycles, each starting at 95 °C for 40 s; an annealing step at 57 °C for 40 s; and ending at 72 °C (extension step) for 40 s. To confirm amplification and amplicon size, we submitted the amplified fragments to an electrophoretic run on 1% agarose gel, stained with UniSafe Dye® 20,000× (Uniscience do Brasil, SP, Brazil). Subsequently, 40 μL of PCR products were immobilized on streptavidin-coated sepharose beads (GE Healthcare, IL, USA). Pyrosequencing was performed using a PSQ 96 ID Pyrosequencer (Qiagen, Hilden, Germany) with a PyroMark Gold Q96 Reagent Kit (Qiagen, Hilden, Germany), and the methylation percentage for each CpG site was automatically generated using the PyroMark Q96 software v. 2.5.8 (Qiagen, Hilden, Germany) with standard quality control settings.
Exons are represented by boxes and introns are indicated by lines. NR3C1 is composed of eight coding exons, numbered 2–9, and nine first non-coding exons. The first two boxes represent exons 1A and 1I. Exons 1D, 1J, 1E, 1B, 1F, 1C, and 1H are located within a CpG island, represented by a single box. A fragment of the 1F sequence is displayed, with the red color indicating the investigated CpG sites. The positions of SNPs comprising the investigated haplotypes are depicted. Locations of SNPs too close to each other are indicated by one single arrow.
2.4. RNA Extraction, cDNA Synthesis, and RT-qPCR
Total RNA was isolated from the buffy coat with Quick-RNA™ Miniprep Kit Zymo: R1054 (Zymo Research, Irvine, CA, USA), adapted to PAXgene tubes, and reverse-transcribed with a High-Capacity cDNA Reverse Transcription Kit (Applied Biosystems, San Francisco, CA, USA). Gene expression levels were quantified with qPCR using TaqMan probes (Thermo Fisher Scientific, Waltham, MA, USA) for the NR3C1 (assay ID Hs00230818_m1) and glyceraldehyde-3-phosphate dehydrogenase (GAPDH) (assay ID Hs03929097_g1), as an endogenous control gene. All assays were performed in triplicates, and NR3C1 relative mRNA levels were normalized via GAPDH mRNA expression. RT-qPCR was performed using ViiA 7 Real-Time PCR System (Thermo Fisher Scientific, Waltham, MA, USA). Ct values (threshold cycle) were calculated using the ViiA 7 Software v1.3 (Thermo Fisher Scientific, Waltham, MA, USA), and gene expression was calculated using the comparative Ct method 2−ΔΔCt [39]. In this phase of the study, we evaluated 14 MetS individuals and 25 controls.
2.5. Statistical and Bioinformatic Analysis
To check for the false discovery rate, the p-value was corrected for association tests as described below. The corrected p-value is hereinafter referred to as pcorr and was considered statistically significant when lower than 0.05 (pcorr < 0.05).
Binary univariate logistic regression was used to establish independent variables, for which the association tests should be adjusted, using MetS phenotype as the dependent variable. The p-value was adjusted using the Benjamini and Hochberg [40] approach. Predictive variables that achieved pcorr values lower than 0.20 were included in the binary multivariate logistic regression model, carried out using the backward method, in which variables with less significance were removed one at a time from the model until all the present variables were statistically significant. R Statistical Software v4.2.2 [41] was used.
Exome raw data were converted to the Variant Call Format (VCF) and aligned to the reference genome GRCh38/hg38, verifying the quality of the sequencing using the ForestQC software v. 1.1.5.7 [42].
We identified extended SNP haplotypes based on the haplotype block estimation method by Gabriel et al. [43] performed in Haploview 4.1 [44]. As inclusion criteria of variants to reconstruct the haplotypes, only SNPs with MAF higher than 0.10 in the studied Mennonite population were considered (Figure 1). We also used Haploview 4.1 to evaluate linkage disequilibrium (LD) (Figure S1). Phase information about SNP haplotypes was inferred using the ELB algorithm implemented in Arlequin v.3.5.2.2 [45]. Only haplotypes with a frequency higher than 0.10 in Mennonites were included in the genetic association tests.
We obtained allele, genotype, and SNP haplotype frequencies through direct counting and tested genetic associations within the dominant, recessive, and additive models, as well as the hypothesis of the Hardy–Weinberg equilibrium, with PLINK 1.9 software [46]. We further compared the polymorphism and haplotype distribution between the investigated groups using multivariate logistic regression, adjusted for the possible effects of independent variables (age, family environment in childhood, and moderate or vigorous physical activity), performed in R Statistical Software v4.2.2 [41]. The p-value was corrected using the Monte Carlo permutation method for SNP associations and Benjamini and Hochberg correction for haplotype associations. As an effect measure, we used the odds ratio (OR) with 95% confidence interval (CI).
The distributions of polymorphisms and haplotype frequencies between populations were compared using Fisher’s exact test with R Statistical Software v4.2.2. To obtain population polymorphism frequencies, we accessed gnomAD v3.1.2 https://gnomad.broadinstitute.org/ (accessed on 4 March 2023) [47] and ABraOM v2.1 (https://abraom.ib.usp.br/) (accessed on 4 March 2023) [48] databases. Haplotype frequencies in the European population (Utah, USA) were accessed in LD link v5.6.0 (https://ldlink.nci.nih.gov) (accessed on 9 May 2023) [49]. All frequencies were obtained considering the GRCh38 genome version.
NR3C1 methylation levels and gene expression did not follow a normal distribution (tested with Shapiro–Wilk test and D’Agostin–Pearson test), so comparisons were performed with non-parametric tests (Mann–Whitney test and Kruskal–Wallis test), carried out using GraphPad Prism v.5.01 (GraphPad Software, San Diego, CA, USA).
3. Results
The distribution of MetS did not differ between settlements (pcorr = 0.78), sexes (pcorr = 0.39), or urban (CWB) and rural (CWI and CON) environments (pcorr > 0.99) in the univariate analysis. Higher age (OR = 1.05 [95%CI = 1.03–1.07], pcorr < 0.001) and lower familiar warmth in infancy (OR = 1.59 [95%CI = 1.08–2.34], pcorr = 0.019) were independently associated with MetS susceptibility. The family environment in childhood was reported as a simple answer to the question “How was your family environment during childhood?” with three possibilities: warm (lots of affection and hugs), moderate (disciplined), or cold (distant). On the other hand, daily moderate or vigorous physical activity for over 10 min was independently associated with MetS protection (OR = 0.44 [95%CI = 0.26–0.73], pcorr = 0.003). Participants were asked if they perform daily moderate or vigorous activities for at least 10 min without interruption at work, for leisure, sports, exercise, or as part of their activities at home, in the yard, or any other activity that increases their breathing or heart rate, such as cycling, swimming, dancing, aerobics, running, playing sports, carrying weights, doing household chores around the house or yard such as sweeping or jobs such as stacking boxes, using a hoe, sledgehammer, etc. Waist circumference was the most frequent diagnostic parameter, which was observed in all individuals with MetS. Genotypes of controls and patients were distributed according to the predictions of the Hardy–Weinberg equilibrium.
3.1. NR3C1 Polymorphisms and Susceptibility to Metabolic Syndrome
Allele and haplotype frequencies are shown in Table 4 and Table 5. The homozygosis of the rs10482605*C allele was associated with increased MetS susceptibility (OR = 4.74 [95%CI = 1.11–20.29], pcorr = 0.024). Most of the allele frequencies differed from those of the European non-Finish population (15 of 25 SNPs), Amish population (18 of 25 SNPs), and Brazilians (17 of 21 SNPs) (Table S2). We identified three haplotype blocks reconstructed based on linkage disequilibrium between the SNPs and the nine haplotypes with a frequency higher than 0.10 (Figure S2 and Figure S3). Homozygote individuals for the CCT haplotype (formed by rs41423247, rs6877893, and rs258763) showed a higher susceptibility to MetS (OR = 6.02 [95% CI = 1.41–25.62], pcorr = 0.030). Homozygous individuals for the TTCGTTGATT haplotype (formed by rs3806855, rs3806854, rs10482605, rs10482614, rs6188, rs258813, rs33944801, rs34176759, rs17209258, and rs6196) also had an increased probability of developing MetS (OR = 4.74 [95% CI = 1.10–20.28], pcorr = 0.048) (Table 5). Among the evaluated haplotypes, only GCTATTGATC frequency differed from the European population (Utah, USA) (p = 0.0002).
Table 4.
Association test of NR3C1 polymorphisms with MetS.
Table 5.
Frequencies of NR3C1 haplotypes and association assay.
3.2. NR3C1 Methylation and Susceptibility to Metabolic Syndrome
The methylation profile of the CpG sites mapping to NR3C1 1F region did not show a significant association with MetS, neither individually nor when their median levels were considered (Table 6 and Figure S4). We observed that the region encompassing these CpG sites was mostly unmethylated (0% methylation) or presented very low methylation levels.
Table 6.
NR3C1 CpG methylation levels.
3.3. NR3C1 mRNA Expression Levels
NR3C1 mRNA expression levels were evaluated according to the genotypes for both haplotypes associated with MetS in the present study: CCT and TTCGTTGATT. The rs10482605*C/C genotype was also evaluated through this later analysis since all individuals with this genotype presented the TTCGTTGATT haplotype. None of these genotypes were associated with differential mRNA expression levels in any of the comparisons: (a) homozygote individuals relative to heterozygous individuals; (b) homozygote or heterozygote individuals relative to individuals with other genotypes; (c) homozygote individuals relative to individuals with other genotypes; and (d) homozygote individuals relative to individuals neither homozygote nor heterozygote. NR3C1 mRNA expression levels were also compared between MetS individuals and controls, but no association was found (Figure 2).
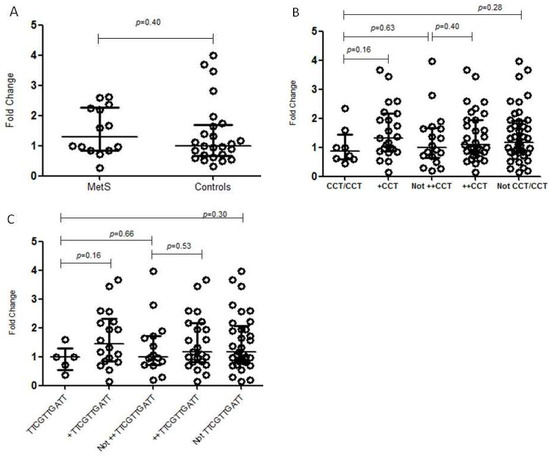
Figure 2.
NR3C1 mRNA expression in the buffy coat, according to different genotypes. The horizontal bars in the clusters indicate the median; p-values were calculated by Mann–Whitney’s test: (A) association between the expression of NR3C1 mRNA and MetS; (B) association between the expression of NR3C1 mRNA and NR3C1 CCT haplotype. +CCT—heterozygote individuals; ++CCT—homozygote or heterozygote individuals; (C) association between the expression of NR3C1 mRNA and NR3C1 TTCGTTGATT haplotype. TTCGTTGATT—homozygotes; +TTCGTTGATT—heterozygote individuals; ++TTCGTTGATT—homozygote or heterozygote individuals.
4. Discussion
The investigation of NR3C1 gene methylation has gained prominence due to its relationship with the regulation of the HPA axis, as well as its association with psychopathologies, and it is still poorly explored for MetS. In contrast, NR3C1 polymorphisms are associated with the comorbidities that constitute MetS, but their association with MetS itself is still unclear. The NR3C1 gene is highly expressed in the brain, and its main transcripts are similarly expressed in brain tissues and whole blood [50]. Thus, methylation and gene expression profiles in the buffy coat probably reflect those in the brain, and may also reflect alterations in the HPA axis [51]. In the present study, we investigated NR3C1 polymorphisms, methylation patterns in CpGs mapped to the 1F region, and their expression in buffy coats from MetS subjects and controls of an isolated population. Interestingly, along with the risk factors known to be associated with MetS susceptibility, such as daily physical activity (protective) and higher age (risk), lower familiar warmth in infancy increased the odds for MetS in this population, reinforcing the possibility that epigenetic markers of HPA axis genes play a role in the response to childhood stress and MetS development. We found two NR3C1 haplotypes and one SNP associated with MetS susceptibility but no differences in its methylation or gene expression levels in leukocytes. Differences in these parameters may rather be found in other tissues directly related to the HPA axis.
The minor allele frequencies of the analyzed SNPs reflect the possible influence of bottlenecks and/or founder effect in our investigated Mennonite population, since most of them differed from other populations, including the European non-Finish, Amish, and Brazilian populations. The SNPs that were associated with MetS susceptibility, alone or in haplotype, occur in regulatory regions with CpG islands, open chromatin histone marks, and transcription factor binding sites. Four SNPs are mapped to the CpG island (rs3806854, rs3806855, rs10482605, and rs10482614) located in the 5’UTR region. Considering the myeloid and lymphoid cell lineages, with the exception of rs258763, the other SNPs occur in regions with enhancers or histone marks associated with transcription activation such as H4K20me1, H3K4me1, H3K4me2, H3K4me3, H3K27ac, and/or H3K9ac, and rs10482605, rs10482614, rs3806854, and rs3806855 bind more than ten regulatory proteins [52]. Three of the polymorphisms have a potential for regulatory role interference, as the minor allele disrupts (rs10482614) or creates (rs258813 and rs3806854) CpG sites, with rs3806854 occurring in intron 1B and therefore potentially susceptible to methylation. In addition, seven of the SNPs were associated with differences in gene expression (eQTL—expression quantitative trait loci) in visceral adipose, brain, and/or cardiovascular tissue, as their minor allele was associated with lower expression in whole blood (rs3806854, rs3806855, and rs10482614), aorta (rs3806854, rs3806855, rs10482614, rs41423247, rs6188, and rs258813), adipose tissue (subcutaneous) (rs41423247), and brain cortex (rs6188 and rs258813). On the other hand, the minor allele of rs6877893 was associated with gene overexpression in the aorta, and rs3806854, rs3806855, and rs10482614 were associated with overexpression in the brain’s substantia nigra [50].
The minor alleles of rs7701443*T>C and rs72802813*C>T, which occur in the same haplotype, were associated with reduced BMI-adjusted hip circumference in Europeans [28]. Nevertheless, we did not find an association of these SNPs or their haplotype with MetS in the Mennonite population.
The rs10482605*C allele is exclusively located within the TTCGTTGATT haplotype. As expected, homozygosity for both was associated with MetS susceptibility. The rs10482605 minor allele has been associated with an increased risk of developing stress-related disorders, such as depression [53]. This allele has been reported to be in linkage disequilibrium with rs6198*G (GR-9β variant), which disrupts an ATTTA motif within the 3′UTR of exon 9β, giving rise to a GTTTA sequence [53]. The AUUUA motifs are known to destabilize mRNA through recognition by RNA binding proteins in AU-rich elements (ARE) that enhance deadenylation and decay, recruiting mRNA degradation machinery [54,55,56,57,58]. AU-rich motifs may also enhance microRNA (miRNA) function in translational repression [59], (but none of the miRNAs whose action on the NR3C1 mRNA was experimentally confirmed so far recognize the sequence containing rs6198) [60]. The disruption of the AUUUA motif is expected to stabilize the mRNA and increase GRβ protein expression, which is also associated with glucocorticoid resistance [32,61,62]. In fact, MetS patients overexpress GRβ in PBMCs, suggesting its involvement in glucocorticoid resistance and HPA dysregulation [12]. Interestingly, both isoforms diverge only in the C-terminal region, influencing translocation to the nucleus and transactivation of other genes. GRβ inhibits the transcriptional activity of GRα through yet poorly understood mechanisms, probably through the formation of inactive heterodimers with GRα, or competition for binding on GREs or binding with coactivators [63,64,65].
The rs41423247 polymorphism, or BclI, is an intronic SNP whose minor allele G has been associated with increased sensitivity to glucocorticoids [29,34]. Furthermore, G/G homozygosity has been associated with an increased risk of developing MetS [29,32,33,34]. In contrast, homozygosity for the minor allele was not observed among Brazilian MetS patients, who also presented reduced glucocorticoid sensitivity [12]. Our results partially agree with the Brazilian study, since we only found a MetS susceptibility association with homozygosity of a haplotype containing the rs41423247 major allele (rs41423247*C/rs6877893*C/rs258763*T) associated with glucocorticoid resistance.
We did not find any difference in NR3C1 global expression levels in individuals with or without homozygosity for the associated alleles (Figure 2). In accordance, Cao-Lei and collaborators [19] also reported no association between the minor allele of rs10482605 and exon 1C promoter activity, while Kumsta et al. [53] found reduced activity in two brain cell lines. Notably, we did not differentiate mRNA isoforms. The detection of subtle yet significant differences may have been possible with an increased sample size. Furthermore, the activity of alternative NR3C1 promoters varies between cell lines in vitro [19], and the investigation of other relevant tissues for MetS might be useful.
Small NR3C1 methylation differences (<10%) have been identified as related to the development of disease phenotypes [25], with differences in methylation in the 1F region of the NR3C1 gene being widely associated with psychopathologies, mainly correlated with early life adverse events or in childhood [16,21,23]. Changes in methylation patterns are more susceptible to stressful events experienced in these periods [23], also in animal models [24]. In our study, we indeed observed an association between MetS susceptibility and lower familial warmth in infancy, regardless of other factors. However, there were no methylation differences between the buffy coats of individuals with and without MetS in the CpGs evaluated for the 1F region, even though the expression of these genes is similar in blood and hypothalamus. Although no association studies of MetS with NR3C1 differential methylation were found in the literature, variations in its methylation patterns have been observed for related comorbidities, such as cardiovascular diseases [22], subclinical arteriosclerosis (hypermethylation of the 1F promoter, in a study with monozygotic twins) [66], overweight (hypomethylation of the 1F region, CpGs 40 to 47) [51], unfavorable prognosis for coronary acute syndrome in individuals with depression (hypermethylation of exon 1F) [67], blood pressure (hypermethylation of 1F and 1H promoters associated with lower blood pressure) [68], and a positive association between methylation and glucose levels as well as insulin resistance [69]. Considering the multiple alternative first exons and their variability in tissue-specific expression, and that each of these exons has its own active promoter, DNA methylation and other epigenetic mechanisms should be evaluated in other regions. Also, measuring methylation patterns in cells other than leukocytes, especially those directly involved in the HPA axis, would be desirable.
5. Conclusions
With this study, we reinforce the potential association of NR3C1 polymorphisms with MetS development, probably due to HPA axis dysregulation. Future research should evaluate haplotypes with rs10482605 and rs6198 polymorphisms in admixed populations and explore their impact on GRα and GRβ expression, to determine their functional role in glucocorticoid resistance. Although we did not find any methylation difference in the investigated CpG sites, our findings do not rule out this epigenetic mechanism as a regulator of NR3C1 expression in other tissues or of other genes, since lower familial warmth in infancy was independently associated with MetS susceptibility in the Mennonite population.
Supplementary Materials
The following supporting information can be downloaded at: https://www.mdpi.com/article/10.3390/genes14091805/s1, Figure S1: Linkage disequilibrium for NR3C1 SNPs investigated in this study to haplotype construction (MAF > 0.10); Figure S2: Linkage disequilibrium and haplotype blocks for NR3C1 SNPs sequenced with iPLEX MassARRAY; Figure S3: Linkage disequilibrium and haplotype blocks for NR3C1 SNPs obtained from exome sequencing and with MAF > 0.10; Figure S4: NR3C1 CpG methylation levels; Table S1: PCR and pyrosequencing primers; Table S2: Allele distributions of NR3C1 polymorphisms investigated in this study.
Author Contributions
Conceptualization, A.B.W.B.; formal analysis, K.L.K., A.L.S.M., E.D.A., S.C.S.-L., V.B.-B.H. and A.B.W.B.; funding acquisition, A.B.W.B.; investigation, K.L.K.; methodology, K.L.K., A.L.S.M., S.C.S.-L., I.D.B., C.E.d.L.e.S., P.I.d.S., L.C.O., A.B.H., J.E.H., F.L.L., A.R.S., T.-J.B. and V.B.-B.H.; project administration, A.B.W.B.; resources, A.B.W.B., A.B.H., J.E.H., S.C.S.-L., A.R.S., A.F. and L.F.R.P.; supervision, G.C.K., S.C.S.-L. and A.B.W.B.; writing—original draft preparation, K.L.K.; writing—review and editing, K.L.K., G.C.K., S.C.S.-L., A.B.W.B., V.B.-B.H. and E.D.A. All authors have read and agreed to the published version of the manuscript.
Funding
This research was funded by Conselho Nacional de Desenvolvimento Científico e Tecnológico (CNPq) and Empresa Brasileira de Serviços Hospitalares (Ebserh) grant numbers 423317/2021-0 and 313741/2021-2 (8520137521584230), Research for the United Health SUS System (PPSUS-MS), CNPq, Fundação Araucária and SESA-PR, Protocol Nº: SUS2020131000106, and Coordenação de Aperfeiçoamento de Pessoal de Nível Superior (CAPES/PROAP – Finance Code 001). A.B.W.B. receives CNPq research productivity scholarships (protocols 314288/2018-0 and 313741/2021).
Institutional Review Board Statement
The study was conducted according to the guidelines of the Declaration of Helsinki and approved by the Ethics Committee of the Health Sciences Sector of the Federal University of Paraná (CEP SCS-UFPR) with the following Certificate of Presentation of Ethical Appreciation: 55528222.9.0000.0102 and 55297916.6.0000.0102 (protocol numbers: 1.545.447 on 16 May 2016, updated in 2.204.113 on 7 August 2017 and again in 5.215.924 on 28 January 2022).
Informed Consent Statement
Informed consent was obtained from all subjects involved in the study.
Data Availability Statement
The data presented in this study are available upon request from the corresponding author. The data are not publicly available due to privacy restrictions given by the General Law of Data Protection (LGPD) in Brazil.
Acknowledgments
We deeply thank all Mennonite participants for volunteering for this study, and the staff of the Human Molecular Genetics Laboratory (UFPR), for assistance in blood collection, interviews, and DNA/RNA extraction. We are also grateful to Monique de Souza Almeida Lopes, from INCA, for technical assistance in pyrosequencing. We extend our thanks to Danielle Malheiros Ferreira, for donating the material used for one experiment. The Genotype-Tissue Expression (GTEx) Project was supported by the Common Fund of the Office of the Director of the National Institutes of Health, and by NCI, NHGRI, NHLBI, NIDA, NIMH, and NINDS. eQTL and sQTL effects of genetic variants associated in this study were obtained from https://gtexportal.org/home/snp/ (accessed on 7 June 2023).
Conflicts of Interest
The authors declare no conflict of interest.
References
- Lakka, H.-M.; Laaksonen, D.E.; Lakka, T.A.; Niskanen, L.K.; Kumpusalo, E.; Tuomilehto, J.; Salonen, J.T. The Metabolic Syndrome and Total and Cardiovascular Disease Mortality in Middle-Aged Men. JAMA 2002, 288, 2709. [Google Scholar] [CrossRef] [PubMed]
- World Health Organization (WHO). Noncommunicable Diseases Data Portal; World Health Organization: Geneva, Switzerland, 2019. [Google Scholar]
- Moraitis, A.G.; Block, T.; Nguyen, D.; Belanoff, J.K. The Role of Glucocorticoid Receptors in Metabolic Syndrome and Psychiatric Illness. J. Steroid Biochem. Mol. Biol. 2017, 165, 114–120. [Google Scholar] [CrossRef]
- Bellavance, M.-A.; Rivest, S. The HPA—Immune Axis and the Immunomodulatory Actions of Glucocorticoids in the Brain. Front. Immunol. 2014, 5, 136. [Google Scholar] [CrossRef] [PubMed]
- Lopes, F.L.; Hou, L.; Boldt, A.B.W.; Kassem, L.; Alves, V.M.; Nardi, A.E.; McMahon, F.J. Finding Rare, Disease-Associated Variants in Isolated Groups: Potential Advantages of Mennonite Populations. Hum. Biol. 2016, 88, 109–120. [Google Scholar] [CrossRef] [PubMed]
- Oliveira, L.C.; Dornelles, A.C.; Nisihara, R.M.; Bruginski, E.R.D.; dos Santos, P.I.; Cipolla, G.A.; Boschmann, S.E.; Messias-Reason, I.J.d.; Campos, F.R.; Petzl-Erler, M.L.; et al. The Second Highest Prevalence of Celiac Disease Worldwide: Genetic and Metabolic Insights in Southern Brazilian Mennonites. Genes 2023, 14, 1026. [Google Scholar] [CrossRef]
- Argentieri, M.A.; Nagarajan, S.; Seddighzadeh, B.; Baccarelli, A.A.; Shields, A.E. Epigenetic Pathways in Human Disease: The Impact of DNA Methylation on Stress-Related Pathogenesis and Current Challenges in Biomarker Development. eBioMedicine 2017, 18, 327–350. [Google Scholar] [CrossRef]
- Zannas, A.S.; Wiechmann, T.; Gassen, N.C.; Binder, E.B. Gene–Stress–Epigenetic Regulation of FKBP5: Clinical and Translational Implications. Neuropsychopharmacology 2016, 41, 261–274. [Google Scholar] [CrossRef]
- Gerber, A.N.; Newton, R.; Sasse, S.K. Repression of Transcription by the Glucocorticoid Receptor: A Parsimonious Model for the Genomics Era. J. Biol. Chem. 2021, 296, 100687. [Google Scholar] [CrossRef]
- Alberti, K.G.M.M.; Eckel, R.H.; Grundy, S.M.; Zimmet, P.Z.; Cleeman, J.I.; Donato, K.A.; Fruchart, J.-C.; James, W.P.T.; Loria, C.M.; Smith, S.C. Harmonizing the Metabolic Syndrome: A Joint Interim Statement of the International Diabetes Federation Task Force on Epidemiology and Prevention; National Heart, Lung, and Blood Institute; American Heart Association; World Heart Federation; International Atherosclerosis Society; and International Association for the Study of Obesity. Circulation 2009, 120, 1640–1645. [Google Scholar] [CrossRef]
- De Siqueira Valadares, L.T.; De Souza, L.S.B.; Salgado Júnior, V.A.; De Freitas Bonomo, L.; De Macedo, L.R.; Silva, M. Prevalence of Metabolic Syndrome in Brazilian Adults in the Last 10 Years: A Systematic Review and Meta-Analysis. BMC Public Health 2022, 22, 327. [Google Scholar] [CrossRef]
- Martins, C.S.; Elias, D.; Colli, L.M.; Couri, C.E.; Souza, M.C.L.A.; Moreira, A.C.; Foss, M.C.; Elias, L.L.K.; De Castro, M. HPA Axis Dysregulation, NR3C1 Polymorphisms and Glucocorticoid Receptor Isoforms Imbalance in Metabolic Syndrome. Diabetes Metab. Res. Rev. 2017, 33, e2842. [Google Scholar] [CrossRef] [PubMed]
- Michailidou, Z.; Carter, R.N.; Marshall, E.; Sutherland, H.G.; Brownstein, D.G.; Owen, E.; Cockett, K.; Kelly, V.; Ramage, L.; Al-Dujaili, E.a.S.; et al. Glucocorticoid Receptor Haploinsufficiency Causes Hypertension and Attenuates Hypothalamic-Pituitary-Adrenal Axis and Blood Pressure Adaptions to High-Fat Diet. FASEB J. 2008, 22, 3896–3907. [Google Scholar] [CrossRef] [PubMed]
- Pasquali, R.; Vicennati, V.; Cacciari, M.; Pagotto, U. The Hypothalamic-Pituitary-Adrenal Axis Activity in Obesity and the Metabolic Syndrome. Ann. N. Y. Acad. Sci. 2006, 1083, 111–128. [Google Scholar] [CrossRef]
- Motavalli, R.; Majidi, T.; Pourlak, T.; Abediazar, S.; Shoja, M.M.; Zununi Vahed, S.; Etemadi, J. The Clinical Significance of the Glucocorticoid Receptors: Genetics and Epigenetics. J. Steroid Biochem. Mol. Biol. 2021, 213, 105952. [Google Scholar] [CrossRef] [PubMed]
- Wadji, D.L.; Tandon, T.; Ketcha Wanda, G.J.M.; Wicky, C.; Dentz, A.; Hasler, G.; Morina, N.; Martin-Soelch, C. Child Maltreatment and NR3C1 Exon 1F Methylation, Link with Deregulated Hypothalamus-Pituitary-Adrenal Axis and Psychopathology: A Systematic Review. Child Abus. Negl. 2021, 122, 105304. [Google Scholar] [CrossRef] [PubMed]
- Kadmiel, M.; Cidlowski, J.A. Glucocorticoid Receptor Signaling in Health and Disease. Trends Pharmacol. Sci. 2013, 34, 518–530. [Google Scholar] [CrossRef]
- Turner, J.D.; Muller, C.P. Structure of the Glucocorticoid Receptor (NR3C1) Gene 5′ Untranslated Region: Identification, and Tissue Distribution of Multiple New Human Exon 1. J. Mol. Endocrinol. 2005, 35, 283–292. [Google Scholar] [CrossRef][Green Version]
- Cao-Lei, L.; Leija, S.C.; Kumsta, R.; Wüst, S.; Meyer, J.; Turner, J.D.; Muller, C.P. Transcriptional Control of the Human Glucocorticoid Receptor: Identification and Analysis of Alternative Promoter Regions. Hum. Genet. 2011, 129, 533–543. [Google Scholar] [CrossRef]
- Palma-Gudiel, H.; Córdova-Palomera, A.; Leza, J.C.; Fañanás, L. Glucocorticoid Receptor Gene (NR3C1) Methylation Processes as Mediators of Early Adversity in Stress-Related Disorders Causality: A Critical Review. Neurosci. Biobehav. Rev. 2015, 55, 520–535. [Google Scholar] [CrossRef]
- Holmes, L.; Shutman, E.; Chinaka, C.; Deepika, K.; Pelaez, L.; Dabney, K.W. Aberrant Epigenomic Modulation of Glucocorticoid Receptor Gene (NR3C1) in Early Life Stress and Major Depressive Disorder Correlation: Systematic Review and Quantitative Evidence Synthesis. Int. J. Environ. Res. Public Health 2019, 16, 4280. [Google Scholar] [CrossRef]
- Vidrascu, E.M.; Bashore, A.C.; Howard, T.D.; Moore, J.B. Effects of Early- and Mid-Life Stress on DNA Methylation of Genes Associated with Subclinical Cardiovascular Disease and Cognitive Impairment: A Systematic Review. BMC Med. Genet. 2019, 20, 39. [Google Scholar] [CrossRef]
- Berretta, E.; Guida, E.; Forni, D.; Provenzi, L. Glucocorticoid Receptor Gene (NR3C1) Methylation during the First Thousand Days: Environmental Exposures and Developmental Outcomes. Neurosci. Biobehav. Rev. 2021, 125, 493–502. [Google Scholar] [CrossRef] [PubMed]
- Weaver, I.C.G.; Cervoni, N.; Champagne, F.A.; D’Alessio, A.C.; Sharma, S.; Seckl, J.R.; Dymov, S.; Szyf, M.; Meaney, M.J. Epigenetic Programming by Maternal Behavior. Nat. Neurosci. 2004, 7, 847–854. [Google Scholar] [CrossRef] [PubMed]
- Leenen, F.A.D.; Muller, C.P.; Turner, J.D. DNA Methylation: Conducting the Orchestra from Exposure to Phenotype? Clin. Epigenet. 2016, 8, 92. [Google Scholar] [CrossRef] [PubMed]
- Otte, C.; Wüst, S.; Zhao, S.; Pawlikowska, L.; Kwok, P.-Y.; Whooley, M.A. Glucocorticoid Receptor Gene and Depression in Patients with Coronary Heart Disease: The Heart and Soul Study—2009 Curt Richter Award Winner. Psychoneuroendocrinology 2009, 34, 1574–1581. [Google Scholar] [CrossRef] [PubMed]
- Zhu, Z.; Guo, Y.; Shi, H.; Liu, C.-L.; Panganiban, R.A.; Chung, W.; O’Connor, L.J.; Himes, B.E.; Gazal, S.; Hasegawa, K.; et al. Shared Genetic and Experimental Links between Obesity-Related Traits and Asthma Subtypes in UK Biobank. J. Allergy Clin. Immunol. 2020, 145, 537–549. [Google Scholar] [CrossRef] [PubMed]
- Christakoudi, S.; Evangelou, E.; Riboli, E.; Tsilidis, K.K. GWAS of Allometric Body-Shape Indices in UK Biobank Identifies Loci Suggesting Associations with Morphogenesis, Organogenesis, Adrenal Cell Renewal and Cancer. Sci. Rep. 2021, 11, 10688. [Google Scholar] [CrossRef]
- van Rossum, E.F.C.; Koper, J.W.; van den Beld, A.W.; Uitterlinden, A.G.; Arp, P.; Ester, W.; Janssen, J.A.M.J.L.; Brinkmann, A.O.; de Jong, F.H.; Grobbee, D.E.; et al. Identification of the BclI Polymorphism in the Glucocorticoid Receptor Gene: Association with Sensitivity to Glucocorticoids in Vivo and Body Mass Index. Clin. Endocrinol. 2003, 59, 585–592. [Google Scholar] [CrossRef]
- Srivastava, N.; Prakash, J.; Lakhan, R.; Agarwal, C.G.; Pant, D.C.; Mittal, B. Influence of Bcl-1 Gene Polymorphism of Glucocorticoid Receptor Gene (NR3C1, Rs41423247) on Blood Pressure, Glucose in Northern Indians. Ind. J. Clin. Biochem. 2011, 26, 125–130. [Google Scholar] [CrossRef][Green Version]
- Moreira, R.P.P.; Gomes, L.G.; Mendonca, B.B.; Bachega, T.A.S.S. Impact of Glucocorticoid Receptor Gene Polymorphisms on the Metabolic Profile of Adult Patients with the Classical Form of 21-Hydroxylase Deficiency. PLoS ONE 2012, 7, e44893. [Google Scholar] [CrossRef]
- Kaya, Z.; Caglayan, S.; Akkiprik, M.; Aral, C.; Ozisik, G.; Ozata, M.; Ozer, A. Impact of Glucocorticoid Receptor Gene (NR3C1) Polymorphisms in Turkish Patients with Metabolic Syndrome. J. Endocrinol. Investig. 2016, 39, 557–566. [Google Scholar] [CrossRef] [PubMed]
- Yan, Y.-X.; Dong, J.; Zhang, J.; Liu, F.; Wang, W.; Zhang, L.; He, Y. Polymorphisms in NR3C1 Gene Associated with Risk of Metabolic Syndrome in a Chinese Population. Endocrine 2014, 47, 740–748. [Google Scholar] [CrossRef] [PubMed]
- Rosmond, R.; Holm, G. A 5-Year Follow-up Study of 3 Polymorphisms in the Human Glucocorticoid Receptor Gene in Relation to Obesity, Hypertension, and Diabetes. J. Cardiometab. Syndr. 2008, 3, 132–135. [Google Scholar] [CrossRef]
- Instituto Brasileiro De Geografia E Estatística (IBGE). Pesquisa Nacional de Saúde 2013: Percepção Do Estado de Saúde, Estilos de Vida e Doenças Crônicas; Instituto Brasileiro De Geografia E Estatística (IBGE): Rio de Janeiro, Brazil, 2014. [Google Scholar]
- The 1000 Genomes Project Consortium. A Map of Human Genome Variation from Population-Scale Sequencing. Nature 2010, 467, 1061–1073. [Google Scholar] [CrossRef]
- McLaren, W.; Gil, L.; Hunt, S.E.; Riat, H.S.; Ritchie, G.R.S.; Thormann, A.; Flicek, P.; Cunningham, F. The Ensembl Variant Effect Predictor. Genome Biol. 2016, 17, 122. [Google Scholar] [CrossRef]
- Tost, J.; Gut, I.G. DNA Methylation Analysis by Pyrosequencing. Nat. Protoc. 2007, 2, 2265–2275. [Google Scholar] [CrossRef]
- Livak, K.J.; Schmittgen, T.D. Analysis of Relative Gene Expression Data Using Real-Time Quantitative PCR and the 2(-Delta Delta C(T)) Method. Methods 2001, 25, 402–408. [Google Scholar] [CrossRef]
- Benjamini, Y.; Hochberg, Y. Controlling the False Discovery Rate: A Practical and Powerful Approach to Multiple Testing. JR Stat. Soc. 1995, 57, 289–300. [Google Scholar] [CrossRef]
- R Core Team. R: A Language and Environment for Statistical Computing; R Core Team: Vienna, Austria, 2022. [Google Scholar]
- Li, J.; Jew, B.; Zhan, L.; Hwang, S.; Coppola, G.; Freimer, N.B.; Sul, J.H. ForestQC: Quality Control on Genetic Variants from next-Generation Sequencing Data Using Random Forest. PLoS Comput. Biol. 2019, 15, e1007556. [Google Scholar] [CrossRef]
- Gabriel, S.B.; Schaffner, S.F.; Nguyen, H.; Moore, J.M.; Roy, J.; Blumenstiel, B.; Higgins, J.; DeFelice, M.; Lochner, A.; Faggart, M.; et al. The Structure of Haplotype Blocks in the Human Genome. Science 2002, 296, 2225–2229. [Google Scholar] [CrossRef]
- Barrett, J.; Fry, B.; Maller, J.; Daly, M. HAPLOVIEW: Analysis and Visualization of LD and Haplotype Maps. Bioinformatics 2005, 21, 263–265. [Google Scholar] [CrossRef] [PubMed]
- Excoffier, L.; Lischer, H.E.L. Arlequin Suite Ver 3.5: A New Series of Programs to Perform Population Genetics Analyses under Linux and Windows. Mol. Ecol. Resour. 2010, 10, 564–567. [Google Scholar] [CrossRef] [PubMed]
- Purcell, S.; Neale, B.; Todd-Brown, K.; Thomas, L.; Ferreira, M.A.R.; Bender, D.; Maller, J.; Sklar, P.; de Bakker, P.I.W.; Daly, M.J.; et al. PLINK: A Tool Set for Whole-Genome Association and Population-Based Linkage Analyses. Am. J. Hum. Genet. 2007, 81, 559–575. [Google Scholar] [CrossRef] [PubMed]
- Karczewski, K.J.; Francioli, L.C.; Tiao, G.; Cummings, B.B.; Alföldi, J.; Wang, Q.; Collins, R.L.; Laricchia, K.M.; Ganna, A.; Birnbaum, D.P.; et al. The Mutational Constraint Spectrum Quantified from Variation in 141,456 Humans. Nature 2020, 581, 434–443. [Google Scholar] [CrossRef] [PubMed]
- Naslavsky, M.S.; Scliar, M.O.; Yamamoto, G.L.; Wang, J.Y.T.; Zverinova, S.; Karp, T.; Nunes, K.; Ceroni, J.R.M.; de Carvalho, D.L.; da Silva Simões, C.E.; et al. Whole-Genome Sequencing of 1,171 Elderly Admixed Individuals from Brazil. Nat. Commun. 2022, 13, 1004. [Google Scholar] [CrossRef]
- Machiela, M.J.; Chanock, S.J. LDlink: A Web-Based Application for Exploring Population-Specific Haplotype Structure and Linking Correlated Alleles of Possible Functional Variants. Bioinformatics 2015, 31, 3555–3557. [Google Scholar] [CrossRef]
- The GTEx Consortium. The GTEx Consortium atlas of genetic regulatory effects across human tissues. Science 2020, 369, 1318–1330. [Google Scholar] [CrossRef]
- De Assis Pinheiro, J.; Freitas, F.V.; Borçoi, A.R.; Mendes, S.O.; Conti, C.L.; Arpini, J.K.; Dos Santos Vieira, T.; De Souza, R.A.; Dos Santos, D.P.; Barbosa, W.M.; et al. Alcohol Consumption, Depression, Overweight and Cortisol Levels as Determining Factors for NR3C1 Gene Methylation. Sci. Rep. 2021, 11, 6768. [Google Scholar] [CrossRef]
- Ullah, Z.; Oscanoa, J.; Wang, J.; Nagano, A.; Lemoine, N.; Chelala, C. SNPnexus: Assessing the Functional Relevance of Genetic Variation to Facilitate the Promise of Precision Medicine. Nucleic Acids Res. 2018, 46, W109–W113. [Google Scholar] [CrossRef]
- Kumsta, R.; Moser, D.; Streit, F.; Koper, J.W.; Meyer, J.; Wüst, S. Characterization of a Glucocorticoid Receptor Gene (GR, NR3C1) Promoter Polymorphism Reveals Functionality and Extends a Haplotype with Putative Clinical Relevance. Am. J. Med. Genet. 2009, 150B, 476–482. [Google Scholar] [CrossRef]
- Myer, V.E. Identification of HuR as a Protein Implicated in AUUUA-Mediated MRNA Decay. EMBO J. 1997, 16, 2130–2139. [Google Scholar] [CrossRef]
- Lai, W.S.; Carballo, E.; Strum, J.R.; Kennington, E.A.; Phillips, R.S.; Blackshear, P.J. Evidence That Tristetraprolin Binds to AU-Rich Elements and Promotes the Deadenylation and Destabilization of Tumor Necrosis Factor alpha MRNA. Mol. Cell. Biol. 1999, 19, 4311–4323. [Google Scholar] [CrossRef]
- Wilson, G.M.; Brewer, G. Identification and Characterization of Proteins Binding A + U-Rich Elements. Methods 1999, 17, 74–83. [Google Scholar] [CrossRef] [PubMed]
- Sarkar, B.; Xi, Q.; He, C.; Schneider, R.J. Selective Degradation of AU-Rich MRNAs Promoted by the P37 AUF1 Protein Isoform. Mol. Cell. Biol. 2003, 23, 6685–6693. [Google Scholar] [CrossRef] [PubMed]
- Gherzi, R.; Lee, K.-Y.; Briata, P.; Wegmüller, D.; Moroni, C.; Karin, M.; Chen, C.-Y. A KH Domain RNA Binding Protein, KSRP, Promotes ARE-Directed MRNA Turnover by Recruiting the Degradation Machinery. Mol. Cell 2004, 14, 571–583. [Google Scholar] [CrossRef]
- Sun, G.; Li, H.; Rossi, J.J. Sequence Context Outside the Target Region Influences the Effectiveness of MiR-223 Target Sites in the RhoB 3′UTR. Nucleic Acids Res. 2010, 38, 239–252. [Google Scholar] [CrossRef] [PubMed]
- Bruno, A.E.; Li, L.; Kalabus, J.L.; Pan, Y.; Yu, A.; Hu, Z. MiRdSNP: A Database of Disease-Associated SNPs and MicroRNA Target Sites on 3′UTRs of Human Genes. BMC Genom. 2012, 13, 44. [Google Scholar] [CrossRef] [PubMed]
- Derijk, R.H.; Schaaf, M.J.M.; Turner, G.; Datson, N.A.; Vreugdenhil, E.; Cidlowski, J.; Kloet, E.R.D.; Emery, P.; Sternberg, E.M.; Detera-Wadleigh, S.D. A Human Glucocorticoid Receptor Gene Variant That Increases the Stability of the Glucocorticoid Receptor SS-Isoform MRNA Is Associated with Rheumatoid Arthritis. J. Rheumatol. 2001, 28, 2383–2388. [Google Scholar]
- Schaaf, M.J.M.; Cidlowski, J.A. AUUUA Motifs in the 3′UTR of Human Glucocorticoid Receptor α and β MRNA Destabilize MRNA and Decrease Receptor Protein Expression. Steroids 2002, 67, 627–636. [Google Scholar] [CrossRef] [PubMed]
- Bamberger, C.M.; Bamberger, A.M.; De Castro, M.; Chrousos, G.P. Glucocorticoid Receptor beta, a Potential Endogenous Inhibitor of Glucocorticoid Action in Humans. J. Clin. Investig. 1995, 95, 2435–2441. [Google Scholar] [CrossRef]
- Charmandari, E.; Chrousos, G.P.; Ichijo, T.; Bhattacharyya, N.; Vottero, A.; Souvatzoglou, E.; Kino, T. The Human Glucocorticoid Receptor (HGR) β Isoform Suppresses the Transcriptional Activity of HGRα by Interfering with Formation of Active Coactivator Complexes. Mol. Endocrinol. 2005, 19, 52–64. [Google Scholar] [CrossRef] [PubMed]
- Ramos-Ramírez, P.; Tliba, O. Glucocorticoid Receptor β (GRβ): Beyond Its Dominant-Negative Function. Int. J. Mol. Sci. 2021, 22, 3649. [Google Scholar] [CrossRef] [PubMed]
- Zhao, J.; An, Q.; Goldberg, J.; Quyyumi, A.A.; Vaccarino, V. Promoter Methylation of Glucocorticoid Receptor Gene Is Associated with Subclinical Atherosclerosis: A Monozygotic Twin Study. Atherosclerosis 2015, 242, 71–76. [Google Scholar] [CrossRef] [PubMed][Green Version]
- Kang, H.-J.; Stewart, R.; Kim, J.-W.; Kim, S.-W.; Shin, I.-S.; Kim, M.-C.; Hong, Y.J.; Ahn, Y.; Shin, M.-G.; Jeong, M.H.; et al. Synergistic Effects of Depression and NR3C1 Methylation on Prognosis of Acute Coronary Syndrome. Sci. Rep. 2020, 10, 5519. [Google Scholar] [CrossRef]
- Li-Tempel, T.; Larra, M.F.; Sandt, E.; Mériaux, S.B.; Schote, A.B.; Schächinger, H.; Muller, C.P.; Turner, J.D. The Cardiovascular and Hypothalamus-Pituitary-Adrenal Axis Response to Stress Is Controlled by Glucocorticoid Receptor Sequence Variants and Promoter Methylation. Clin. Epigenet. 2016, 8, 12. [Google Scholar] [CrossRef]
- de Souza, M.L.M.; Borçoi, A.R.; Dutra, B.A.B.; Dos Santos Vieira, T.; Mendes, S.O.; Moreno, I.A.A.; Quaioto, B.R.; Olinda, A.S.; Cunha, E.R.; Freitas, F.V.; et al. Lifestyle and NR3C1 Exon 1F Gene Methylation Is Associated with Changes in Glucose Levels and Insulin Resistance. Life Sci. 2022, 309, 120940. [Google Scholar] [CrossRef]
Disclaimer/Publisher’s Note: The statements, opinions and data contained in all publications are solely those of the individual author(s) and contributor(s) and not of MDPI and/or the editor(s). MDPI and/or the editor(s) disclaim responsibility for any injury to people or property resulting from any ideas, methods, instructions or products referred to in the content. |
© 2023 by the authors. Licensee MDPI, Basel, Switzerland. This article is an open access article distributed under the terms and conditions of the Creative Commons Attribution (CC BY) license (https://creativecommons.org/licenses/by/4.0/).