
Dynamic Changes in the Global Transcriptome of Postnatal Skeletal Muscle in Different Sheep
 , and
, and 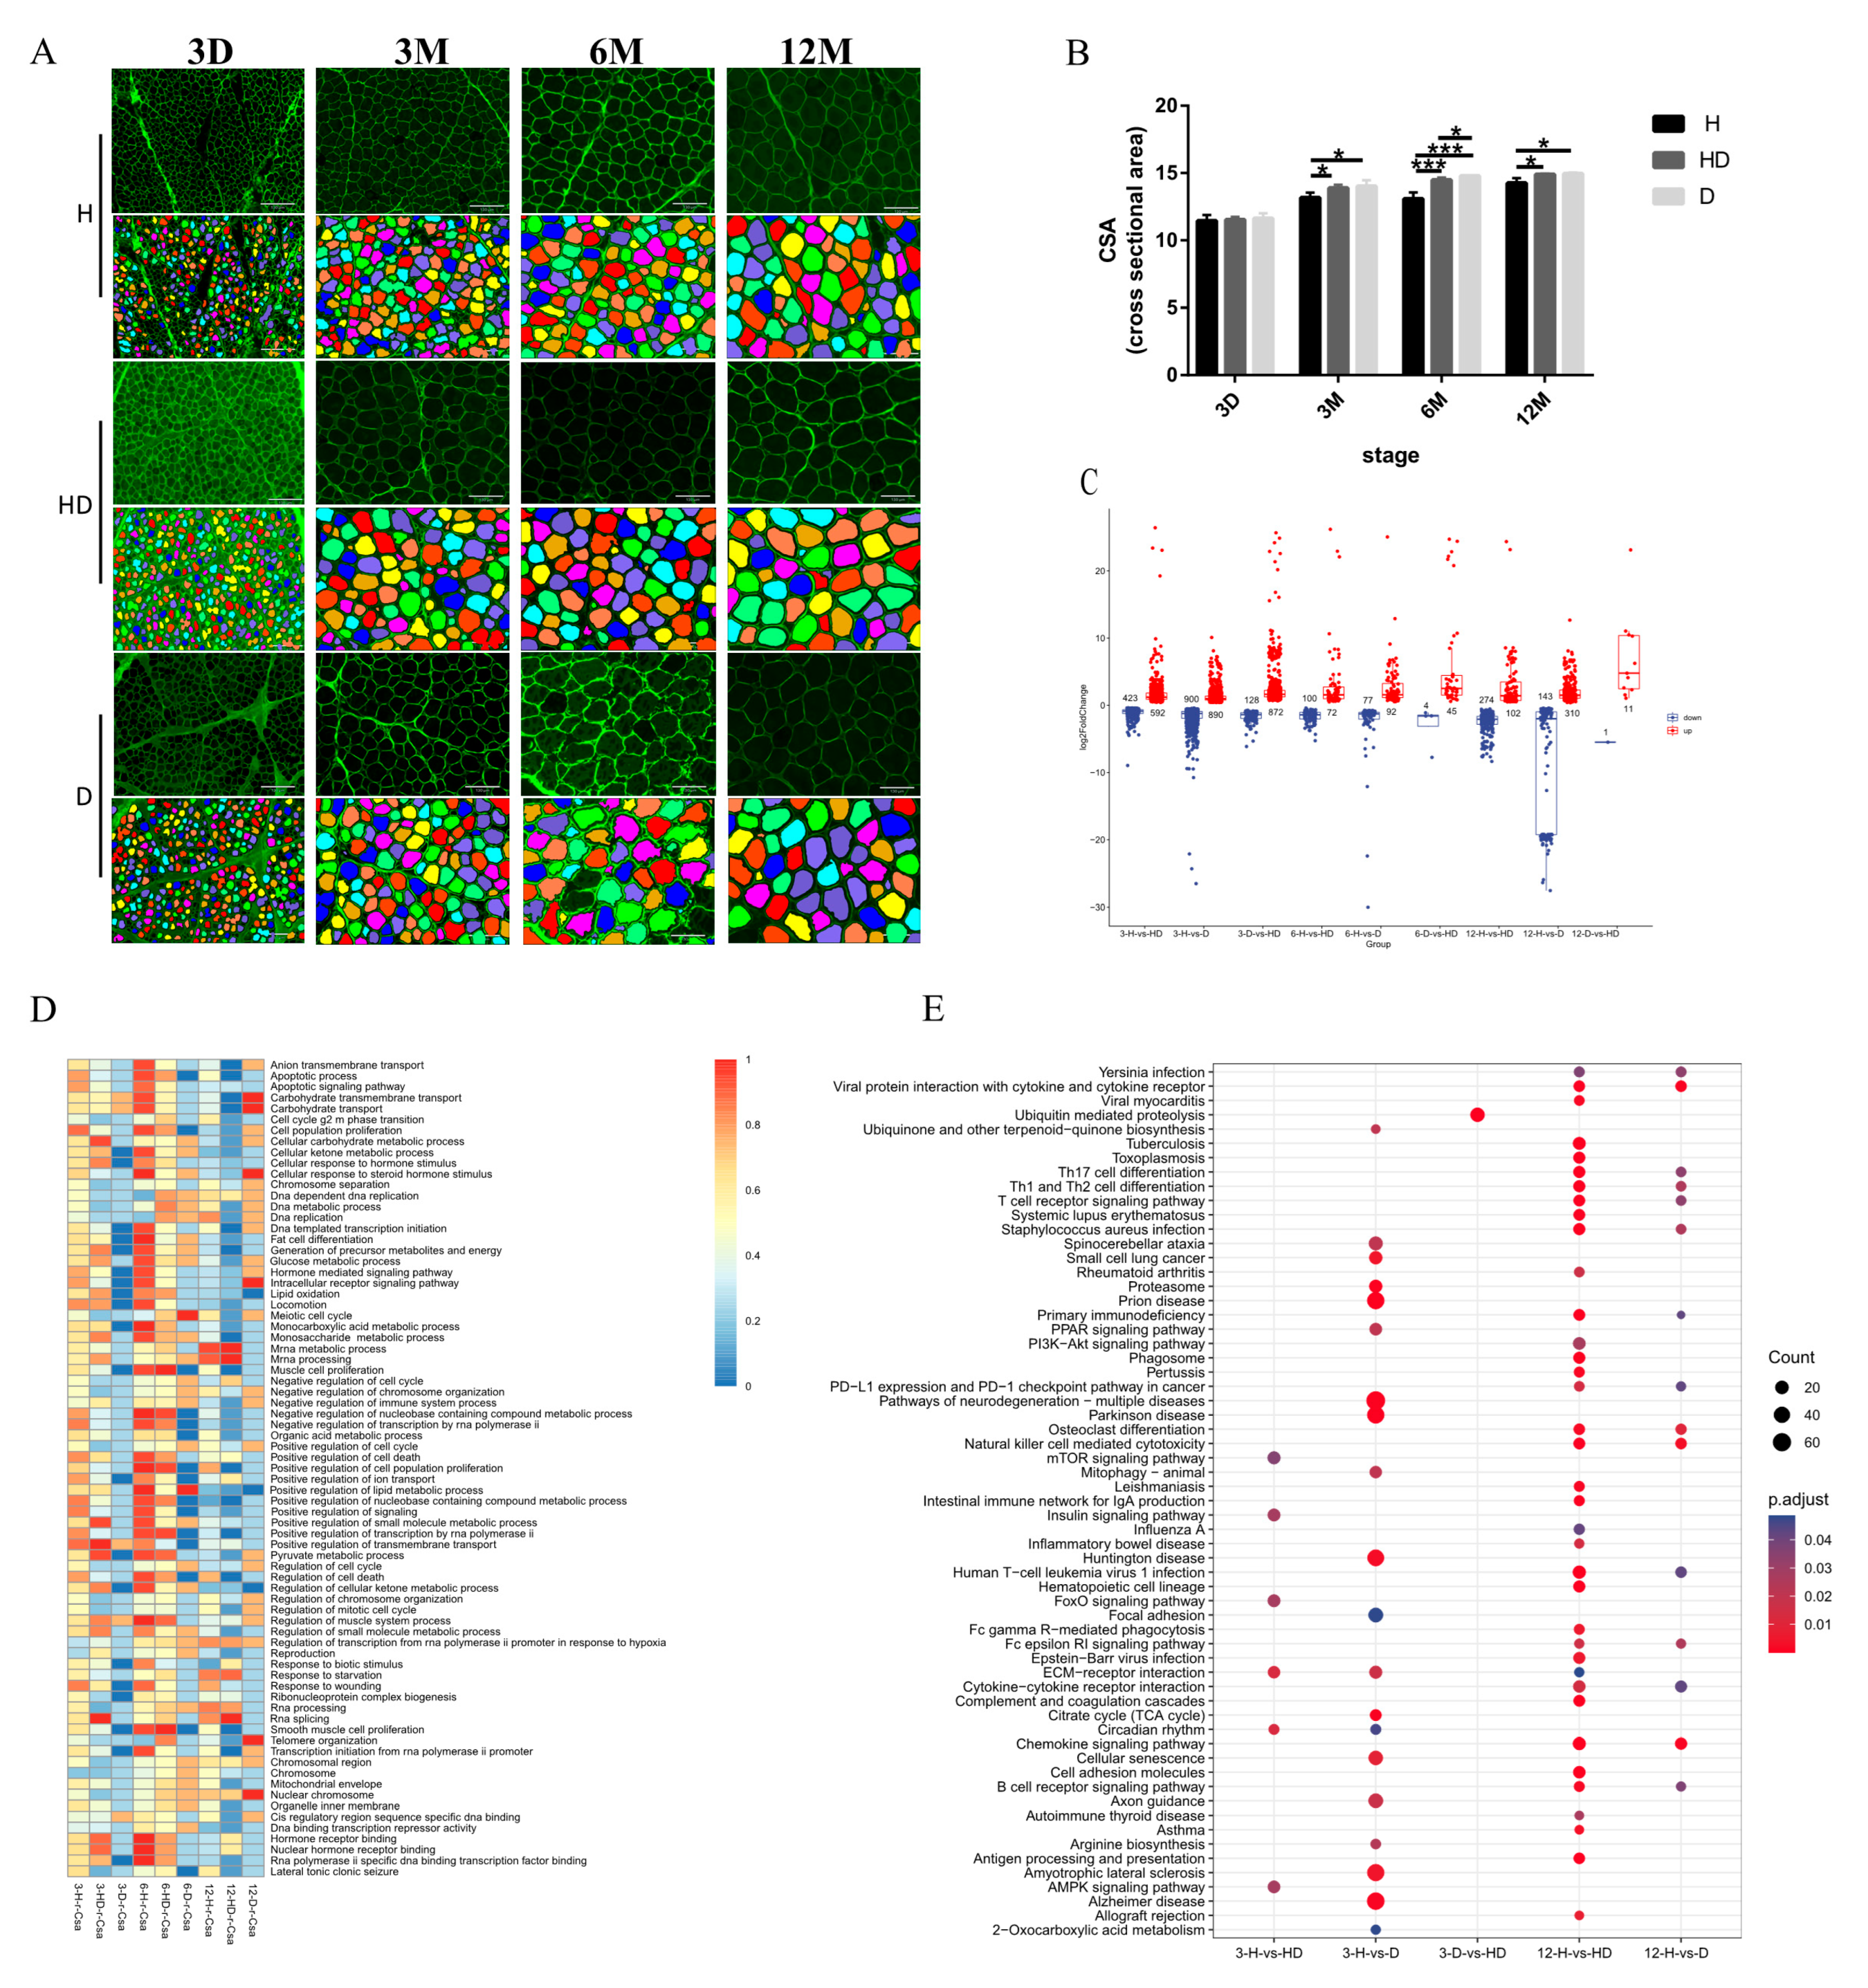
Abstract
1. Introduction
2. Materials and Methods
2.1. Animals and Muscle Histology
2.2. Measurement of CSA and Count of Slow-Twitch Muscle Proportion
2.3. Transcriptome Sequencing (RNA-Seq)
2.4. Statistical Analysis
2.5. Read Mapping and Transcript Profiling
2.6. Functional Enrichment Analysis
2.7. Gene Set Variation Analysis (GSVA)
2.8. Weighted Gene Co-Expression Network Analysis (WGCNA)
2.9. Gene Expression Clustering Trend Analysis and Biased Gene Analysis
3. Results
3.1. The Global Gene Expression Patterns in Different Sheep Breeds
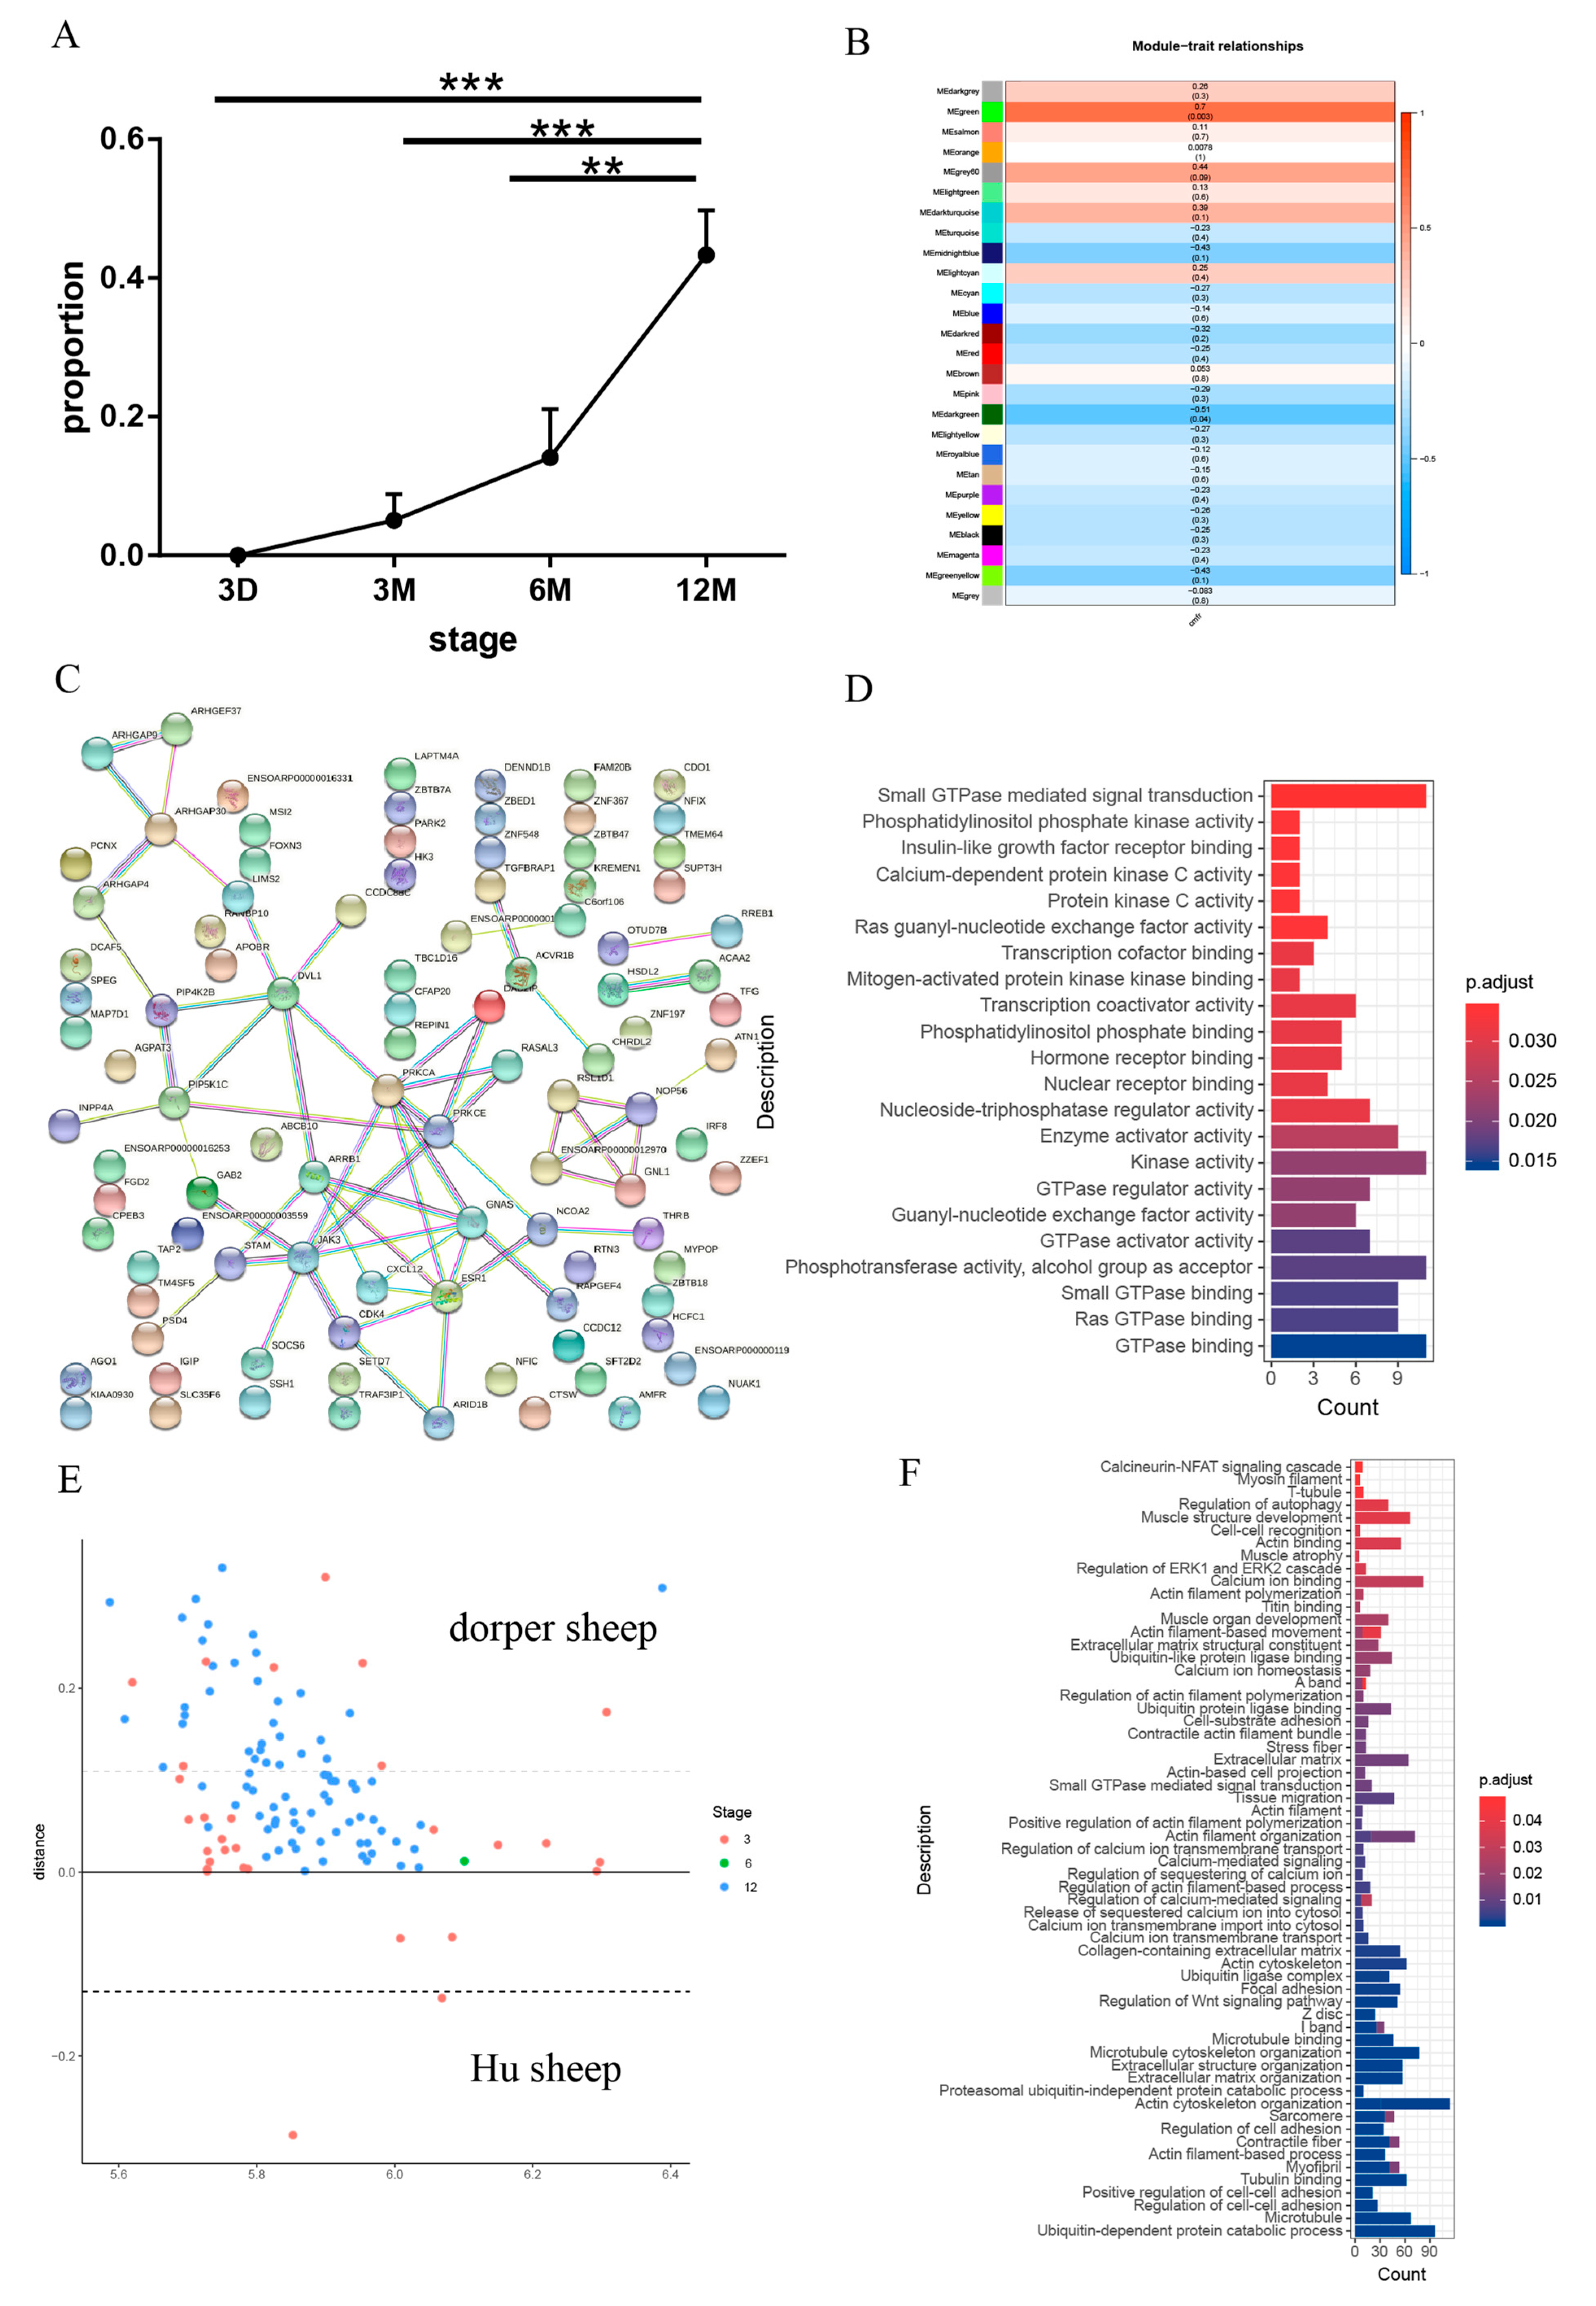
3.2. The Dynamic Transcriptome of Skeletal Muscle Development in Different Sheep Breeds
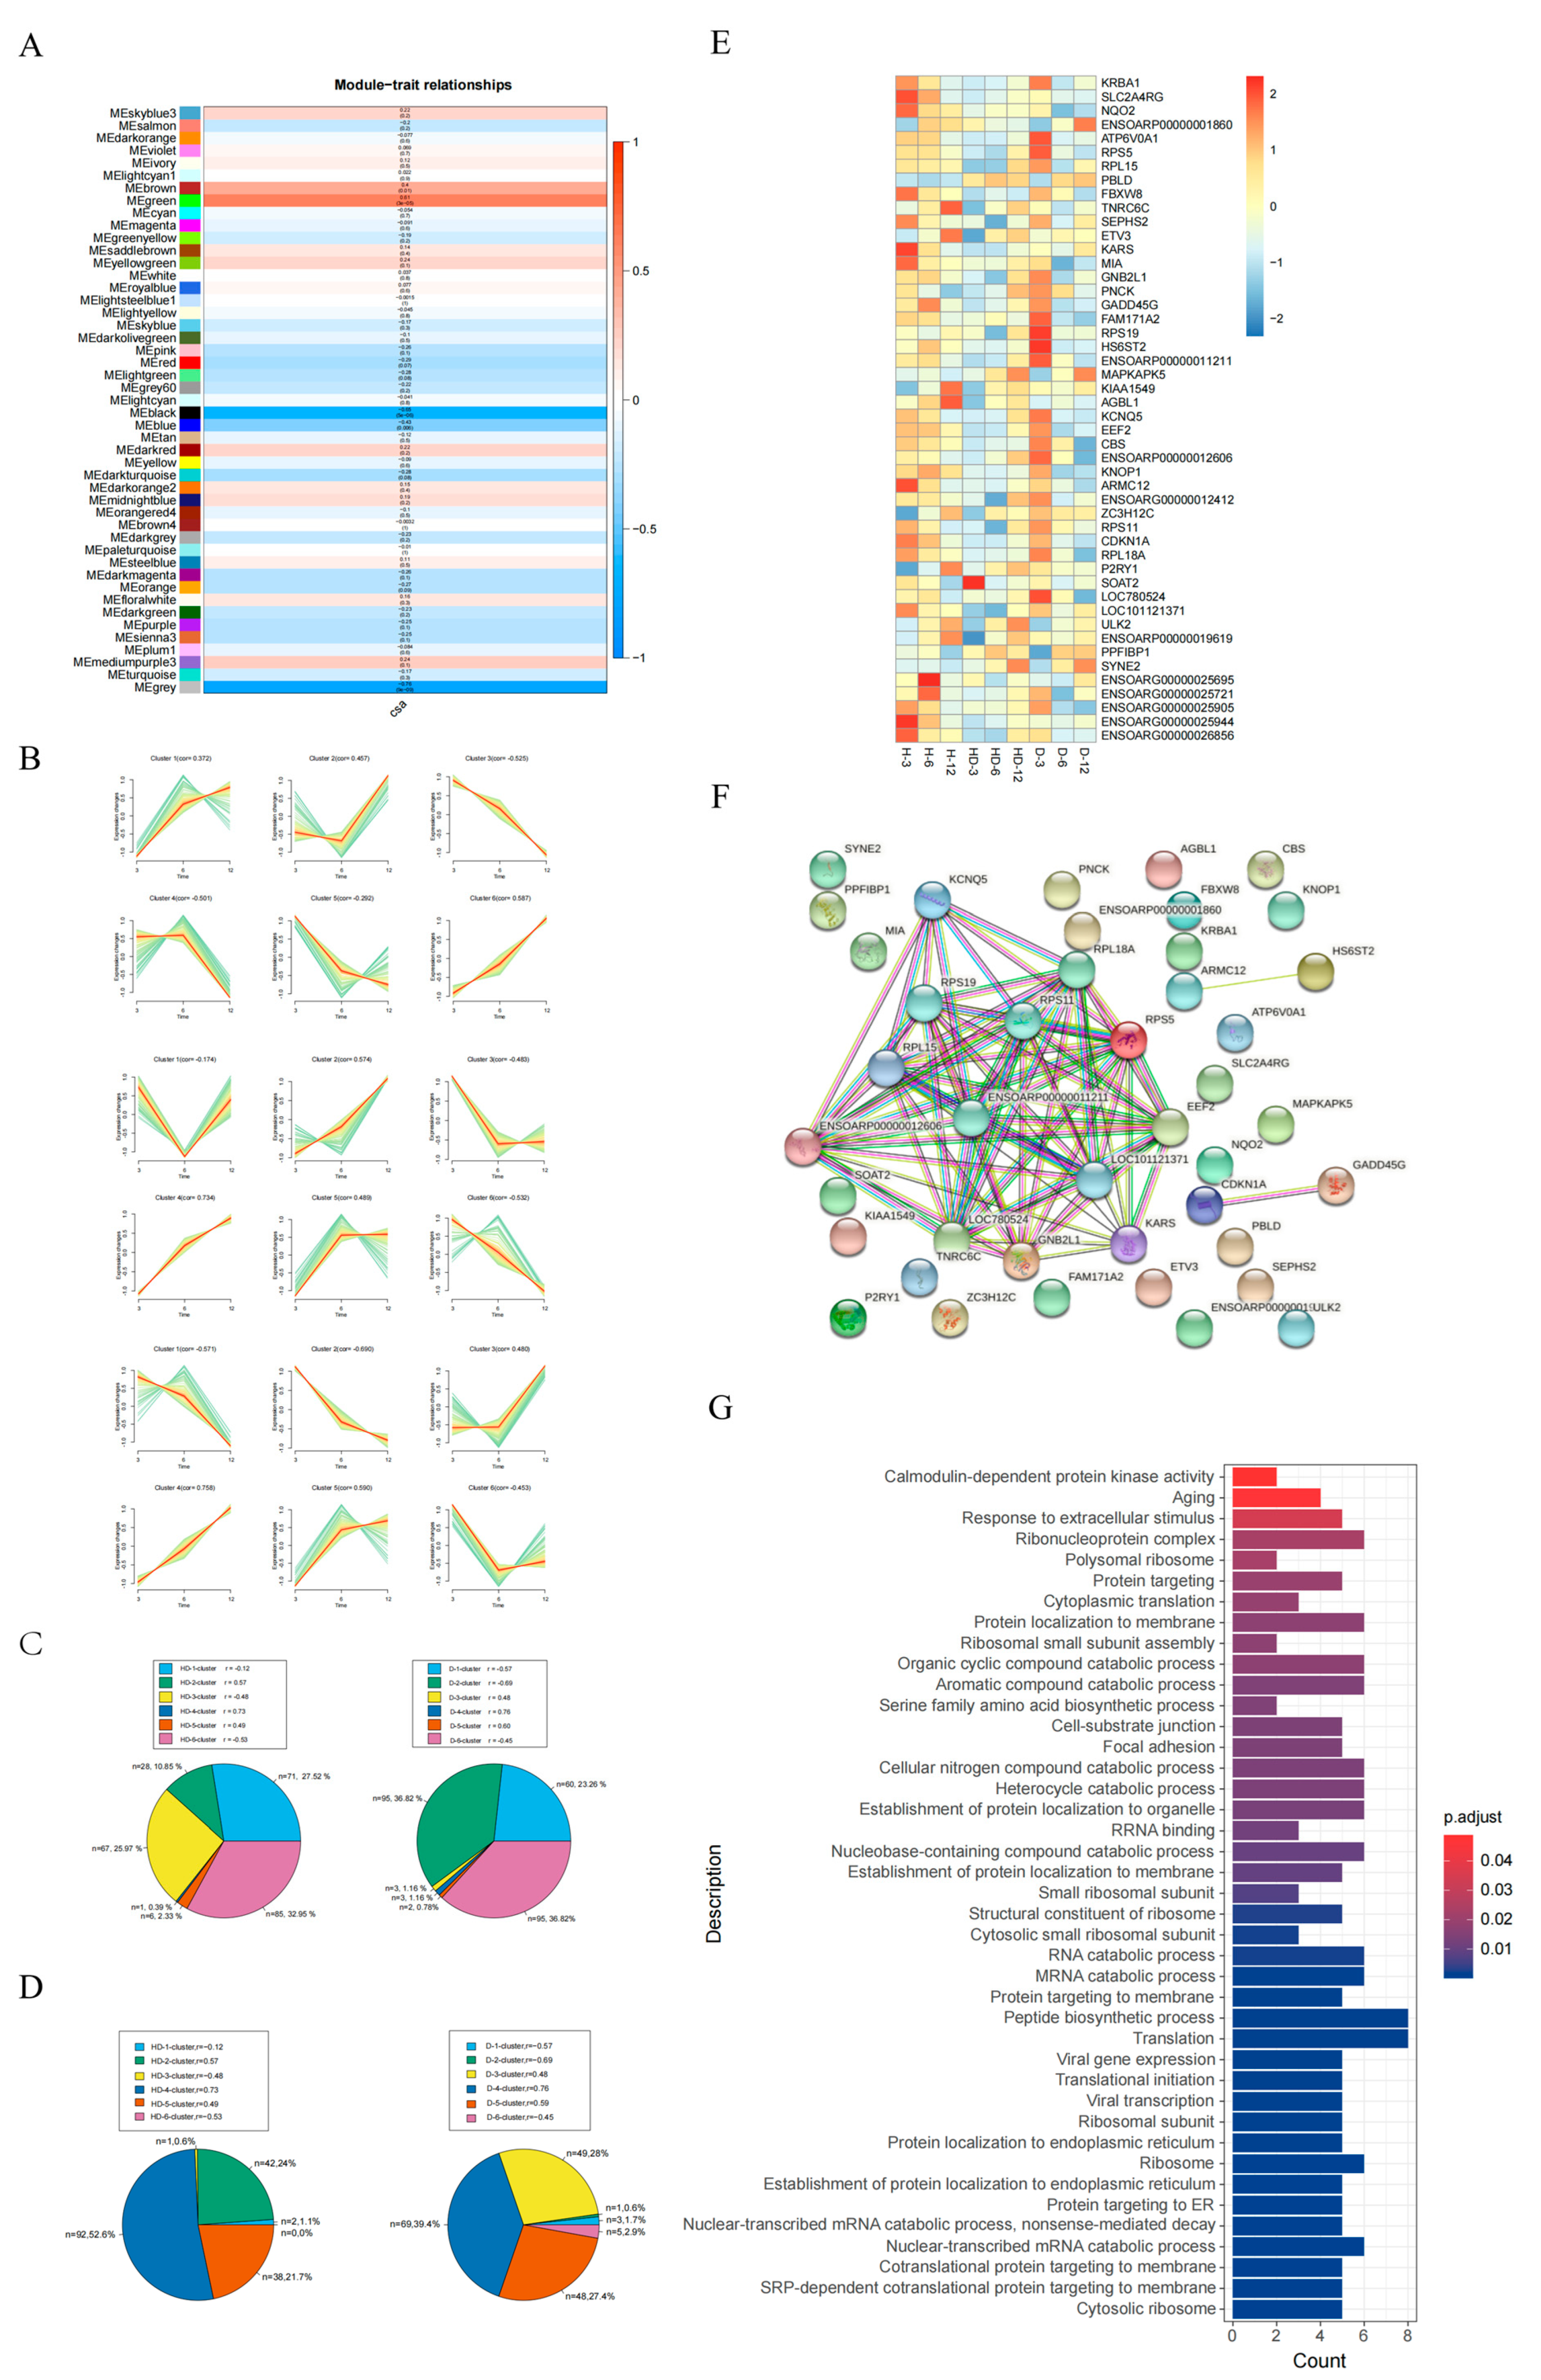
3.3. The Global Transcriptomic Analysis of Muscle Fiber Hypertrophy
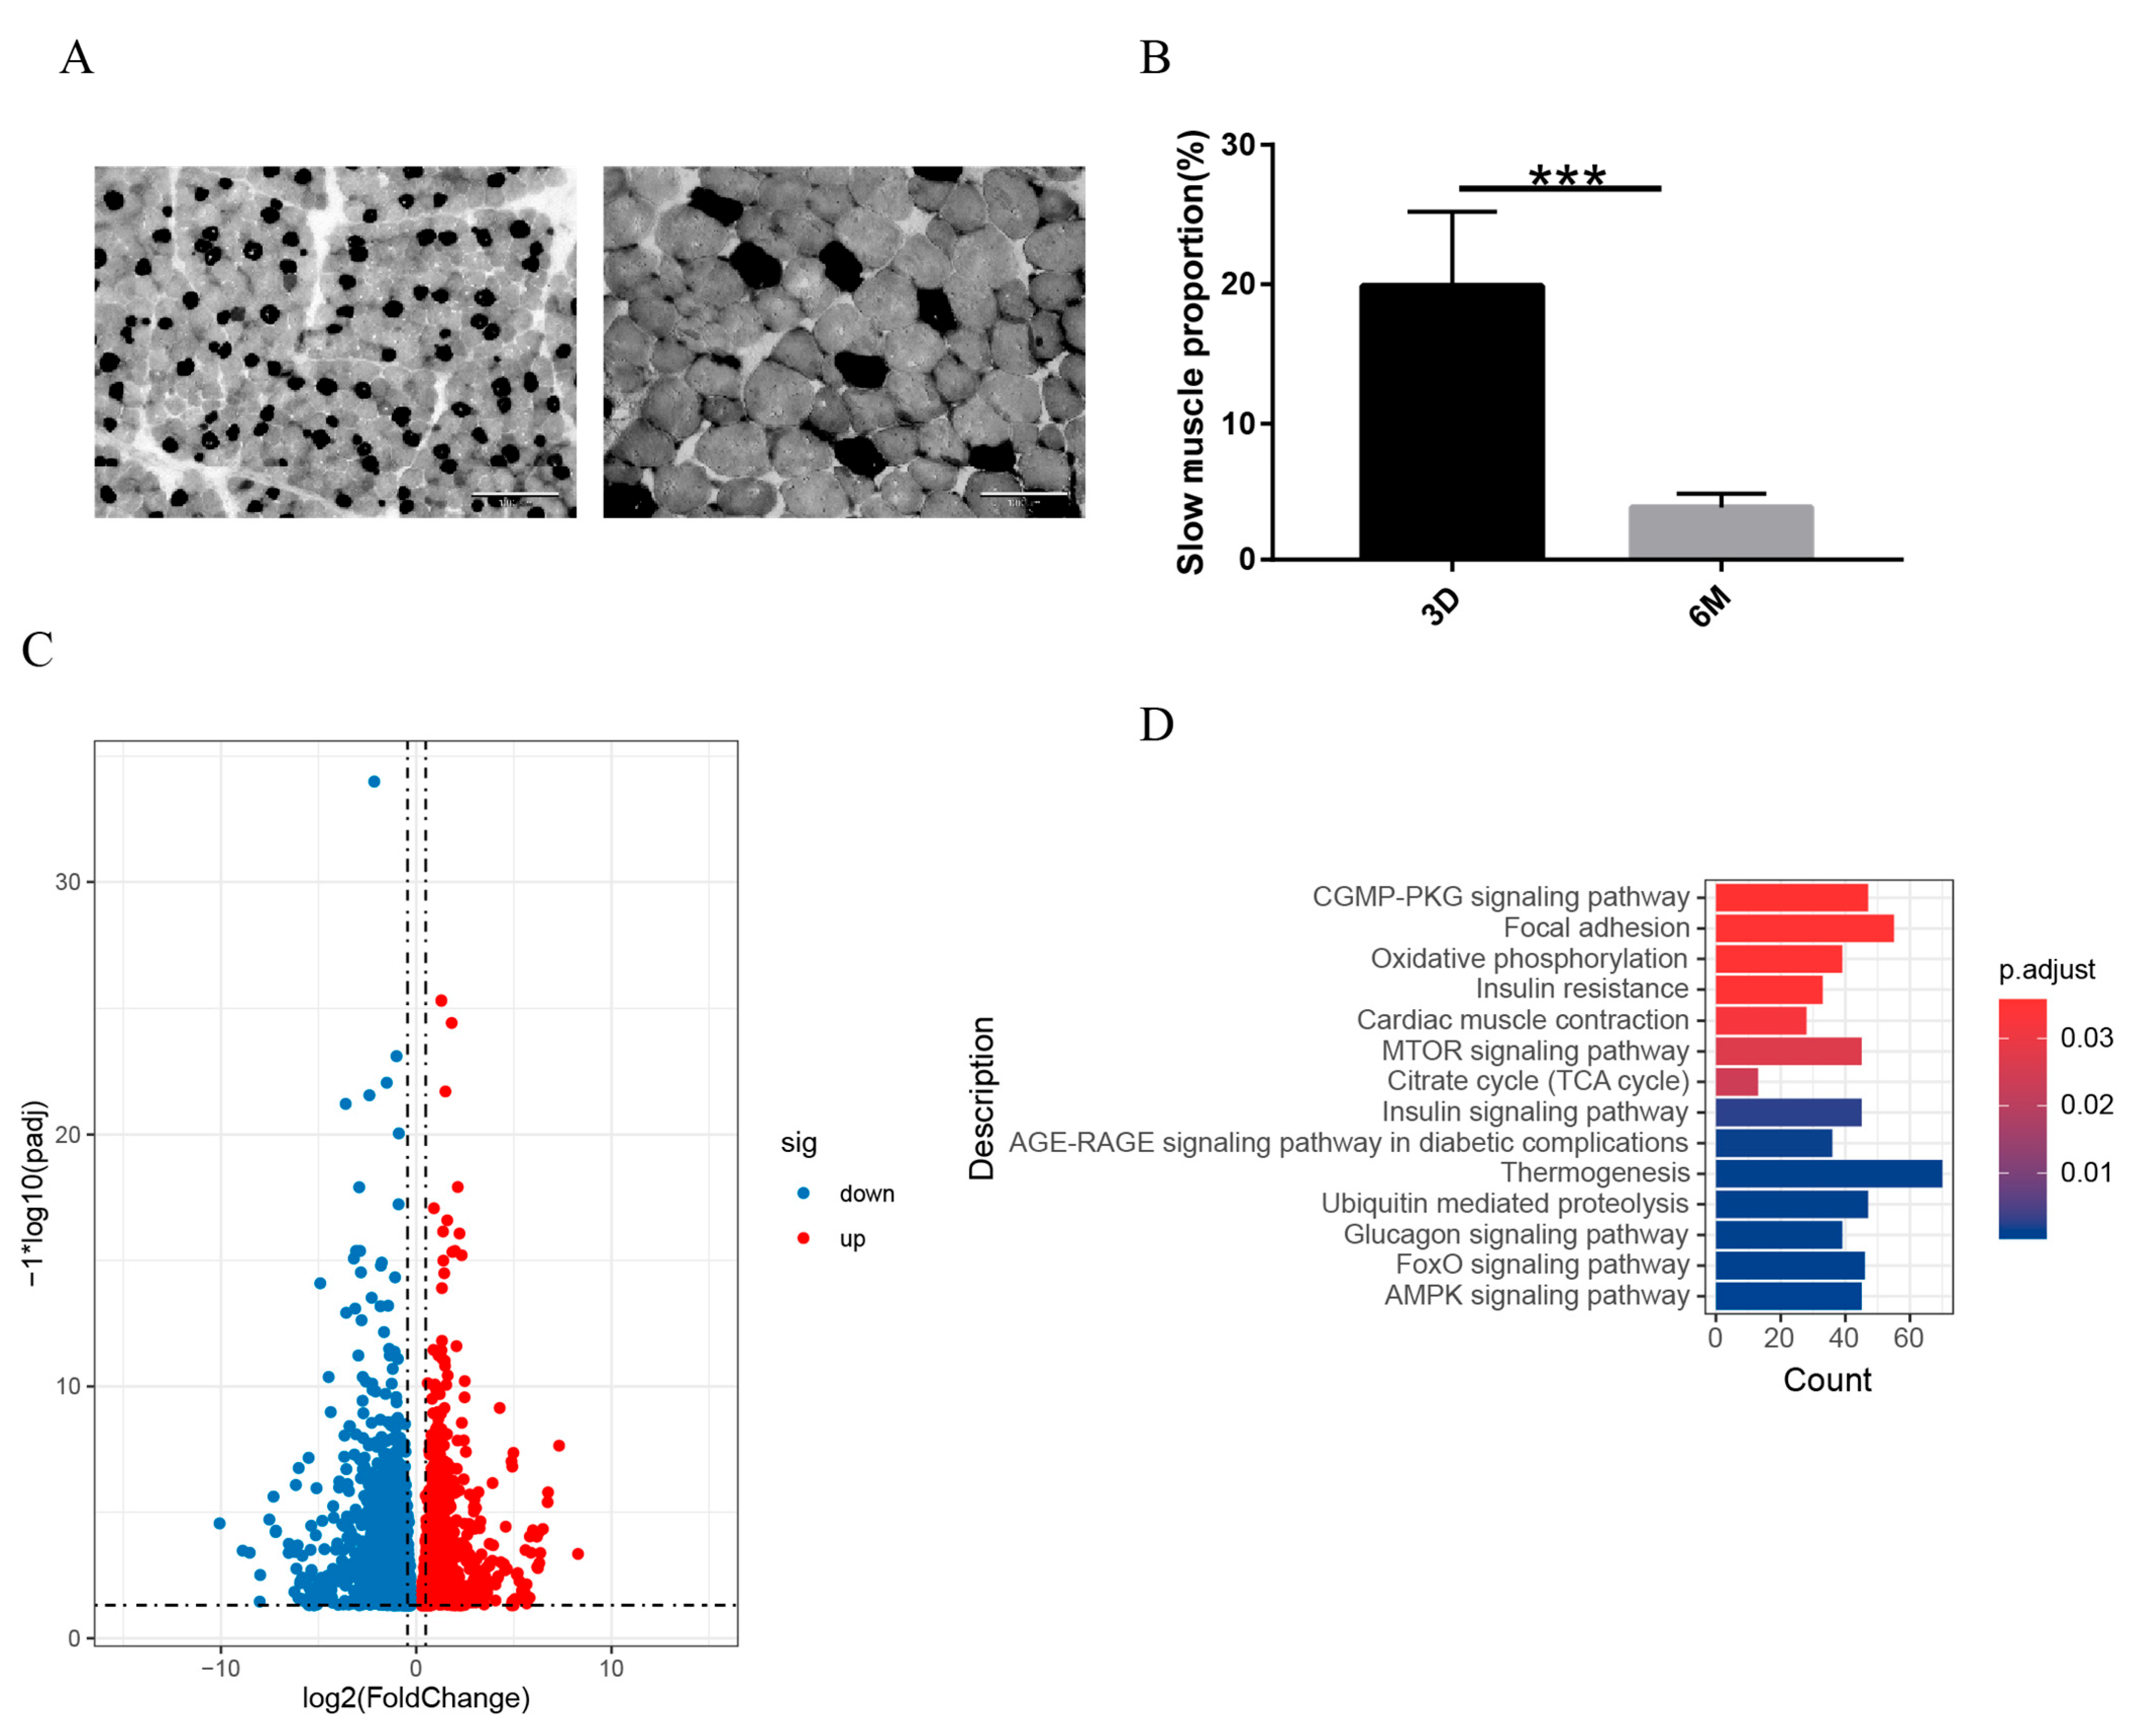
3.4. The Changes in the Transcriptome of the Transformation of Fast and Slow Muscles
4. Discussion
Supplementary Materials
Author Contributions
Funding
Institutional Review Board Statement
Data Availability Statement
Conflicts of Interest
References
- Cloete, S.W.; Snyman, M.A.; Herselman, M.J. Productive performance of Dorper sheep. Small Rumin. Res. J. Int. Goat Assoc. 2000, 36, 119–135. [Google Scholar] [CrossRef] [PubMed]
- Chao, T.; Wang, G.; Wang, J.; Liu, Z.; Ji, Z.; Hou, L.; Zhang, C. Identification and Classification of New Transcripts in Dorper and Small-Tailed Han Sheep Skeletal Muscle Transcriptomes. PLoS ONE 2016, 11, e0159638. [Google Scholar] [CrossRef] [PubMed]
- Bentzinger, C.F.; Wang, Y.X.; Rudnicki, M.A. Building muscle: Molecular regulation of myogenesis. Cold Spring Harb. Perspect. Biol. 2012, 4, a008342. [Google Scholar] [CrossRef]
- Buckingham, M.; Bajard, L.; Chang, T.; Daubas, P.; Hadchouel, J.; Meilhac, S.; Montarras, D.; Rocancourt, D.; Relaix, F. The formation of skeletal muscle: From somite to limb. J. Anat. 2003, 202, 59–68. [Google Scholar] [CrossRef] [PubMed]
- White, R.B.; Biérinx, A.S.; Gnocchi, V.F.; Zammit, P.S. Dynamics of muscle fiber growth during postnatal mouse development. BMC Dev. Biol. 2010, 10, 21. [Google Scholar] [CrossRef]
- Bryson-Richardson, R.J.; Currie, P.D. The genetics of vertebrate myogenesis. Nat. Rev. Genet. 2008, 9, 632–646. [Google Scholar] [CrossRef]
- Braun, T.; Gautel, M. Transcriptional mechanisms regulating skeletal muscle differentiation, growth and homeostasis. Nat. Rev. Mol. Cell Biol. 2011, 12, 349–361. [Google Scholar] [CrossRef]
- Hutton, K.C.; Vaughn, M.A.; Litta, G.; Turner, B.J.; Starkey, J.D. Effect of vitamin D status improvement with 25-hydroxycholecalciferol on skeletal muscle growth characteristics and satellite cell activity in broiler chickens. J. Anim. Sci. 2014, 92, 3291–3299. [Google Scholar] [CrossRef]
- Britto, P.R.; Pérez-Escamilla, R. No second chances? Early critical periods in human development. Introduction. Soc. Sci. Med. 2013, 97, 238–240. [Google Scholar] [CrossRef]
- Davis, T.A.; Fiorotto, M.L. Regulation of muscle growth in neonates. Curr. Opin. Clin. Nutr. Metab. Care 2009, 12, 78–85. [Google Scholar] [CrossRef]
- Costa, V.; Angelini, C.; De Feis, I.; Ciccodicola, A. Uncovering the complexity of transcriptomes with RNA-Seq. J. Biomed. Biotechnol. 2010, 2010, 853916. [Google Scholar] [CrossRef] [PubMed]
- Weikard, R.; Hadlich, F.; Kuehn, C. Identification of novel transcripts and noncoding RNAs in bovine skin by deep next generation sequencing. BMC Genom. 2013, 14, 789. [Google Scholar] [CrossRef] [PubMed]
- Du, M.; Wang, B.; Fu, X.; Yang, Q.; Zhu, M.J. Fetal programming in meat production. Meat Sci. 2015, 109, 40–47. [Google Scholar] [CrossRef] [PubMed]
- Muráni, E.; Murániová, M.; Ponsuksili, S.; Schellander, K.; Wimmers, K. Identification of genes differentially expressed during prenatal development of skeletal muscle in two pig breeds differing in muscularity. BMC Dev. Biol. 2007, 7, 109. [Google Scholar] [CrossRef] [PubMed]
- Zhan, S.; Zhao, W.; Song, T.; Dong, Y.; Guo, J.; Cao, J.; Zhong, T.; Wang, L.; Li, L.; Zhang, H. Dynamic transcriptomic analysis in hircine longissimus dorsi muscle from fetal to neonatal development stages. Funct. Integr. Genom. 2018, 18, 43–54. [Google Scholar] [CrossRef]
- Wang, Y.; Wang, J.; Hu, H.; Wang, H.; Wang, C.; Lin, H.; Zhao, X. Dynamic transcriptome profiles of postnatal porcine skeletal muscle growth and development. BMC Genom. Data 2021, 22, 32. [Google Scholar] [CrossRef]
- Liu, J.; Lei, Q.; Li, F.; Zhou, Y.; Gao, J.; Liu, W.; Han, H.; Cao, D. Dynamic Transcriptomic Analysis of Breast Muscle Development From the Embryonic to Post-hatching Periods in Chickens. Front. Genet. 2019, 10, 1308. [Google Scholar] [CrossRef]
- Velleman, S.G. Muscle development in the embryo and hatchling. Poult. Sci. 2007, 86, 1050–1054. [Google Scholar] [CrossRef]
- Arora, R.; Siddaraju, N.K.; Manjunatha, S.S.; Sudarshan, S.; Fairoze, M.N.; Kumar, A.; Chhabra, P.; Kaur, M.; Sreesujatha, R.M.; Ahlawat, S.; et al. Muscle transcriptome provides the first insight into the dynamics of gene expression with progression of age in sheep. Sci. Rep. 2021, 11, 22360. [Google Scholar] [CrossRef] [PubMed]
- Sun, L.; Bai, M.; Xiang, L.; Zhang, G.; Ma, W.; Jiang, H. Comparative transcriptome profiling of longissimus muscle tissues from Qianhua Mutton Merino and Small Tail Han sheep. Sci. Rep. 2016, 6, 33586. [Google Scholar] [CrossRef]
- Khan, M.; Couturier, A.; Kubens, J.F.; Most, E.; Mooren, F.C.; Krüger, K.; Ringseis, R.; Eder, K. Niacin supplementation induces type II to type I muscle fiber transition in skeletal muscle of sheep. Acta Vet. Scand. 2013, 55, 85. [Google Scholar] [CrossRef]
- Rossum, G.V.; Drake, F.L. Python 3 Reference Manual. Dep. Comput. Sci. CS 1995, 111, 1–52. [Google Scholar]
- Datta, S. Learning OpenCV 3 Application Development; Packt Publishing Ltd.: Birmingham, UK, 2016. [Google Scholar]
- Chen, S.; Zhou, Y.; Chen, Y.; Gu, J. fastp: An ultra-fast all-in-one FASTQ preprocessor. Bioinformatics 2018, 34, i884–i890. [Google Scholar] [CrossRef] [PubMed]
- Kim, D.; Langmead, B.; Salzberg, S.L. HISAT: A fast spliced aligner with low memory requirements. Nat. Methods 2015, 12, 357–360. [Google Scholar] [CrossRef]
- Li, H.; Handsaker, B.; Wysoker, A.; Fennell, T.; Ruan, J.; Homer, N.; Marth, G.; Abecasis, G.; Durbin, R.; 1000 Genome Project Data Processing Subgroup. The Sequence Alignment/Map format and SAMtools. Bioinformatics 2009, 25, 2078–2079. [Google Scholar] [CrossRef] [PubMed]
- Pertea, M.; Pertea, G.M.; Antonescu, C.M.; Chang, T.C.; Mendell, J.T.; Salzberg, S.L. StringTie enables improved reconstruction of a transcriptome from RNA-seq reads. Nat. Biotechnol. 2015, 33, 290–295. [Google Scholar] [CrossRef] [PubMed]
- Love, M.I.; Huber, W.; Anders, S. Moderated estimation of fold change and dispersion for RNA-seq data with DESeq2. Genome Biol. 2014, 15, 550. [Google Scholar] [CrossRef] [PubMed]
- Costa-Silva, J.; Domingues, D.; Lopes, F.M. RNA-Seq differential expression analysis: An extended review and a software tool. PLoS ONE 2017, 12, e0190152. [Google Scholar] [CrossRef] [PubMed]
- Langfelder, P.; Horvath, S. WGCNA: An R package for weighted correlation network analysis. BMC Bioinform. 2008, 9, 559. [Google Scholar] [CrossRef]
- Scruggs, S.B.; Wang, D.; Ping, P. PRKCE gene encoding protein kinase C-epsilon-Dual roles at sarcomeres and mitochondria in cardiomyocytes. Gene 2016, 590, 90–96. [Google Scholar] [CrossRef]
- Huang, Z.; Zhong, L.; Zhu, J.; Xu, H.; Ma, W.; Zhang, L.; Shen, Y.; Law, B.Y.-K.; Ding, F.; Gu, X.; et al. Inhibition of IL-6/JAK/STAT3 pathway rescues denervation-induced skeletal muscle atrophy. Ann. Transl. Med. 2020, 8, 1681. [Google Scholar] [CrossRef]
- Pruller, J.; Figeac, N.; Zammit, P.S. DVL1 and DVL3 require nuclear localisation to regulate proliferation in human myoblasts. Sci. Rep. 2022, 12, 8388. [Google Scholar] [CrossRef]
- Niro, C.; Demignon, J.; Vincent, S.; Liu, Y.; Giordani, J.; Sgarioto, N.; Favier, M.; Guillet-Deniau, I.; Blais, A.; Maire, P. Six1 and Six4 gene expression is necessary to activate the fast-type muscle gene program in the mouse primary myotome. Dev. Biol. 2010, 338, 168–182. [Google Scholar] [CrossRef] [PubMed]
- Waters, R.E.; Rotevatn, S.; Li, P.; Annex, B.H.; Yan, Z. Voluntary running induces fiber type-specific angiogenesis in mouse skeletal muscle. Am. J. Physiol. Cell Physiol. 2004, 287, C1342–C1348. [Google Scholar] [CrossRef] [PubMed]
- Cassano, P.; Sciancalepore, A.; Pesce, V.; Flück, M.; Hoppeler, H.; Calvani, M.; Mosconi, L.; Cantatore, P.; Gadaleta, M. Acetyl-L-carnitine feeding to unloaded rats triggers in soleus muscle the coordinated expression of genes involved in mitochondrial biogenesis. Biochim. Biophys. Acta 2006, 1757, 1421–1428. [Google Scholar] [CrossRef]
- Lantier, L.; Fentz, J.; Mounier, R.; Leclerc, J.; Treebak, J.T.; Pehmøller, C.; Sanz, N.; Sakakibara, I.; Saint-Amand, E.; Rimbaud, S.; et al. AMPK controls exercise endurance, mitochondrial oxidative capacity, and skeletal muscle integrity. FASEB J. Off. Publ. Fed. Am. Soc. Exp. Biol. 2014, 28, 3211–3224. [Google Scholar] [CrossRef]
- Ma, M.; Cai, B.; Kong, S.; Zhou, Z.; Zhang, J.; Zhang, X.; Nie, Q. PPARGC1A Is a Moderator of Skeletal Muscle Development Regulated by miR-193b-3p. Int. J. Mol. Sci. 2022, 23, 9575. [Google Scholar] [CrossRef]
- Brinegar, A.E.; Xia, Z.; Loehr, J.A.; Li, W.; Rodney, G.G.; Cooper, T.A. Extensive alternative splicing transitions during postnatal skeletal muscle development are required for calcium handling functions. eLife 2017, 6, e27192. [Google Scholar] [CrossRef] [PubMed]
- Juhas, M.; Abutaleb, N.; Wang, J.T.; Ye, J.; Shaikh, Z.; Sriworarat, C.; Qian, Y.; Bursac, N. Incorporation of macrophages into engineered skeletal muscle enables enhanced muscle regeneration. Nat. Biomed. Eng. 2018, 2, 942–954. [Google Scholar] [CrossRef] [PubMed]
- Paylor, B.; Natarajan, A.; Zhang, R.H.; Rossi, F. Nonmyogenic cells in skeletal muscle regeneration. Curr. Top. Dev. Biol. 2011, 96, 139–165. [Google Scholar]
- Oprescu, S.N.; Yue, F.; Qiu, J.; Brito, L.F.; Kuang, S. Temporal Dynamics and Heterogeneity of Cell Populations during Skeletal Muscle Regeneration. iScience 2020, 23, 100993. [Google Scholar] [CrossRef]
- Duperret, E.K.; Ridky, T.W. Focal adhesion complex proteins in epidermis and squamous cell carcinoma. Cell Cycle 2013, 12, 3272–3285. [Google Scholar] [CrossRef]
- Graham, Z.A.; Gallagher, P.M.; Cardozo, C.P. Focal adhesion kinase and its role in skeletal muscle. J. Muscle Res. Cell Motil. 2015, 36, 305–315. [Google Scholar] [CrossRef]
- Davis, T.A.; Fiorotto, M.L.; Beckett, P.R.; Burrin, D.G.; Reeds, P.J.; Wray-Cahen, D.; Nguyen, H.V. Differential effects of insulin on peripheral and visceral tissue protein synthesis in neonatal pigs. Am. J. Physiol. Endocrinol. Metab. 2001, 280, E770–E779. [Google Scholar] [CrossRef]
- Davis, T.A.; Fiorotto, M.L.; Nguyen, H.V.; Reeds, P.J. Protein turnover in skeletal muscle of suckling rats. Am. J. Physiol. 1989, 257 Pt 2, R1141–R1146. [Google Scholar] [CrossRef]
- Fukada, S.I.; Akimoto, T.; Sotiropoulos, A. Role of damage and management in muscle hypertrophy: Different behaviors of muscle stem cells in regeneration and hypertrophy. Biochim. Biophys. Acta Mol. Cell Res. 2020, 1867, 118742. [Google Scholar] [CrossRef]
- Collins, C.A.; Olsen, I.; Zammit, P.S.; Heslop, L.; Petrie, A.; Partridge, T.A.; Morgan, J.E. Stem cell function, self-renewal, and behavioral heterogeneity of cells from the adult muscle satellite cell niche. Cell 2005, 122, 289–301. [Google Scholar] [CrossRef]
- Zammit, P.S.; Golding, J.P.; Nagata, Y.; Hudon, V.; Partridge, T.A.; Beauchamp, J.R. Muscle satellite cells adopt divergent fates: A mechanism for self-renewal? J. Cell Biol. 2004, 166, 347–357. [Google Scholar] [CrossRef] [PubMed]
- Halevy, O.; Piestun, Y.; Allouh, M.Z.; Rosser, B.W.; Rinkevich, Y.; Reshef, R.; Rozenboim, I.; Wleklinski-Lee, M.; Yablonka-Reuveni, Z. Pattern of Pax7 expression during myogenesis in the posthatch chicken establishes a model for satellite cell differentiation and renewal. Dev. Dyn. Off. Publ. Am. Assoc. Anat. 2004, 231, 489–502. [Google Scholar] [CrossRef] [PubMed]
- Gu, J.M.; Wang, D.J.; Peterson, J.M.; Shintaku, J.; Liyanarachchi, S.; Coppola, V.; Frakes, A.E.; Kaspar, B.K.; Cornelison, D.D.; Guttridge, D.C. An NF-κB—EphrinA5-Dependent Communication between NG2(+) Interstitial Cells and Myoblasts Promotes Muscle Growth in Neonates. Dev. Cell 2016, 36, 215–224. [Google Scholar] [CrossRef] [PubMed]
- Wosczyna, M.N.; Konishi, C.T.; Carbajal, E.E.P.; Wang, T.T.; Walsh, R.A.; Gan, Q.; Wagner, M.W.; Rando, T.A. Mesenchymal Stromal Cells Are Required for Regeneration and Homeostatic Maintenance of Skeletal Muscle. Cell Rep. 2019, 27, 2029–2035.e5. [Google Scholar] [CrossRef] [PubMed]
- Ehler, E.; Gautel, M. The sarcomere and sarcomerogenesis. Adv. Exp. Med. Biol. 2008, 642, 1–14. [Google Scholar] [PubMed]
- Schiaffino, S.; Gorza, L.; Pitton, G.; Saggin, L.; Ausoni, S.; Sartore, S.; Lømo, T. Embryonic and neonatal myosin heavy chain in denervated and paralyzed rat skeletal muscle. Dev. Biol. 1988, 127, 1–11. [Google Scholar] [CrossRef]
- DeNardi, C.; Ausoni, S.; Moretti, P.; Gorza, L.; Velleca, M.; Buckingham, M.; Schiaffino, S. Type 2X-myosin heavy chain is coded by a muscle fiber type-specific and developmentally regulated gene. J. Cell Biol. 1993, 123, 823–835. [Google Scholar] [CrossRef] [PubMed]
- Ringseis, R.; Rosenbaum, S.; Gessner, D.K.; Herges, L.; Kubens, J.F.; Mooren, F.C.; Krüger, K.; Eder, K. Supplementing obese Zucker rats with niacin induces the transition of glycolytic to oxidative skeletal muscle fibers. J. Nutr. 2013, 143, 125–131. [Google Scholar] [CrossRef] [PubMed]
- Khan, M.; Ringseis, R.; Mooren, F.C.; Krüger, K.; Most, E.; Eder, K. Niacin supplementation increases the number of oxidative type I fibers in skeletal muscle of growing pigs. BMC Vet. Res. 2013, 9, 177. [Google Scholar] [CrossRef] [PubMed]


Disclaimer/Publisher’s Note: The statements, opinions and data contained in all publications are solely those of the individual author(s) and contributor(s) and not of MDPI and/or the editor(s). MDPI and/or the editor(s) disclaim responsibility for any injury to people or property resulting from any ideas, methods, instructions or products referred to in the content. |
© 2023 by the authors. Licensee MDPI, Basel, Switzerland. This article is an open access article distributed under the terms and conditions of the Creative Commons Attribution (CC BY) license (https://creativecommons.org/licenses/by/4.0/).
Share and Cite
Ai, Y.; Zhu, Y.; Wang, L.; Zhang, X.; Zhang, J.; Long, X.; Gu, Q.; Han, H. Dynamic Changes in the Global Transcriptome of Postnatal Skeletal Muscle in Different Sheep. Genes 2023, 14, 1298. https://doi.org/10.3390/genes14061298
Ai Y, Zhu Y, Wang L, Zhang X, Zhang J, Long X, Gu Q, Han H. Dynamic Changes in the Global Transcriptome of Postnatal Skeletal Muscle in Different Sheep. Genes. 2023; 14(6):1298. https://doi.org/10.3390/genes14061298
Chicago/Turabian StyleAi, Yue, Yaning Zhu, Linli Wang, Xiaosheng Zhang, Jinlong Zhang, Xianlei Long, Qingyi Gu, and Hongbing Han. 2023. "Dynamic Changes in the Global Transcriptome of Postnatal Skeletal Muscle in Different Sheep" Genes 14, no. 6: 1298. https://doi.org/10.3390/genes14061298
APA StyleAi, Y., Zhu, Y., Wang, L., Zhang, X., Zhang, J., Long, X., Gu, Q., & Han, H. (2023). Dynamic Changes in the Global Transcriptome of Postnatal Skeletal Muscle in Different Sheep. Genes, 14(6), 1298. https://doi.org/10.3390/genes14061298