Article

Association between HLA Class II Alleles/Haplotypes and Genomic Ancestry in Brazilian Patients with Type 1 Diabetes: A Nationwide Exploratory Study

by
Marília Brito Gomes
1,*,
Vandilson Rodrigues
2,
Deborah Conte Santos
1,
Paulo Ricardo Villas Bôas
3,
Dayse A. Silva
4,
Rossana Santiago de Sousa Azulay
2,5,
Sergio Atala Dib
6,
Elizabeth João Pavin
7,
Virgínia Oliveira Fernandes
8,9,10,
Renan Magalhães Montenegro Junior
8,9,10,
João Soares Felicio
11,
Rosangela Réa
12,
Carlos Antonio Negrato
13 and
Luís Cristóvão Porto
3
1
Department of Internal Medicine, Diabetes Unit, Rio de Janeiro State University (UERJ), Rio de Janeiro 20950-003, Brazil
2
Research Group in Clinical and Molecular Endocrinology and Metabology (ENDOCLIM), São Luís 65080-805, Brazil
3
Histocompatibility and Cryopreservation Laboratory (HLA), Rio de Janeiro State University (UERJ), Rio de Janeiro 20950-003, Brazil
4
DNA Diagnostic Laboratory (LDD), Rio de Janeiro State University (UERJ), Rio de Janeiro 20550-900, Brazil
5
Service of Endocrinology, University Hospital of the Federal University of Maranhão (HUUFMA/EBSERH), São Luís 65020-070, Brazil
6
Endocrinology Division, Escola Paulista de Medicina, Federal University of São Paulo (UNIFESP), São Paulo 04023-062, Brazil
7
Endocrinology Division, School of Medical Sciences, University of Campinas (UNICAMP), São Paulo 13083-970, Brazil
8
Department of Clinical Medicine, Federal University of Ceará (UFC), Fortaleza 60430-275, Brazil
9
Department of Community Health, Federal University of Ceará (UFC), Fortaleza 60430-275, Brazil
10
Clinical Research Unit, Walter Cantídio University Hospital, Federal University of Ceará (UFC/EBSERH), Fortaleza 60430-372, Brazil
11
Endocrinology Division, João de Barros Barreto University Hospital, Federal University of Pará (UFPA), Belém 66073-000, Brazil
12
Endocrinology Unit, Federal University of Paraná (UFPR), Curitiba 80060-900, Brazil
13
Medical Doctor Program, School of Dentistry, University of São Paulo (USP), Bauru 17012-901, Brazil
*
Author to whom correspondence should be addressed.
Genes 2023, 14(5), 991; https://doi.org/10.3390/genes14050991
Submission received: 28 March 2023 / Revised: 23 April 2023 / Accepted: 24 April 2023 / Published: 27 April 2023
(This article belongs to the Special Issue Genetics of Autoimmune Diseases)

Abstract

:
We aimed to identify HLA-DRB1, -DQA1, and -DQB1 alleles/haplotypes associated with European, African, or Native American genomic ancestry (GA) in admixed Brazilian patients with type 1 diabetes (T1D). This exploratory nationwide study enrolled 1599 participants. GA percentage was inferred using a panel of 46 ancestry informative marker-insertion/deletion. Receiver operating characteristic curve analysis (ROC) was applied to identify HLA class II alleles related to European, African, or Native American GA, and showed significant (p < 0.05) accuracy for identifying HLA risk alleles related to European GA: for DRB1*03:01, the area under the curve was (AUC) 0.533; for DRB1*04:01 AUC = 0.558, for DRB1*04:02 AUC = 0.545. A better accuracy for identifying African GA was observed for the risk allele DRB1*09:01AUC = 0.679 and for the protective alleles DRB1*03:02 AUC = 0.649, DRB1*11:02 AUC = 0.636, and DRB1*15:03 AUC = 0.690. Higher percentage of European GA was observed in patients with risk haplotypes (p < 0.05). African GA percentage was higher in patients with protective haplotypes (p < 0.05). Risk alleles and haplotypes were related to European GA and protective alleles/haplotypes to African GA. Future studies with other ancestry markers are warranted to fill the gap in knowledge regarding the genetic origin of T1D in highly admixed populations such as that found in Brazil.

1. Introduction

Type 1 diabetes (T1D) is the commonest chronic endocrine disorder observed in young people caused by autoimmune destruction of pancreatic β-cells [1,2], and it has an ongoing increase in incidence in developed and developing countries [3]. In Brazil, a country composed of a highly admixed population of 209 million people, the estimated incidence according to the International Diabetes Federation (IDF) was 7.6/100,000 persons/year [3]. However, in some Brazilian cities, such as Bauru (São Paulo State), epidemiological findings showed a higher incidence that reached almost 12.8/100,000 [4]. So far, the main hypothesis for T1D pathogenesis is that the disease is caused by an interaction between multiple genes and environmental factors [2]. Concerning genetics, the alleles from the HLA region account for almost 50% of the genetic risk, especially class II alleles, DR, and DQ, even though class I alleles and non-HLA alleles also increase this risk [5].
The susceptibility to T1D is mainly linked with the haplotypes DRB1*03:01~DQA1*05:01~DQB1*02:01 and DRB1*04~DQA1*03:0~DQB1*03:02, although the odds risks vary significantly among different populations [6,7]. Certain HLA haplotypes, such as DRB1*07:01~DQA1*03:01~DQB1*02:02, may increase the risk of T1D in African-Americans [8]. However, some changes in the HLA-DQA1 allele, such as the DQA1*02:01 allele, which is known to be protective for the European population [2,5], is one of the most common alleles found in the general Brazilian population [9]. Until now, the majority of T1D studies have been conducted on homogeneous populations with low genetic variability, specifically Caucasians with European ancestry [1,2,3,4,5,6]. These studies have often relied on self-reported ethnicity rather than genetic ancestry to categorize patients according to ethnicity [1,2,3,4,5,6]. However, this approach can introduce biases in allele frequency studies, especially in admixed populations [10,11,12].
The above-mentioned evidence must be evaluated in the context of the rise of genetic risk scores for diagnosing and predicting of T1D in different populations [13,14,15]. However, due to ethnic differences among populations, the studies that take into account the genomic ancestry (GA) of T1D could add more information to better individualize these genetic risk scores, mainly in admixed populations. Brazil is one of the countries with the highest genetic variability due to hundreds of years of miscegenation [16]. Before the colonization period, which started in 1500, Brazil was composed of Native Americans. With the arrival of Portuguese and other European populations, miscegenation started. Some years later, with the beginning of the slavery traffic, the African population also started to contribute to the substantial Brazilian genetic variability [11,17].
A previous study of our group that compared the GA of patients with T1D with the general Brazilian population, showed a predominance of European ancestry in both groups, especially in patients with T1D [11]. In that study, we found a low proportion of Native American ancestry and only 6.2% of the studied people presented ratios greater than 95% for one single ancestry. Moreover, the European GA was the only one that had a high proportion (>95%) in that sample [11]. Polymorphisms of classical alleles of the HLA system could vary among populations from different regions of a continental country such as Brazil due to the great variability of the GA contribution caused by the different migration waves and the frequency of Native American ancestry [8,18]. Therefore, the study of HLA genes and their relation with GA can add important information for understanding the origins of populations and their degree of admixture [19] and could help understanding the characteristics of T1D in our country.
In this study, we hypothesized that different HLA class alleles can be related to the European, African, or Native American ancestry percentage in Brazilian people with T1D. In this sense, this study aimed to identify which risk or protective HLA-DRB1, -DQA1, and -DQB1 alleles/haplotypes were associated with European, African, or Native American ancestry percentage in a sample of Brazilian patients with T1D.

2. Methods

2.1. Study Design and Sample

The present exploratory study was conducted with 1599 unrelated patients with T1D who participated in a nationwide multicenter cross-sectional study, which originally enrolled 1912 patients and was performed between August 2011 and August 2014 in 14 public clinics, located in 11 Brazilian cities from five geographical regions (North, Northeast, Midwest, Southeast, and South). The flowchart of the study is described in Figure 1. The methodology was previously described [20]. Briefly, all patients T1D received health care from the Brazilian National Health Care System (SUS) and were diagnosed based on typical clinical signals and symptoms of T1D, which are hyperglycemia, weight loss, polyuria, polydipsia, polyphagia, and the requirement of continuous insulin use ever since [20]. Patients who were at least 13 years old and followed up at their respective diabetes center for a minimum of 6 months were included. Each clinic provided data from at least 50 T1D outpatients who regularly attended the clinic.
This study was approved by the ethics committee of Pedro Ernesto University Hospital (Rio de Janeiro State University) and by the local ethics committee of each center. Written informed consent was obtained from all patients or their parents where necessary.

2.2. Data Collection

In a clinical appointment, through the application of a standardized questionnaire, clinical and demographic information were collected, including gender, current age, birthplace, self-reported color-race, age at diagnosis, and diabetes duration. Color-race was assessed using the classification system of the Brazilian Institute of Geography and Statistics (IBGE), which categorizes individuals as Black (preta), White (branca), Brown (parda), Yellow (of Asian origin) (amarela), or Indigenous (Native American origin) (indígena) [21].

2.3. DNA Extraction and AIM-Indel Genotyping

Peripheral blood genomic DNA was extracted using the SP QIA Symphony commercial kit and QIA Symphony equipment, following the manufacturer’s instructions (Qiagen, Germantown, MD, USA). A panel of 46 AIM-INDEL was used to infer global and individual GA, according to a previously described protocol [22]. These markers present varying allele frequencies of European, African, and Native American populations. Genotyping was carried out using multiplex PCR followed by capillary electrophoresis with the ABI 3500 system, and allele naming was performed using Gene Mapper V.4.1 software (Applied Biosystems by Life Technologies, Carlsbad, CA, USA). Ancestry was estimated using Structure V.2.3.3 software, with the HGDP-CEPH diversity panel (Sub-Set H952) as a reference for ancestral populations.
To compare allele frequency of the genotyped 46 AIM Indels and the ancestry percentage of patients with T1D, we used published data from the Brazilian population for the same markers. This dataset contained 936 unrelated healthy individuals from different metropolitan areas [17], and the comparison was performed as described previously [8].

2.4. HLA Genotyping

HLA class II alleles (HLA-DRB1, DQA1, and DQB1) were genotyped according to the method described by Santos et al. [7]. DNA was extracted from participants, and 352 samples were amplified at loci HLA-DRB1 and -DQB1 using primers from the NGSgo® v2 library preparation kit (GenDx, Utrecht, The Netherlands). An additional 124 samples were genotyped using the Holotype HLA Assay (Omixon Inc., Budapest, Hungary) for HLA-DRB1, -DQB1, and -DQA1, following the manufacturer’s instructions. The remaining 1123 samples were typed using Medium to High-resolution PCR-reverse sequence specific oligonucleotide (PCR-RSSO) (LabType SSO, One lambda Inc., West Hills, CA, USA). Alleles were defined using Common, intermediate, and well-documented (CIWD) frequencies [23], and sequencing was used to resolve any ambiguities. Three locus haplotype frequencies (DRB1~DQA1~DQB1) were estimated for each self-reported color-race and region, resolving phase and allelic ambiguity using the expectation-maximization (EM) algorithm. Deviations from Hardy–Weinberg equilibrium (HWE) were assessed at the allele-family level (first nomenclature field) using a modified version of the Guo and Thompson algorithm as implemented in the software Arlequin v.3.5 [24]. HLA-DQA1 alleles were imputed in 31.5% of the samples from the T1D group (n = 321) using the linkage disequilibrium criteria, based on the results found by NGS. After validating the HLA dataset via an EM algorithm for resolving allelic ambiguities and determining both allele and extended haplotype frequencies, this imputation was manually performed according to the haplotype results from Arlequin output data, stratified by self-reported color-race and regions. Due to a large number of haplotypes found, only those with a total count of ten or greater were presented in the table. Rare haplotypes were labeled as “other”.

2.5. Statistical Analysis

Data were analyzed using the Stata software version 18 (Stata Corp., College Station, TX, USA) and GraphPad Prism software version 9 (GraphPad Software Inc., San Diego, CA, USA). Descriptive statistics were expressed as frequency and percentage for categorical data, whereas continuous data were expressed as mean, median, standard deviation (±SD), interquartile interval, and range (minimum-maximum).
Receiver operating characteristic curve (ROC) analysis was applied to identify HLA class II alleles related to an increased percentage of European, African, or Native American ancestry and to estimate the area under the ROC curve (AUC) and 95% confidence interval. Additionally, the percentage threshold of European, African, or Native American ancestry related to each HLA class II allele were those with the optimal Youden index [25], determined as the ancestry percentage at which the sum of sensitivity and specificity was maximal. Comparative analysis of global GA percentage between genotype groups was performed using One-way ANOVA followed by Tukey’s multiple comparisons test. Bar charts, box-plots, and tables were used to present the analyzed data. The risk or protective haplotypes groups were categorized based on data from a previous study that investigated haplotypes associated with risk or protection for T1D in the Brazilian population [7] (Table S1). DQ2 corresponding to DQA1*05:01~DQB1*02:01 and DQ8 to DQA1*03:01~DQB1*03:02. The significance level was 5% (p < 0.05).

3. Results

3.1. Description of the Study Sample

A total of 1599 patients with T1D (46.2% males and 53.8% females) with a mean age of 29.7 ± 11.9 years were included in the study. As shown in Table 1, most of the patients in the sample were White (51.5%) and Brown (38.5%), according to the self-reported skin-color/race.

3.2. Global Genomic Ancestry Percentage and HLA Allele Distribution

In this analysis, there was a higher average percentage of European ancestry (64.2 ± 21.6, ranging from 2.3% to 99.2%), followed by African (21.0 ± 17.4, ranging from 0.2 to 88.7) and Native American (14.8 ± 11.9, ranging from 0.4 to 69.5) (Figure 2a,b). Distribution of ordinal categories showed that 74.8% of patients had more than 50% of European ancestry, while only 7.1% and 0.8% had more than 50% African and Native American ancestry, respectively (Figure 2c).
Figure 3 shows the frequency distribution of alleles in the sample. The four most frequent HLA-DRB1 alleles were 03:01 (29%), 04:05 (11%), and 07:01 (7.5%). The most frequent HLA-DQA1 alleles were 03:01 (35%), 05:01 (34.3%), and 01:01 (9.4%). In addition, the most frequent HLA-DQB1 alleles were 02:01 (28.9%), 03:02 (28.5%), and 02:02 (10.9%).

3.3. HLA Alleles Related to Global Ancestry Percentage

The ROC curve analysis was performed, and the details of the estimated parameters are shown in Tables S2–S4 while the main findings are highlighted in Figure 4. Statistical analysis showed that an increase in the European ancestry percentage was associated with the alleles: DRB1*03:01 (AUC = 0.533, p = 0.021, threshold >58.4%), DRB1*04:01 (AUC = 0.558, p = 0.009, threshold > 91.6%), DRB1*04:02 (AUC = 0.545, p = 0.037, threshold ≥ 46.3%), DRB1*08:01 (AUC = 0.583, p = 0.032, threshold ≥ 50.8%), DQA1*05:01 (AUC = 0.533, p = 0.022, threshold > 60.9%), DQB1*02:01 (AUC = 0.536, p = 0.013, threshold > 58.2%), DQB1*03:02 (AUC = 0.529, p = 0.045, threshold > 44.9%).
An increased percentage of African ancestry was related to DRB1*03:02 (AUC = 0.649, p = 0.016, threshold > 48.3%), DRB1*08:04 (AUC = 0.614, p < 0.042, threshold >16.5%), DRB1*09:01 (AUC = 0.679, p < 0.001, threshold > 26.1%), DRB1*11:02 (AUC = 0.636, p = 0.048, threshold > 35.9%), DRB1*15:03 (AUC = 0.690, p < 0.001< threshold > 13.4%), DQA1*01:02 (AUC = 0.551, p = 0.012, threshold > 37.8%), DQB1*02:02 (AUC = 0.543, p = 0.015, threshold > 30.7%), DQB1*03:01 (AUC = 0.547, p = 0.031, threshold > 35.3%), DQB1*06:02 (AUC = 0.594, p = 0.015, threshold > 37.8%) (Tables S2–S4).
Native American ancestry increased percentage was related to DRB1*04:04 (AUC = 0.552, p = 0.047, threshold > 7.9%), DRB1*04:07 (AUC = 0.652, p = 0.022, threshold > 6.5%), DRB1*08:02 (AUC = 0.648, p = 0.048, threshold > 23.4%), DQB1*05:07 (AUC = 0.702, p = 0.021, threshold > 23%). In addition, DRB1*16:02 was related to both African (AUC = 0.678, p = 0.003, threshold > 15.4%) and Native American (AUC = 0.621, p = 0.046, threshold >26.2%) increased percentages (Tables S2–S4). Furthermore, Tables S5–S7 show the descriptive statistics of global ancestry percentage according to HLA class II alleles.

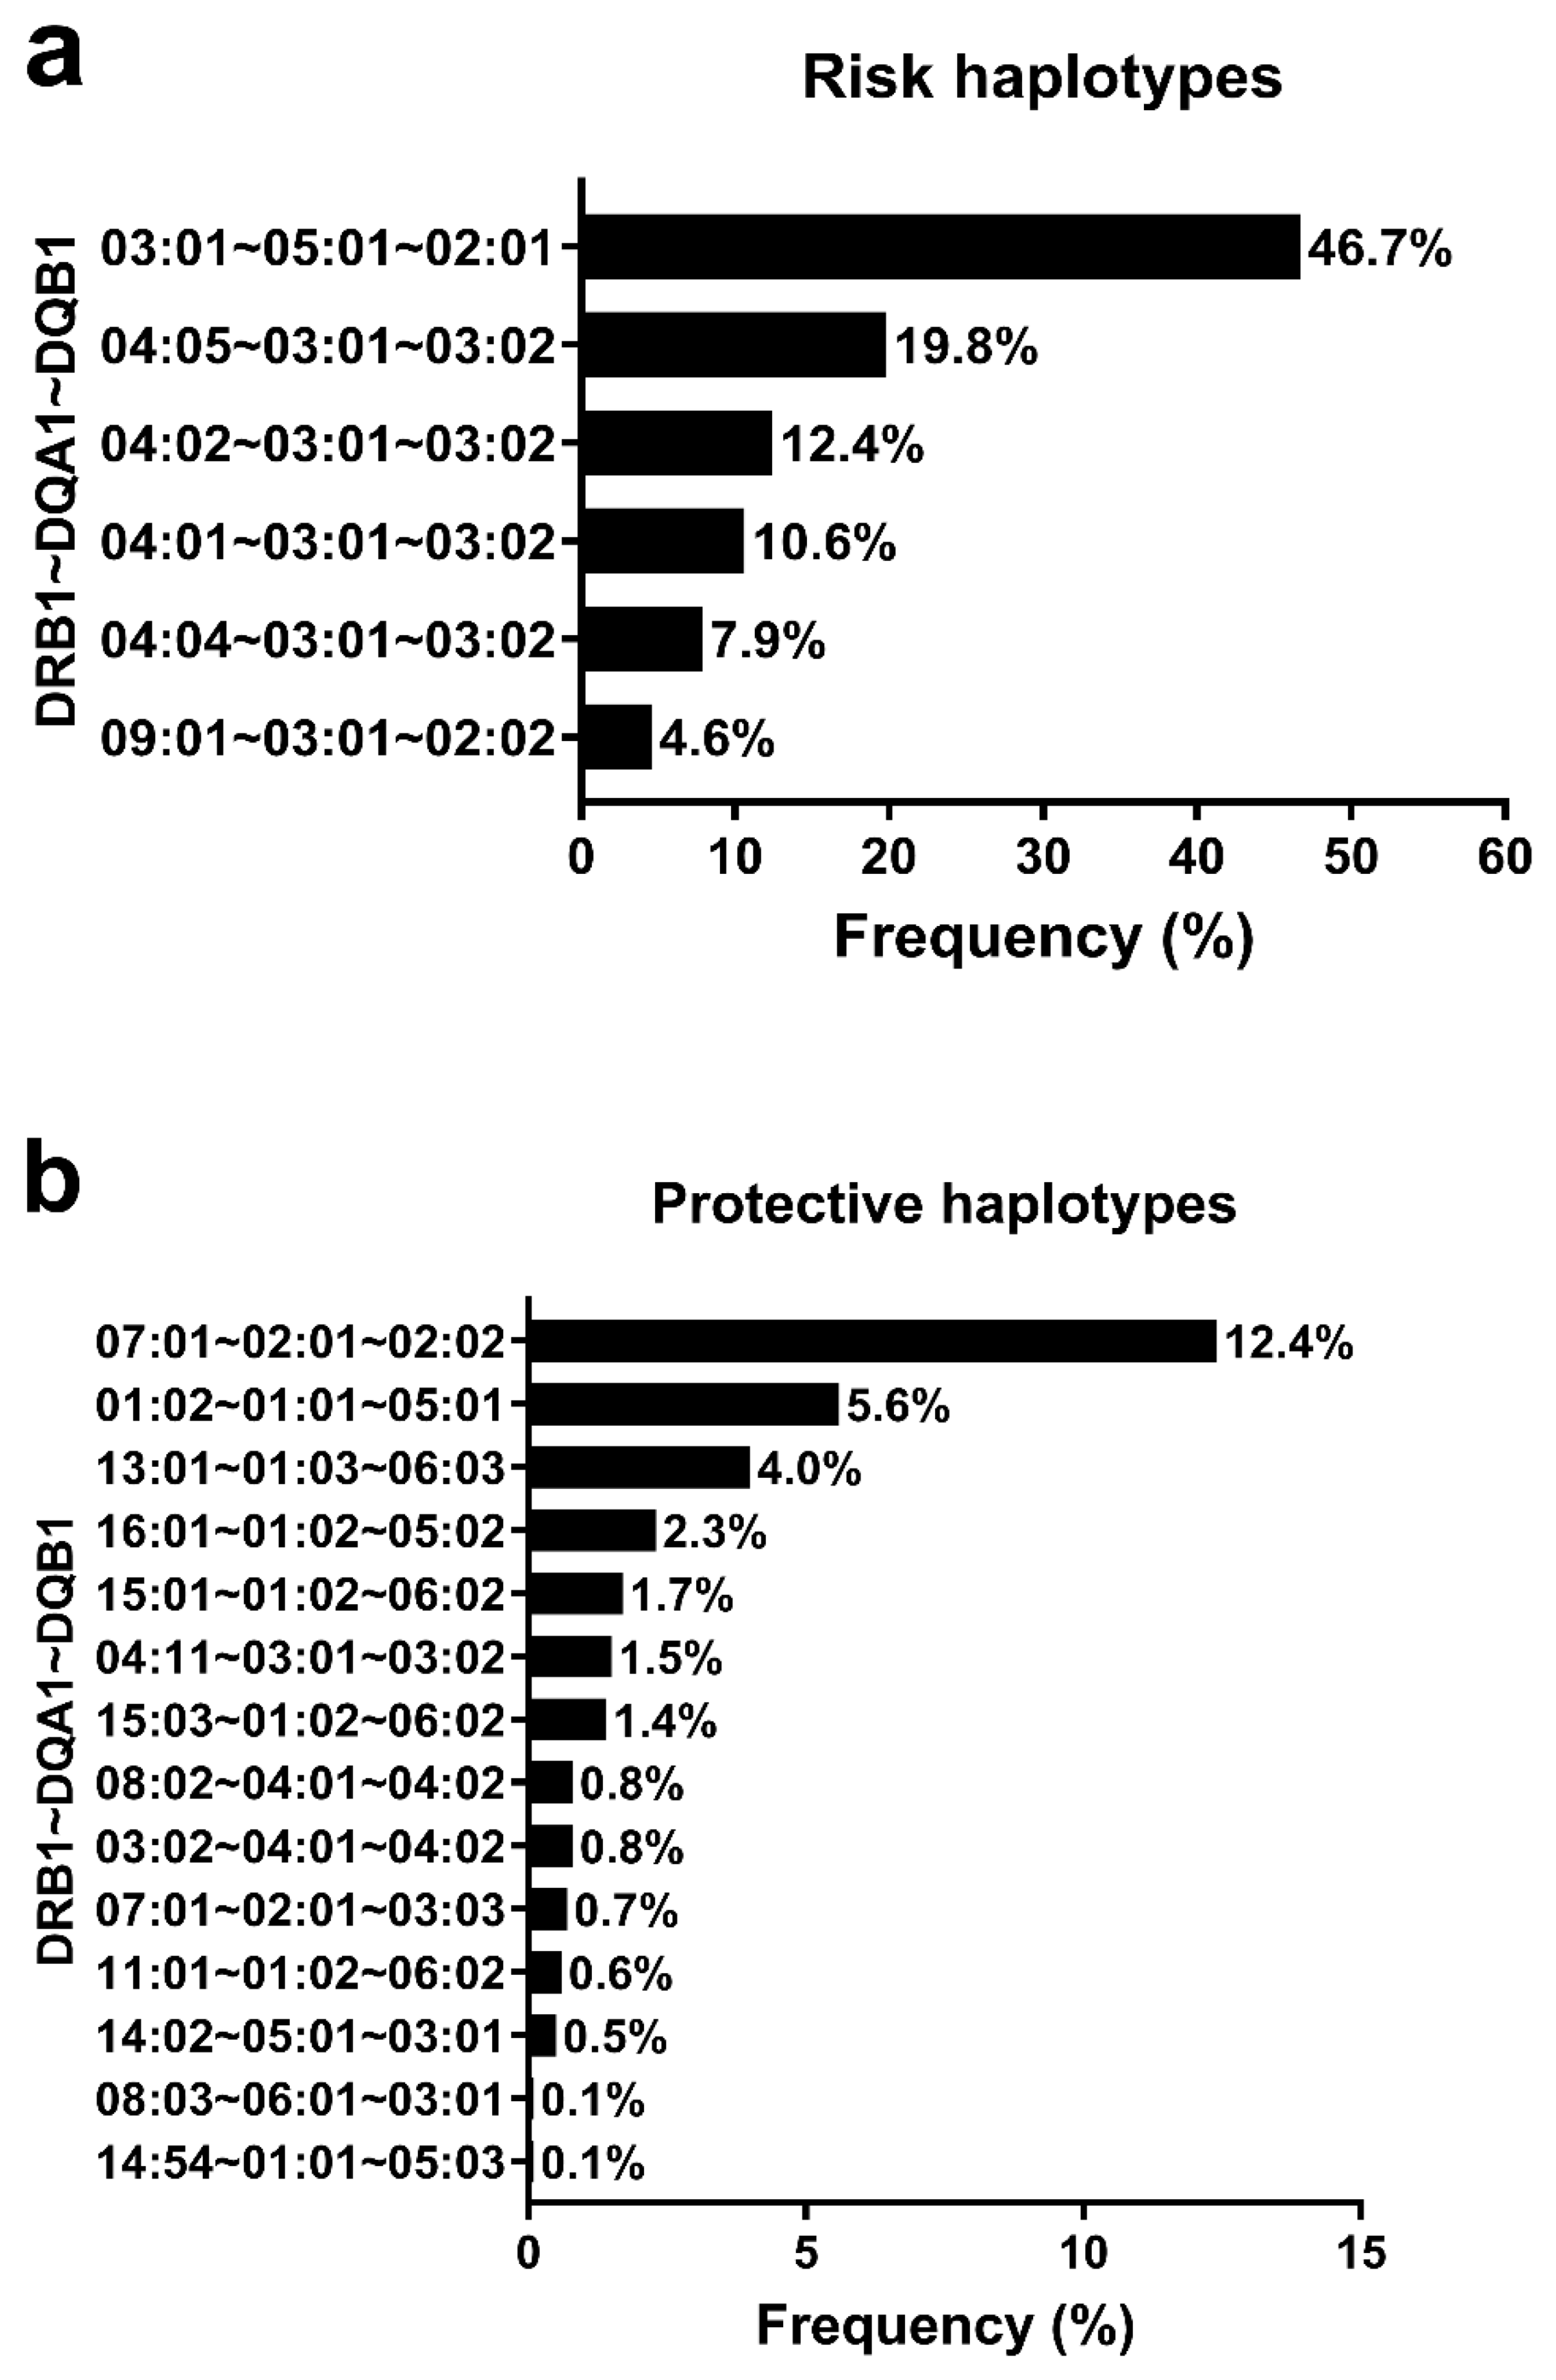
3.4. HLA Haplotypes Associated with T1D and Global Genomic Ancestry Percentage

Figure 5 illustrates the frequency of risk and protective haplotypes for T1D in the sample. The three most frequent risk haplotypes were 03:01~05:01g~02:01 (46.7%), 04:05~03:01g~03:02 (19.8%), and 04:02~03:01g~03:02 (12.4%) (Figure 5a). The three most frequent protective haplotypes were 07:01~02:01~02:02 (12.4%), 01:02~01:01~05:01 (5.6%) and 13:01~01:03~06:03 (4%) (Figure 5b). In the total sample, the risk genotype frequency was of 61.7%. In the comparative analysis, there was a higher European ancestry percentage in the risk groups than in the protective groups (p < 0.05). On the other hand, the African ancestry percentage was higher in the protective group than in the risk group (p < 0.05). The Native American ancestry percentage had no statistical difference between groups.
Table S8 shows the descriptive statistics of global ancestry percentage according to HLA haplotypes. Considering the risk haplotypes, the lowest mean of European ancestry was found in the risk haplotype 09:01~03:01~02:02 in comparison to DRB1*03:01~DQ2 and DRB1*04:01/02/04/05~DQ8. The former haplotype had the highest mean of African ancestry.
Considering protective haplotypes, the lowest mean of European ancestry was found in the following haplotypes: 03:02~04:01~04:02; 11:01~01:02~06:02, and 15:03~01:02~06:02; 08:02~04:01~04:02. These haplotypes have the highest mean of African and Native American ancestry.
Overall, the highest mean of European ancestry was found in 16:01~01:02~05:02, 04:02~03:01~03:02, 13:01~01:03~06:03, and 04:01~03:01~03:02. The highest mean of African ancestry was found in 11:01~01:02~06:02 and 09:01~03:01~02:02. The highest mean of Native American ancestry was found in 03:02~04:01~04:02 and 08:02~04:01~04:02.

4. Discussion

The present study seems to be the first one carried out that analyzed the relationship between GA and alleles/haplotypes/genotypes of the HLA system while using Brazilian patients having T1D who belong to one of the most highly admixed populations worldwide. The study findings showed that most of the studied patients (~75%) had over 50% of European GA contrasting with the lower percentage of patients that had over 50% of African GA and Native American GA, 7% and 1%, respectively. Moreover, the most important risk alleles, DRB1*03:01 and DRB1*04:01/02, had also a higher percentage of European GA. Moreover, patients with risk HLA haplotypes and with the combination of risk/protective haplotypes for T1D showed higher European GA contrasting with the higher African GA observed in patients with protective HLA haplotypes. These findings highlight that the increase in European GA can be associated with HLA alleles and risk haplotypes for Brazilian patients with T1D.
The data of the present study must be viewed in the context of the history of Brazil, a country with over 200 million people with a great genetic diversity due to an interethnic admixture among three main ethnic roots: European, African, and Native American for more than five centuries. However, it is important to emphasize that Brazil was originally inhabited only by Native Americans before its discovery by the Portuguese in 1500. Afterwards, a great Portuguese-Native American admixture started, followed by Portuguese-African that started with the arrival of African slaves in the 16th century, and finally with Europeans that came mostly as immigrants in the 17th and 18th centuries [19]. The latter event was related to a political process known as the “whitening of Brazilian population” (1872–1975), when approximately 5 million immigrants from different parts of Europe came to live in our country in about 100 years [19,21]. Although the majority of these immigrants were Italians and Iberians, an important percentage of them were also from other regions of Europe (Central and Eastern).
The aforementioned data must be aligned with the actual propose for the rule of HLA system, a system with a high level of polymorphism and genetic variation worldwide, which could be linked with significant signals of human geographic expansion, demographic history, and cultural diversification. Our results are in agreement with Sanchez-Mazas’ group statement in the complementary information of the HLA system as a tool for anthropological studies [26]. In this context, the Brazilian population, which was predominantly Black and Brown until 1872, have received different Caucasian HLA alleles from Europe in a short period of time [27]. Our results showed a great diversity of HLA alleles distribution, most of them having already been described in Europeans [28], Africans [29], and Native Americans [30], which is in accordance with our three main ethnic roots [16]. Some risk or protective HLA alleles were associated with an increased percentage of European, African, and Native American GA. In addition, we have observed a higher percentage of European GA in patients carrying risk haplotypes. It is noteworthy the higher percentage of African GA found in patients carrying protective haplotypes. Considering the overall studied population, 77.7% had some risk HLA haplotype that had been already described in Caucasians patients with T1D from Europe, USA, India, South America, Africa, and Asia [31].
Interestingly, the frequency of DRB1*09:01 was low in the study sample (4.8%), and its detection was related to increased African ancestry. These findings can be supported by previous studies that have identified an association between the DRB1*09:01 allele and T1D in African-Americans [9] and in Africans from Mali [29]. In general, this allele conferred risk in the presence of Caucasian risk alleles in the genotypes, such as DRB1:03:01 and DRB1*04 [7,9]. Although considered as an African allele, this allele was also observed in Native Americans (from Brazil, Paraguay, Bolivia, and Argentina) [32,33], Malaysian Indigenous [34], New Zealand Maori [35], and general population of West Russia (Siberia) [36]. The haplotype 09:01~03:01~02:02 had the highest mean of African ancestry among the risk haplotypes evaluated in this study. Three other HLA alleles, DRB1*03:02, DRB1*15:01, and DRB1*15:03, were among the ten most frequent protective alleles in the present study and were also described as protective alleles in African-Americans with T1D [9]. These latter HLA-DRB1 alleles had the highest African GA in our sample.
The ROC curve analysis, although significant, showed low accuracy for identifying risk HLA alleles for T1D related to increased percentage of European ancestry (DRB1*03:01, DRB1*04:01) and better accuracy for identifying risk allele DRB1:09:01 and the protective alleles and haplotypes DRB1*03:02, 11:01~01:02~06:02, and 15:03~01:02~06:02; 08:02~04:01~04:02, all related to an increased African ancestry in Brazilian patients with T1D. The findings observed with the ROC curve analysis could be probably related to the great admixture of the Brazilian population, mainly between White and other ethnic groups, such as Black and Native Americans, which could have resulted in a great diversity of allelic groups. For instance, the allele DRB1*16:02 could be an example: the ROC curve analysis showed similar accuracy for African and Native American GA, and this allele had one of the highest percentages of African GA (32.3%) and Native American (19.5%), in our database. This fact probably resulted from the admixture between Native Americans and Blacks during the slave trade that occurred in our country between the 17th and 19th centuries [37]. This allele was described in the general population of West Russia, Siberia [36], New Zealand Maori [35], and Native Americans from the USA, Mexico, Brazil, Bolivia, Argentina, Paraguay [32,33,34,35], and African-Americans [9]. So far, it had not been described in the African general population.
It is beyond the scope of the present study to formulate a hypothesis about genetic penetrance of risk alleles of the HLA system in patients with T1D, but it is noteworthy that some patients carrying the risk alleles of the HLA system had a lower percentage of European GA (supplementary Table S5).
In the present study, we did not formulate a hypothesis regarding genetic penetrance of risk alleles of the HLA system in patients with T1D. However, it is noteworthy that some patients carrying risk alleles of the HLA system had lower percentage of European GA (supplementary Table S5). In a previous study, we found an increased odds of presenting the allele DRB1*03:01 only in those patients who reported having all White relatives [38].
The current study has several strengths. It is the first multicenter study that included a large multi-ethnic sample of patients with T1D from all geographical regions of Brazil, characterized by a great genetic diversity and racial admixture. We used a uniform, standardized recruitment protocol in all participating centers and performed the genotyping of the three loci of the HLA system: HLA-DRB1, -DQA1, and -DQB1 in all studied patients. However, this study also has some limitations that need to be mentioned. We used only clinical criteria to define T1D, and we did not measure autoantibodies against pancreatic islet β cells or serum C peptide levels. This could have led to the misclassification of some patients as having T1D. Nonetheless, the use of clinical criteria to define T1D is common in epidemiologic studies such as ours [6,9].
Therefore, future studies analyzing other genetic markers associated with T1D could enhance the accuracy of ROC analysis and help to screen more genetic profiles associated with susceptibility to T1D.

5. Conclusions

The present study showed that in Brazilian patients with T1D, the most frequent alleles/haplotypes were those that have already been described as risk or protective alleles in multicenter studies conducted worldwide, mainly in Caucasian populations.
Moreover, the risk alleles and haplotypes were related to an increased percentage of European ancestry contrasting with the higher percentage of African ancestry observed in protective alleles/haplotypes.
However, future studies with other ancestry markers are needed to fill the knowledge gap of the genetic origin of T1D in admixed populations such as the Brazilian.

Supplementary Materials

The following supporting information can be downloaded at: https://www.mdpi.com/article/10.3390/genes14050991/s1, Table S1: Distribution of the HLA-DRB1~DQA1~DQB1 haplotypes (risk and protective) in patients with type 1 diabetes and individuals without type 1 diabetes; Table S2: ROC curve analysis of global genomic ancestry of HLA-DRB1* alleles; Table S3: ROC curve analysis of global genomic ancestry of HLA-DQA1 alleles; Table S4: ROC curve analysis of global genomic ancestry of HLA-DQB1* alleles; Table S5: Descriptive statistics of global genomic ancestry percentage according to HLA-DRB1 alleles; Table S6: Descriptive statistics of global genomic ancestry percentage according to HLA-DQA1 alleles; Table S7: Descriptive statistics of global genomic ancestry percentage according to HLA-DQB1 alleles; Table S8: Descriptive statistics of global genomic ancestry percentage according to HLA haplotypes.

Author Contributions

Conceptualization, M.B.G., D.C.S., R.S.d.S.A. and L.C.P.; methodology, M.B.G., D.A.S., R.S.d.S.A. and L.C.P.; software, V.R., D.A.S. and L.C.P.; validation, D.A.S., P.R.V.B. and L.C.P.; data curation, D.C.S., P.R.V.B., S.A.D., E.J.P., V.O.F., R.M.M.J., J.S.F., R.R. and C.A.N.; formal analysis, M.B.G., V.R., D.A.S. and L.C.P.; writing—original draft preparation, M.B.G., V.R. and R.S.d.S.A.; writing—review and editing, M.B.G., D.A.S., D.C.S., P.R.V.B., S.A.D., E.J.P., V.O.F., R.M.M.J., J.S.F., R.R., C.A.N. and L.C.P.; funding acquisition, M.B.G. and L.C.P. All authors have read and agreed to the published version of the manuscript.

Funding

This work was supported by FAPERJ (Fundação do Amparo à Pesquisa do Estado do Rio de Janeiro) [grant numbers E 26/110.170/2013] and CNPq (Conselho Nacional de Desenvolvimento Científico e Tecnológico do Brasil) [grant number 563753/2010-2]. L.C.P is also supported by FAPERJ (CNE) and CNPq. L.C.P. was supported by FAPERJ (Fundação do Amparo à Pesquisa do Estado do Rio de Janeiro) (grant numbers E-26/202.683/2019 and E-26/200.530/20123) and CNPq (Conselho Nacional de Desenvolvimento Científico e Tecnológico do Brasil) (grant number 309881/2018-8).

Institutional Review Board Statement

This study was approved by the ethics committee of Pedro Ernesto University Hospital (Rio de Janeiro State University) (number: 0214.0.228.000-10) and was conducted according to the Declaration of Helsinki.

Informed Consent Statement

Informed consent was obtained from all subjects involved in the study.

Data Availability Statement

The datasets generated during and/or analyzed during the current study are available with the corresponding author upon reasonable request.

Acknowledgments

We thank all the participants in this study. In addition, we also thank Elisangela Santos, Maria Fátima Bevilacqua, Eliete Leão and Vitor Branco Alves for their technical assistance and all Brazilian Type 1 Diabetes Study Group (BrazDiab1SG) participants that are listed below (Appendix A).

Conflicts of Interest

The authors declare no conflict of interest.

Ethical Statement

This study was approved by the Ethic Committee of Pedro Ernesto University Hospital (Rio de Janeiro State University) under opinion number 0214.0.228.000-10, on 10 November 2010, and by the local ethics committee of each center. All participants or their legal representatives were informed about the objectives and procedures of the study and signed an informed consent form. We confirm that all experiments were performed in accordance with relevant guidelines and regulations.

Appendix A. Brazilian Type 1 Diabetes Study Group (BrazDiab1SG) Participants That Are Listed Below

NameInstitutionEmail
Marilia Brito Gomes *Rio de Janeiro State University[email protected]
Laura Nunes MeloRio de Janeiro State University[email protected]
Roberta CobasRio de Janeiro State University[email protected]
Lucianne Righeti Monteiro TannusRio de Janeiro State University [email protected]
Melanie Rodacki *Federal University Hospital of Rio de Janeiro[email protected]
Lenita ZajdenvergFederal University Hospital of Rio de Janeiro[email protected]
Joana Rodrigues DantasFederal University Hospital of Rio de Janeiro[email protected]
Maria Lúcia Cardillo Corrêa-Giannella *University Hospital of São Paulo[email protected]
Sharon Nina AdmoniUniversity Hospital of São Paulo[email protected]
Daniele Pereira dos SantosUniversity Hospital of São Paulo[email protected]
Carlos Antonio Negrato *Bauru’s Diabetics Association[email protected]
Maria de Fatima GuedesBauru’s Diabetics Association[email protected]
Sergio Atala Dib *Federal University of São Paulo State[email protected]
Celso Ferreira de Camargo Sallum FilhoFederal University of São Paulo State[email protected]
Elisabeth João Pavin *University of Campinas[email protected]
Caroline TakanoUniversity of Campinas[email protected]
Rosângela Roginski Rea *Federal University of Paraná[email protected]
Nicole Balster RomanziniFederal University of Paraná[email protected]
Mirela Azevedo *Clinical Hospital of Porto Alegre[email protected]
Luis Henrique CananiClinical Hospital of Porto Alegre[email protected]
Hermelinda Cordeiro Pedrosa *Regional Hospital of Taguatinga[email protected]
Monica TolentinoRegional Hospital of Taguatinga[email protected]
Cejana Hamu AguiarRegional Hospital of Taguatinga[email protected]
Reine Marie Chaves Fonseca *Diabetes and Endocrinology Center of Bahia[email protected]
Ludmila Chaves FonsecaDiabetes and Endocrinology Center of Bahia[email protected]
Raffaele KasprowiczDiabetes and Endocrinology Center of Bahia[email protected]
Adriana Costa e Forti *Diabetes and Hypertension Center of Ceará[email protected]
Angela Delmira Nunes MendesDiabetes and Hypertension Center of Ceará[email protected]
Renan Montenegro Junior *Federal University of Ceará[email protected]
Virgínia Oliveira FernandesFederal University of Ceará[email protected]
João Soares Felício *Federal University Hospital of Pará[email protected]
Flavia Marques SantosFederal University Hospital of Pará[email protected]
Brazilian Type 1 Diabetes Study Group (BrazDiab1SG). Executive steering committee: Marilia Brito Gomes (chair), Carlos Antonio Negrato. Principal investigators are indicated by an asterisk.

References

  1. Cudworth, A.G.; Woodrow, J.C. HL-A antigens and diabetes mellitus. Lancet 1974, 304, 1153. [Google Scholar] [CrossRef]
  2. Noble, J.A. Immunogenetics of type 1 diabetes: A comprehensive review. J. Autoimmun. 2015, 64, 101–112. [Google Scholar] [CrossRef]
  3. Ogle, G.D.; James, S.; Dabelea, D.; Pihoker, C.; Svennson, J.; Maniam, J.; Klatman, E.L.; Patterson, C.C. Global estimates of incidence of type 1 diabetes in children and adolescents: Results from the International Diabetes Federation Atlas, 10th edition. Diabetes Res. Clin. Pract. 2022, 183, 109083. [Google Scholar] [CrossRef]
  4. Negrato, C.A.; Lauris, J.R.P.; Saggioro, I.B.; Corradini, M.C.M.; Borges, P.R.; Crês, M.C.; Junior, A.L.; Guedes, M.F.S.; Gomes, M.B. Increasing incidence of type 1 diabetes between 1986 and 2015 in Bauru, Brazil. Diabetes Res. Clin. Pract. 2017, 127, 198–204. [Google Scholar] [CrossRef]
  5. Redondo, M.J.; Steck, A.K.; Pugliese, A. Genetics of type 1 diabetes. Pediatr. Diabetes 2018, 19, 346–353. [Google Scholar] [CrossRef] [PubMed]
  6. Noble, J.A.; Erlich, H.A. Genetics of Type 1 Diabetes. Cold Spring Harb. Perspect. Med. 2012, 2, a007732. [Google Scholar] [CrossRef] [PubMed]
  7. Santos, D.C.; Porto, L.C.; Oliveira, R.V.; Secco, D.; Hanhoerderster, L.; Pizarro, M.H.; Barros, B.S.V.; Mello, L.G.N.; Muniz, L.H.; Silva, D.A.; et al. HLA class II genotyping of admixed Brazilian patients with type 1 diabetes according to self-reported color/race in a nationwide study. Sci. Rep. 2020, 10, 6628. [Google Scholar] [CrossRef] [PubMed]
  8. Noble, J.A.; Johnson, J.; Lane, J.A.; Valdes, A.M. HLA Class II Genotyping of African American Type 1 Diabetic Patients Reveals Associations Unique to African Haplotypes. Diabetes 2013, 62, 3292–3299. [Google Scholar] [CrossRef]
  9. Halagan, M.; Oliveira, D.C.; Maiers, M.; Fabreti-Oliveira, R.A.; Moraes, M.E.H.; Visentainer, J.E.L.; Pereira, N.F.; Romero, M.; Cardoso, J.F.; Porto, L.C. The distribution of HLA haplotypes in the ethnic groups that make up the Brazilian Bone Marrow Volunteer Donor Registry (REDOME). Immunogenetics 2018, 70, 511–522. [Google Scholar] [CrossRef] [PubMed]
  10. Suarez-Kurtz, G.; Pena, S.D.J.; Struchiner, C.J.; Hutz, M.H. Pharmacogenomic Diversity among Brazilians: Influence of Ancestry, Self-Reported Color, and Geographical Origin. Front. Pharmacol. 2012, 3, 191. [Google Scholar] [CrossRef]
  11. Gomes, M.B.; Gabrielli, A.B.; Santos, D.C.; Pizarro, M.H.; Barros, B.S.V.; Negrato, C.A.; Dib, S.A.; Porto, L.C.; Silva, D.A. Self-reported color-race and genomic ancestry in an admixed population: A contribution of a nationwide survey in patients with type 1 diabetes in Brazil. Diabetes Res. Clin. Pract. 2018, 140, 245–252. [Google Scholar] [CrossRef] [PubMed]
  12. Gomes, K.F.B.; Santos, A.S.; Semzezem, C.; Correia, M.R.; Brito, L.A.; Ruiz, M.O.; Fukui, R.T.; Matioli, S.R.; Passos-Bueno, M.R.; Silva, M.E.R.D. The influence of population stratification on genetic markers associated with type 1 diabetes. Sci. Rep. 2017, 7, 43513. [Google Scholar] [CrossRef]
  13. Sharp, S.A.; Rich, S.S.; Wood, A.R.; Jones, S.E.; Beaumont, R.N.; Harrison, J.W.; Schneider, D.A.; Locke, J.M.; Tyrrell, J.; Weedon, M.N.; et al. Development and Standardization of an Improved Type 1 Diabetes Genetic Risk Score for Use in Newborn Screening and Incident Diagnosis. Diabetes Care 2019, 42, 200–207. [Google Scholar] [CrossRef]
  14. Harrison, J.W.; Tallapragada, D.S.P.; Baptist, A.; Sharp, S.A.; Bhaskar, S.; Jog, K.S.; Patel, K.A.; Weedon, M.N.; Chandak, G.R.; Yajnik, C.S.; et al. Type 1 diabetes genetic risk score is discriminative of diabetes in non-Europeans: Evidence from a study in India. Sci. Rep. 2020, 10, 9450. [Google Scholar] [CrossRef] [PubMed]
  15. Onengut-Gumuscu, S.; Chen, W.M.; Robertson, C.C.; Bonnie, J.K.; Farber, E.; Zhu, Z.; Oksenberg, J.R.; Brant, S.R.; Louis Bridges, S.; Edberg, J.C.; et al. Type 1 diabetes risk in African-ancestry participants and utility of an ancestry-specific genetic risk score. Diabetes Care 2019, 42, 406–415. [Google Scholar] [CrossRef] [PubMed]
  16. Pena, S.D.J.; Santos, F.R.; Tarazona-Santos, E. Genetic admixture in Brazil. Am. J. Med. Genet. Part C Semin. Med. Genet. 2020, 184, 928–938. [Google Scholar] [CrossRef]
  17. Saloum de Neves Manta, F.; Pereira, R.; Vianna, R.; Beuttenmüller de Araújo, A.R.; Leite Góes Gitaí, D.; Aparecida da Silva, D.; de Vargas Wolfgramm, E.; da Mota Pontes, I.; Ivan Aguiar, J.; Ozório Moraes, M.; et al. Revisiting the Genetic Ancestry of Brazilians Using Autosomal AIM-Indels. PLoS ONE 2013, 8, e75145. [Google Scholar] [CrossRef]
  18. Torres, L.; da Silva Bouzas, L.F.; Almada, A.; de Sobrino Porto, L.C.M.; Abdelhay, E. Distribution of HLA-A, -B and -DRB1 antigenic groups and haplotypes from the Brazilian bone marrow donor registry (REDOME). Hum. Immunol. 2017, 78, 602–609. [Google Scholar] [CrossRef]
  19. Boquett, J.A.; Bisso-Machado, R.; Zagonel-Oliveira, M.; Schüler-Faccini, L.; Fagundes, N.J.R. HLA diversity in Brazil. HLA 2020, 95, 3–14. [Google Scholar] [CrossRef]
  20. Gomes, M.B.; Negrato, C.A. Adherence to insulin therapeutic regimens in patients with type 1 diabetes. A nationwide survey in Brazil. Diabetes Res. Clin. Pract. 2016, 120, 47–55. [Google Scholar] [CrossRef]
  21. Instituto Brasileiro de Geografia e Estatística (IBGE). Censo 2000. 2000. Available online: http:/www.ibge.gov.br/censo (accessed on 15 May 2022).
  22. Pereira, R.; Phillips, C.; Pinto, N.; Santos, C.; dos Santos, S.E.B.; Amorim, A.; Carracedo, Á.; Gusmão, L. Straightforward inference of ancestry and admixture proportions through ancestry-informative insertion deletion multiplexing. PLoS ONE 2012, 7, e29684. [Google Scholar] [CrossRef] [PubMed]
  23. Hurley, C.K.; Kempenich, J.; Wadsworth, K.; Sauter, J.; Hofmann, J.A.; Schefzyk, D.; Schmidt, A.H.; Galarza, P.; Cardozo, M.B.; Dudkiewicz, M.; et al. Common, intermediate and well-documented HLA alleles in world populations: CIWD version 3.0.0. HLA 2020, 95, 516–531. [Google Scholar] [CrossRef] [PubMed]
  24. Excoffier, L.; Lischer, H.E.L. Arlequin suite ver 3.5: A new series of programs to perform population genetics analyses under Linux and Windows. Mol. Ecol. Resour. 2010, 10, 564–567. [Google Scholar] [CrossRef] [PubMed]
  25. Schisterman, E.F.; Perkins, N.J.; Liu, A.; Bondell, H. Optimal Cut-point and Its Corresponding Youden Index to Discriminate Individuals Using Pooled Blood Samples. Epidemiology 2005, 16, 73–81. [Google Scholar] [CrossRef] [PubMed]
  26. Sanchez-Mazas, A.; Fernandez-Viña, M.; Middleton, D.; Hollenbach, J.A.; Buhler, S.; Di, D.; Rajalingam, R.; Dugoujon, J.-M.; Mack, S.J.; Thorsby, E. Immunogenetics as a tool in anthropological studies. Immunology 2011, 133, 143–164. [Google Scholar] [CrossRef]
  27. Levy, M.S.F. O papel da migração internacional na evolução da população brasileira (1872 a 1972). Rev. Saude Publica 1974, 8, 49–90. [Google Scholar] [CrossRef]
  28. Sanchez-Mazas, A.; Nunes, J.M.; Middleton, D.; Sauter, J.; Buhler, S.; McCabe, A.; Hofmann, J.; Baier, D.M.; Schmidt, A.H.; Nicoloso, G.; et al. Common and well-documented HLA alleles over all of Europe and within European sub-regions: A catalogue from the European Federation for Immunogenetics. HLA 2017, 89, 104–113. [Google Scholar] [CrossRef]
  29. Besançon, S.; Govender, D.; Sidibé, A.T.; Noble, J.A.; Togo, A.; Lane, J.A.; Mack, S.J.; Atkinson, M.A.; Wasserfall, C.H.; Kakkat, F.; et al. Clinical features, biochemistry, and HLA - DRB1 status in youth-onset type 1 diabetes in Mali. Pediatr. Diabetes 2022, 23, 1552–1559. [Google Scholar] [CrossRef]
  30. Salzano, F.M.; Sans, M. Interethnic admixture and the evolution of Latin American populations. Genet. Mol. Biol. 2014, 37 (Suppl. S1), 151–170. [Google Scholar] [CrossRef]
  31. Redondo, M.J.; Gignoux, C.R.; Dabelea, D.; Hagopian, W.A.; Onengut-Gumuscu, S.; Oram, R.A.; Rich, S.S. Type 1 diabetes in diverse ancestries and the use of genetic risk scores. Lancet Diabetes Endocrinol. 2022, 10, 597–608. [Google Scholar] [CrossRef]
  32. Probst, C.M.; Hutz, M.H.; Salzano, F.M.; Zago, M.A.; Hill, K.; Hurtado, A.M. HLA class II diversity in seven Amerindian populations. Clues about the origins of the Ache. Tissue Antigens 2003, 62, 512–526. [Google Scholar] [CrossRef]
  33. Parolín, M.L.; Carnese, F.R. HLA-DRB1 alleles in four Amerindian populations from Argentina and Paraguay. Genet. Mol. Biol. 2009, 32, 212–219. [Google Scholar] [CrossRef]
  34. Jinam, T.A.; Hosomichi, K.; Nakaoka, H.; Phipps, M.E.; Saitou, N.; Inoue, I. Allelic and haplotypic HLA diversity in indigenous Malaysian populations explored using Next Generation Sequencing. Hum. Immunol. 2022, 83, 17–26. [Google Scholar] [CrossRef] [PubMed]
  35. Tracey, M.C.; Carter, J.M. Class II HLA allele polymorphism: DRB1, DQB1 and DPB1 alleles and haplotypes in the New Zealand Maori population. Tissue Antigens 2006, 68, 297–302. [Google Scholar] [CrossRef] [PubMed]
  36. Uinuk-ool, T.S.; Takezaki, N.; Sukernik, R.I.; Nagl, S.; Klein, J. Origin and affinities of indigenous Siberian populations as revealed by HLA class II gene frequencies. Hum. Genet. 2002, 110, 209–226. [Google Scholar] [CrossRef] [PubMed]
  37. Instituto Brasileiro de Geografia e Estatística (IBGE). Brasil: 500 Anos de Povoamento; IBGE: Rio de Janeiro, Brazil, 2007; pp. 35–99. [Google Scholar]
  38. Gomes, M.B.; Porto, L.C.; Silva, D.A.; Negrato, C.A.; Pavin, E.J.; Montenegro Junior, R.; Dib, S.A.; Felício, J.S.; Santos, D.C.; Muniz, L.H.; et al. HLA Genotypes and Type 1 Diabetes and Its Relationship to Reported Race/Skin Color in Their Relatives: A Brazilian Multicenter Study. Genes 2022, 13, 972. [Google Scholar] [CrossRef] [PubMed]
Figure 1. Flowchart of studied patients with type 1 diabetes.
Genes 14 00991 g001
Figure 2. Descriptive analysis of global genomic ancestry percentage in a Brazilian sample of patients with type 1 diabetes. (a) Mean and standard deviation of European, African, and Native American ancestry percentage. (b) Individual global ancestry sorted in ascending order of European ancestry percentage. (c) Distribution of European, African, and Native American ancestry percentages sorted in different cutoff categories.
Genes 14 00991 g002
Figure 3. Distribution of allele frequency of HLA class II in Brazilian patients with type 1 diabetes (2n = 3198). (a) Allele frequency of HLA-DRB1. (b) Allele frequency of HLA-DQA1. (c) Allele frequency of HLA-DQB1.
Genes 14 00991 g003
Figure 4. HLA class II alleles associated with increased percentage of European, African, or Native American genomic ancestry in the Brazilian patients with type 1 diabetes (p < 0.05 in AUC analysis).
Genes 14 00991 g004
Figure 5. Distribution of risk (a) and protective (b) haplotypes for patients with type 1 diabetes (n = 1599).
Genes 14 00991 g005
Table 1. Distribution of demographics and diabetes data (n = 1599).
Variablesn(%)
Sex
Male738(46.2)
Female861(53.8)
Age
<20 years old360(22.5)
≥20 years old1239(77.5)
Age at type 1 diabetes diagnosis (mean ± SD)14.8 ± 8.9
Age group at type 1 diabetes onset
0–4 years145(9.1)
5–9 years328(20.5)
10–14 years442(27.6)
15–19 years281(17.6)
20–24 years158(9.9)
25–29 years134(8.4)
≥30 years111(6.9)
Brazilian region of birth
Southeast680(42.5)
Northeast539(33.7)
South208(13.0)
Midwest127(7.9)
North45(2.8)
Self-reported skin-color/race
White824(51.5)
Brown616(38.5)
Black130(8.1)
Yellow16(1.0)
Indigenous13(0.8)
Data are presented as mean, standard deviation, or frequency, n (%) or mean and standard deviation (±SD).
Disclaimer/Publisher’s Note: The statements, opinions and data contained in all publications are solely those of the individual author(s) and contributor(s) and not of MDPI and/or the editor(s). MDPI and/or the editor(s) disclaim responsibility for any injury to people or property resulting from any ideas, methods, instructions or products referred to in the content.

