Article

Chromosome-Level Genome Assembly of the Blue Mussel Mytilus chilensis Reveals Molecular Signatures Facing the Marine Environment

by
Cristian Gallardo-Escárate
1,*,
Valentina Valenzuela-Muñoz
1,
Gustavo Nuñez-Acuña
1,
Diego Valenzuela-Miranda
1,
Fabian J. Tapia
1,
Marco Yévenes
2,
Gonzalo Gajardo
2,
Jorge E. Toro
3,
Pablo A. Oyarzún
4,
Gloria Arriagada
5,6,
Beatriz Novoa
7,
Antonio Figueras
7,
Steven Roberts
8 and
Marco Gerdol
9
1
Center for Aquaculture Research, University of Concepción, Concepción 4070386, Chile
2
Laboratorio de Genética, Acuicultura & Biodiversidad, Departamento de Ciencias Biológicas y Biodiversidad, Universidad de Los Lagos, Osorno 5310230, Chile
3
Facultad de Ciencias, Instituto de Ciencias Marinas y Limnológicas (ICML), Universidad Austral de Chile, Valdivia 5110566, Chile
4
Centro de Investigación Marina Quintay (CIMARQ), Universidad Andres Bello, Quintay 2340000, Chile
5
Instituto de Ciencias Biomédicas, Facultad de Medicina, Universidad Andrés Bello, Santiago 8370186, Chile
6
FONDAP Center for Genome Regulation, Santiago 8370415, Chile
7
Instituto de Investigaciones Marinas (IIM), Consejo Superior de Investigaciones Científicas (CSIC), 36208 Vigo, Spain
8
School of Aquatic and Fishery Sciences (SAFS), University of Washington, Seattle, WA 98195, USA
9
Department of Life Sciences, University of Trieste, 34127 Trieste, Italy
*
Author to whom correspondence should be addressed.
Genes 2023, 14(4), 876; https://doi.org/10.3390/genes14040876
Submission received: 3 March 2023 / Revised: 28 March 2023 / Accepted: 30 March 2023 / Published: 7 April 2023
(This article belongs to the Special Issue Genetics and Genomics in Aquatic Animals)

Abstract

:
The blue mussel Mytilus chilensis is an endemic and key socioeconomic species inhabiting the southern coast of Chile. This bivalve species supports a booming aquaculture industry, which entirely relies on artificially collected seeds from natural beds that are translocated to diverse physical–chemical ocean farming conditions. Furthermore, mussel production is threatened by a broad range of microorganisms, pollution, and environmental stressors that eventually impact its survival and growth. Herein, understanding the genomic basis of the local adaption is pivotal to developing sustainable shellfish aquaculture. We present a high-quality reference genome of M. chilensis, which is the first chromosome-level genome for a Mytilidae member in South America. The assembled genome size was 1.93 Gb, with a contig N50 of 134 Mb. Through Hi-C proximity ligation, 11,868 contigs were clustered, ordered, and assembled into 14 chromosomes in congruence with the karyological evidence. The M. chilensis genome comprises 34,530 genes and 4795 non-coding RNAs. A total of 57% of the genome contains repetitive sequences with predominancy of LTR-retrotransposons and unknown elements. Comparative genome analysis of M. chilensis and M. coruscus was conducted, revealing genic rearrangements distributed into the whole genome. Notably, transposable Steamer-like elements associated with horizontal transmissible cancer were explored in reference genomes, suggesting putative relationships at the chromosome level in Bivalvia. Genome expression analysis was also conducted, showing putative genomic differences between two ecologically different mussel populations. The evidence suggests that local genome adaptation and physiological plasticity can be analyzed to develop sustainable mussel production. The genome of M. chilensis provides pivotal molecular knowledge for the Mytilus complex.

1. Introduction

The blue mussel M. chilensis (Hupé, 1854) is Chile’s endemic, ecological, and socioeconomic key species that leads the national shellfish aquaculture. The farming of M. chilensis involves the use of ropes or nets that are suspended from rafts or longlines in the sea. The mussels attach themselves to the ropes or nets and grow there until they reach market size, which typically takes about 18–24 months. The mussels feed on natural phytoplankton in the water, and their growth and survival depend on the availability and quality of this food source [1]. In Chile, the aquaculture of M. chilensis is an important industry, with production levels that have been steadily increasing over the years. The mussels are exported to many countries around the world, and they are highly valued for their flavor and nutritional value. The aquaculture mussel production in Chile was about 400,000 tons in 2020 [2].
However, the success of mussel aquaculture production in Chile is threatened by a wide range of microorganisms [3,4,5], marine pollution [6], and climate variability that can impact the larval settlement and growth of mussel populations [7,8,9]. To cope with those stressors, mussels and marine invertebrates produce two-component responses, a specific response to the stressor and a more general response involving immune and endocrine pathways [10]. Multi-stressors’ impacts have been predicted to have additive, synergetic, or antagonistic effects on marine organisms’ physiology [11]. These different effects are directly linked to the amount of time between the occurrence of stressors, their intensity, and the organism’s ability to return to homeostasis before a new stressor occurs [12]. Despite these predictions, meta-data analyses show that most of the studied multi-stressors had synergetic effects on organisms’ physiology. Notably, isolated effects of environmental stressors or pathogen infection on the mussel immune system have been extensively studied [13,14,15,16,17,18,19,20]. However, mussels’ immune response to the combination of stressors remains unexplored. The interplaying between the immune system and multi-environmental stressors such as ocean acidification, hypoxia, marine heatwaves, harmful algal blooms, and pathogen infections requires physiological, cellular, and molecular tools that uncover the complexity of mussel biology. High-quality genome assembly at the chromosome level is pivotal to driving the scientific community in this endeavor and mussels represent an outstanding model species. For instance, mussel species display morphologically conserved karyotypes, and recent studies have evidenced whole-genome duplication events [21,22]. Compared with other bivalves, the reported mussel genomes share relatively large genome sizes characterized by high heterozygosity and expanded mobile elements [23,24,25,26,27]. Unfortunately, these genome features challenge the assembly efforts to avoid genome fragmentation. Up to now, chromosome-level genome assembly for Mytilidae has only been reported for the congeneric species M. coruscus [28] and the zebra mussel Dreissena polymorpha [27]; meanwhile, other members of the family have been reported as highly contiguous reference assemblies at contig level [29,30,31]. Interestingly, the presence–absence variation (PAV) phenomenon has recently been reported for M. galloprovincialis, where a pan-genome composed of 20,000 protein-coding genes was observed in conjunction with dispensable genes that are entirely missing in some mussels [32].
The Chilean blue mussel M. chilensis, a close relative of the M. edulis species complex of the northern hemisphere [33,34], represents an iconic species to explore key questions in ecology [35], ecophysiology [36] and adaptative genomics [37,38]. It is a keystone taxon in the ecosystem regulating phytoplankton and nutrient flow and contributes to remineralizing organic deposits in the sediment [39,40]. It inhabits rocky substrates in the intertidal and subtidal zones along the southern Pacific Ocean from latitude 38S to 53S [41]. As a gonochoric species with an annual gametogenic cycle, sexual maturity occurs in spring–summer, where planktonic larvae can drift between 20 and 45 days before settlement [42]. Dispersal potential has been estimated to be up to 30 km, allowing different degrees of gene flow among mussel populations [43].
In this study, PacBio sequencing, and Hi-C scaffolding technology were jointly used to assemble the first chromosome-level reference genome of M. chilensis. Moreover, we conducted a comparative genomics study among reported genome mussel species and analyzed the molecular signatures in two mussel populations facing distinct physical–chemical ocean conditions. Genomic features revealed putative chromosome rearrangements among mussel species, suggesting phylogenetic relationships for retrotransposons in Mytilidae. Specifically, Steamer-like elements were classified as LTR-retrotransposons because they contain long terminal repeats (LTRs) at both ends of their DNA sequence. The chromosome-level genome assembly of M. chilensis is a useful resource for genome-wide association studies (GWAS) as a powerful tool used in genetics to identify genetic variants associated with complex traits or diseases. Notably, this study revealed the most differentially expressed genes and single nucleotide polymorphisms found in M. chilensis populations, revealing specific transcriptome profiles associated with metabolism and immune-related genes. The knowledge gained in this research will provide pivotal information for exploring how the marine environment drives phenotypic plasticity, which can be associated with genome adaptation in mussel populations.

2. Materials and Methods

2.1. Sample Collection, NGS Libraries, and Sequencing

Adult M. chilensis were collected from a natural bed in Puerto Mont (41°48′ S–73°5′ W), Chile (Figure 1A). Five mussels were selected for whole-genome sequencing using 1 mL of hemolymph collected from each specimen to reduce the heterozygosity. The samples were centrifuged at 1200 RPM to isolate the hemocyte cells and preserved by liquid nitrogen. High-quality DNA was isolated using the Qiagen DNA purification kit (QIAGEN, Germantown, MD, USA) following the manufacturer’s instructions and quantified by a Tape Station 2200 instrument (Agilent, Santa Clara, CA, USA). DNA samples >9.5 in DNA integrity numbers (DIN) were selected for library preparation. Furthermore, 50 individuals per population were sampled from Cochamó (41°28′ S–72°18′ W) and Yaldad (43°07′ S–73°44′ W), in southern Chile, to isolate RNA and explore molecular signatures associated with the local genome adaptation. Herein, these mussel populations inhabit contrasting oceanic environments characterized by an estuary with continuous input of freshwater and vertical stratification, and a bay exposed to open sea influence, respectively. The temporal and spatial variability of sea surface temperature (SST) around Puerto Montt, Chiloé island, and at the Yaldad and Cochamó sites were analyzed using satellite images. Data on sea surface temperature in the region of interest were obtained from MUR-SST (Multi-scale Ultra-High-Resolution SST) distributed by NOAA through its ERDDAP platform. The MUR-SST images have a spatial resolution of 1 km and a temporal resolution of 1 day. In situ temperature (°C) and salinity (PSU) seawater measurements were obtained for both locations between 2018 and 2019. The raw environmental data were collected from the CHRONOS database, managed by Instituto de Fomento Pesquero, IFOP (Puerto Montt, Chile).
Samples were prepared according to the SMRTbell guide for sequencing on the PacBio Sequel II System. The genomic DNA isolated from 5 individuals collected from Puerto Montt was sequenced using SMRT sequencing according to the manufacturer’s protocols. SMRT sequencing yielded 882.1 Gb and 63 million long reads from 2 HiFi SMRT cells. The subreads N50 and average read lengths were 14,665 and 14,535 bp, respectively. The total HiFi reads yielded 3.7 million with an average quality of Q36 and Q35, respectively. Hi-C libraries were constructed from hemocyte cells using Phase Genomics’ Animal Hi-C kit and sequenced on Illumina’s Hiseq4000 (San Diego, CA, USA) platform to yield 253 million reads using the same DNA isolated for PacBio sequencing. Short-read sequencing libraries were prepared using an insert size of 150 bp obtained from 1 μg of genomic DNA after fragmentation, end-paired, and ligated to adaptors. The ligated fragments were fractionated on agarose gels and purified by PCR amplification to produce sequencing libraries. The method applied was like that previously published by Lieberman-Aiden et al. [44]. The PacBio and Hi-C Illumina DNA raw data were deposited in the NCBI Sequence Read Archive (SRA) repository, accession numbers SRR20593343 and SRR20966976, respectively.
Moreover, RNA libraries were constructed from hemocytes, digestive gland, gill, and mantle tissues for transcriptome sequencing to obtain whole-transcriptome profiling from the same mussels used for genome DNA sequencing. Additionally, twelve available Sequence Read Archive (SRA) transcriptomic data (GenBank accession number SRP261955), representing gills and mantle tissues collected from individuals of Cochamó and Yaldad mussel populations [37,38], were incorporated to analyze population-specific transcriptome profiles. Total RNA from three biological replicates (five total RNA extractions each) from each mussel population was extracted by the Trizol reagent method (Invitrogen, Waltham, MA, USA). The quality and integrity of extracted RNAs were measured in a Tape Station 2200 instrument (Agilent, Santa Clara, CA, USA), using the R6K Reagent Kit based on the manufacturer’s instructions. RNA samples with RNA integrity numbers (RIN) >9 were selected for the preparation of high-quality libraries using a TrueSeq Stranded mRNA LT Sample Prep Kit and sequenced in a HiSeq 4000 (Illumina, San Diego, CA, USA).

2.2. De Novo Genome Assembly and Hi-C Scaffolding of M. chilensis

Two HiFi single-molecule real-time cells in the PacBio Sequel platform yielded 53.8 Gb of high-quality DNA genome information. These long reads were assembled with the Hifiasm (v.0.19.3) package using default parameters [45]. For Hi-C scaffolding, reads were aligned to the primary draft assembly, following the manufacturer’s instructions [46]. Briefly, reads were aligned using BWA-MEM (v.0.7.17) [47] with the –5SP and –t 8 options specified and all other options default. The package SAMBLASTER (v.0.1.26) [48] was used to flag duplicates excluded from further analysis. Sequence alignments were filtered with SAMtools (v.1.17) [49,50] using the –F 2304 filtering flag to remove non-primary and secondary alignments. This step was conducted to remove alignment errors, low-quality alignments, and other alignment noise due to repetitiveness, heterozygosity, and other ambiguous assembled sequences. Finally, Phase Genomics’ Proximo Hi-C genome-scaffolding platform was used to create chromosome-scale scaffolds from the corrected assembly, according to Bickhart et al. [51].

2.3. Karyotype of M. chilensis

Metaphase plates of 24-h-post-fertilization larvae were used to obtain chromosomes from M. chilensis, according to Gallardo-Escárate et al. [52]. Briefly, antimitotic treatment with colchicine 0.05% solution was applied for 4 h. Then, the larvae were rinsed in clean seawater and immersed in a hypotonic solution (seawater:distilled water, 1:1) for 30 min. Finally, the larvae were fixed in modified Carnoy solution (methanol:acetic acid, 3:1). Chromosome spreads were obtained by dissociating larva tissue in acetic acid (50%), pipetting suspension drops onto slides preheated at 43 °C and air-dried according to Amar et al. [53]. A FISH experiment was performed to validate the physical localization of specific genes. Here, 28S rDNA was labeled following methods previously published [21]. Briefly, metaphase preparations were denatured at 69 °C for 2 min and hybridized overnight at 37 °C. Signal detection was performed using fluorescein avidin and biotinylated anti-avidin for the biotinylated probes, and mouse anti-digoxigenin, goat anti-mouse rhodamine, and rabbit anti-goat rhodamine for the digoxigenin-labeled probes. Fluorescent staining was carried out with 4,6-diamidino-2-phenylindole (DAPI) and mounted with Vectacshield antifading solution. Chromosome spreads were observed using an epifluorescent microscope Nikon Eclipse 80i (Minato-ku, Tokyo, Japan) equipped with a digital camera DS-5Mc.

2.4. Genome Annotation of M. chilensis

Our repeat annotation pipeline applied a combined homology alignment strategy, and de novo search to identify the whole-genome repeats. Tandem repeat was extracted using TRF (v.4.09.1) (http://tandem.bu.edu/trf/trf.html (accessed on 3 October 2021)) by ab initio prediction. The commonly used homolog prediction database Repbase (www.girinst.org/repbase (accessed on 3 October 2021)), employing RepeatMasker (v.4.1.5) (www.repeatmasker.org/ (accessed on 4 October 2021)) software and its in-house scripts (RepeatProteinMask) with default parameters was used to extract repeat regions. Ab initio prediction was used to build a de novo repetitive elements database by LTR_FINDER (v1.07) (https://github.com/xzhub/LTR_Finder (accessed on 4 October 2021)), RepeatScout (v.1.0.5) (www.repeatmasker.org/ (accessed on 4 October 2021)), and RepeatModeler (v.2.0.4) (www.repeatmasker.org/RepeatModeler.html (accessed on 3 October 2021)) with default parameters. Then, all repeat sequences with lengths >100 bp and gap ‘N’ less than 5% constituted the raw transposable element (TE) library. A custom library (a combination of Repbase and a custom de novo TE library processed by UCLUST (v.11) to yield a non-redundant library) was supplied to RepeatMasker for DNA-level repeat identification.
The structural annotation approach was applied to incorporate de novo, homolog prediction, and RNA-Seq-assisted predictions to annotate gene models. For gene prediction based on de novo, Augustus (v3.2.3), Geneid (v1.4), Genescan (v1.0), GlimmerHMM (v3.04), and SNAP (29 November 2013) were used in our automated gene prediction pipeline. Sequences of homologous proteins were downloaded from Ensembl/NCBI/others for homolog prediction. Protein sequences were aligned to the genome using TblastN (v2.2.26; E-value ≤ 1 × 10⁻⁵), and then the matching proteins were aligned to the homologous genome sequences for accurate spliced alignments with GeneWise (v2.4.1) software to predict the gene structure contained in each protein region. Finally, for RNA-seq data, transcriptome reads assemblies were generated with Trinity (v2.1.1) for the genome annotation. For the genome annotation optimization, the RNA-Seq reads from different tissues were aligned to genome fasta using Hisat (v2.0.4)/TopHat (v2.0.11) with default parameters to identify exons region and splice positions. The alignment results were inputted into Stringtie (v1.3.3)/Cufflinks (v2.2.1) with default parameters for genome-based transcript assembly. The non-redundant reference gene set was generated by merging genes predicted by three methods with EvidenceModeler (EVM v1.1.1) using PASA (Program to Assemble Spliced Alignment) terminal exon support and including masked transposable elements as input into gene prediction. Individual families of interest were selected for further manual curation.
Gene functions were assigned according to the best match by aligning the protein sequences to the Swiss-Prot database using Blastp (with a threshold of E-value ≤ 1 × 10⁻⁵). The motifs and domains were annotated using InterProScan70 (v5.31) by searching against publicly available databases, including ProDom, PRINTS, Pfam, SMRT, PANTHER, and PROSITE. Each gene’s gene ontology (GO) IDs were assigned according to the corresponding InterPro entry. We predicted the protein function by transferring annotations from the closest BLAST hit (E-value < 1 × 10⁻⁵) in the Swiss-Prot database and DIAMOND (v0.8.22)/BLAST hit (E-value < 1 × 10⁻⁵) in the NR database. We also mapped the gene set to a KEGG pathway and identified the best match for each gene.
Non-coding RNA annotations such as tRNAs were predicted using the program tRNAscan-SE (http://lowelab.ucsc.edu/tRNAscan-SE/ (accessed on 5 October 2021)). Since rRNAs are highly conserved, we chose relative species’ rRNA sequences as references and predicted rRNA sequences using Blast. Other ncRNAs, including miRNAs and snRNAs, were identified by searching against the Rfam database with default parameters using the infernal software (http://eddylab.org/infernal/ (accessed on 5 October 2021)). Additionally, lncRNAs were identified using the previously proposed pipelines [20,54,55].

2.5. Comparative Genomics between M. chilensis and M. coruscus

Syntenic relationships were explored among mussel species for which chromosome-level reference genomes are publicly available. Here, the analysis was performed between the two congeneric species M. chilensis (this study) and M. coruscus [28], where gene annotations were explored by MCScanX (v. 1.0) [56] implemented in the TBtools (v.1.115) package [57]. This approach detects groups of orthologous genes and compares their arrangement to identify colinear segments in the compared genomes. MCScanX was used to discover microsyntenic relationships, focusing on the local arrangement of genes near the syntenic blocks. The microsyntenic arrangement of genes identified by MCScanX was evaluated through GO analysis to identify the primary molecular function and biological processes enrichened for each genomic region where macromutations or chromosome rearrangements were detected.
Disseminated neoplasia is a disease horizontally transmitted by clonal cancer cells, which causes leukemia in mollusk bivalves [58,59]. The neoplastic cells gradually replace normal hemocytes leading to increased mortality, and the disease has been detected in 15 species of marine bivalve mollusks worldwide [60]. Notably, disseminated neoplasia has been observed among mussel species with varying epizootic prevalences. For instance, M. trossulus has shown high prevalences in some areas, whereas in Mytilus edulis, the prevalences are generally lower. Furthermore, M. galloprovincialis has been suggested as a species resistant to the disease in Spanish and Italian mussel populations [61]. This observation extends the relevance of exploring mussel species’ genetic features associated with disseminated neoplasia. Herein, the molecular characterization of Steamer-like elements in M. chilensis was conducted by cloning and the walking primer method according to Arriagada et al. [62]. The putative M. chilensis Steamer-like was scanned through twelve reference genomes assembled at chromosome level for Bivalvia: Mytilus coruscus (GCA_017311375.1), Mytilus edulis (GCA_019925275.1), Dreissena polymorpha (GCA_020536995.1), Mercenaria mercenaria (GCA_014805675.2), Solen grandis (GCA_021229015.1), Ruditapes philippinarum (GCA_009026015.1), Pecten maximus (GCA_902652985.1), Pinctada imbricata (GCA_002216045.1), Crassostrea gigas (GCA_902806645.1), Crassostrea ariakensis (GCA_020458035.1), and Crassostrea virginica (GCA_002022765.4). The putative long terminal repeat (LTR) sequences were identified using BLAST search, where open reading frames (ORFs) between flanking LTRs were detected. The identified Steamer-like elements were aligned using ClustalW and annotated based on a search of the NCBI Conserved Domain database. Amino acid sequences for the full-length Gag-Pol polyprotein region were aligned among the studied bivalve species. The Steamer element was reported for Mya arenaria (Accession AIE48224.1) and M. chilensis (this study). DNA sequence genealogy analysis was conducted to investigate horizontal transmission events among bivalve species. The maximum likelihood (ML) method was conducted on the SLEs loci localized in all the publicly available bivalve genomes assembled at the chromosome level.

2.6. Whole-Genome Transcript Expression Analysis in Two M. chilensis Populations

The transcriptomes of mussels collected from the Yaldad and Cochamó populations were analyzed using a hierarchical clustering approach to detect transcriptional similarities among tissues/populations. The differentially expressed transcripts compared to normalized expression values were visualized in a clustering heatmap and selected according to the identified cluster. For an optimal comparison of the results, k-means clustering was performed to identify candidate genes involved in specific gene expression patterns. The distance metric was calculated with the Manhattan method, where the mean expression level in 5-6 rounds of k-means clustering was subtracted.
Moreover, raw data from mussel tissues collected from the Yaldad and Cochamó populations were trimmed and mapped to the M. chilensis genome using CLC Genomics Workbench v22 software (Qiagen Bioinformatics, Aarhus, Denmark). Threshold values for transcripts were calculated from the coverage analysis using the Graph Threshold Areas tool in CLC Genomics Workbench v22 software. Here, an index denoted as chromosome genome expression (CGE) was applied to explore the whole-genome transcript expression profiling, according to Valenzuela et al. [63]. The CGE calculates the mean coverage of transcripts mapped into a specific chromosome region, comparing mussel populations and tissues. Specifically, the CGE index represents the percentage of the transcriptional variation between two or more RNA-seq data for the same locus. The transcript coverage values for each dataset were calculated using a threshold of 20,000 to 150,000 reads. A window size of 10 positions was set to calculate and identify chromosome regions differentially transcribed. This approach was used to visualize actively transcribed chromosome regions, identify differentially expressed genes, and observe tissue-specific patterns in the evaluated mussel populations. Finally, the threshold values for each dataset and the CGE index were visualized in Circos plots [64].
RNA-seq data analyses were carried out using the raw sequencing reads and mapped on the assembled genome by CLC Genomics Workbench v22 software (Qiagen Bioinformatics, Aarhus, Denmark) separately for each tissue/population. In parallel, de novo assembling was performed to evaluate PAVs and dispensable genes affecting the in-silico transcription analysis. The assembly was performed with overlap criteria of 70% and a similarity of 0.9 to exclude paralogous sequence variants. The settings were set as mismatch cost = 2, deletion cost = 3, insert cost = 3, minimum contig length = 200 base pairs, and trimming quality score = 0.05 using CLC Genomics Workbench v22. After assembly, the contigs generated for each data set were mapped on the genes annotated in the reference genome to evaluate genome coverage and detect PAV features. The analysis did not show bias putatively associated with PAVs between the analyzed mussel populations. Then, mRNA sequences annotated for the M. chilensis genome were used to evaluate the transcription level between mussel populations, where differential expression analysis was set with a minimum length fraction = 0.6 and a minimum similarity fraction (long reads) = 0.5. The obtained genes from each tissue/population were blasted to CGE regions to enrich the number of transcripts evaluated by RNA-Seq analysis. In addition, sequences were extracted near the threshold areas in a window of 10 kb for each transcriptome. The expression value was set as transcripts per million model (TPM). The distance metric was calculated with the Manhattan method, with the mean expression level in 5–6 rounds of k-means clustering subtracted. Finally, the Generalized Linear Model (GLM) available in the CLC software was used for statistical analyses and to compare gene expression levels regarding the log2 fold change (p = 0.005; FDR corrected).
Moreover, innate immunity in marine invertebrates may play an important role in speciation and environmental adaptation [65,66]. Herein, we investigate the immune-related genes associated with the Toll-like receptor (TLR) and apoptosis signaling pathways given that the functional annotation revealed that they were mainly enriched between the mussel populations analyzed. In addition, bioinformatic analyses were carried out using the CLC Genomics Workbench software to identify single nucleotide variants (SNV) from the transcriptomes sequenced for Yaldad and Cochamó. Candidate SNVs were called with the following settings: window length = 11, maximum gap and mismatch count = 2, minimum average quality of surrounding bases = 15, minimum quality of central base = 20, maximum coverage = 100, minimum coverage = 8, minimum variant frequency (%) = 35.0, and maximum expected variations (ploidy) = 2. Furthermore, the genotypes of DEGs were also identified for detecting putative genetic variations between mussel populations. Here, singleton, dispersed, tandem, proximal, and whole-genome duplication (WGD) gene events were evaluated using MCScanX. The amino acid changes and the zygosity proportions were also estimated in DEGs between the Yaldad and Cochamó populations.

2.7. GO Enrichment Analysis

Differentially expressed mRNA were annotated through BlastX analysis using a custom protein database constructed from GeneBank, KEGG, GO, and UniProtKB/Swiss-Prot. The cutoff E-value was set at 1 × 10⁻¹⁰. Transcripts were subjected to gene ontology (GO) analysis using the Blast2GO plugins included in the CLC Genomics Workbench v22 software (Qiagen Bioinformatics, Aarhus, Denmark). The results were plotted using the Profiler R package [67]. GO enrichment analysis was conducted to identify the most represented biological processes among protein-coding genes proximally located to the CGE regions. The enrichment of biological processes was identified using Fisher’s exact test tool of Blast2GO among the different tissues and mussel populations.
The Committee of Ethics, Bioethics, and Biosafety, University of Concepción, Chile, approved this project (CEB324-2022, September 2021).

3. Results and Discussion

3.1. Chromosome Genome Assembly of M. chilensis Using Proximity Ligation

With two HiFi single-molecule real-time cells in the PacBio Sequel platform, we generated 53.8 Gb of high-quality DNA genome information. This data comprised 63 million reads with a total length of 882 Gbp (Table 1). These long reads were assembled with the Hifiasm package using default parameters [45], yielding a primary assembly of 13,762 contigs equivalent to 2.19 Gb, with an N50 of 206 Mb. The genome size assembly made by Hifiasm was comparable with the previous genome size described for closely related species: 1.28 Gb for M. galloprovincialis [32], 1.57 Gb for M. coruscus [28], and 1.79 Gb for Dreissena polymorpha [27].
In vivo Hi-C is a technique that maps physical DNA–DNA proximity across the entire genome [68,69]. The method was introduced as a genome-wide version of its predecessor, 3C (chromosome conformation capture). It has been a powerful tool in chromosome-scale genome assembly of many animals in recent years [70,71]. In this study, Hi-C experiments and data analysis of hemocyte cells were used for the chromosome assembly of the blue mussel M. chilensis. Here, Phase Genomics (Seattle, WA, USA) prepared and sequenced two Hi-C libraries, resulting in ~20× coverage and ~253 million 150 bp paired-end reads (Table 1). The Hi-C analysis evidenced that 44.68% of high-quality reads showed intercontig signals or Cis-close position (<10 kbp on the same contig), and an additional 4.09% of sequence reads revealed a Cis-far conformation (>10 kbp on the same contig) (Table 2).
Hi-C reads were aligned using Bowtie version 1.3.1 [72] to order and orient the 13,762 contigs, and scaffolding was performed using Proximo (Phase Genomics, Seattle, WA, USA). We then applied Juicebox for visual inspection and manual correction [73]. We also manually removed 1894 scaffolds that were microbe-sized and disconnected from the rest of the assembly. Then, 11,868 contigs were used for the first chromosome-level high-quality M. chilensis assembly (Table 3).
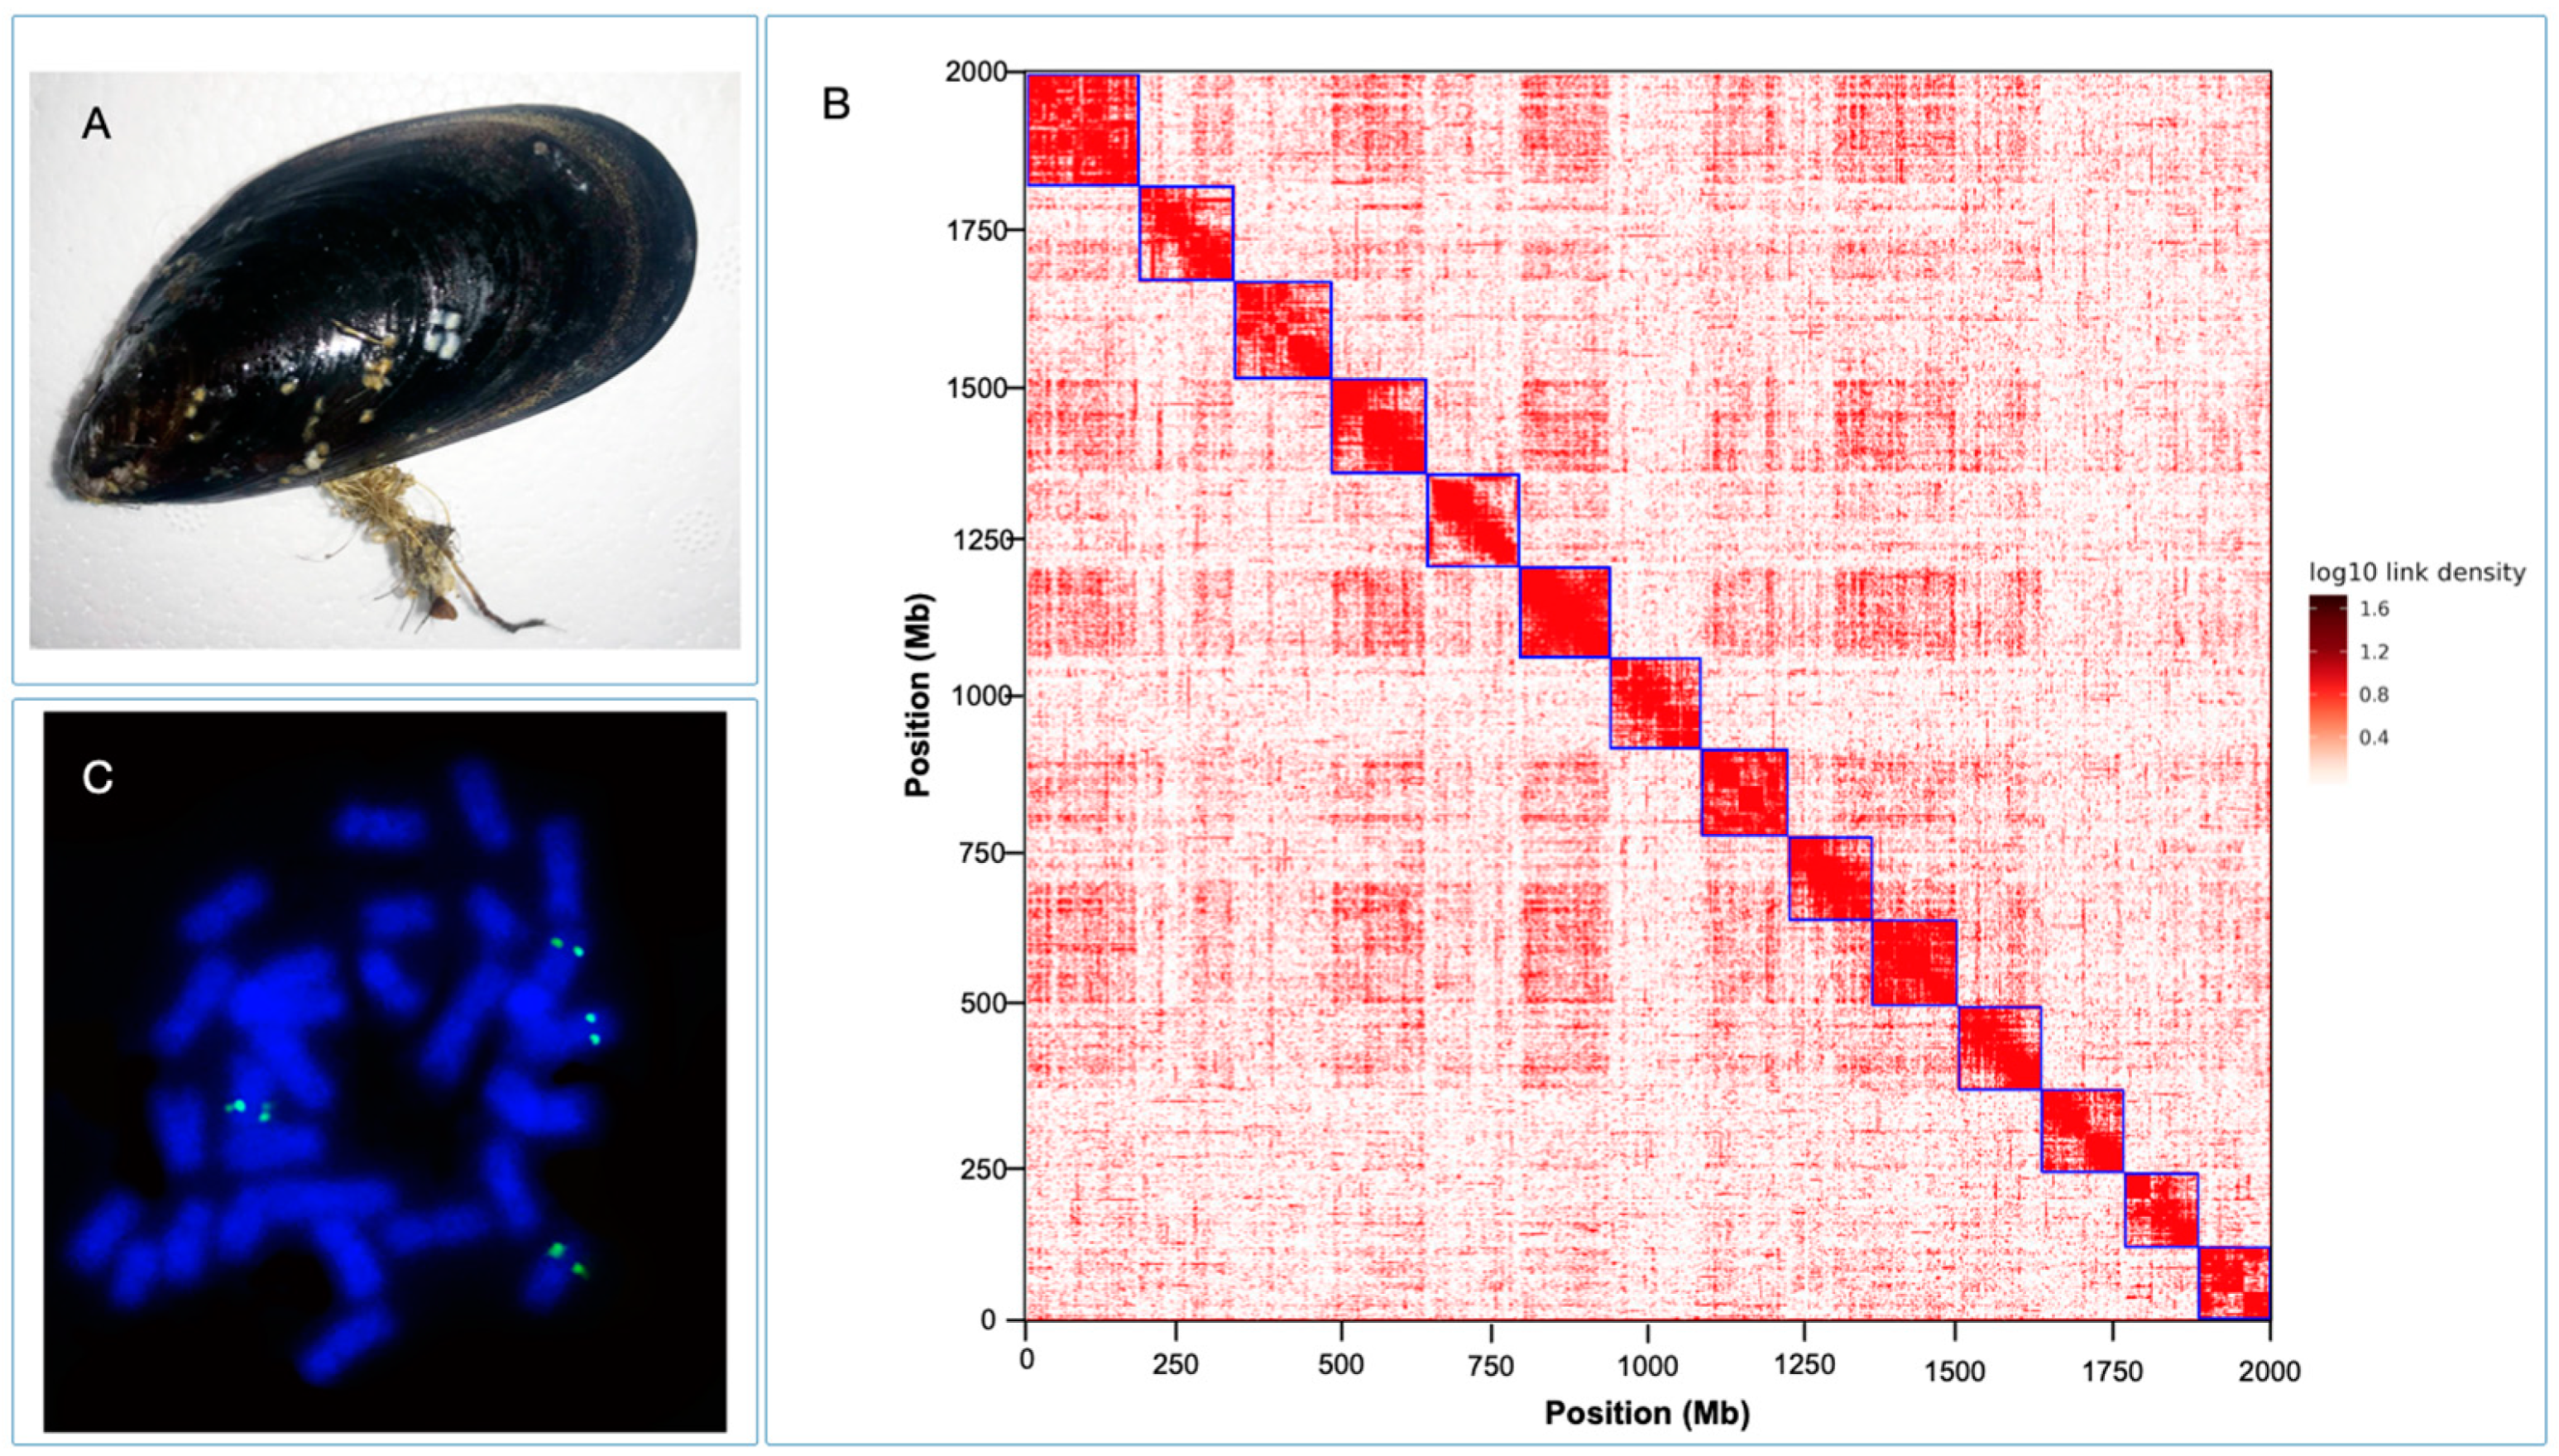
The N50 and total genome length were calculated in 134 Mbp and 1938 Gbps, respectively. The M. chilensis genome provides a valuable genomic resource for research in mussel biology and for developing novel sustainable strategies in mussel aquaculture. The Hi-C data generated 14 chromosomes assembled with HiFi consensus long DNA reads (Figure 1B). The cytogenetic analysis performed for M. chilensis revealed a conservative karyotype for the Mytilus genus composed of 2n = 14 [21]. Physical localization of 28S-rRNA revealed two loci mapped in different submetacentric/subtelocentric chromosome pairs (Figure 1C), confirming the presence of major rDNA clusters subterminal to the long arms of two chromosome pairs reported in M. edulis and M. galloprovincialis [74]. Concerning genome assembly, the largest scaffold was assembled from 998 contigs with a total size of 173.3 Mb. Meanwhile, the smallest scaffold was 117.3 Mb, consisting of 744 contigs (Table 3). Notably, the number of contigs in the scaffolds was 11,868 (100% of all contigs in chromosome clusters, 86.24% of all contigs) and accounted for 1.93 Gbps of genome size (100% of all length in chromosome clusters, 88.43% of all sequence length). The completeness of genome assembly was assessed by the single-copy ortholog set (BUSCO, V5.3.2) [75]. The results showed the following BUSCO scores: (i) Eukaryota Odb10; C:94.1% (S:72.9%, D:21.2%), F:3.1%, M:2.8%, and n:255. (ii) Metazoa Odb10; C:95.1% (S:75.5%, D:19.6%), F:2.5%, M:2.4%, and n:954. (iii) Mollusca Odb10, C:85% (S:70.1%, D:14.9%), F:3.6%, M:11.4%, and n:5295.

3.2. Genome Annotation of M. chilensis

The genome assembly was annotated using de novo and protein- and transcript-guided methods (Figure 2A). The first step of the annotation process was to identify the DNA repeats through the M. chilensis genome. Repetitive elements and non-coding genes in the blue mussel genome were annotated by homologous comparison and ab initio prediction. RepeatMasker [76] was used for homologous comparison by searching against the Repbase database [77] and RepeatModeler [78]. According to these analyses, about 1.1 Gbps of repeat sequences were annotated, which accounted for 56.73% of the whole genome. Herein, DNA transposons, LINE, and LTR transposable elements were identified (Table 4). Useful genome information for population genetic studies is the identification of simple sequence repeats (SSRs) or microsatellites. The mining of SSRs revealed that the M. chilensis genome has 548,360 SSR sequences, where 9% and 6% of the SSR loci were annotated for each mussel chromosome (Figure S1). The most frequent SSR motif was the tetranucleotide, followed by the dinucleotides, accounting for 206,103 and 197,700 repeats, respectively. The entire SSR sequences accounted for 0.35% of the whole genome. The development of SSR markers offers a shortcut to assessing genetic diversity, which can potentially be applied in food authentication and genetic traceability for mussel species [79,80,81].

3.3. Protein-Coding Gene Prediction and Functional Annotation in the M. chilensis Genome

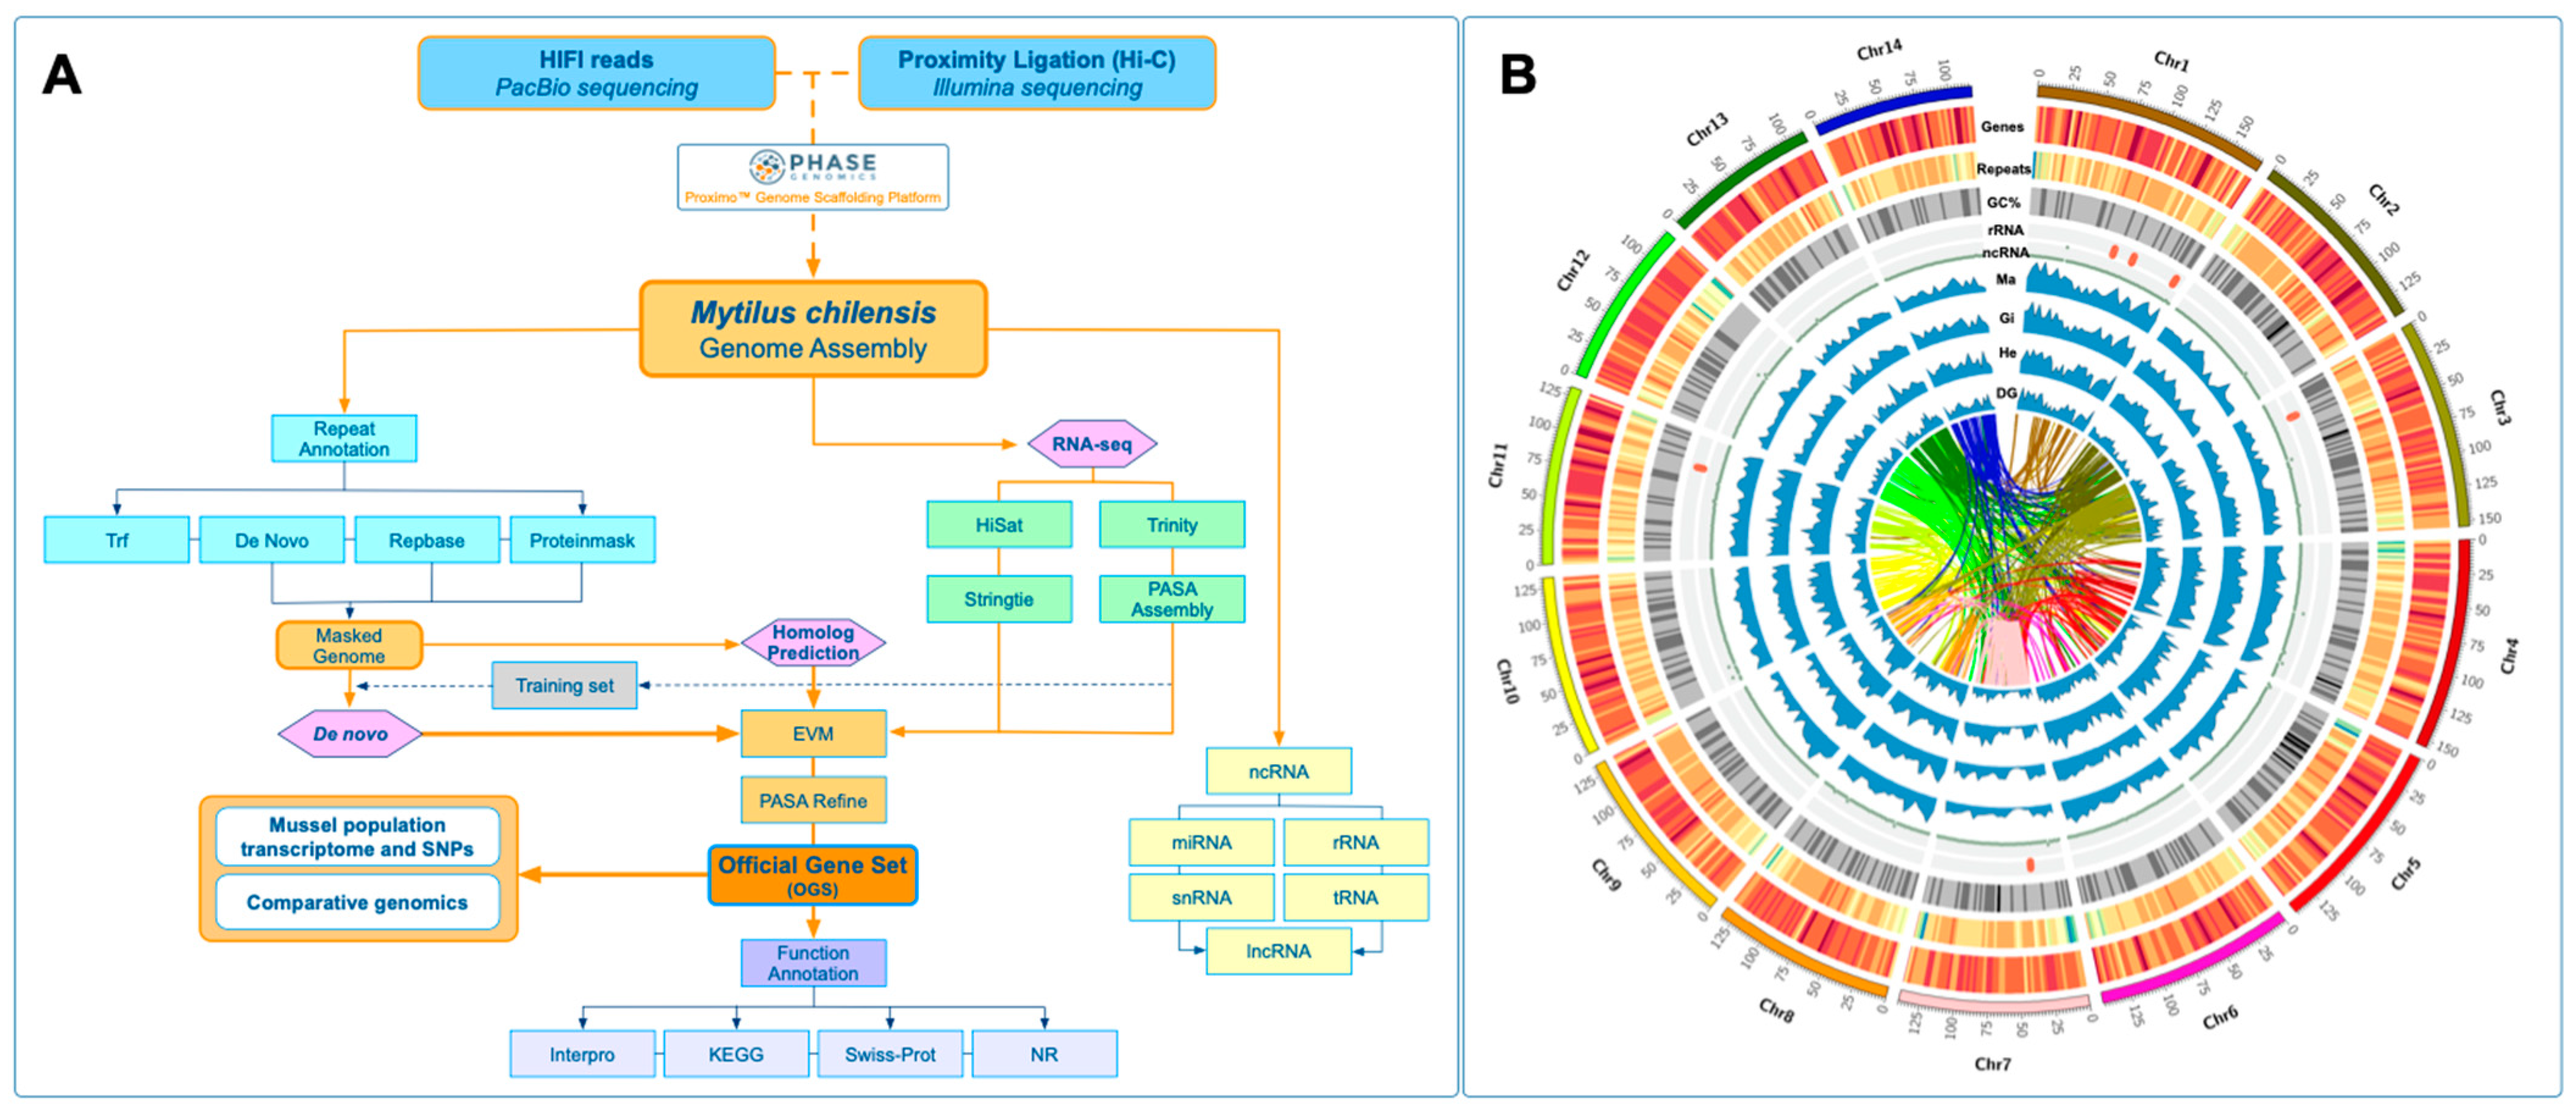
For the identification of protein-coding genes, de novo, homolog prediction, and RNA-seq evidence were used as the training set (Figure 2A). For homologous predictions, the protein sequences from Crassostrea gigas, Mytilus galloprovincialis, M. coruscus, and Dreissena polymorpha genomes were extracted using the respectively published references and aligned against the blue mussel genome using TBLASTN (E-value < 1 × 10⁻⁵) (Table 5). The gene sequence structure of each candidate gene and previously mentioned tools were used to predict protein-coding genes. Finally, a non-redundant reference gene set was generated using the EvidenceModeler (v.2.0) (EVM) and PASA2 tools (v.2.5.2) (Figure 2A).
Taken together, 34,530 protein-coding genes were identified with a 6531 bp average transcript length, 1377 bp average CDS length, 4.92 average of exons per gene, and 1377 and 1316 average length of exons and introns, respectively (Table 6). Additionally, 516 tRNAs were predicted using tRNAscan-SE, and 143 rRNA genes were annotated using RNAmmer. For non-coding RNAs with putative regulatory roles, 1365 miRNAs and 43,011 long non-coding RNAs were identified and annotated within the M. chilensis genome (Table 7). For functional annotation, the predicted proteins within the blue mussel genome were searched by homology against seven databases: Swiss-Prot, Nr, Nt, KEGG, eggnog, GO, and Pfam (Figure 2A). Overall, 70.45%, 73.01%, 8.98%, 64.94%, 80.57%, 33.61%, and 96.33% of genes matched entries in these databases, respectively. A total of 34,530 genes (100%) were successfully annotated by gene function and conserved protein motifs (Table 8). The genomic features annotated for the native blue mussel M. chilensis were displayed using a Circos plot [64]. Herein, this graphical representation shows the primary genomic features for the 14 chromosomes. Specifically, gene density, repeat density, GC content, rRNA localization, and ncRNAs were plotted. The transcriptome expression profiles for the mantle, gills, hemocytes, and digestive gland tissues were also displayed in connection with the syntenic blocks (Figure 2B).

3.4. Comparative Genomics

Smooth-shelled blue mussels of the genus Mytilus represent a model group because of their cosmopolitan distribution, socioecological importance, and intriguing evolutionary history. This taxon provides new insights into the process of speciation and how hybridization and introgression can be one of the biggest threats to global mussel biodiversity [82]. A survey of single nucleotide polymorphisms (SNPs) on southern hemisphere blue mussels has provided a new layer for understanding their biology, taxonomy, and phylogeography [83,84]. However, SNP markers cannot be applied as a single tool to evidence chromosome rearrangement events during the Mytilus evolution. Here, whole-genome sequencing in smooth-shelled blue mussels and relative bivalve species is a priority for global mussel aquaculture, biosecurity, and conservation.
With the aim of exploring genomic rearrangements in Mytilus, the reported reference genomes for M. coruscus and 
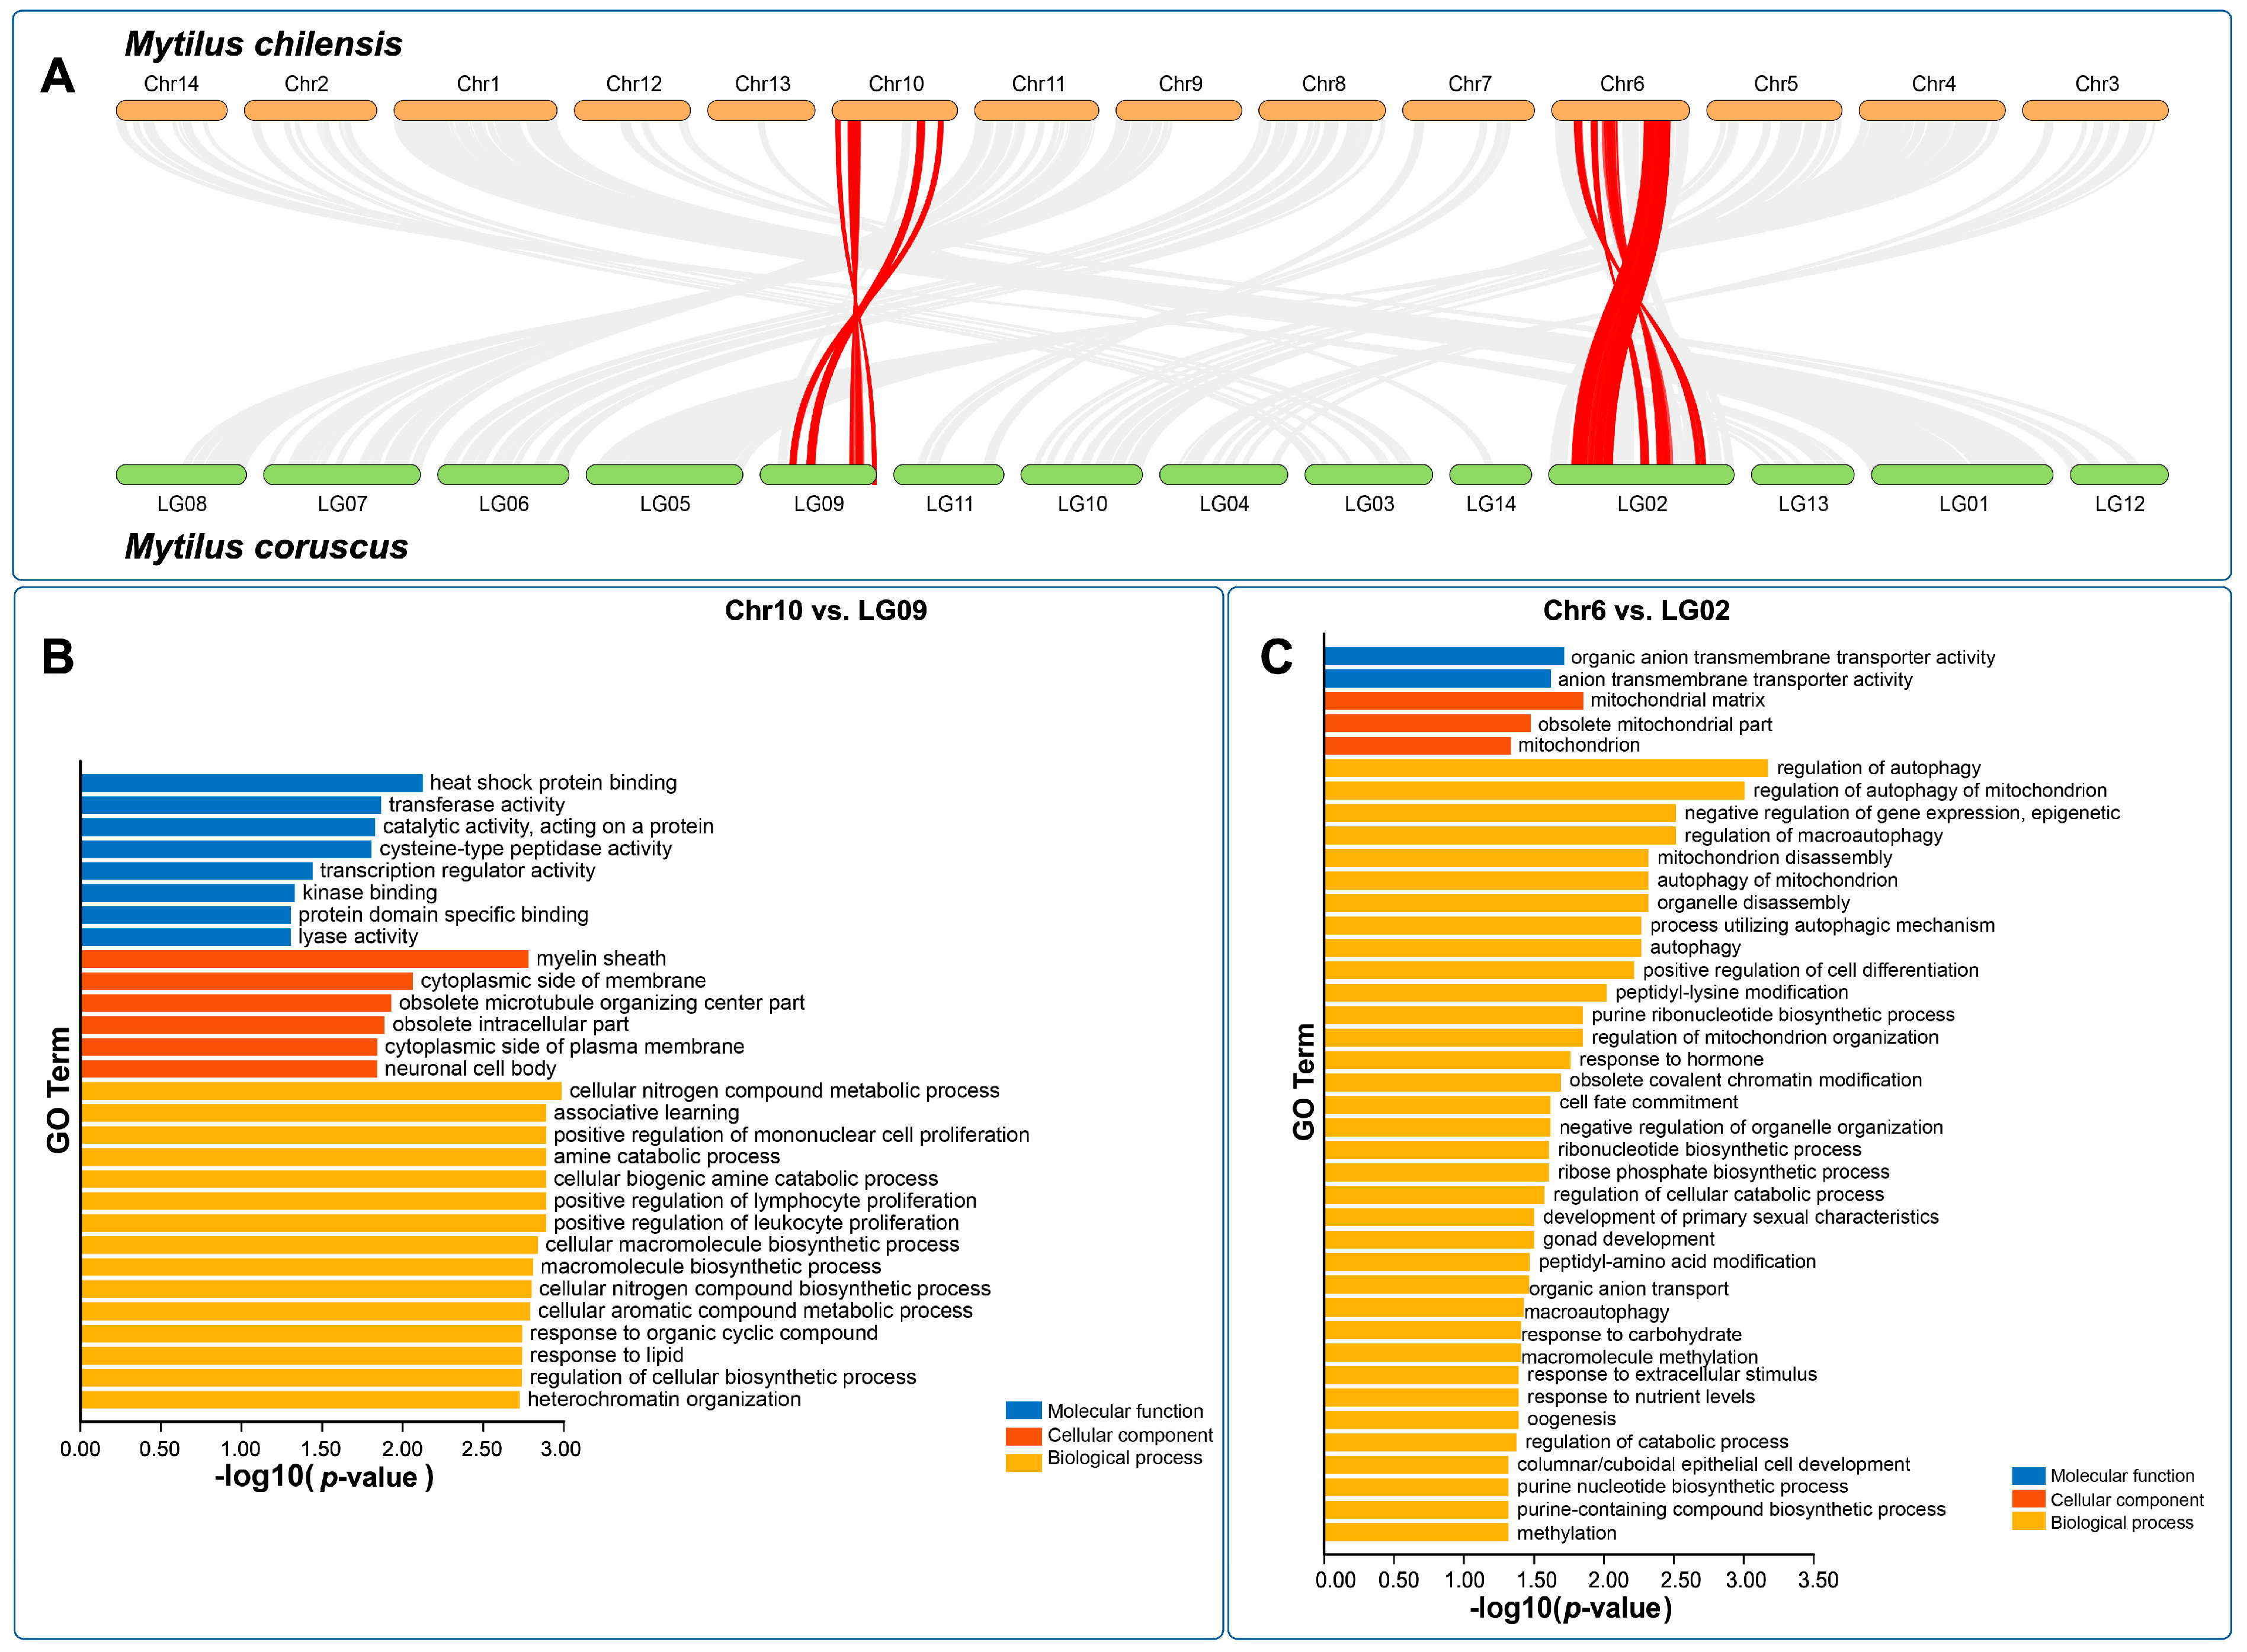
M. chilensis were analyzed. Of the 34,530 predicted genes from the M. chilensis genome, 18,758 (54.32%) were found in syntenic collinear blocks after being compared with the M. coruscus genome (Figure 3A). These syntenic blocks consisted of 671 alignments with a minimum of 5 genes per block. The number of alignments per chromosome ranged from 27 on chromosome 13 to 69 on chromosome 3. Chromosomes with higher genes in collinear blocks were chromosomes 1, 4, and 6, with 1227, 1091, and 1088 genes, respectively. Blocks with less than five genes or E-value < 1 × 10⁻⁵ were discarded from this analysis. Most collinear blocks were located at the same pair of chromosomes between the two genomes. For example, M. chilensis Chr1 had only syntenic blocks with LG01 from M. coruscus in the same order. However, chromosomes 6 and 10 from M. chilensis had collinearity with chromosomes LG09 and LG02 in M. coruscus but were orientated as two inversed blocks per pair of chromosomes (red lines in Figure 3A and Figure S2). The genes in these alignments from inversed blocks were extracted, blasted, and gene ontology terms were identified. Enrichment analyses from GO terms were obtained from Chr10, and LG09 inversed blocks and Chr6 and LG02 pair of chromosomes (Figure 3B,C). Most molecular function-enriched GO terms in the Chr10 and LG09 pair were associated with heat shock protein (HSP) binding. By contrast, in the Chr6 and LG02 pair, most of the enriched GO terms were associated with the mitochondria and biological processes related to autophagy or regulation of gene expression by epigenetic changes. Notably, chromosome rearrangements have been associated with adaptative genetic traits in marine organisms [85], where specific architectural proteins such as HSPs may have distinct roles in establishing 3D genome organization [86].

3.5. Comparative Analysis of Steamer-like Elements in Bivalvia

To explore the gene expansion of retrotransposon elements among representative species from Bivalvia, we primarily characterized the Steamer-like elements (SLEs) in M. chilensis using the approach described by Arriagada et al. [62]. The analysis evidenced that the genome of 
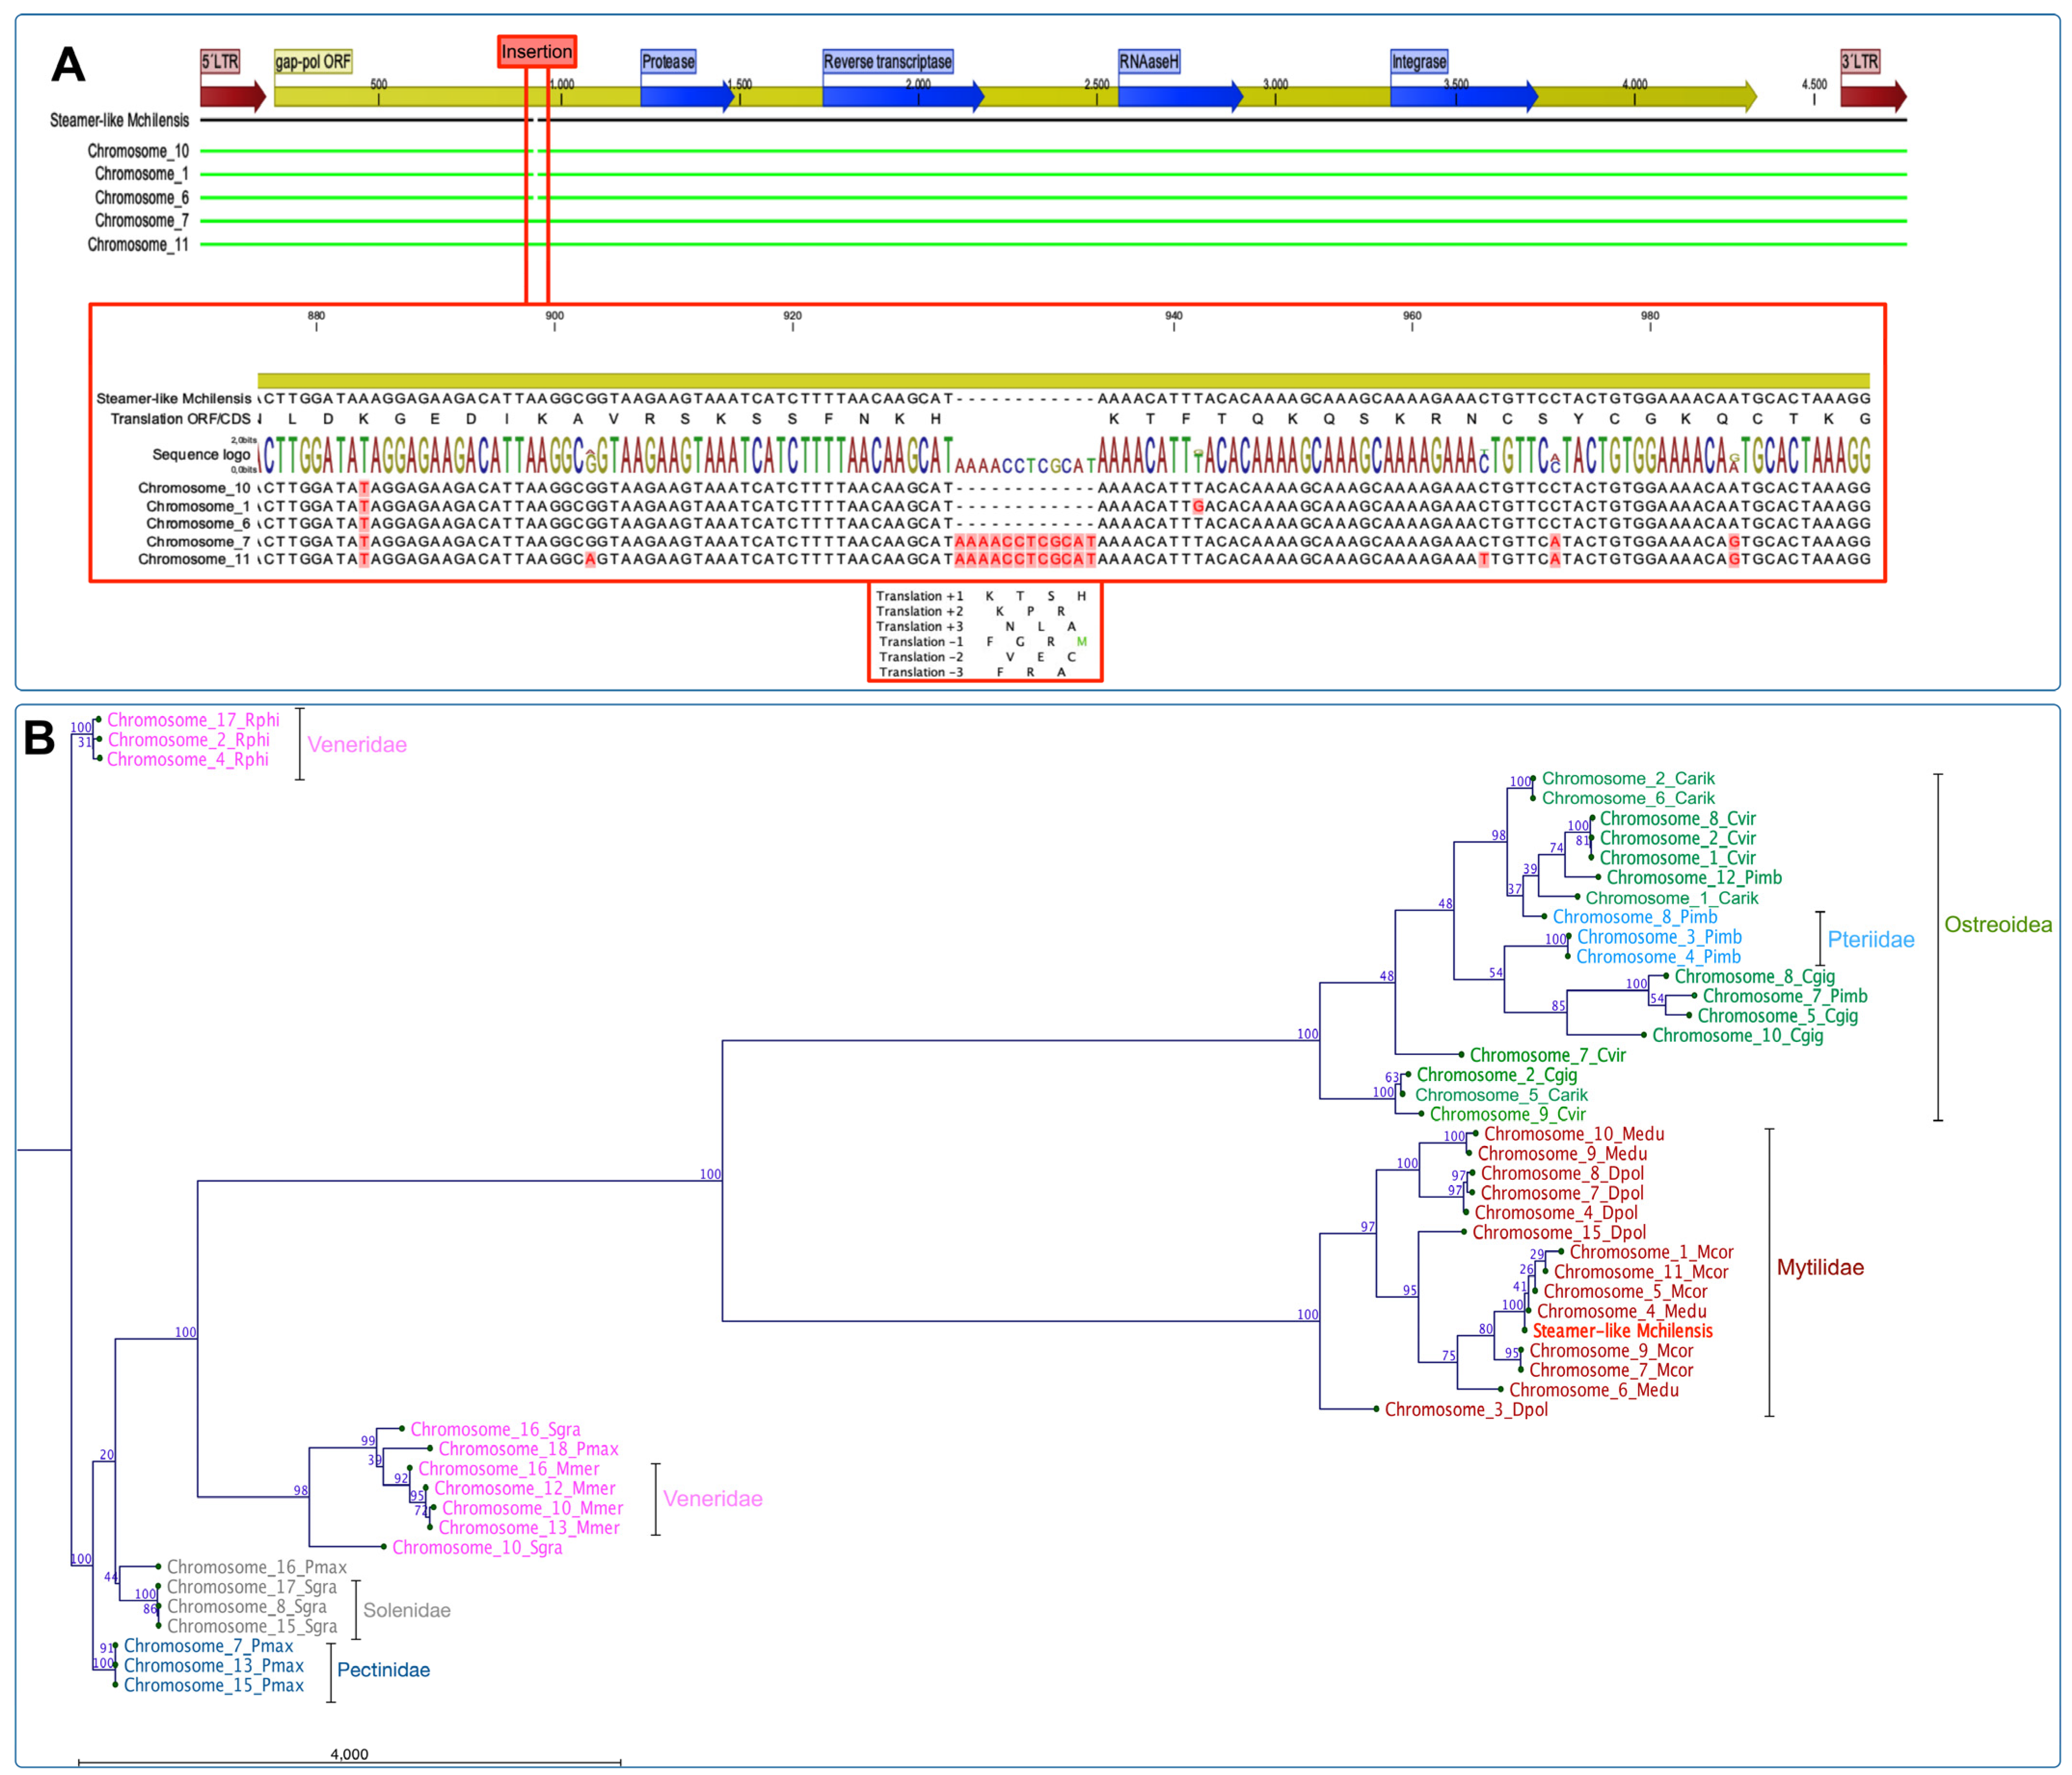
M. chilensis contains five copies of SLEs distributed in chromosomes 1, 6, 7, 10, and 11. The alignment showed that all SLE copies are flanked by two LTRs (5′ and 3′) containing the Gag-Pol ORFs and the domains annotated to protease, reverse transcriptase, RNAaseH, and integrase. Notably, an insertion composed of 12 nucleotides at position 933^934 was exclusively found in chromosomes 7 and 11. The translation for the inserted nucleotides suggests four amino acids, K, T, S, and H, in a positive orientation. However, the translation evaluated in the reading frame (−1) evidenced a methionine localized before the RNAaseH coding gene (Figure 4A).
Furthermore, the phylogenetic analysis using publicly available reference genomes assembled at chromosome level for eleven bivalve species using maximum likelihood (ML) revealed a six-chromosome cluster composed of bivalves belonging to the families Veneridae, Solenidae, Pectinidae, Ostreidae, Pteriidae, and Mytilidae (Figure 4B). The phylogenetic-reconstruction-rooted SLEs were found in three chromosomes (2, 4, and 17) from R. philippinarum. The other Veneridae member, M. mercenaria showed a cluster of four chromosomes (10, 12, 13, and 16) and related to two chromosomes of S. grandis (10 and 16). This last species formed a unique cluster composed of three chromosomes (8, 15, and 17), similar to P. maximus, with three chromosomes. Concerning the mussel and oyster genomes assembled at the chromosome level, the phylogenic analysis revealed two main clusters composed of species belonging to Ostreida and Mytilidae, where the first taxon was comprised of the Ostreidae and Pteriidae families. Herein, one cluster was rooted with three SLE sequences from C. virginica, C. gigas, and C. ariakensis located on chromosomes 9, 2, and 5, respectively. The second major cluster was composed of SLEs annotated in chromosomes from Ostreidae and Pteriidae, where C. virginica chromosomes were closely related to P. imbricata. The third cluster was observed containing three SLE sequences from C. virginica and C. ariakensis: chromosomes 1, 2, 8, and 1, 2, and 6, respectively (Figure 4B). The analysis of the Mytilidae family revealed two primary clusters comprising SLEs located in chromosomes from M. edulis and D. polymorpha, and M. coruscus, M. chilensis, respectively (Figure 4B). This last cluster grouped five chromosomes from M. coruscus (Chr. 1, 4, 5, 7, and 11), and two from M. edulis (Chr. 4 and 6). The Steamer-like sequence characterized for 
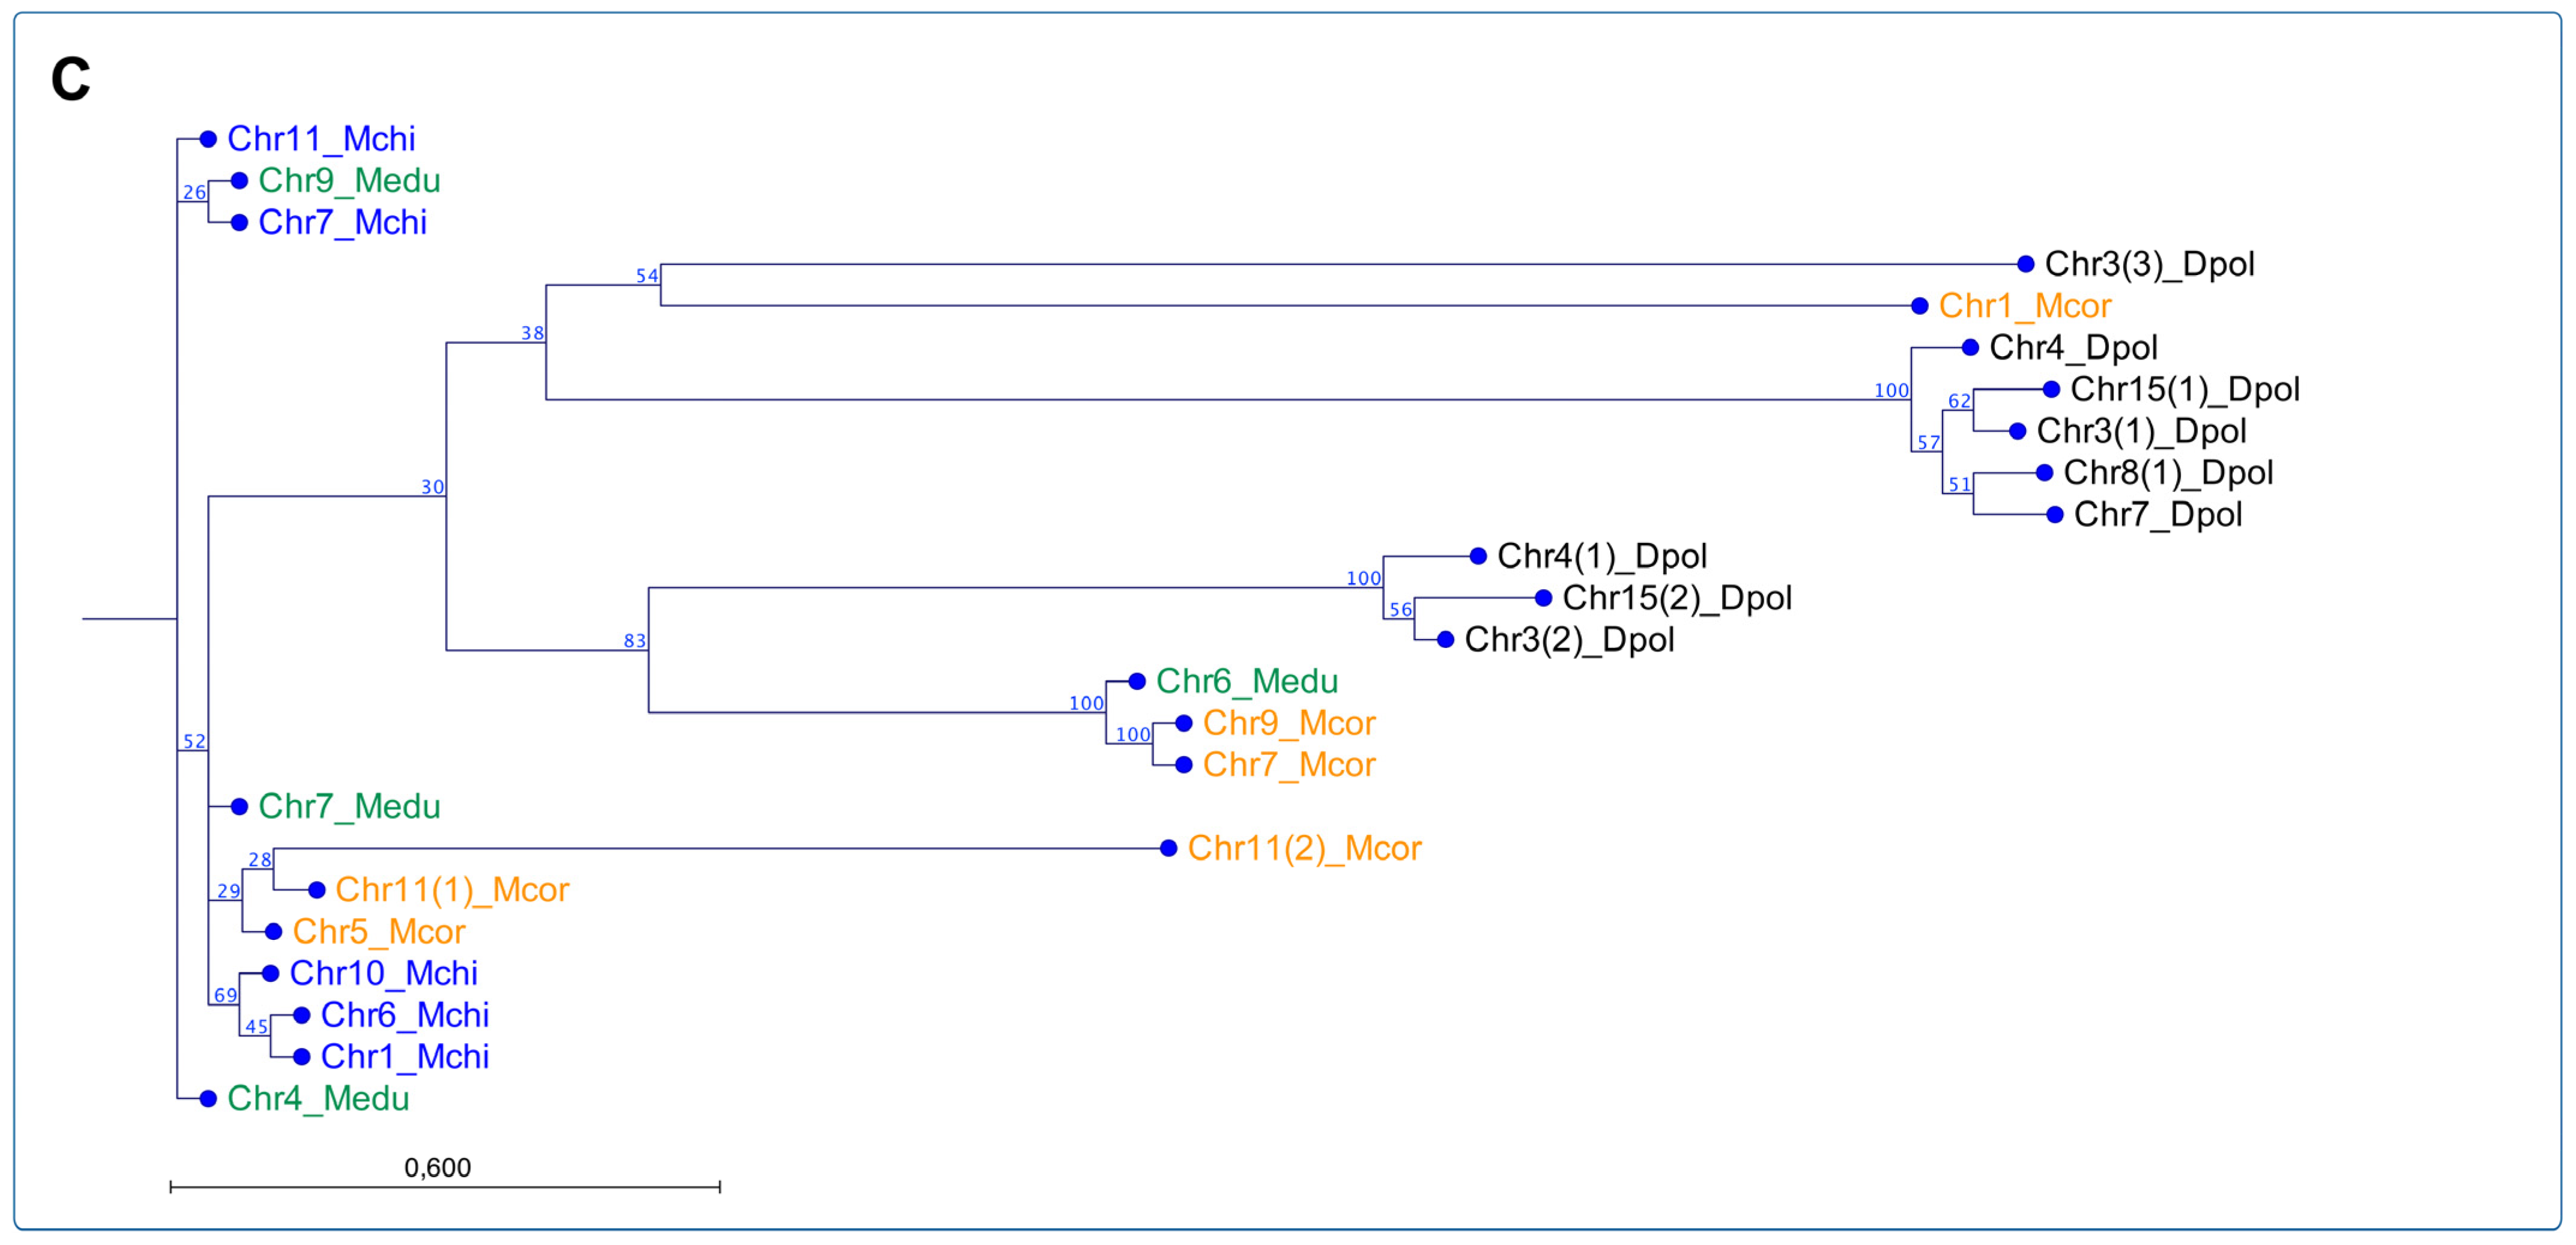
M. chilensis was also observed in this cluster. Finally, a detailed analysis of the three mussel species reported with genome assemblies at the chromosome level was conducted (Figure 4C). Notably, a rooted cluster comprising chromosomes 7, 11, 9 for M. couscous, and 4 and 6 for M. edulis were closely related. Herein, two primary clusters of SLEs located in chromosomes from M. chilensis, M. edulis, and M. coruscus were observed. The analysis suggested that the SLEs identified on M. chilensis chromosomes are closely related to the SLEs annotated on chromosomes 9 and 4 in M. edulis; meanwhile, the SLEs located in chromosomes 1, 5, and 11 in M. coruscus were also identified in the same chromosome cluster. The second main cluster observed comprised exclusively SLEs annotated in D. polymorpha chromosomes, except the SLE copies identified in chromosomes 9 and 10 of M. edulis. Interestingly, the SLEs annotated in chromosome 9 from M. edulis are shared among the three primary clusters analyzed, suggesting putative translocation gene events in Mytilidae.
Overall, the phylogenic relationships of SLEs revealed that the reported bivalve genomes comprise between 3 and 6 loci. A lower number of SLEs was found in Solenidae, Pectinidae, and Veneridae, followed by Mytilidae. A higher number of SLE loci was observed in genomes belonging to the Ostreida order. As far as we know, the evolution of the bivalve chromosomes has mainly been studied using cytogenetic techniques combining molecular probes on candidate genes to detect genome rearrangements that drive the speciation process [87,88,89]. However, the availability of reference genomes assembled at the chromosome level opens new perspectives for exploring molecular evolution in several taxonomic orders through gene collinearity analysis. The study by Yang [28] highlighted putative chromosome rearrangements among the king scallop Pecten maximus, the blood clam Scapharca broughtonii, the hard-shelled mussel Mytilus coruscus, the pearl oyster Pinctada martensii, and the Pacific oyster Crassostrea gigas genomes. Notably, the chromosome synteny illustrated that large-scale rearrangements are common events between the scallop and oyster but scarce between the scallop and mussel genomes. The reported evidence suggested that almost all the chromosome rearrangements between the mussel and oyster genomes are different, implicating independent chromosome fusion events. The SLE loci identified in all the genomes analyzed in the current study suggest that SLEs are relatively conserved in chromosome position for some taxa. For instance, the SLE loci in Veneridae, Pectinidae, and Solenidae appear to be associated with chromosomes 10, 13, 12, and 16. This sharing characteristic can reflect common genetic events during the evolution of these taxonomical groups. Similarly, the Ostreidae and Mytilidae families share SLE loci annotated to chromosomes 1, 2, 8, and 10. The detailed analysis of SLEs in Mytilidae shows that the transposon identified in M. chilensis was shared between M. edulis and M. coruscus, where SLEs in D. polymorpha appear to be more phylogenetically distant than Mytilus species. Interestingly, the mutation identified on the SLEs localized in the M. chilensis genome (insertion of twelve nucleotides), specifically on chromosomes 7 and 11, was shared with the SLE annotated on chromosome 9 in M. edulis. This cumulative evidence reveals diverse chromosome rearrangements, reflecting a complex evolutionary history of bivalve chromosomes.

3.6. The Marine Environment of M. chilensis Populations

Temporal and spatial variability of sea surface temperature (SST) around Chiloé island and at Yaldad and Cochamó were analyzed over the past two decades. The oceanographic variability for the location studied was analyzed from remote sensing data and in situ measurements (Figure 5A–D). Here, the daily time series of SST extracted from satellite-derived data for both sites evidenced high surface temperature variability between Yaldad and Cochamó, where this last location was constantly higher throughout the year (Figure S3). Notably, the monthly medians computed from the SST time series showed that the main differences were observed during the austral summer from December to March. During the winter, the oceanographic variability was less pronounced, showing temperatures between 13 °C and 10 °C from April to July (Figure 5C).
Furthermore, in situ data were collected from June 2017 to May 2018, exhibiting significant differences in both locations for temperature and salinity between 0 and 20 m of depth. Interestingly, the oceanographic survey revealed a pronounced vertical stratification with higher temperatures and lower salinity in Cochamó compared with Yaldad (Figure 5D). These observations support the idea that two oceanographically different zones exist in the inner sea of Chiloé Island. In this northern area, mussels from Cochamó and Yaldad were sampled for the current study. Taken together, we can hypothesize that the mussels inhabiting Cochamó are significantly more exposed to environmental stress than the Yaldad mussel population. To date, there are few studies exploring how population genetic variation is related to, or caused by, the marine environmental variation in mussel populations. Notably, a study conducted by Wenne et al. [90] examined the genetic differentiation of native populations of M. galloprovincialis throughout its entire geographic range in the Mediterranean Sea, the Black Sea, and the Sea of Azov using 53 SNP loci. The results indicated that 7 of the 13 environmental variables explained significant variation in population-specific SNP locus allele frequencies. These seven variables explained 75% of the variation in the SNP dataset, suggesting that a complex mix of environmental variables contributes to the genetic variation in M. galloprovincialis populations in the Mediterranean Sea.

3.7. Whole-Genome Transcript Expression Analysis in Two M. chilensis Populations

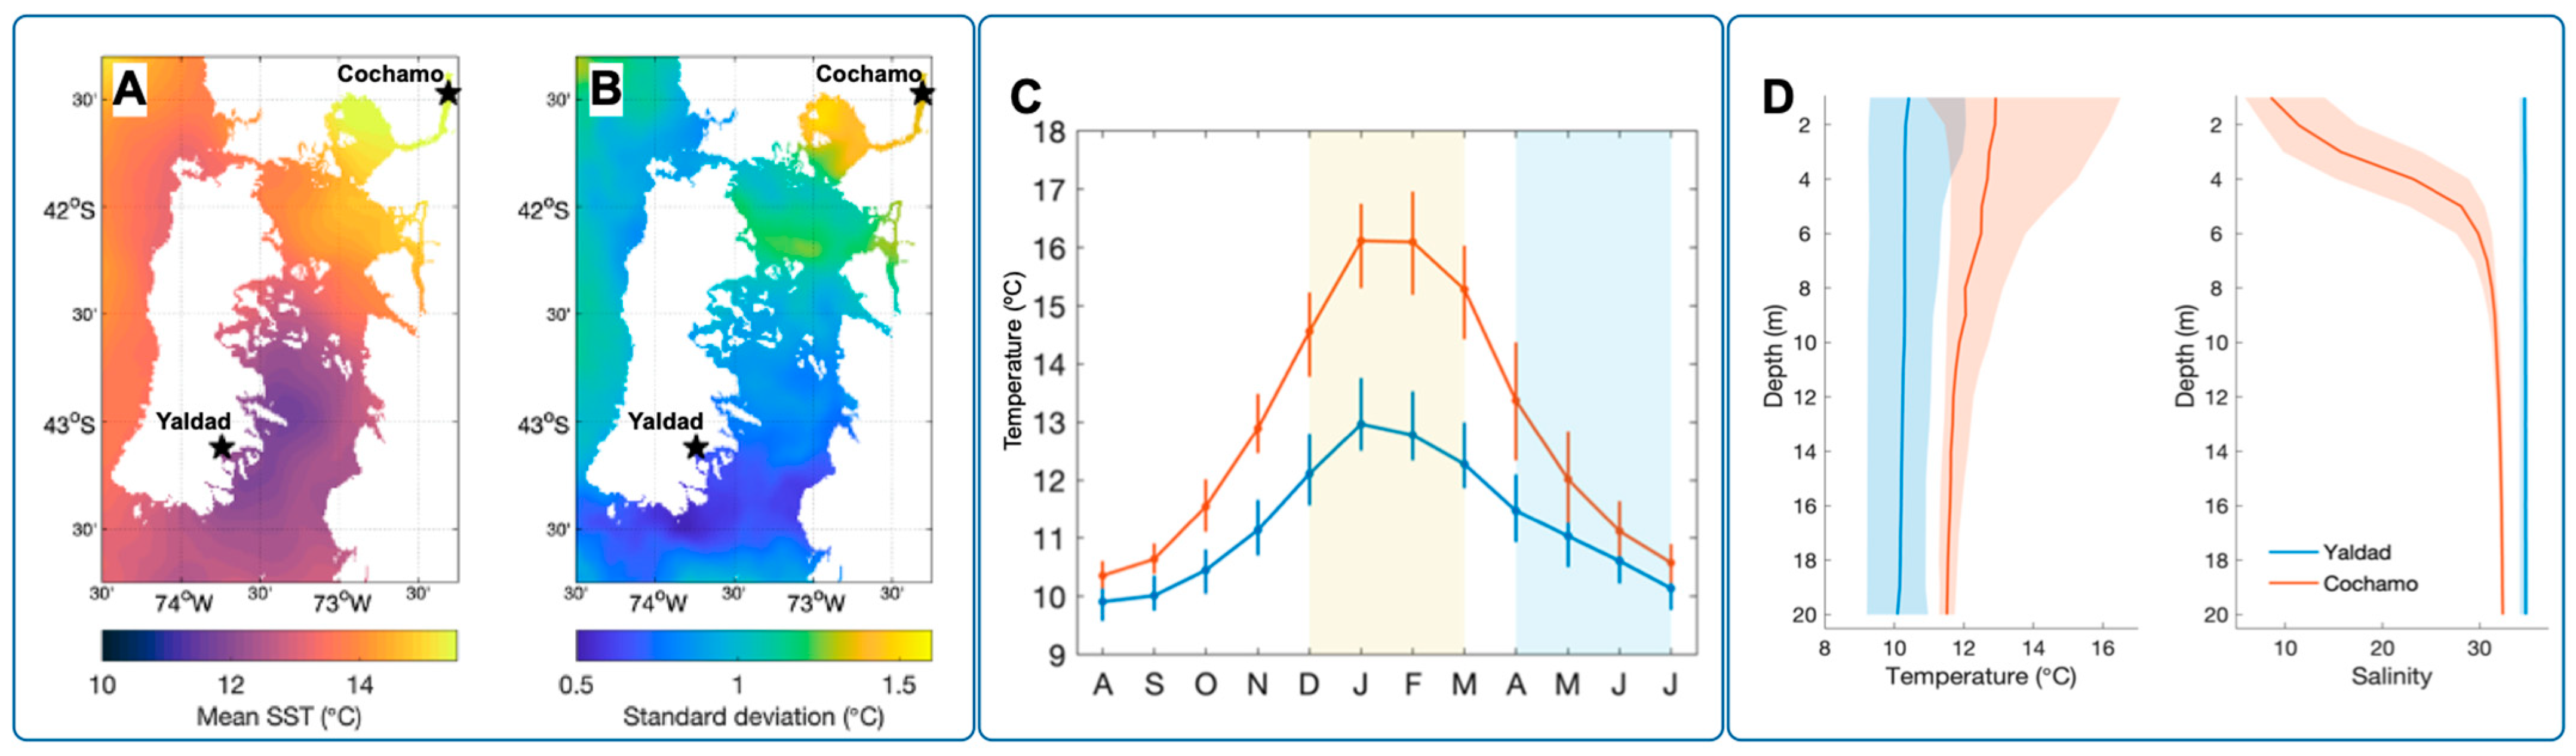
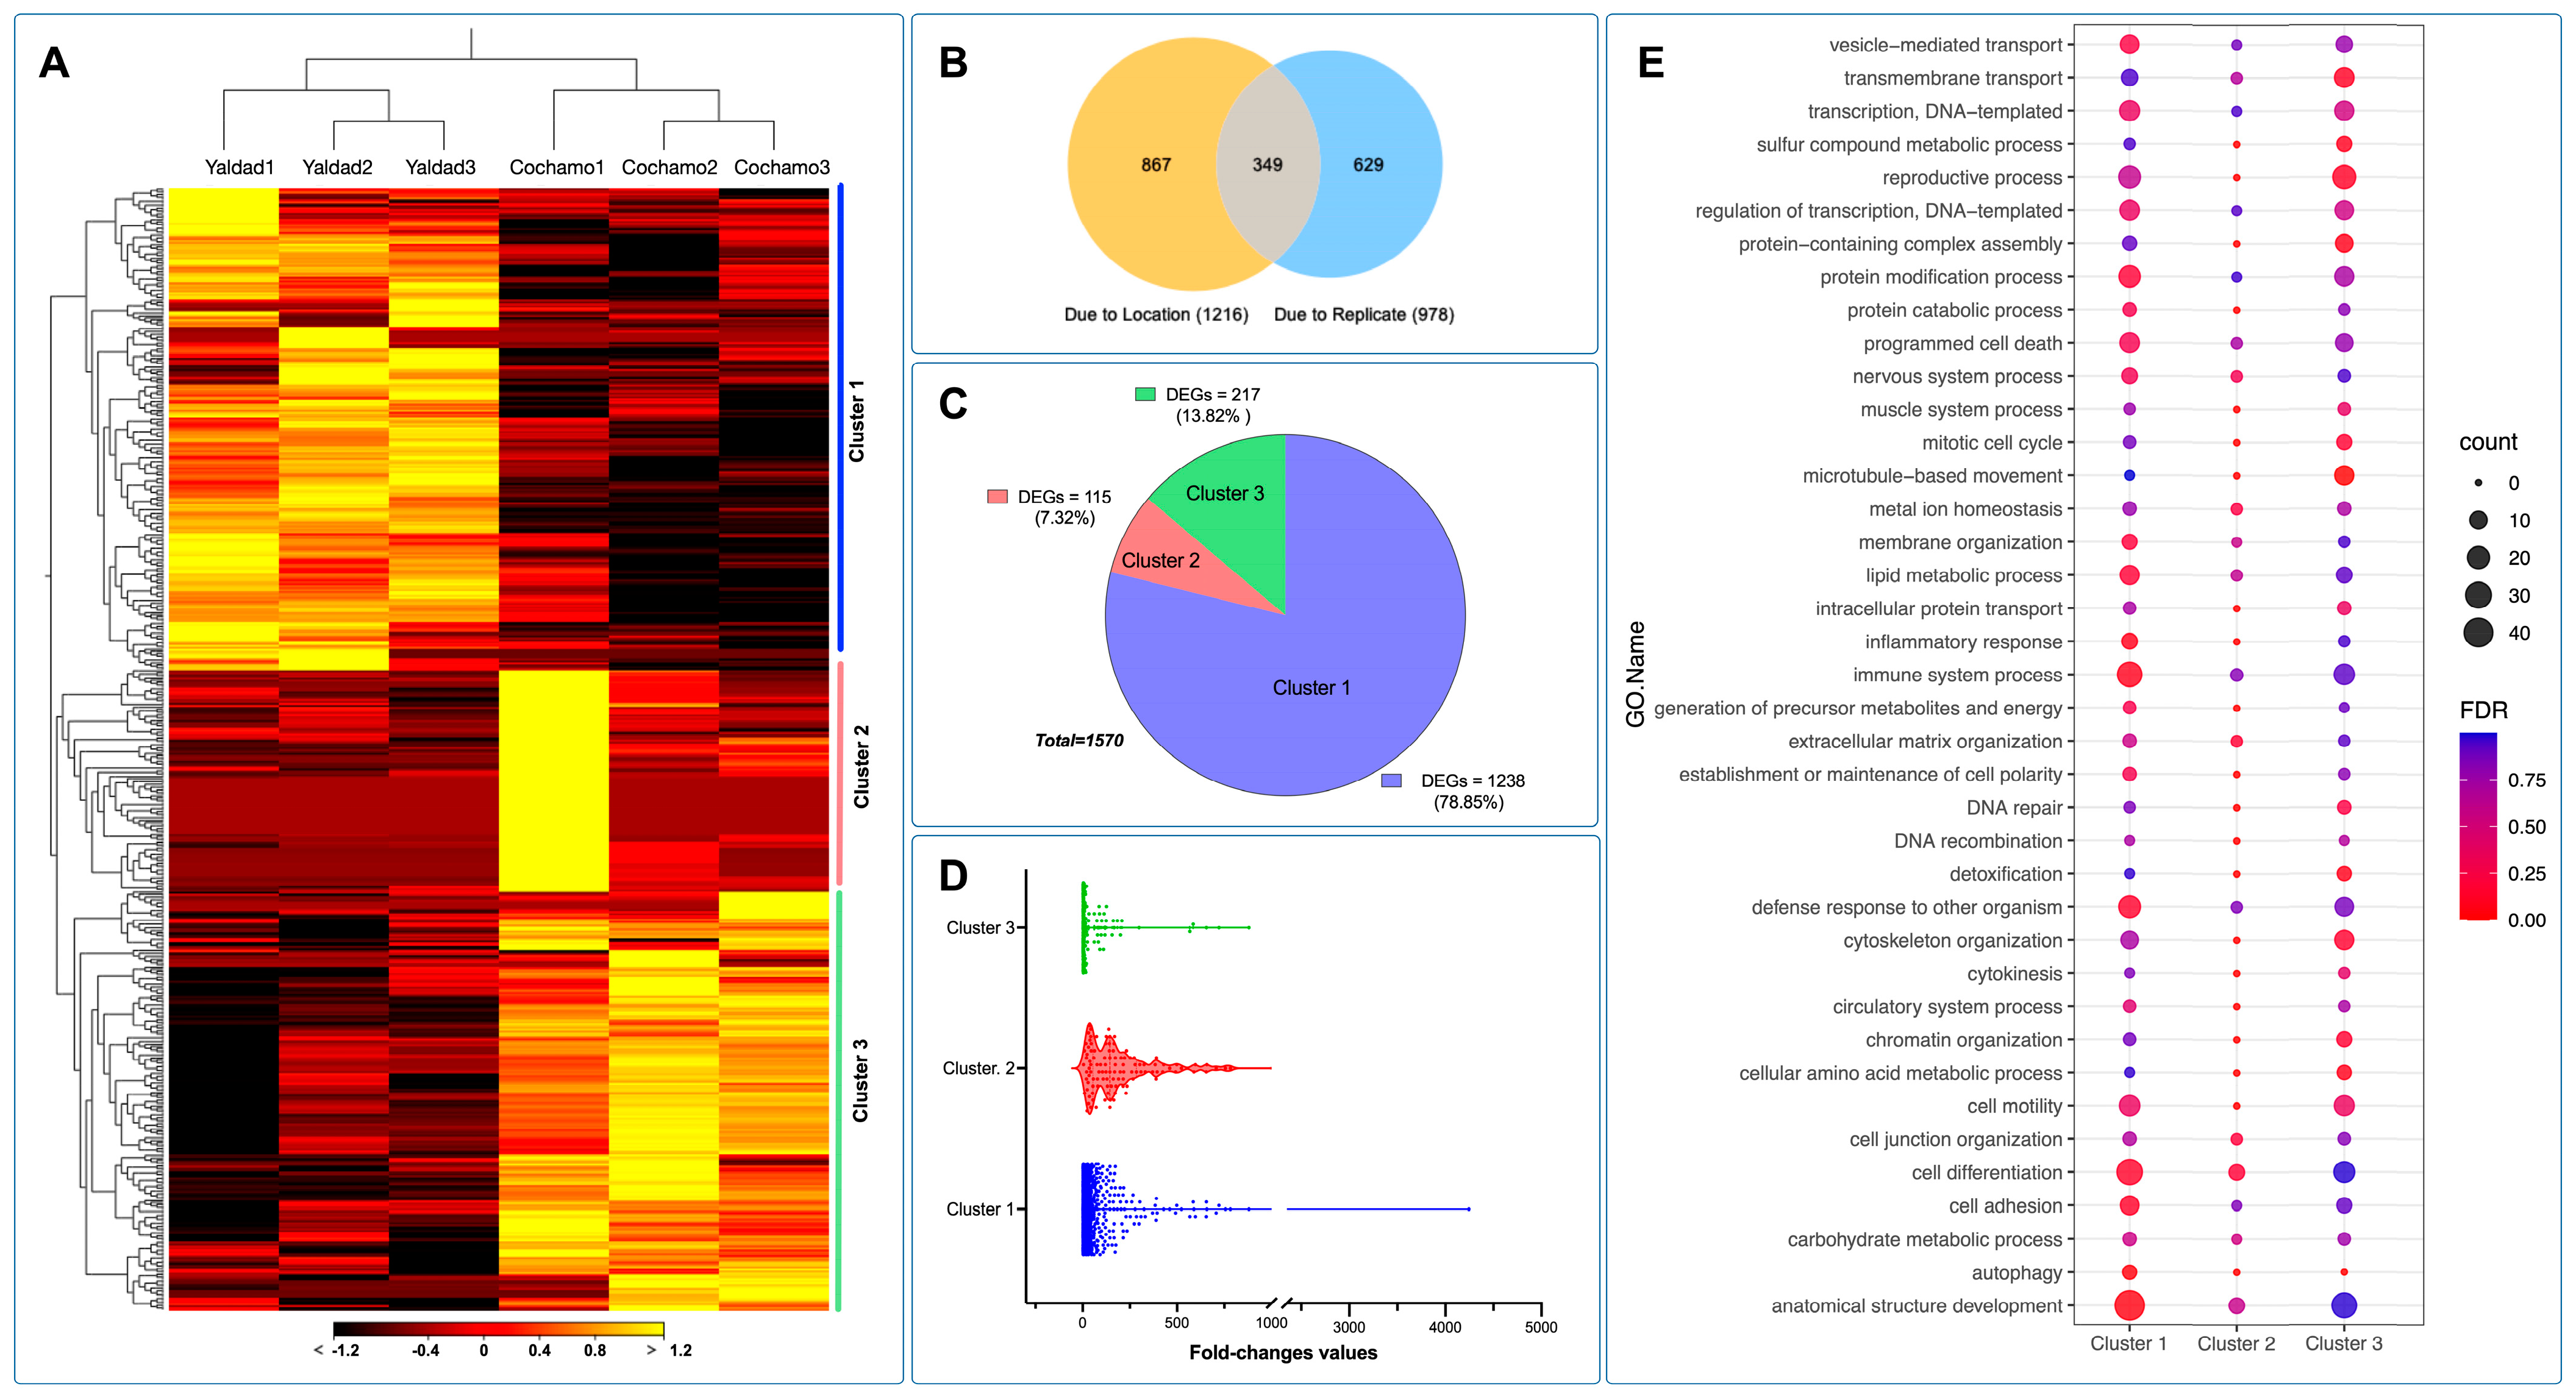
The transcriptome profiling among mussels collected during the austral summer in 2019 from Yaldad and Cochamó evidenced three primary transcriptional clusters. Herein, gene cluster 1 was highly expressed in the gills of mussels exposed to the Yaldad marine conditions; meanwhile, gene clusters 2 and 3 were highly expressed in individuals collected in Cochamó or mussels exposed to estuarine conditions (Figure 6A). Notably, the RNA-seq from individuals collected as Cochamo1 (replicate) showed a highly expressed gene cluster, indicating a wide transcriptome variation among mussels from this population. The RNA-seq analysis was performed with the mRNA sequences annotated on the M. chilensis genome. Herein, it is essential to note that in mussel species, specifically in M. galloprovincialis, the phenomenon of presence–absence variation (PAV) has been described. This fact means that PAVs can bias the analyses of transcriptome profiles in the studied mussel populations. We previously conducted a de novo assembling for the RNA-data sets sequenced from Yaldad and Cochamó populations. The results showed that the number of genes with expression values >1 (total gene reads) did not show statistical differences between both mussel populations. For instance, Yaldad and Cochamó mussels showed 25,086 ± 215 and 25,344 ± 212 (three replicates per population), respectively, of expressed genes in gill tissue (p-value = 0.98). Collectively, between 72.6% and 73.3% of the annotated genes in the M. chilensis genome were transcriptionally active in gills independently of the population analyzed.
The evaluation of differentially expressed genes (DEGs) showed that the main factor of differences in the number of DEGs was the population rather than the replicates assessed (Figure 6B). The proportion of DEGs evaluated among the gene clusters revealed that cluster 1, highly expressed in Yaldad, accounted the 78.85% of the total DEGs analyzed. Clusters 2 and 3 are primarily characterized by high transcription values in the Cochamó population, evidenced by 7.32% and 13.82% of DEGs, respectively. The total number of DEGs analyzed was 1570 (Figure 6C). Notably, the fold-change values estimated among the replicates and populations revealed high values in gene transcriptional cluster 1, compared with clusters 2 and 3 where the fold-change values were significantly lower (Figure 6D). The functional analysis showed that cluster 1 was enriched by GO terms related to protein modification processes, programmed cell death, immune system processes, defense response, cell differentiation, and anatomical structure development (Figure 6E). Clusters 2 and 3 were less enriched, revealing significant GO terms for transmembrane transport, reproductive processes, protein-containing complex assembly, microtube-based movement, cytoskeleton organization, chromatin organization, and metabolic process (Figure 6E).
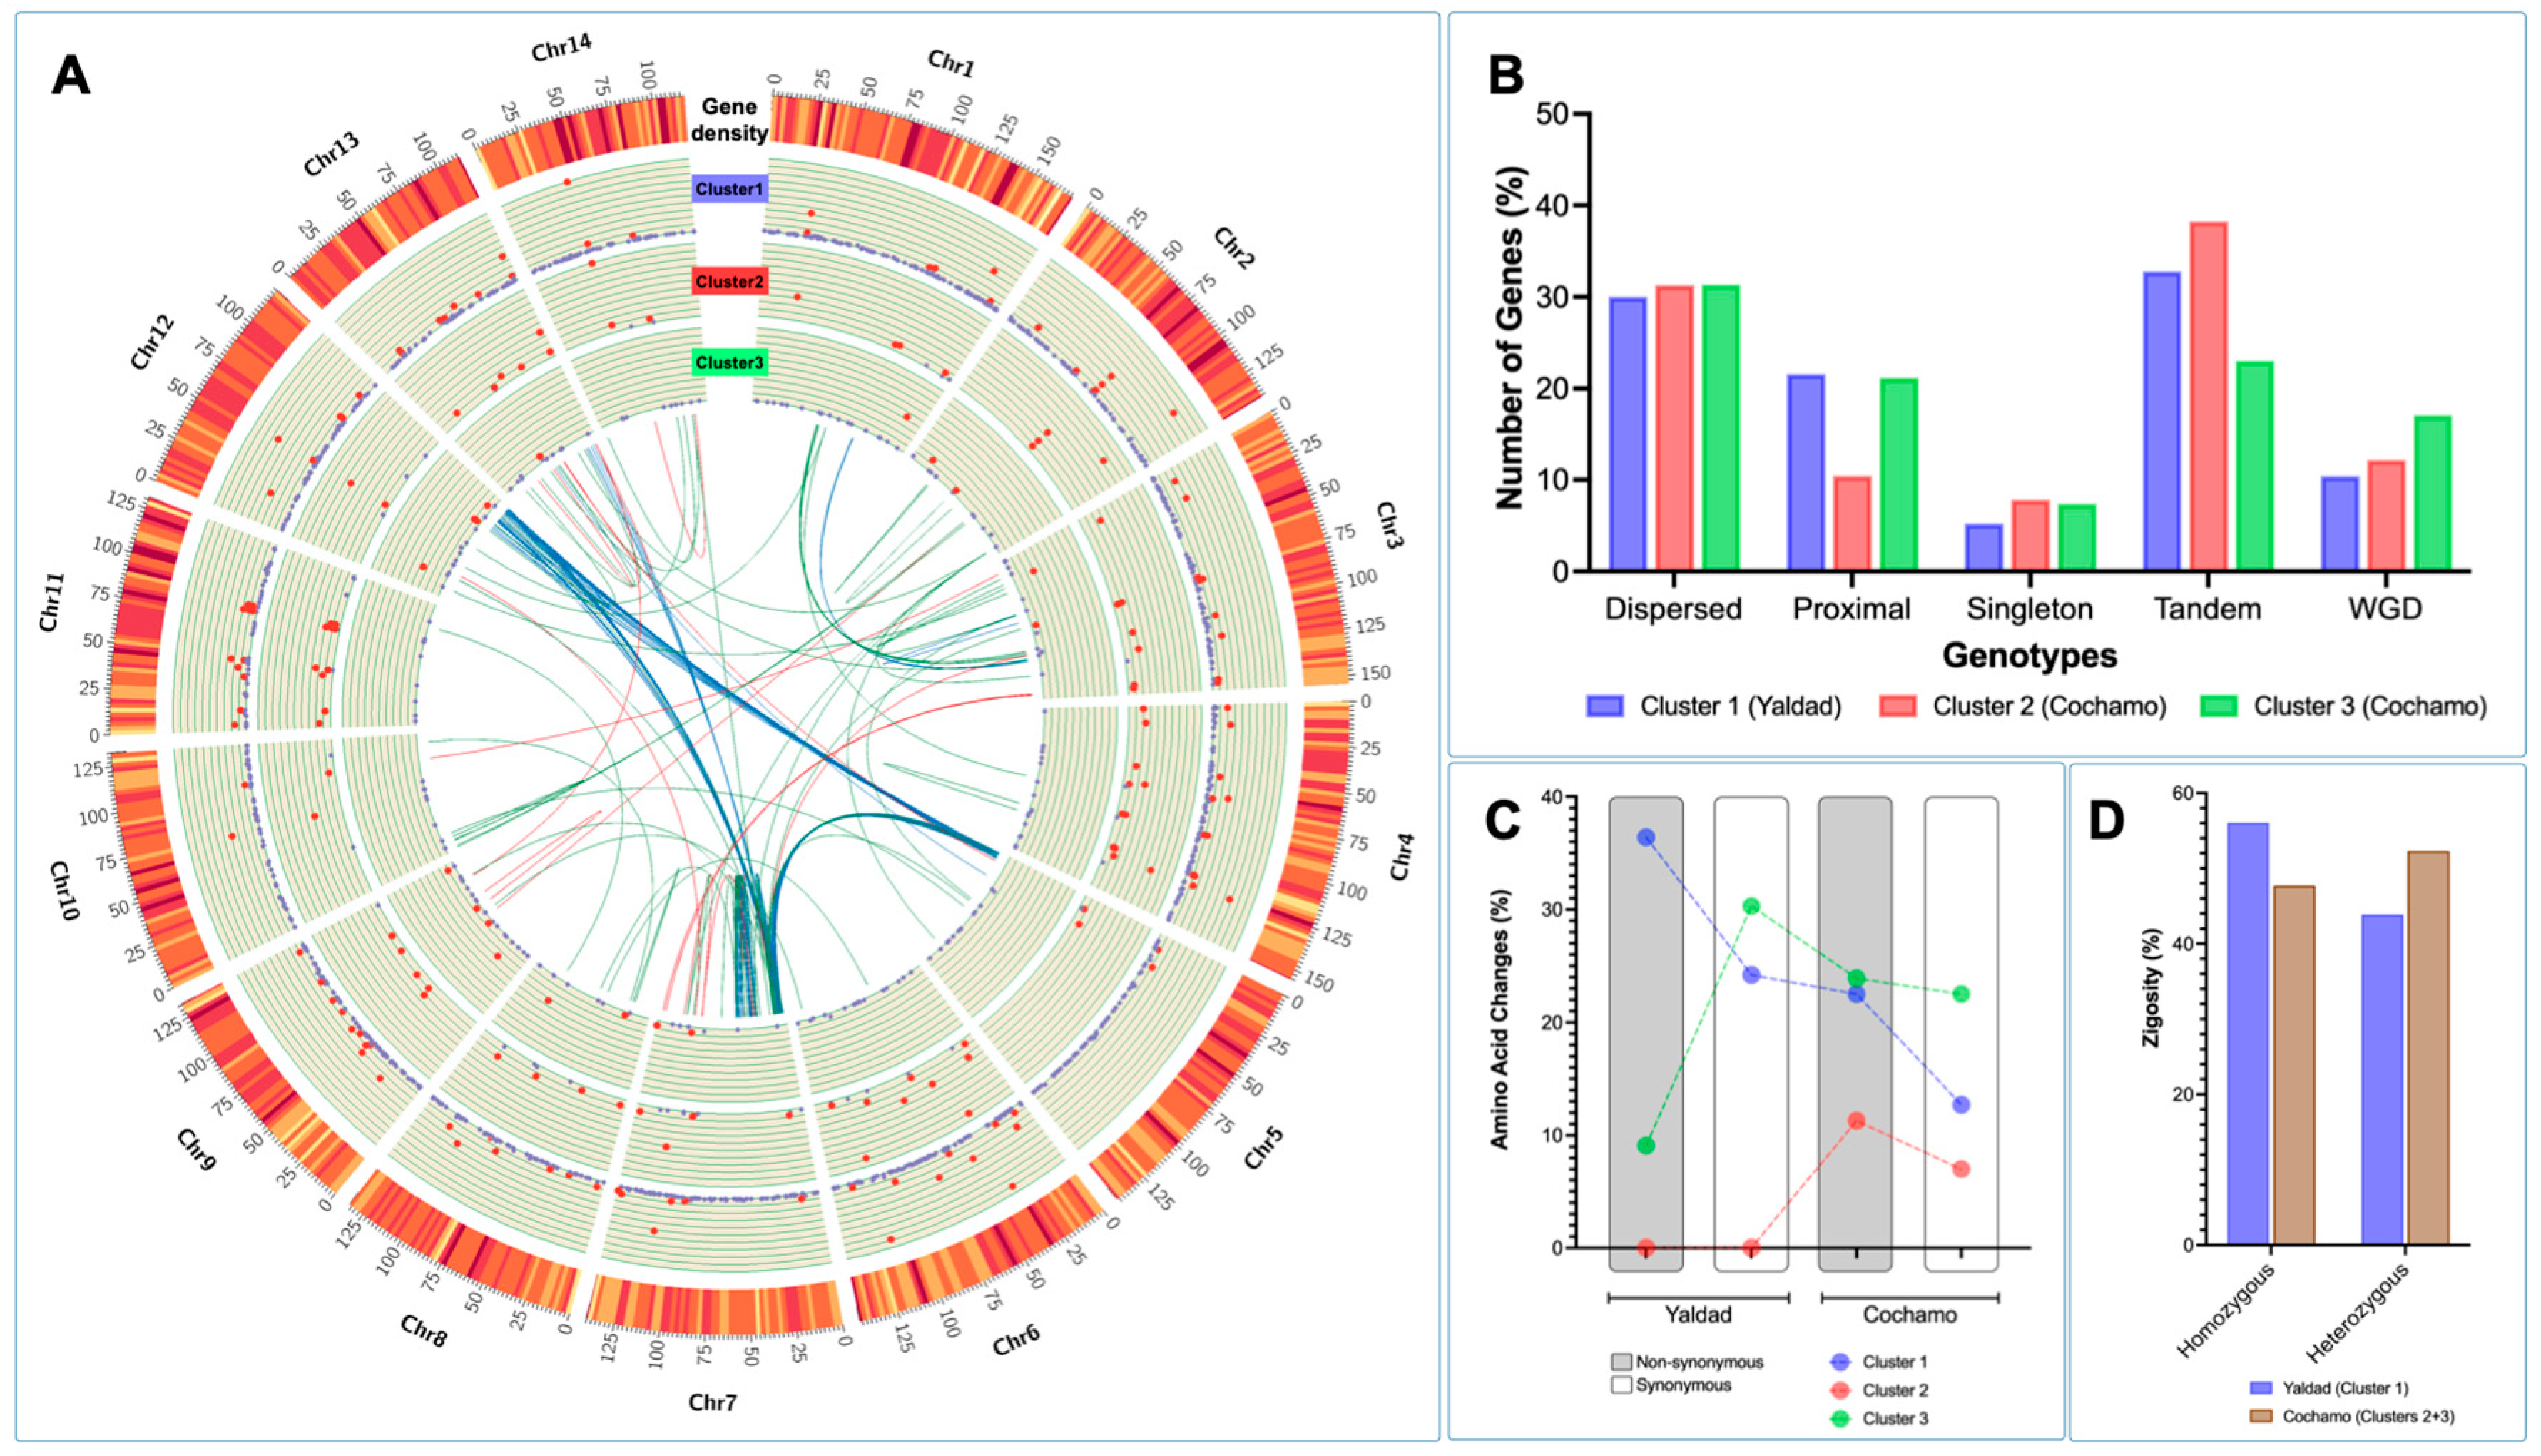
The cluster gene expression analysis was used to identify genetic polymorphisms annotated in differentially expressed genes (DEGs) between the Yaldad and Cochamó mussel populations. The DEGs were evaluated by cluster transcriptome analysis displayed using a Circos plot to visualize specific loci where DEGs were highly transcribed. The fold-change values calculated showed high transcription levels in clusters 1 and 2 through all chromosomes scanned (see red dots in Figure 7A). Congruently with the previous RNA-seq results in this study, the highest fold-change values were observed in DEGs annotated in cluster 1 (Yaldad population). By contrast, cluster 3 showed a small number of DEGs with high fold-change values. Notably, the physical mapping of DEGs on chromosomes evidenced specific transcriptome patterns, revealing genes differentially expressed through the mussel genome exposed to the marine environment. The synteny analysis for DEGs showed a marked pattern among chromosomes 5, 7, and 12 for cluster 1; meanwhile, the synteny observed for the DEGs annotated in clusters 2 and 3 revealed a wide distribution along the M. chilensis genome (Figure 7A). Interestingly, the analysis carried out to detect macro-genome mutation in gene families between the Yaldad and Cochamó populations evidenced a similar number of dispersed genes, suggesting that those might arise from transposition. Tandem or repeatedly duplicated genes were observed with a low proportion in cluster 3 (Cochamó); meanwhile, the proximal genes showed a similar proportion to cluster 1 (Yaldad). These results might suggest small-scale transposition or duplication/insertion events. An interesting finding was observed for whole-genome duplication (WGD). The primary proportion was evidenced in cluster 3 (Cochamó), compared with clusters 1 and 2 from the Yaldad population (Figure 7B). Furthermore, the bioinformatic analysis conducted for detecting amino acid changes (AAC) in DEGs showed that 38% of non-synonymous AAC were identified in mussels collected from Yaldad. By contrast, the main proportion of synonymous AAC was detected in mussels exposed to Cochamó’s estuarine conditions (Figure 7C). Notably, the analysis performed for DEGs annotated in cluster 2 did not show non-synonymous and synonymous AAC in mussels collected from Yaldad. Finally, evaluating the zygosity proportion estimated for each mussel population evidenced an inverse pattern between both populations. The Yaldad cluster was higher in the homozygous proportion than Cochamó, where heterozygous AAC were detected in a higher proportion (Figure 7D).
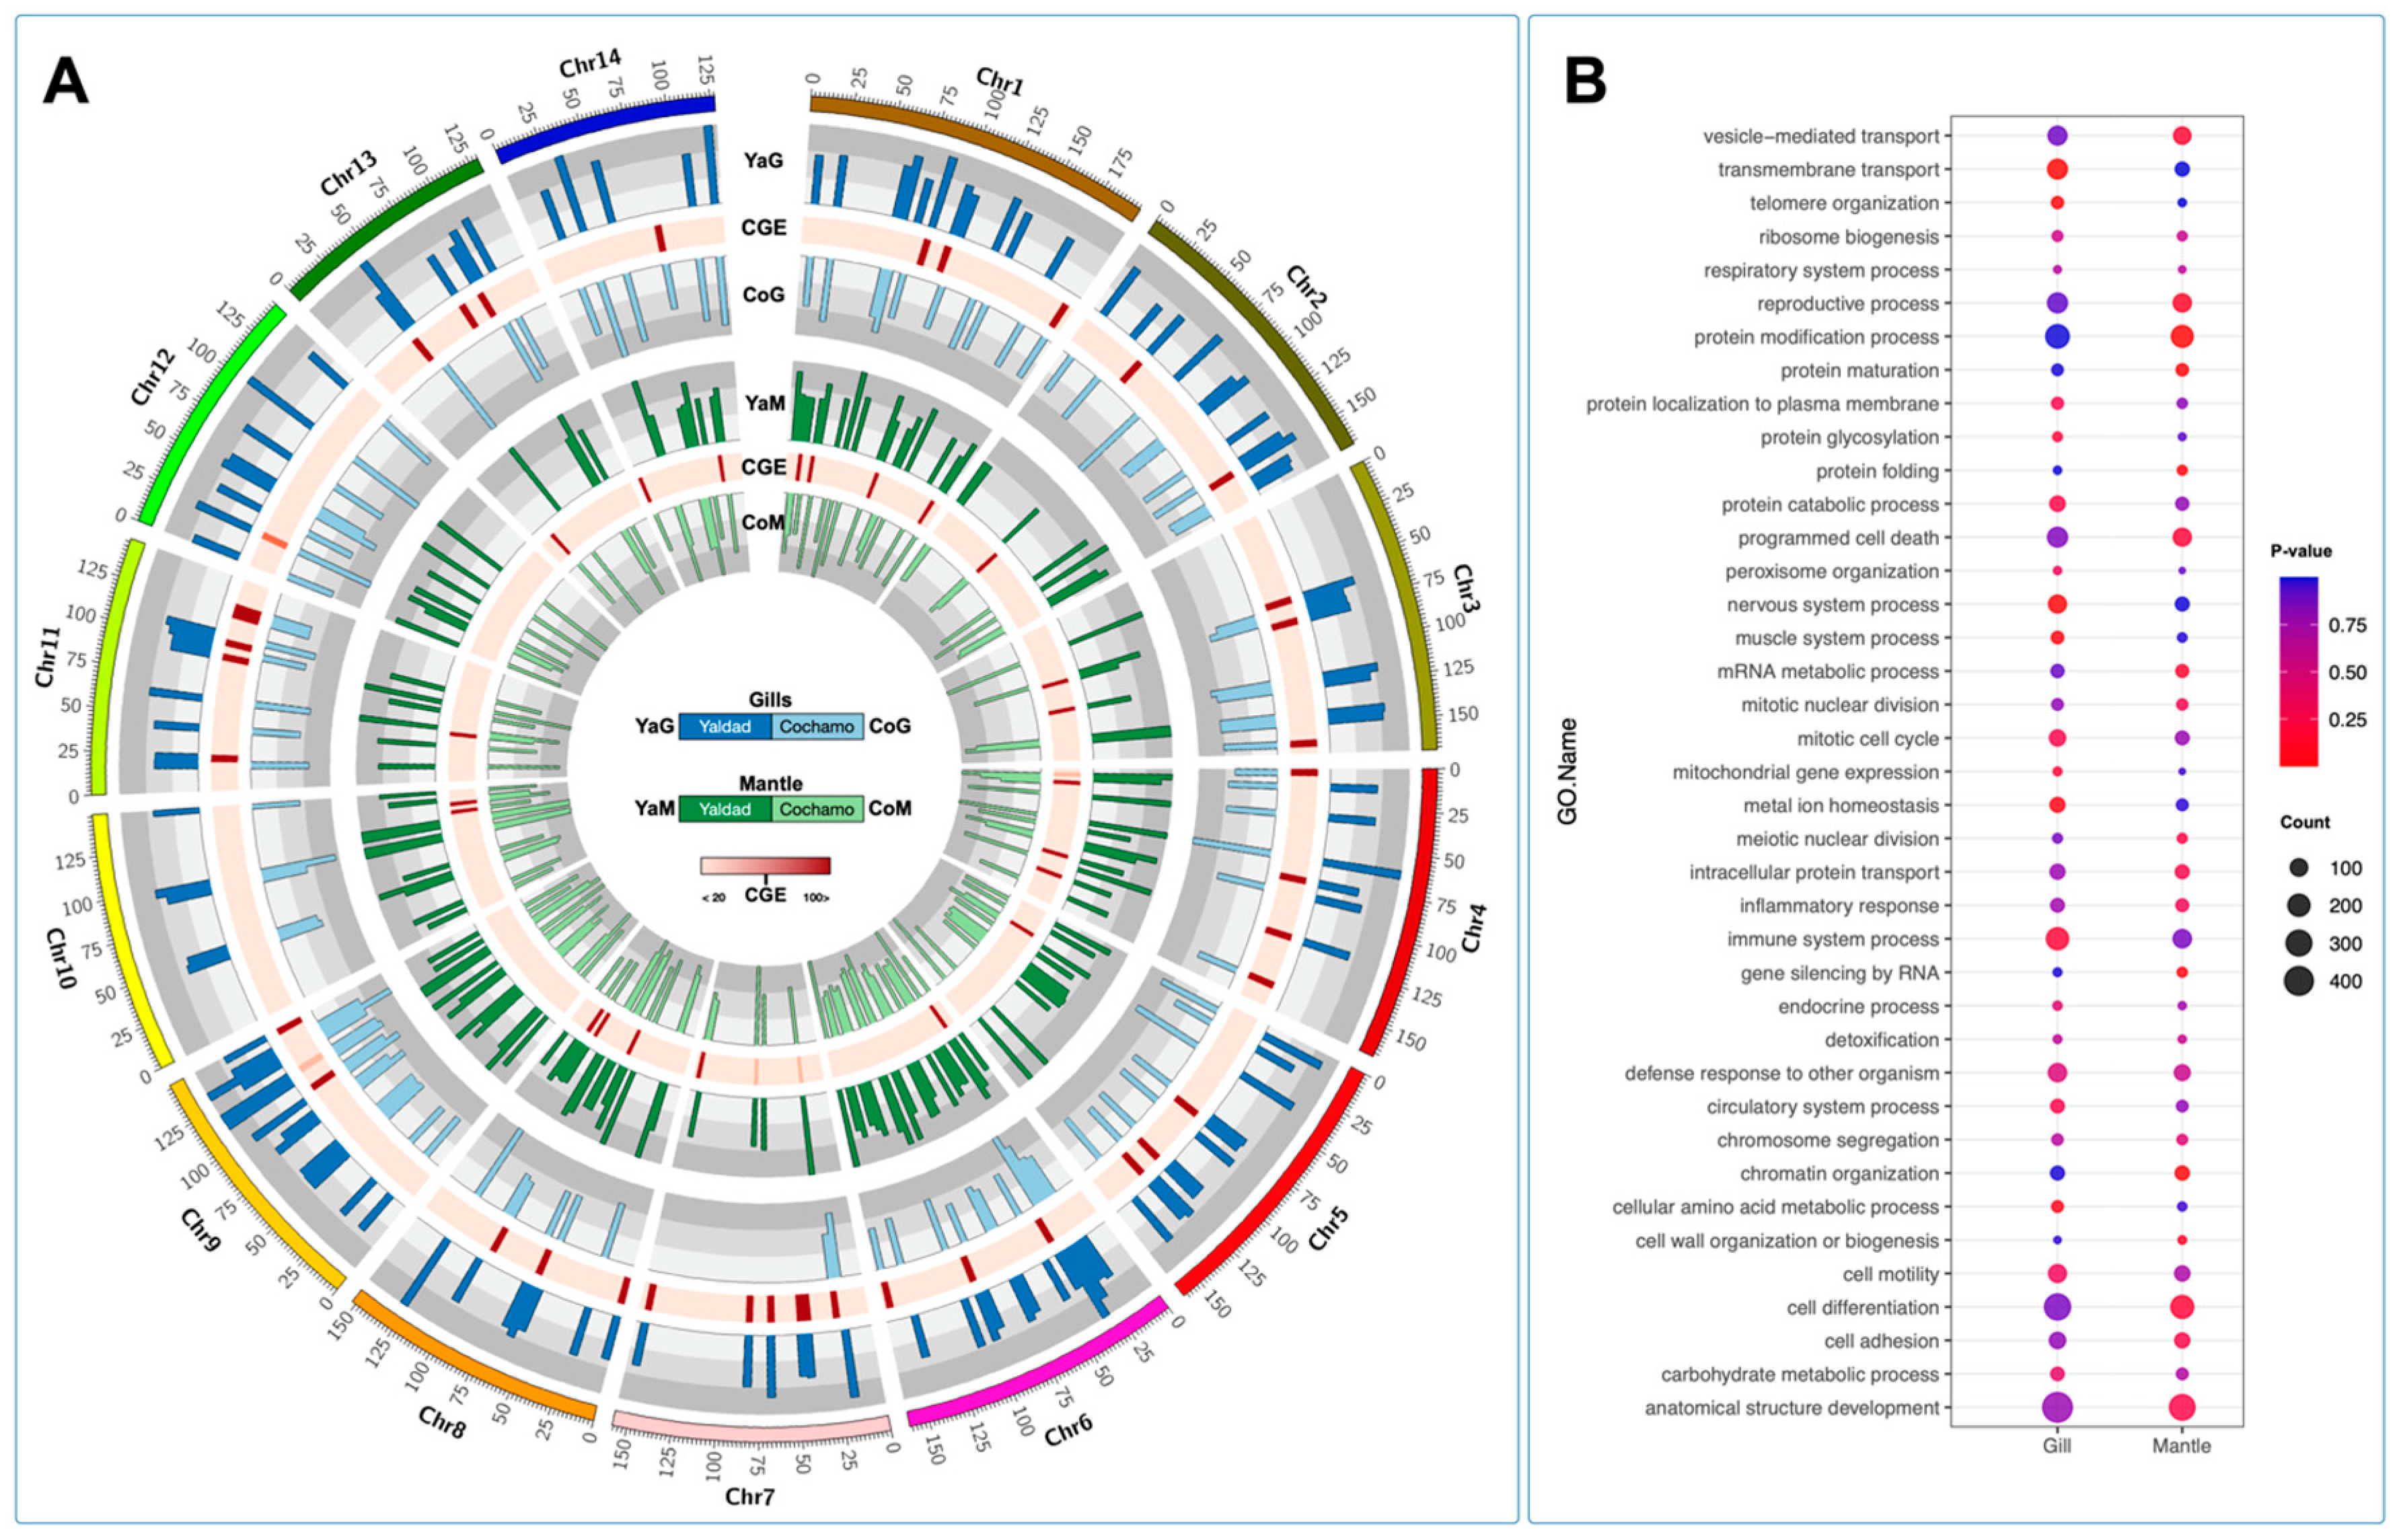
To explore the transcriptome signatures between the Yaldad and Cochamó mussel populations, we applied the genome chromosome expression (CGE) approach to test differences among tissues and individuals through the M. chilensis genome. The CGE analysis revealed high differences among chromosome regions, where the gill tissue was more modulated than the mantle tissue (Figure 8A). Interestingly, there are some levels of congruence among the CGE annotated for both mussel populations. We conducted a gene ontology enrichment analysis using this finding from genes identified by CGE analysis. The results evidenced that gill transcriptomes displayed functional processes associated with transmembrane transport, protein catabolic, nervous system, and metal homeostasis. Notably, immune system process GO terms were highly enriched in gills. Moreover, the chromosome region differentially expressed in mantle tissue revealed that the reproductive process, protein modification process, cell differentiation, anatomical structure development, and gene silencing by RNA were mainly annotated (Figure 8B). Taken together, the results reported in this study are highly congruent with the previous study conducted by Yévenes et al. [38], through the transcriptome responses of M. chilensis collected in ecologically different farm-impacted seedbeds.
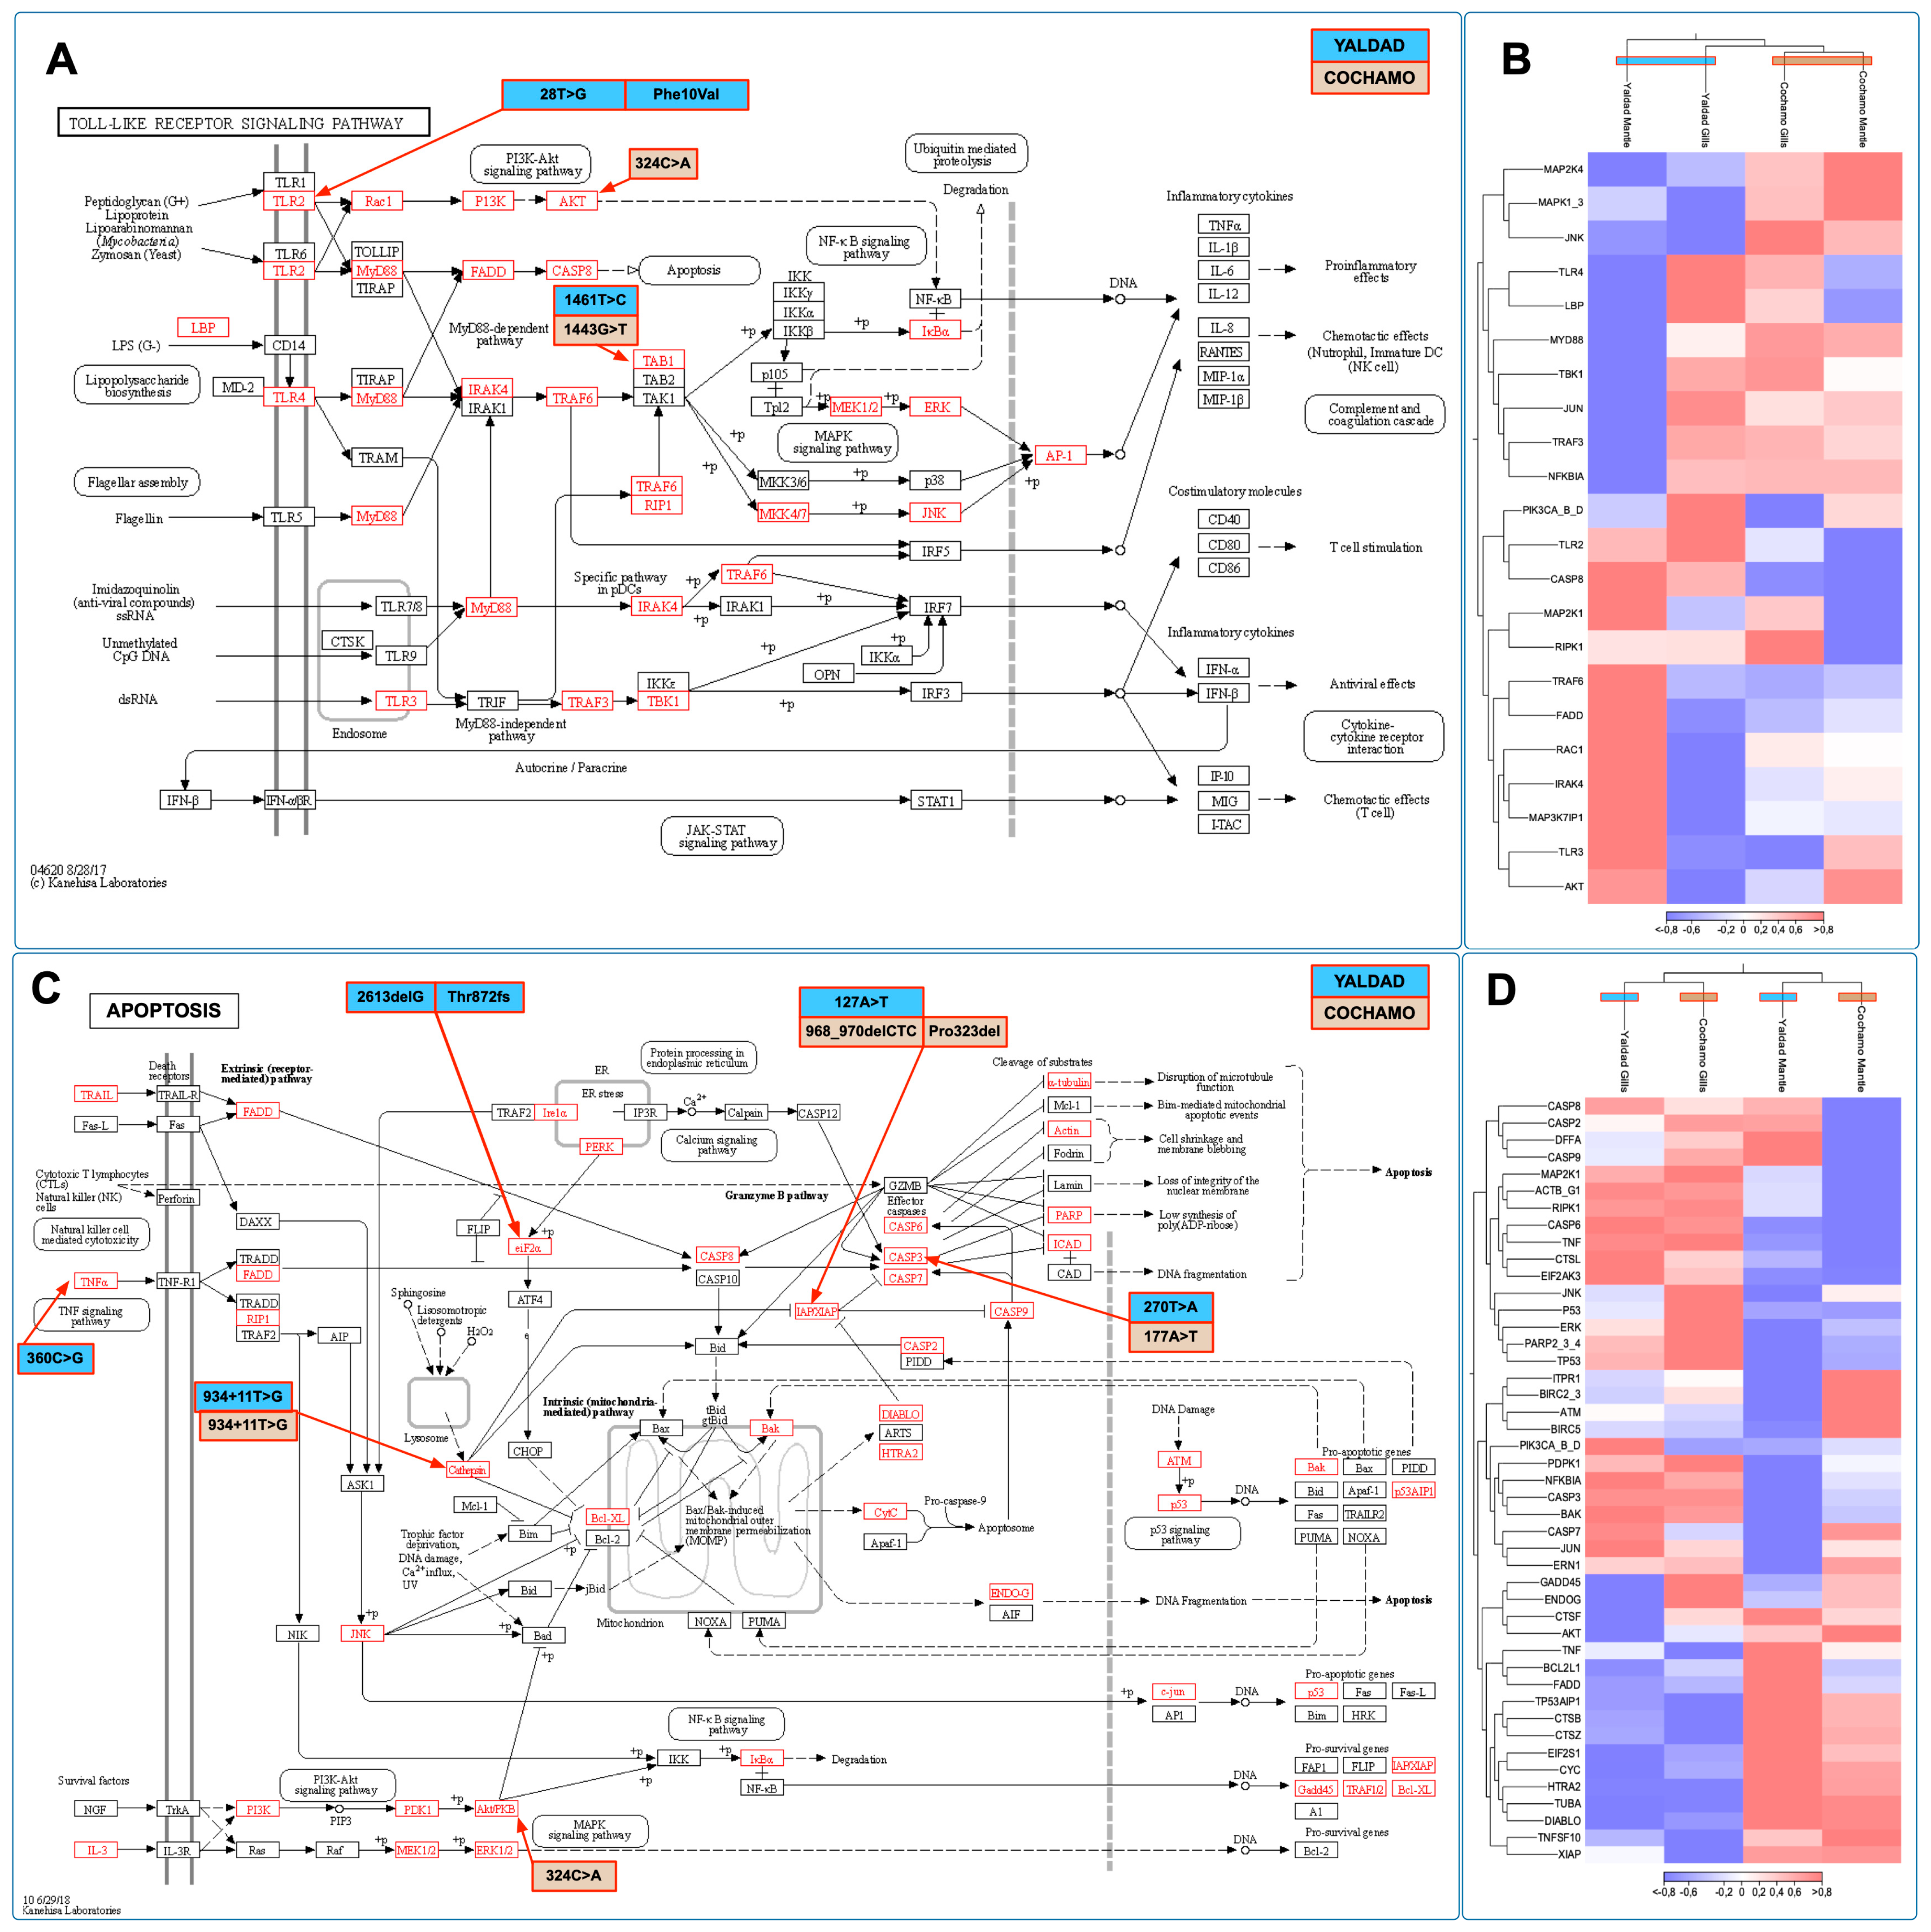
The cumulative findings of this study suggest that the immune system was primarily modulated between mussels exposed to the Yaldad and Cochamó environmental conditions. With the aim of exploring the transcription profiling of immune-related genes, we selected two KEGG pathways annotated in the M. chilensis genome (Figure 9). Herein, Toll-like receptor signaling pathway and apoptosis were analyzed in terms of transcription activity and single nucleotide variation (SNV) between mussel populations. Notably, a non-synonymous SNV was detected on the TLR2 gene (28T>G) in individuals collected from the Yaldad population. The translation evidenced an amino acid change from phenylalanine to valine at position 10 in the ORF (Phe10Val) (Figure 9A). The analysis also evidenced SNV on genes such as AKT and TAB1, where no amino acid changes were detected. The transcriptome profiling for the TLR pathway evidenced a high modulation of genes such as TLR3, AKT, TRAFF6, FADD, IRAK4, and RAC1 in mussels collected from Yaldad. Interestingly, mitogen-activated protein kinases (MAP2K and MAPK1) and c-Jun N-terminal kinase (JNK) were differentially expressed, suggesting putative roles related to stress signaling pathways (Figure 9B). Furthermore, the apoptosis pathway revealed two SNV localized in eukaryotic initiation factor 2 α (EIF2α) and inhibitor of apoptosis (IAP) in mussels sampled from the Yaldad and Cochamó populations, respectively (Figure 9C). The 2613delG in the EIF2α gene produces a frameshift at the Thr872; meanwhile, the 968_970delCTC localized in the IAP gene produces a deletion of proline at position 323. The transcriptome profiling of apoptosis-related genes showed a conspicuous differentiation between gills and mantle tissue, where three primary gene expression clusters were identified (Figure 9D).
Notably, genes such as P53, ERK, TP53, PARP2, and JNK were highly expressed in gill tissue. The gene expression analysis in mantle tissue evidenced high transcriptional activity in genes related to the intrinsic (mitochondria-mediated) pathway, such as the B-cell lymphoma (BCL) gene and the second mitochondria-derived activator of caspase (DIABLO) gene. Concerning the mitogenome of M. chilensis, it was previously reported by Gaitán-Espitia et al. [34] and Śmietanka and Burzyński [91], evidencing a genome size of 16,748bp and structurally identical to the northern hemisphere M. edulis and M. galloprovincialis mitogenomes. Furthermore, the putative adaptive contribution of the mitochondrial genes was recently reported by Yevenes et al. [37]. The RNA-Seq analysis detected differences in the number of upregulated mitogens between individuals from Cochamó and Yaldad, some being tissue-specific (ND4L and COX2). Several monomorphic location-specific mitochondrial genetic variants were detected in samples from Cochamó and Yaldad, representing standing genetic variability to optimize mitochondrial functioning under local habitats. Overall, these mitochondrial transcriptomic differences reflect the impact of environmental conditions on the mitochondrial genome functioning and offer new markers to assess the effects of habitat translocations on mussel fitness, a routine industry practice. Likewise, these mitochondrial markers should help monitor and maintain population differences in this keystone and heavily exploited native species.
Further functional studies will be conducted to validate the association between single nucleotide polymorphisms and the fitness traits observed or how the translocation process associated with aquaculture activity can evolve with the loss of locally adapted alleles. Interestingly, a recent transplant experiment reported by Jahnsen-Guzmán et al. [92] demonstrated that M. chilensis individuals are adapted to the subtidal environment (4 m depth), as they exhibit significantly higher fitness (growth and calcification rates) than those transferred to the intertidal environment (1 m depth), which showed increased metabolic stress. Herein, the mussel lives in extreme environmental variability, where their ability to cope with perturbations, and build plasticity and adaptive responses, seems based on the genome architecture.

4. Conclusions

This study reports the first chromosome-level genome assembly of the native blue mussel Mytilus chilensis. This genomic resource was used to identify genome signatures related to the phenotypic plasticity in the mussel population inhabiting contrasting marine environments. Collectively, the putative mutations associated with immune- and metabolism-related genes suggest molecular regulatory mechanisms to reduce the number of genes and their transcriptional activity under stress conditions. This evolutionary strategy can suggest that the expression of those genes has evolved a degree of “frontloading” that potentially pre-adapts the mussel populations to frequent heat and salinity stress, contributing to their physiological tolerance and fitness. We believe that the generated genomic resource must be instrumental for future research on population genomics informing management and sustainable strategies for the Chilean mussel aquaculture.

Supplementary Materials

The following supporting information can be downloaded at: https://www.mdpi.com/article/10.3390/genes14040876/s1, Figure S1: Distribution of Simple Sequence Repeats (SSR) identified by SSR Finder in the M. chilensis genome; Figure S2: Dot-blot analysis between M. chilensis and M. coruscus chromosomes, and macro-syntenic relationships; Figure S3: Temporal and spatial variability of Sea Surface Temperature (SST) around Chiloé island, and at sites Yaldad and Cochamo, over the past two decades.

Author Contributions

C.G.-E. designed and supervised the study; V.V.-M., G.N.-A., D.V.-M., J.E.T., P.A.O. and M.Y. collected and prepared the mussel samples; C.G.-E., V.V.-M., D.V.-M., G.N.-A. and F.J.T. analyzed all sequencing and oceanographic data; C.G.-E., G.G., A.F., B.N., S.R. and M.G. wrote the manuscript with the other authors’ help; G.A. and C.G.-E. sequenced and analyzed the Steamer-like elements in M. chilensis. All authors have read and agreed to the published version of the manuscript.

Funding

This study was funded by FONDAP #1522A0004, FONDECYT #1210852, and #1130852, granted by ANID-Chile.

Institutional Review Board Statement

The Committee of Ethics, Bioethics, and Biosafety, University of Concepción, Chile, approved this project (CEB324-2022, September 2021).

Informed Consent Statement

Not applicable.

Data Availability Statement

The Mytilus chilensis whole-genome sequencing data supporting this study’s findings are available from NCBI under BioProject PRJNA861856. The sequencing data supporting this study’s findings are available in SRA at SRR20966976, SRR20593343, and SRP261955. The benefits from this study accrue from sharing our data and results on public databases as described above. The assembled genome and the genome annotation results were deposited in the Figshare database [93].

Conflicts of Interest

The authors declare no conflict of interest.

References

  1. Gonzalez-Poblete, E.; Hurtado, C.F.; Rojo, C.; Norambuena, R. Blue Mussel Aquaculture in Chile: Small or Large Scale Industry? Aquaculture 2018, 493, 113–122. [Google Scholar] [CrossRef]
  2. Global Aquaculture Production Quantity (1950–2020). Query Definition: Chilean Mussel (ASFIS Species). Available online: https://www.fao.org/fishery/statistics-query/en/aquaculture/aquaculture_quantity (accessed on 30 March 2023).
  3. Enriquez, R.; Frosner, G.G.; Hochsteinmintzel, V.; Riedemann, S.; Reinhardt, G. Accumulation and Persistence of Hepatitis—A Virus in Mussels. J. Med. Virol. 1992, 37, 174–179. [Google Scholar] [CrossRef] [PubMed]
  4. Gray, A.P.; Lucas, I.A.N.; Seed, R.; Richardson, C.A. Mytilus edulis chilensis Infested with Coccomyxa parasitica (Chlorococcales, Coccomyxaceae). J Mollus Stud 1999, 65, 289–294. [Google Scholar] [CrossRef]
  5. Detree, C.; Nuñez-Acuña, G.; Roberts, S.; Gallardo-Escarate, C. Uncovering The Complex Transcriptome Response of Mytilus chilensis Against Saxitoxin: Implications of Harmful Algal Blooms on Mussel Populations. PLoS ONE 2016, 11, e0165231. [Google Scholar] [CrossRef] [PubMed] [Green Version]
  6. Blanc, J.M.; Molinet, C.; Subiabre, R.; Diaz, P.A. Cadmium Determination in Chilean Blue Mussels Mytilus Chilensis: Implications for Environmental and Agronomic Interest. Mar. Pollut. Bull. 2018, 129, 913–917. [Google Scholar] [CrossRef]
  7. Vihtakari, M.; Hendriks, I.E.; Holding, J.; Renaud, P.E.; Duarte, C.M.; Havenhand, J.N. Effects of Ocean Acidification and Warming on Sperm Activity and Early Life Stages of the Mediterranean Mussel (Mytilus galloprovincialis). Water Sui. 2013, 5, 1890–1915. [Google Scholar] [CrossRef] [Green Version]
  8. Hüning, A.K.; Melzner, F.; Thomsen, J.; Gutowska, M.A.; Krämer, L.; Frickenhaus, S.; Rosenstiel, P.; Pörtner, H.-O.; Philipp, E.E.; Lucassen, M. Impacts of Seawater Acidification on Mantle Gene Expression Patterns of The Baltic Sea Blue Mussel: Implications for Shell Formation and Energy Metabolism. Mar. Biol. 2013, 160, 1845–1861. [Google Scholar] [CrossRef] [Green Version]
  9. Harvell, C.D.; Mitchell, C.E.; Ward, J.R.; Altizer, S.; Dobson, A.P.; Ostfeld, R.S.; Samuel, M.D. Climate Warming and Disease Risks for Terrestrial and Marine Biota. Science 2002, 296, 2158–2162. [Google Scholar] [CrossRef] [Green Version]
  10. Cooper, E.L.; Parrinello, N. Comparative Immunologic Models Can Enhance Analyses of Environmental Immunotoxicity. Annu. Rev. Fish Dis. 1996, 6, 179–191. [Google Scholar] [CrossRef]
  11. Crain, C.M.; Kroeker, K.; Halpern, B.S. Interactive and Cumulative Effects of Multiple Human Stressors in Marine Systems. Ecol. Lett. 2008, 11, 1304–1315. [Google Scholar] [CrossRef]
  12. Gunderson, A.R.; Armstrong, E.J.; Stillman, J.H. Multiple Stressors in a Changing World: The Need for an Improved Perspective on Physiological Responses to the Dynamic Marine Environment. Annu. Rev. Mar. Sci. 2016, 8, 357–378. [Google Scholar] [CrossRef] [PubMed]
  13. Bibby, R.; Widdicombe, S.; Parry, H.; Spicer, J.; Pipe, R. Effects of Ocean Acidification on The Immune Response of The Blue Mussel Mytilus edulis. Aquat. Biol. 2008, 2, 67–74. [Google Scholar] [CrossRef] [Green Version]
  14. Lockwood, B.L.; Sanders, J.G.; Somero, G.N. Transcriptomic Responses to Heat Stress in Invasive and Native Blue Mussels (genus Mytilus): Molecular Correlates of Invasive Success. J. Exp. Biol. 2010, 213, 3548–3558. [Google Scholar] [CrossRef] [Green Version]
  15. Malagoli, D.; Casarini, L.; Sacchi, S.; Ottaviani, E. Stress and Immune Response in The Mussel Mytilus galloprovincialis. Fish Shellfish. Immunol. 2007, 23, 171–177. [Google Scholar] [CrossRef] [PubMed]
  16. Mitta, G.; Vandenbulcke, F.; Noel, T.; Romestand, B.; Beauvillain, J.C.; Salzet, M.; Roch, P. Differential Distribution and Defence Involvement of Antimicrobial Peptides in Mussel. J. Cell Sci. 2000, 113, 2759–2769. [Google Scholar] [CrossRef] [PubMed]
  17. Romero, A.; Novoa, B.; Figueras, A. Genomic and Transcriptomic Identification of The Cathepsin Superfamily in The Mediterranean Mussel Mytilus galloprovincialis. Dev. Comp. Immunol. 2022, 127, 104286. [Google Scholar] [CrossRef] [PubMed]
  18. Rey-Campos, M.; Novoa, B.; Pallavicini, A.; Gerdol, M.; Figueras, A. Comparative Genomics Reveals 13 Different Isoforms of Mytimycins (A-M) in Mytilus galloprovincialis. Int. J. Mol. Sci. 2021, 22, 3235. [Google Scholar] [CrossRef] [PubMed]
  19. Pereiro, P.; Moreira, R.; Novoa, B.; Figueras, A. Differential Expression of Long Non-Coding RNA (lncRNA) in Mediterranean Mussel (Mytilus galloprovincialis) Hemocytes under Immune Stimuli. Genes 2021, 12, 1393. [Google Scholar] [CrossRef]
  20. Sendra, M.; Saco, A.; Yeste, M.P.; Romero, A.; Novoa, B.; Figueras, A. Nanoplastics: From Tissue Accumulation to Cell Translocation Into Mytilus galloprovincialis Hemocytes. Resilience of Immune Cells Exposed to Nanoplastics and Nanoplastics Plus Vibrio Splendidus Combination. J. Hazard Mater. 2020, 388, 121788. [Google Scholar] [CrossRef]
  21. Perez-Garcia, C.; Moran, P.; Pasantes, J.J. Karyotypic Diversification in Mytilus Mussels (Bivalvia: Mytilidae) Inferred from Chromosomal Mapping of rRNA and Histone Gene Clusters. BMC Genet. 2014, 15, 84. [Google Scholar] [CrossRef] [Green Version]
  22. Corrochano-Fraile, A.; Davie, A.; Carboni, S.; Bekaert, M. Evidence of Multiple Genome Duplication Events in Mytilus Evolution. BMC Genom. 2022, 23, 340. [Google Scholar] [CrossRef] [PubMed]
  23. Zhang, G.F.; Fang, X.D.; Guo, X.M.; Li, L.; Luo, R.B.; Xu, F.; Yang, P.C.; Zhang, L.L.; Wang, X.T.; Qi, H.G.; et al. The Oyster Genome Reveals Stress Adaptation and Complexity of Shell Formation. Nature 2012, 490, 49–54. [Google Scholar] [CrossRef] [PubMed] [Green Version]
  24. Du, X.D.; Fan, G.Y.; Jiao, Y.; Zhang, H.; Guo, X.M.; Huang, R.L.; Zheng, Z.; Bian, C.; Deng, Y.W.; Wang, Q.H.; et al. The Pearl Oyster Pinctada fucata martensii Genome and Multi-Omic Analyses Provide Insights into Biomineralization. Gigascience 2017, 6, gix059. [Google Scholar] [CrossRef] [PubMed] [Green Version]
  25. Wang, S.; Zhang, J.B.; Jiao, W.Q.; Li, J.; Xun, X.G.; Sun, Y.; Guo, X.M.; Huan, P.; Dong, B.; Zhang, L.L.; et al. Scallop Genome Provides Insights into Evolution of Bilaterian Karyotype and Development. Nat. Ecol. Evol. 2017, 1, 0120. [Google Scholar] [CrossRef] [PubMed] [Green Version]
  26. Uliano-Silva, M.; Dondero, F.; Otto, T.D.; Costa, I.; Lima, N.C.B.; Americo, J.A.; Mazzoni, C.J.; Prosdocimi, F.; Rebelo, M.D. A Hybrid-Hierarchical Genome Assembly Strategy to Sequence the Invasive Golden Mussel, Limnoperna fortunei. Gigascience 2017, 7, gix128. [Google Scholar] [CrossRef] [PubMed] [Green Version]
  27. McCartney, M.A.; Auch, B.; Kono, T.; Mallez, S.; Zhang, Y.; Obille, A.; Becker, A.; Abrahante, J.E.; Garbe, J.; Badalamenti, J.P.; et al. The Genome of the Zebra Mussel, Dreissena polymorpha: A Resource for Comparative Genomics, Invasion Genetics, and Biocontrol. G3 Genes Genom. Genet. 2022, 12, jkab423. [Google Scholar] [CrossRef]
  28. Yang, J.L.; Feng, D.D.; Liu, J.; Xu, J.K.; Chen, K.; Li, Y.F.; Zhu, Y.T.; Liang, X.; Lu, Y. Chromosome-Level Genome Assembly of The Hard-Shelled Mussel Mytilus coruscus, A Widely Distributed Species from The Temperate Areas of East Asia. Gigascience 2021, 10, giab024. [Google Scholar] [CrossRef]
  29. Murgarella, M.; Puiu, D.; Novoa, B.; Figueras, A.; Posada, D.; Canchaya, C. A First Insight into the Genome of the Filter-Feeder Mussel Mytilus galloprovincialis. PLoS ONE 2016, 11, e0151561. [Google Scholar] [CrossRef] [Green Version]
  30. Renaut, S.; Guerra, D.; Hoeh, W.R.; Stewart, D.T.; Bogan, A.E.; Ghiselli, F.; Milani, L.; Passamonti, M.; Breton, S. Genome Survey of the Freshwater Mussel Venustaconcha ellipsiformis (Bivalvia: Unionida) Using a Hybrid De Novo Assembly Approach. Genome Biol. Evol. 2018, 10, 1637–1646. [Google Scholar] [CrossRef]
  31. Xu, T.; Sun, J.; Lv, J.; Watanabe, H.K.; Li, T.Q.; Zou, W.W.; Rouse, G.W.; Wang, S.; Qian, P.Y.; Bao, Z.M.; et al. Genome-Wide Discovery of Single Nucleotide Polymorphisms (SNPs) and Single Nucleotide Variants (SNVs) in Deep-Sea Mussels: Potential Use in Population Genomics and Cross-Species Application. In Deep Sea Research Part II: Topical Studies in Oceanography; Elsevier: Amsterdam, The Netherlands, 2009; Volume 137, pp. 318–326. [Google Scholar] [CrossRef]
  32. Gerdol, M.; Moreira, R.; Cruz, F.; Gomez-Garrido, J.; Vlasova, A.; Rosani, U.; Venier, P.; Naranjo-Ortiz, M.A.; Murgarella, M.; Greco, S.; et al. Massive Gene Presence-Absence Variation Shapes An Open Pan-Genome in the Mediterranean Mussel. Genome Biol. 2020, 21, 275. [Google Scholar] [CrossRef]
  33. Larrain, M.A.; Zbawicka, M.; Araneda, C.; Gardner, J.P.A.; Wenne, R. Native and Invasive Taxa on the Pacific Coast of South America: Impacts on Aquaculture, Traceability and Biodiversity of Blue Mussels (Mytilus spp.). Evol. Appl. 2018, 11, 298–311. [Google Scholar] [CrossRef]
  34. Gaitan-Espitia, J.D.; Quintero-Galvis, J.F.; Mesas, A.; D’Elia, G. Mitogenomics of Southern Hemisphere Blue Mussels (Bivalvia: Pteriomorphia): Insights into The Evolutionary Characteristics of The Mytilus edulis Complex. Sci. Rep. 2016, 6, 26853. [Google Scholar] [CrossRef] [PubMed] [Green Version]
  35. Curelovich, J.N.; Lovrich, G.A.; Cueto, G.R.; Calcagno, J.A. Recruitment and Zonation in A Sub-Antarctic Rocky Intertidal Community. J. Mar. Biol. Assoc. UK 2018, 98, 411–422. [Google Scholar] [CrossRef]
  36. Duarte, C.; Navarro, J.M.; Quijon, P.A.; Loncon, D.; Torres, R.; Manriquez, P.H.; Lardies, M.A.; Vargas, C.A.; Lagos, N.A. The energetic physiology of juvenile mussels, Mytilus chilensis (Hupe): The Prevalent Role of Salinity under Current and Predicted pCO(2) Scenarios. Environ. Pollut. 2018, 242, 156–163. [Google Scholar] [CrossRef]
  37. Yevenes, M.; Nunez-Acuna, G.; Gallardo-Escarate, C.; Gajardo, G. Adaptive Mitochondrial Genome Functioning in Ecologically Different Farm-Impacted Natural Seedbeds of The Endemic Blue Mussel Mytilus chilensis. Comp. Biochem. Phys. D Genom. Proteom. 2022, 42, 100955. [Google Scholar] [CrossRef] [PubMed]
  38. Yevenes, M.; Nunez-Acuna, G.; Gallardo-Escarate, C.; Gajardo, G. Adaptive Differences in Gene Expression in Farm-Impacted Seedbeds of the Native Blue Mussel Mytilus chilensis. Front. Genet. 2021, 12, 666539. [Google Scholar] [CrossRef] [PubMed]
  39. Vinagre, C.; Mendonca, V.; Narciso, L.; Madeira, C. Food Web of The Intertidal Rocky Shore of The West Portuguese Coast—Determined by Stable Isotope Analysis. Mar. Environ. Res. 2015, 110, 53–60. [Google Scholar] [CrossRef]
  40. Hargrave, B.T.; Doucette, L.I.; Cranford, P.J.; Law, B.A.; Milligan, T.G. Influence of Mussel Aquaculture on Sediment Organic Enrichment in A Nutrient-Rich Coastal Embayment. Mar. Ecol. Prog. Ser. 2008, 365, 137–149. [Google Scholar] [CrossRef]
  41. Flores, C.A.M.; Gomez, M.A.D.; Munoz, C.B.A.; Perez, L.E.C.; Arribas, S.L.M.; Opazo, M.P.A.; Huaquin, E.J.E.N. Spatial Distribution Pattern of Mytilus chilensis Beds in The Reloncavi fjord: Hypothesis on Associated Processes. Rev. Chil. De Hist. Nat. 2015, 88, 11. [Google Scholar] [CrossRef] [Green Version]
  42. Toro, J.E.; Ojeda, J.A.; Vergara, A.M. The Genetic Structure of Mytilus chilensis (Hupe 1854) Populations Along The Chilean Coast Based on RAPDs Analysis. Aquac. Res. 2004, 35, 1466–1471. [Google Scholar] [CrossRef]
  43. Astorga, M.P.; Vargas, J.; Valenzuela, A.; Molinet, C.; Marin, S.L. Population Genetic Structure and Differential Selection in Mussel Mytilus chilensis. Aquac. Res. 2018, 49, 919–927. [Google Scholar] [CrossRef]
  44. Lieberman-Aiden, E.; van Berkum, N.L.; Williams, L.; Imakaev, M.; Ragoczy, T.; Telling, A.; Amit, I.; Lajoie, B.R.; Sabo, P.J.; Dorschner, M.O.; et al. Comprehensive Mapping of Long-Range Interactions Reveals Folding Principles of the Human Genome. Science 2009, 326, 289–293. [Google Scholar] [CrossRef] [Green Version]
  45. Cheng, H.Y.; Concepcion, G.T.; Feng, X.W.; Zhang, H.W.; Li, H. Haplotype-Resolved de Novo Assembly Using Phased Assembly Graphs with Hifiasm. Nat. Methods 2021, 18, 170–175. [Google Scholar] [CrossRef] [PubMed]
  46. Phase-Genomics. Aligning and QCing Phase Genomics Hi-C Data. Seattle, WA: Phase Genomics Documentation. Available online: https://phasegenomics.github.io (accessed on 30 March 2023).
  47. Li, H.; Durbin, R. Fast and accurate long-read alignment with Burrows-Wheeler transform. Bioinformatics 2010, 26, 589–595. [Google Scholar] [CrossRef] [Green Version]
  48. Faust, G.G.; Hall, I.M. SAMBLASTER: Fast Duplicate Marking and Structural Variant Read Extraction. Bioinformatics 2014, 30, 2503–2505. [Google Scholar] [CrossRef] [PubMed] [Green Version]
  49. Danecek, P.; Bonfield, J.K.; Liddle, J.; Marshall, J.; Ohan, V.; Pollard, M.O.; Whitwham, A.; Keane, T.; McCarthy, S.A.; Davies, R.M.; et al. Twelve years of SAMtools and BCFtools. Gigascience 2021, 10, giab008. [Google Scholar] [CrossRef]
  50. Li, H.; Handsaker, B.; Wysoker, A.; Fennell, T.; Ruan, J.; Homer, N.; Marth, G.; Abecasis, G.; Durbin, R.; Proc, G.P.D. The Sequence Alignment/Map Format and SAMtools. Bioinformatics 2009, 25, 2078–2079. [Google Scholar] [CrossRef] [PubMed] [Green Version]
  51. Bickhart, D.M.; Rosen, B.D.; Koren, S.; Sayre, B.L.; Hastie, A.R.; Chan, S.; Lee, J.; Lam, E.T.; Liachko, I.; Sullivan, S.T.; et al. Single-Molecule Sequencing and Chromatin Conformation Capture Enable de Novo Reference Assembly of The Domestic Goat Genome. Nat. Genet. 2017, 49, 643–650. [Google Scholar] [CrossRef] [Green Version]
  52. Gallardo-Escárate, C.; Álvarez-Borrego, J.; Del Río-Portilla, M.; Kober, V. Karyotype of Pacific Red Abalone Haliotis rufescens (Archaeogastropoda: Haliotidae), Using Image Analysis. J. Shellfish. Res. 2004, 23, 205–209. [Google Scholar]
  53. Amar, G.; Palma, C.; von Brand, E.; Jara, P. Karyotype Study in The Surf Clam Mesodesma donacium Lamarck, 1818 (Bivalvia: Veneroida: Mesodesmatidae). Gayana 2008, 72, 18–22. [Google Scholar] [CrossRef] [Green Version]
  54. Tarifeno-Saldivia, E.; Valenzuela-Miranda, D.; Gallardo-Escarate, C. In the Shadow: The Emerging Role of Long Non-Coding RNAs in The Immune Response of Atlantic Salmon. Dev. Comp. Immunol. 2017, 73, 193–205. [Google Scholar] [CrossRef]
  55. Gallardo-Escarate, C.; Figueras, A.; Novoa, B. The Dark Matter of The Mussel’s Genome: Long Non-Coding RNAs as Key Players in Mytilus. Isj. Invert. Surviv. J. 2019, 16, 191. [Google Scholar]
  56. Wang, Y.P.; Tang, H.B.; DeBarry, J.D.; Tan, X.; Li, J.P.; Wang, X.Y.; Lee, T.H.; Jin, H.Z.; Marler, B.; Guo, H.; et al. MCScanX: A Toolkit for Detection and Evolutionary Analysis of Gene Synteny and Collinearity. Nucleic Acids Res. 2012, 40, e49. [Google Scholar] [CrossRef] [PubMed] [Green Version]
  57. Chen, C.J.; Chen, H.; Zhang, Y.; Thomas, H.R.; Frank, M.H.; He, Y.H.; Xia, R. TBtools: An Integrative Toolkit Developed for Interactive Analyses of Big Biological Data. Mol. Plant 2020, 13, 1194–1202. [Google Scholar] [CrossRef] [PubMed]
  58. Metzger, M.J.; Villalba, A.; Carballal, M.J.; Iglesias, D.; Sherry, J.; Reinisch, C.; Muttray, A.F.; Baldwin, S.A.; Goff, S.P. Widespread Transmission of Independent Cancer Lineages within Multiple Bivalve Species. Nature 2016, 534, 705–709. [Google Scholar] [CrossRef] [Green Version]
  59. Metzger, M.J.; Reinisch, C.; Sherry, J.; Goff, S.P. Horizontal Transmission of Clonal Cancer Cells Causes Leukemia in Soft-Shell Clams. Cell 2015, 161, 255–263. [Google Scholar] [CrossRef] [Green Version]
  60. Elston, R.A.; Moore, J.D.; Brooks, K. Disseminated Neoplasia of Bivalve Mollusks. Rev. Aquat. Sci. 1992, 6, 405–466. [Google Scholar]
  61. Ciocan, C.; Sunila, I. Disseminated Neoplasia in Blue Mussels, Mytilus galloprovincialis, from The Black Sea, Romania. Mar. Pollut. Bull. 2005, 50, 1335–1339. [Google Scholar] [CrossRef] [Green Version]
  62. Arriagada, G.; Metzger, M.J.; Muttray, A.F.; Sherry, J.; Reinisch, C.; Street, C.; Lipkin, W.I.; Goff, S.P. Activation of Transcription and Retrotransposition of A Novel Retroelement, Steamer, in Neoplastic Hemocytes of The Mollusk Mya Arenaria. Proc. Natl. Acad. Sci. USA 2014, 111, 14175–14180. [Google Scholar] [CrossRef] [Green Version]
  63. Valenzuela-Muñoz, V.; Gallardo-Escárate, C.; Benavente, B.P.; Valenzuela-Miranda, D.; Núñez-Acuña, G.; Escobar-Sepulveda, H.; Váldes, J.A. Whole-Genome Transcript Expression Profiling Reveals Novel Insights into Transposon Genes and Non-Coding RNAs during Atlantic Salmon Seawater Adaptation. Biology 2022, 11, 1. [Google Scholar] [CrossRef]
  64. Krzywinski, M.I.; Schein, J.E.; Birol, I.; Connors, J.; Gascoyne, R.; Horsman, D.; Jones, S.J.; Marra, M.A. Circos: An Information Aesthetic for Comparative Genomics. Genome Res. 2009, 19, 1639–1645. [Google Scholar] [CrossRef] [Green Version]
  65. Ellis, R.P.; Parry, H.; Spicer, J.I.; Hutchinson, T.H.; Pipe, R.K.; Widdicombe, S. Immunological Function in Marine Invertebrates: Responses to Environmental Perturbation. Fish Shellfish. Immunol. 2011, 30, 1209–1222. [Google Scholar] [CrossRef]
  66. Rolff, J.; Siva-Jothy, M.T. Invertebrate Ecological Immunology. Science 2003, 301, 472–475. [Google Scholar] [CrossRef] [PubMed] [Green Version]
  67. Yu, G.; Wang, L.-G.; Han, Y.; He, Q.-Y. clusterProfiler: An R Package for Comparing Biological Themes Among Gene Clusters. Omics A J. Integr. Biol. 2012, 16, 284–287. [Google Scholar] [CrossRef] [PubMed]
  68. Ghurye, J.; Rhie, A.; Walenz, B.P.; Schmitt, A.; Selvaraj, S.; Pop, M.; Phillippy, A.M.; Koren, S. Integrating Hi-C Links with Assembly Graphs for Chromosome-Scale Assembly. PLoS Comput. Biol. 2019, 15, e1007273. [Google Scholar] [CrossRef] [PubMed] [Green Version]
  69. Pal, K.; Forcato, M.; Ferrari, F. Hi-C Analysis: From Data Generation to Integration. Biophys. Rev. 2019, 11, 67–78. [Google Scholar] [CrossRef] [Green Version]
  70. Lando, D.; Stevens, T.J.; Basu, S.; Laue, E.D. Calculation of 3D Genome Structures for Comparison of Chromosome Conformation Capture Experiments with Microscopy: An Evaluation of Single-Cell Hi-C Protocols. Nucl. Phila 2018, 9, 190–201. [Google Scholar] [CrossRef] [Green Version]
  71. Lin, D.; Hong, P.; Zhang, S.H.; Xu, W.Z.; Jamal, M.; Yan, K.J.; Lei, Y.Y.; Li, L.; Ruan, Y.J.; Fu, Z.F.; et al. Digestion-Ligation-Only Hi-C is An Efficient and Cost-Effective Method for Chromosome Conformation Capture. Nat. Genet. 2018, 50, 754–763. [Google Scholar] [CrossRef] [PubMed]
  72. Langmead, B.; Trapnell, C.; Pop, M.; Salzberg, S.L. Ultrafast and Memory-Efficient Alignment of Short DNA Sequences to The Human Genome. Genome Biol. 2009, 10, R25. [Google Scholar] [CrossRef] [Green Version]
  73. Robinson, J.T.; Turner, D.; Durand, N.C.; Thorvaldsdottir, H.; Mesirov, J.P.; Aiden, E.L. Juicebox.js Provides a Cloud-Based Visualization System for Hi-C Data. Cell Syst. 2018, 6, 256–258. [Google Scholar] [CrossRef] [Green Version]
  74. Martínez-Lage, A.; González-Tizón, A.; Méndez, J. Chromosomal Markers in Three Species of the Genus Mytilus (Mollusca: Bivalvia). Heredity 1995, 74, 369–375. [Google Scholar] [CrossRef]
  75. Manni, M.; Berkeley, M.R.; Seppey, M.; Simao, F.A.; Zdobnov, E.M. BUSCO Update: Novel and Streamlined Workflows Along with Broader and Deeper Phylogenetic Coverage for Scoring of Eukaryotic, Prokaryotic, and Viral Genomes. Mol. Biol. Evol. 2021, 38, 4647–4654. [Google Scholar] [CrossRef] [PubMed]
  76. Bedell, J.A.; Korf, I.; Gish, W. MaskerAid: A Performance Enhancement to RepeatMasker. Bioinformatics 2000, 16, 1040–1041. [Google Scholar] [CrossRef] [PubMed] [Green Version]
  77. Bao, W.D.; Kojima, K.K.; Kohany, O. Repbase Update, A Database of Repetitive Elements in Eukaryotic Genomes. Mob. DNA UK 2015, 6, 11. [Google Scholar] [CrossRef] [Green Version]
  78. Storer, J.; Hubley, R.; Rosen, J.; Wheeler, T.J.; Smit, A.F. The Dfam Community Resource of Transposable Element Families, Sequence Models, and Genome Annotations. Mob. DNA UK 2021, 12, 2. [Google Scholar] [CrossRef]
  79. Vidal, R.; Penaloza, C.; Urzua, R.; Toro, J.E. Screening of ESTs from Mytilus for The Detection of SSR Markers in Mytilus californianus. Mol. Ecol. Resour. 2009, 9, 1409–1411. [Google Scholar] [CrossRef]
  80. Ferreira, S.; Ashby, R.; Jeunen, G.J.; Rutherford, K.; Collins, C.; Todd, E.V.; Gemmell, N.J. DNA from Mollusc Shell: A Valuable and Underutilised Substrate for Genetic Analyses. Peer J. 2020, 8, e9420. [Google Scholar] [CrossRef]
  81. Larrain, M.A.; Diaz, N.F.; Lamas, C.; Uribe, C.; Araneda, C. Traceability of Mussel (Mytilus chilensis) in Southern Chile Using Microsatellite Molecular Markers and Assignment Algorithms. Exploratory Survey. Food Res. Int. 2014, 62, 104–110. [Google Scholar] [CrossRef]
  82. Gardner, J.P.A.; Oyarzun, P.A.; Toro, J.E.; Wenne, R.; Zbawicka, M. Phylogeography of Southern Hemisphere Blue Mussels of the Genus Mytilus: Evolution, Biosecurity, Aquaculture and Food Labelling. Oceanogr. Mar. Biol. 2021, 59, 139. [Google Scholar] [CrossRef]
  83. Nunez-Acuna, G.; Gallardo-Escarate, C. Identification of Immune-Related SNPs in the Transcriptome of Mytilus chilensis through High-Throughput Sequencing. Fish Shellfish. Immunol. 2013, 35, 1899–1905. [Google Scholar] [CrossRef]
  84. Araneda, C.; Larrain, M.A.; Hecht, B.; Narum, S. Adaptive Genetic Variation Distinguishes Chilean Blue Mussels (Mytilus chilensis) from Different Marine Environments. Ecol. Evol. 2016, 6, 3632–3644. [Google Scholar] [CrossRef] [PubMed] [Green Version]
  85. Kess, T.; Bentzen, P.; Lehnert, S.J.; Sylvester, E.V.A.; Lien, S.; Kent, M.P.; Sinclair-Waters, M.; Morris, C.; Wringe, B.; Fairweather, R.; et al. Modular Chromosome Rearrangements Reveal Parallel and Nonparallel Adaptation in a Marine Fish. Ecol. Evol. 2020, 10, 638–653. [Google Scholar] [CrossRef] [PubMed] [Green Version]
  86. Li, L.; Lyu, X.; Hou, C.; Takenaka, N.; Nguyen, H.Q.; Ong, C.T.; Cubenas-Potts, C.; Hu, M.; Lei, E.P.; Bosco, G.; et al. Widespread Rearrangement of 3D Chromatin Organization Underlies Polycomb-Mediated Stress-Induced Silencing. Mol. Cell 2015, 58, 216–231. [Google Scholar] [CrossRef] [Green Version]
  87. Wang, Y.; Guo, X. Chromosomal Rearrangement in Pectinidae Revealed by rRNA Loci and Implications for Bivalve Evolution. Biol. Bull. 2004, 207, 247–256. [Google Scholar] [CrossRef] [PubMed] [Green Version]
  88. Garcia-Souto, D.; Perez-Garcia, C.; Kendall, J.; Pasantes, J.J. Molecular Cytogenetics in Trough Shells (Mactridae, Bivalvia): Divergent GC-Rich Heterochromatin Content. Genes 2016, 7, 47. [Google Scholar] [CrossRef] [PubMed] [Green Version]
  89. Gonzalez-Tizon, A.M.; Martinez-Lage, A.; Rego, I.; Ausio, J.; Mendez, J. DNA Content, Karyotypes, and Chromosomal Location of 18S-5.8S-28S Ribosomal Loci in Some Species of Bivalve Molluscs from The Pacific Canadian Coast. Genome 2000, 43, 1065–1072. [Google Scholar] [CrossRef]
  90. Wenne, R.; Zbawicka, M.; Pradzinska, A.; Kotta, J.; Herkul, K.; Gardner, J.P.A.; Apostolidis, A.P.; Pocwierz-Kotus, A.; Rouane-Hacene, O.; Korrida, A.; et al. Molecular Genetic Differentiation of Native Populations of Mediterranean Blue Mussels, Mytilus galloprovincialis Lamarck, 1819, and The Relationship with Environmental Variables. Eur. Zool. J. 2022, 89, 755–784. [Google Scholar] [CrossRef]
  91. Śmietanka, B.; Burzyński, A. Complete Female Mitochondrial Genome of Mytilus chilensis. Mitochondrial DNA B Resour. 2017, 2, 101–102. [Google Scholar] [CrossRef] [Green Version]
  92. Jahnsen-Guzman, N.; Lagos, N.A.; Lardies, M.A.; Vargas, C.A.; Fernandez, C.; San Martin, V.A.; Saavedra, L.; Cuevas, L.A.; Quijon, P.A.; Duarte, C. Environmental Refuges Increase Performance of Juvenile Mussels Mytilus chilensis: Implications for Mussel Seedling and Farming Strategies. Sci. Total Environ. 2021, 751, 141723. [Google Scholar] [CrossRef]
  93. Gallardo-Escárate, C. Chromosome-Level Genome Assembly of the Blue Mussel Mytilus chilensis Reveals Molecular Signatures Facing the Marine Environment. figshare 2023. [Google Scholar] [CrossRef]
Figure 1. (A) Photograph of the native blue mussel Mytilus chilensis. (B) Metaphasic chromosomes from mussel larvae samples and mapping of 28S-rDNA by fluorescence in situ hybridization. (C) Heatmap of chromosome interaction intensity in the blue mussel Hi-C assembly. The x- and y-axis represent the length of the chromosomes. The color bar represents the Hi-C contact density.
Genes 14 00876 g001
Figure 2. The native blue mussel Mytilus chilensis genome. (A) Workflow of de novo whole-genome sequencing project and annotation for M. chilensis. The rectangles indicate the steps of the primary data processing, and the arrows indicate output or input data. Pink diamonds indicate the combined strategy based on homolog prediction, de novo, and RNA-seq-assisted prediction. (B) The Circos plot shows the genomic features for the 14 pseudo-chromosomes. From the outer to the inner circle: gene density, repeat density, GC content, rRNA localization, and ncRNAs. The transcriptome expression for mantle (Ma), gills (Gi), hemocytes (He), and digestive gland (DG) are shown as light blue profiles. Chromosome syntenies are represented in different colors according to each ideogram. The chromosome size is shown in the Mb scale.
Genes 14 00876 g002
Figure 3. (A) Whole-genome macrosyntenic relationships between M. chilensis and M. coruscus. Orthologous relationships among mussel chromosomes are highlighted in grey, and the orthologous relationships between Chr6 and LG02, and Chr10 and LG09 are highlighted in red. (B,C) Gene ontology term annotated for the syntenic chromosome regions identified by MCScanX for Chr6 vs. LG02, and Chr10 vs. LG09. The x-axis indicates the negative log10 (p-value).
Genes 14 00876 g003
Figure 4. Molecular characterization of Steamer-like elements (SLE) in the M. chilensis genome and phylogenetic analysis using publicly available reference genomes assembled at chromosome level for bivalve species. (A) Alignment of five SLE copies localized in chromosomes 1, 6, 7, 10, and 11. All the SLEs are flanked by two LTRs (5′ and 3′) containing the Gag-Pol ORFs and the domains annotated for protease, reverse transcriptase, RNAaseH, and integrase. An insertion composed of 12 nucleotides (933^934 position) was found in chromosomes 7 and 11. The detailed alignment and the translation for the nucleotides inserted are highlighted in the red box. (B) Maximum likelihood (ML) phylogenetic tree of nucleotide sequences from SLEs found in eleven reference genomes for Bivalvia. Colored chromosomes and numbers indicate the SLE genome localization and the bivalve species, respectively. The species analyzed were: Veneridae (pink) Ruditapes philippinarum (Rphi) and Mercenaria mercenaria (Mmer); Solenidae (grey) Solen grandis (Sgra); Pectinidae (blue) Pecten maximus (Pmax); Ostreidae (green) Crassostrea gigas (Cgig), C. virginica (Cvir), and C. ariakensis (Caria); Pteriidae (light blue) Pinctada imbricata (Pimb); and Mytilidae (red) Mytilus coruscus (Mcor), Mytilus edulis (Medu), and Dreissena polymorpha (Dpol). (C) ML analysis of SLEs identified in M. edulis (orange), M. coruscus (orange), D. polymorpha (black), and M. chilensis (blue) chromosomes.
Genes 14 00876 g004aGenes 14 00876 g004b
Figure 5. Temporal and spatial variability around Chiloé island, and at the Yaldad and Cochamó sites, over the past two decades. (A,B) Maps correspond to mean SST computed for December 2017–March 2018 and the corresponding standard deviations. Stars indicate the location of sampling sites. (C) Monthly medians computed from data in (A), showing the first and third quartiles as error bars; note that the sequence of months shown on the x-axis begins in August and ends in July. Shaded areas indicate summer (yellow) and fall–winter (blue) periods. (D) In situ measurements for temperature (°C) and salinity (PSU) from 0 to 20 m of depth. The blue and red lines for (C,D) represent the data collected from Yaldad and Cochamó, respectively.
Genes 14 00876 g005
Figure 6. Population-specific transcriptome analysis in the blue mussel M. chilensis. (A) Transcriptome patterns of coding genes analyzed in gills from Yaldad and Cochamó populations. Three replicates were evaluated from each experimental group. The heatmap was based on transcripts per million (TPM) calculation and hierarchical clustering on Manhattan distances with average linkage (fold change ≥ |4|; FDR = 0.05). Yellow colors mean upregulated coding genes and black represents downregulated genes. (B) Venn diagram showing shared and unique genes expressed among the locations and replicates. (C) Pie chart showing the number of differentially expressed genes (DEGs) annotated for expression clusters 1, 2, and 3 between the Yaldad and Cochamó populations. (D) Fold-change values observed for DEGs identified in each evaluated cluster. (E) GO enrichment of cluster-specific genes (p-value < 10–16; |fold-change| > 4) annotated for key biological processes differentially expressed. The y-axis indicates the GO term, and the x-axis indicates the clusters identified in (A). The color bar indicates the enrichment analysis estimated by FDR (false discovery rate) < 0.05 for the DEGs (fold change > 4, p < 0.01). The bubble size indicates the number of genes associated with the given GO term.
Genes 14 00876 g006
Figure 7. Genetic polymorphisms annotated in differentially expressed genes (DEGs) analyzed between the Yaldad and Cochamó mussel populations. The evaluation of DEGs was performed by cluster transcriptome analysis. (A) Circos plot showing DEGs identified in the three analyzed clusters. From outer to the inner circle: gene density, DEG cluster 1, DEG cluster 2, DEG cluster 3, and syntenic relationships between DEGs (each color line represents the cluster analyzed). Red dots represent DEGs with fold-change values > |100|, and purple dots represent fold-change values < |10|. (B) Genotypes of DEGs identified in M. chilensis populations according to the transcription cluster analysis. Singleton means that the gene is single-copy, which should not be the type of members of gene families. Dispersed means that the gene might arise from transposition. Tandem means that genes were repeatedly duplicated. Proximal means that the gene might arise from small-scale transposition or from tandem duplication and insertion of some other genes. Whole-genome duplication (WGD) means the gene might arise from a chromosome duplication region. The analysis was carried out using MCScanX. (C) Amino acid change proportions (%) between the Yaldad and Cochamó populations. The non-synonymous and synonymous were annotated for the DEGs selected for each mussel population according to the cluster analysis. (D) Zygosity proportion (%) estimated for each mussel population. Cluster 1 (Yaldad) is represented by blue bars, and clusters 2 and 3 (Cochamó) are displayed in brown bars.
Genes 14 00876 g007
Figure 8. Chromosome–genome transcription in M. chilensis tissues collected from the Yaldad and Cochamó populations. (A) Circos plots showing the threshold values for transcriptional differences between locations (Yaldad/Cochamó) and tissues (gills/mantle). The differences were estimated through the CGE index. Heatmap in red shows the variation in gene expression from high to low differences. (B) GO enrichment of tissue-specific genes (p-value < 10–16; |fold-change| > 5) annotated for key biological processes differentially expressed. The y-axis indicates the GO term, and the x-axis indicates the tissues analyzed. The color bar indicates the enriched factor. The bubble size indicates the number of GO terms.
Genes 14 00876 g008
Figure 9. Transcriptome response of the immune system by KEGG pathway analysis and single mutation variant detection between M. chilensis populations. (A) Toll-like receptor (TLR) and (C) apoptosis signaling pathway comparisons between mussels from Yaldad and Cochamó. Single nucleotide polymorphisms and amino acid changes are shown in blue and brown boxes according to the mussel population. Identified gene families on the KEGG pathways are marked with red in the M. chilensis genome. (B,D) Transcriptome patterns of coding genes analyzed in gills and mantle tissue from the Yaldad and Cochamó populations for TLR and apoptosis-related genes. Three replicates were evaluated from each experimental group. The heatmap was based on transcripts per million (TPM) calculation and hierarchical clustering on Manhattan distances with average linkage. Red colors mean upregulated coding genes and blue colors represent downregulated genes.
Genes 14 00876 g009
Table 1. Statistics of whole-genome sequence assembly and transcriptome analysis of the blue mussel Mytilus chilensis using Illumina, PacBio, and Hi-C.
TypesMethodNo. of Reads (Millions)Read LengthLength (Giga Base Pair)
GenomePacBio SMRT63M20 kb882 Gbp
Illumina (Hi-C)253M150 bp37 Gbp
TranscriptomeIllumina (Hemolymph)38.3M100 bp3838 Gbp
Illumina (Mantle)37.1M100 bp3714 Gbp
Illumina (Gills)38.6M100 bp3865 Gbp
Illumina (Digestive gland)28.2M100 bp2823 Gbp
Table 2. Genome assembly statistics using HiFi reads and proximity ligation analysis for Mytilus chilensis.
LabelStatistics
PacBio assembly
Assembly size2,191,715,088
Contig (CTG) N50206,083
CTGs 13,762
Hi-C mapping
Total read pairs (RPs) analyzed253,342,981
High-quality (HQ) * RPs14.71%
Clustering usable HQ reads per contig (CTGs > 5 kb) *1215.84
RPs > 10 kb apart (CTGs > 10 kb)18.68%
Intercontig HQ RPs44.68%
Same strand HQ RPs21.50%
Split reads37.80%
* Number of contigs in scaffolds: 11,868 (100% of all contigs in chromosome clusters, 86.24% of all contigs).
Table 3. De novo assembly of the M. chilensis genome using proximity ligation (Hi-C).
Chromosome NumberNumber of ContigsLength (bp)
1988173,300,526
2852140,500,440
3957154,573,458
4871155,184,769
5902143,621,794
6845146,028,403
7946139,985,977
8821134,004,722
9794133,130,516
10821132,801,123
11802131,378,307
12790122,972,572
13735113,313,251
14744117,342,092
Total11,8681,938,137,950
N50 134,004,722
Table 4. Statistics of the classification results of repeat sequences from the M. chilensis genome.
TypeNumber of RepeatsLength (bp)% in Genome
DNA_TE:EnSpm41751,578,4310.08%
DNA_TE:Harbinger35921,793,5900.09%
DNA_TE:Helitron32,46918,451,6390.95%
DNA_TE:MuDR53292,668,4070.14%
DNA_TE:Other50,02129,284,1201.51%
DNA_TE:TcMar45233,828,2660.20%
DNA_TE:hAT99024,997,2380.26%
LTR:Copia32291,398,7340.07%
LTR:Gypsy972412,056,2190.62%
LTR:Other875312,605,6020.65%
Low_complexity3830,7620.00%
NonLTR:LINE124,903143,701,7147.41%
NonLTR:SINE93664,939,1930.25%
Tandem repeat: Satellite and Other108,470122,642,5916.32%
Unknown767,910740,296,98638.17%
All Repeat1,142,4041,100,273,49256.73%
Table 5. Basic statistical results of gene structure prediction of relative species.
SpeciesNumber of GenesAverage Transcript Length (bp)Average CDS Length (bp)Average Exons Per GeneAverage Exon Length (bp)Average Intron Length (bp)
Crassostrea gigas63,34017,784200812.63301286
Mytilus galloprovincialis77,41410,97713697.813,727260
Mytilus coruscus37,47814,73529005.912902727
Dreissena polymorpha68,01813,31626034.516321194
Table 6. Statistical gene structure prediction for the blue mussel M. chilensis genome.
TypeNumberAverage Transcript Length (bp)Average CDS Length (bp)Average Exons Per GeneAverage Exon Length (bp)Average Intron Length (bp)
De novoAugustus83,11010,62814235.7414231941
SNAP70,21736,6195369.465364265
GlimmerHMM39,70019737532.85753658
Geneid49,963311110362.7910361160
Genscan83,11010,62814235.7414231941
GeneMark81,25611,01813015.821301270
HomologGMAP250,83316,1073703.1016496891
spaln136,264--7.80179-
RNAseqPASA18,056--2.05504-
EVM63,943613711334.5411331414
Final set34,530653113774.9213771316
Table 7. Statistics of non-coding RNA annotation for the M. chilensis genome.
TypeCopy NumberAverage Length (bp)Total Length (bp)% of Genome
miRNA136592.8126,6780.01%
rRNA143118.5816,9570.00%
sRNA27583.6823,0110.00%
snRNA99106.7110,5640.00%
snoRNA226789.38202,6220.01%
tRNA51677.4439,9570.00%
tRNA pseudogenes12372.9689740.00%
All types479589.42428,7630.02%
Table 8. Statistics of gene function annotation for the M. chilensis genome.
NumberPercentage (%)
Swiss-Prot24,32570.45
Nr25,21273.01
Nt31028.98
KEGG22,42564.94
eggNOG23,18180.57
GO11,60633.61
Pfam60,88796.33
Annotated27,82180.57
Unannotated670919.43
Total34,530100
Disclaimer/Publisher’s Note: The statements, opinions and data contained in all publications are solely those of the individual author(s) and contributor(s) and not of MDPI and/or the editor(s). MDPI and/or the editor(s) disclaim responsibility for any injury to people or property resulting from any ideas, methods, instructions or products referred to in the content.

