

Functional Genetics to Understand the Etiology of Autoimmunity

Abstract
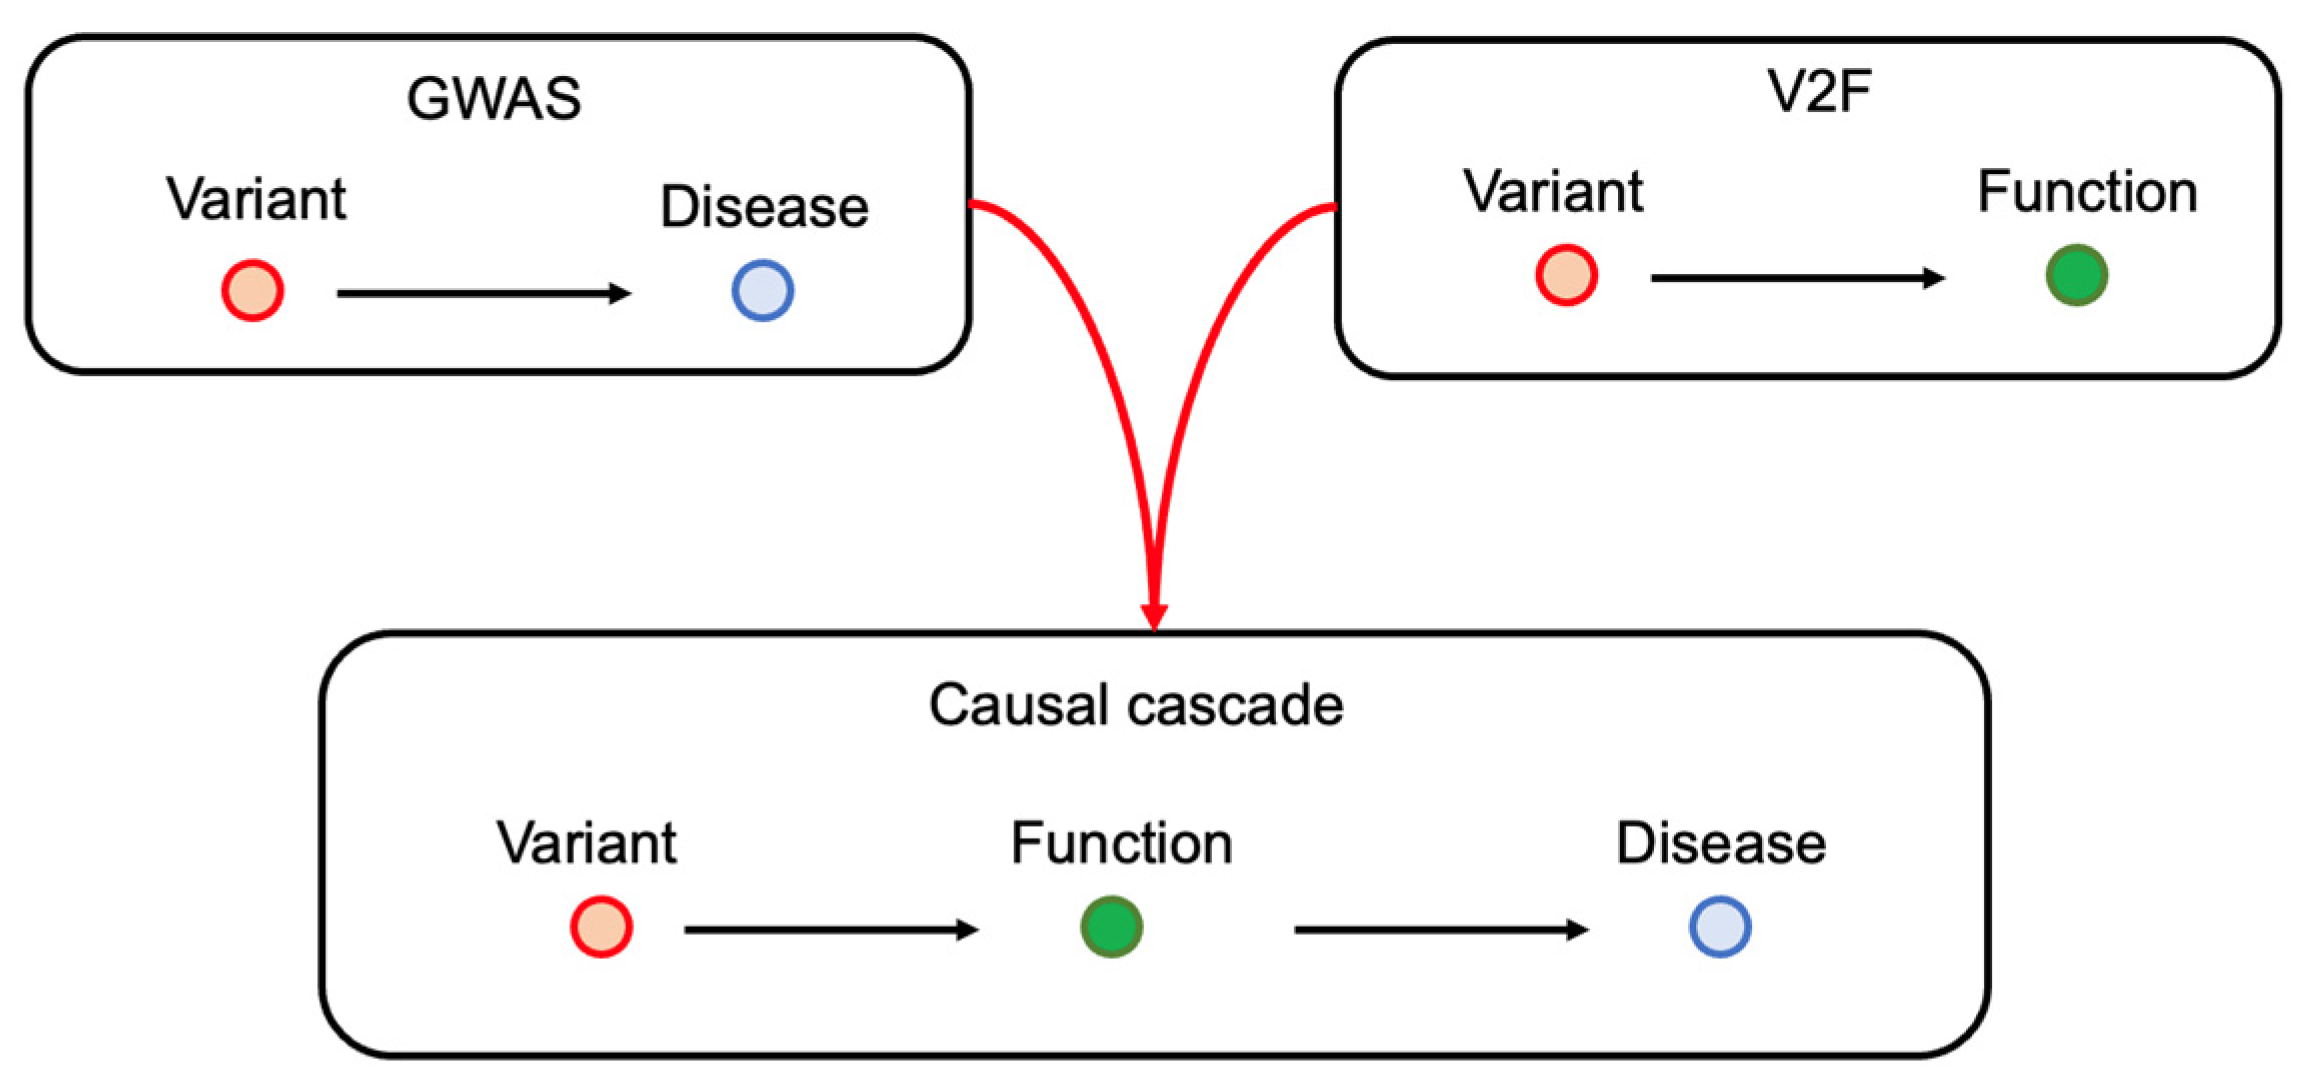
1. Introduction
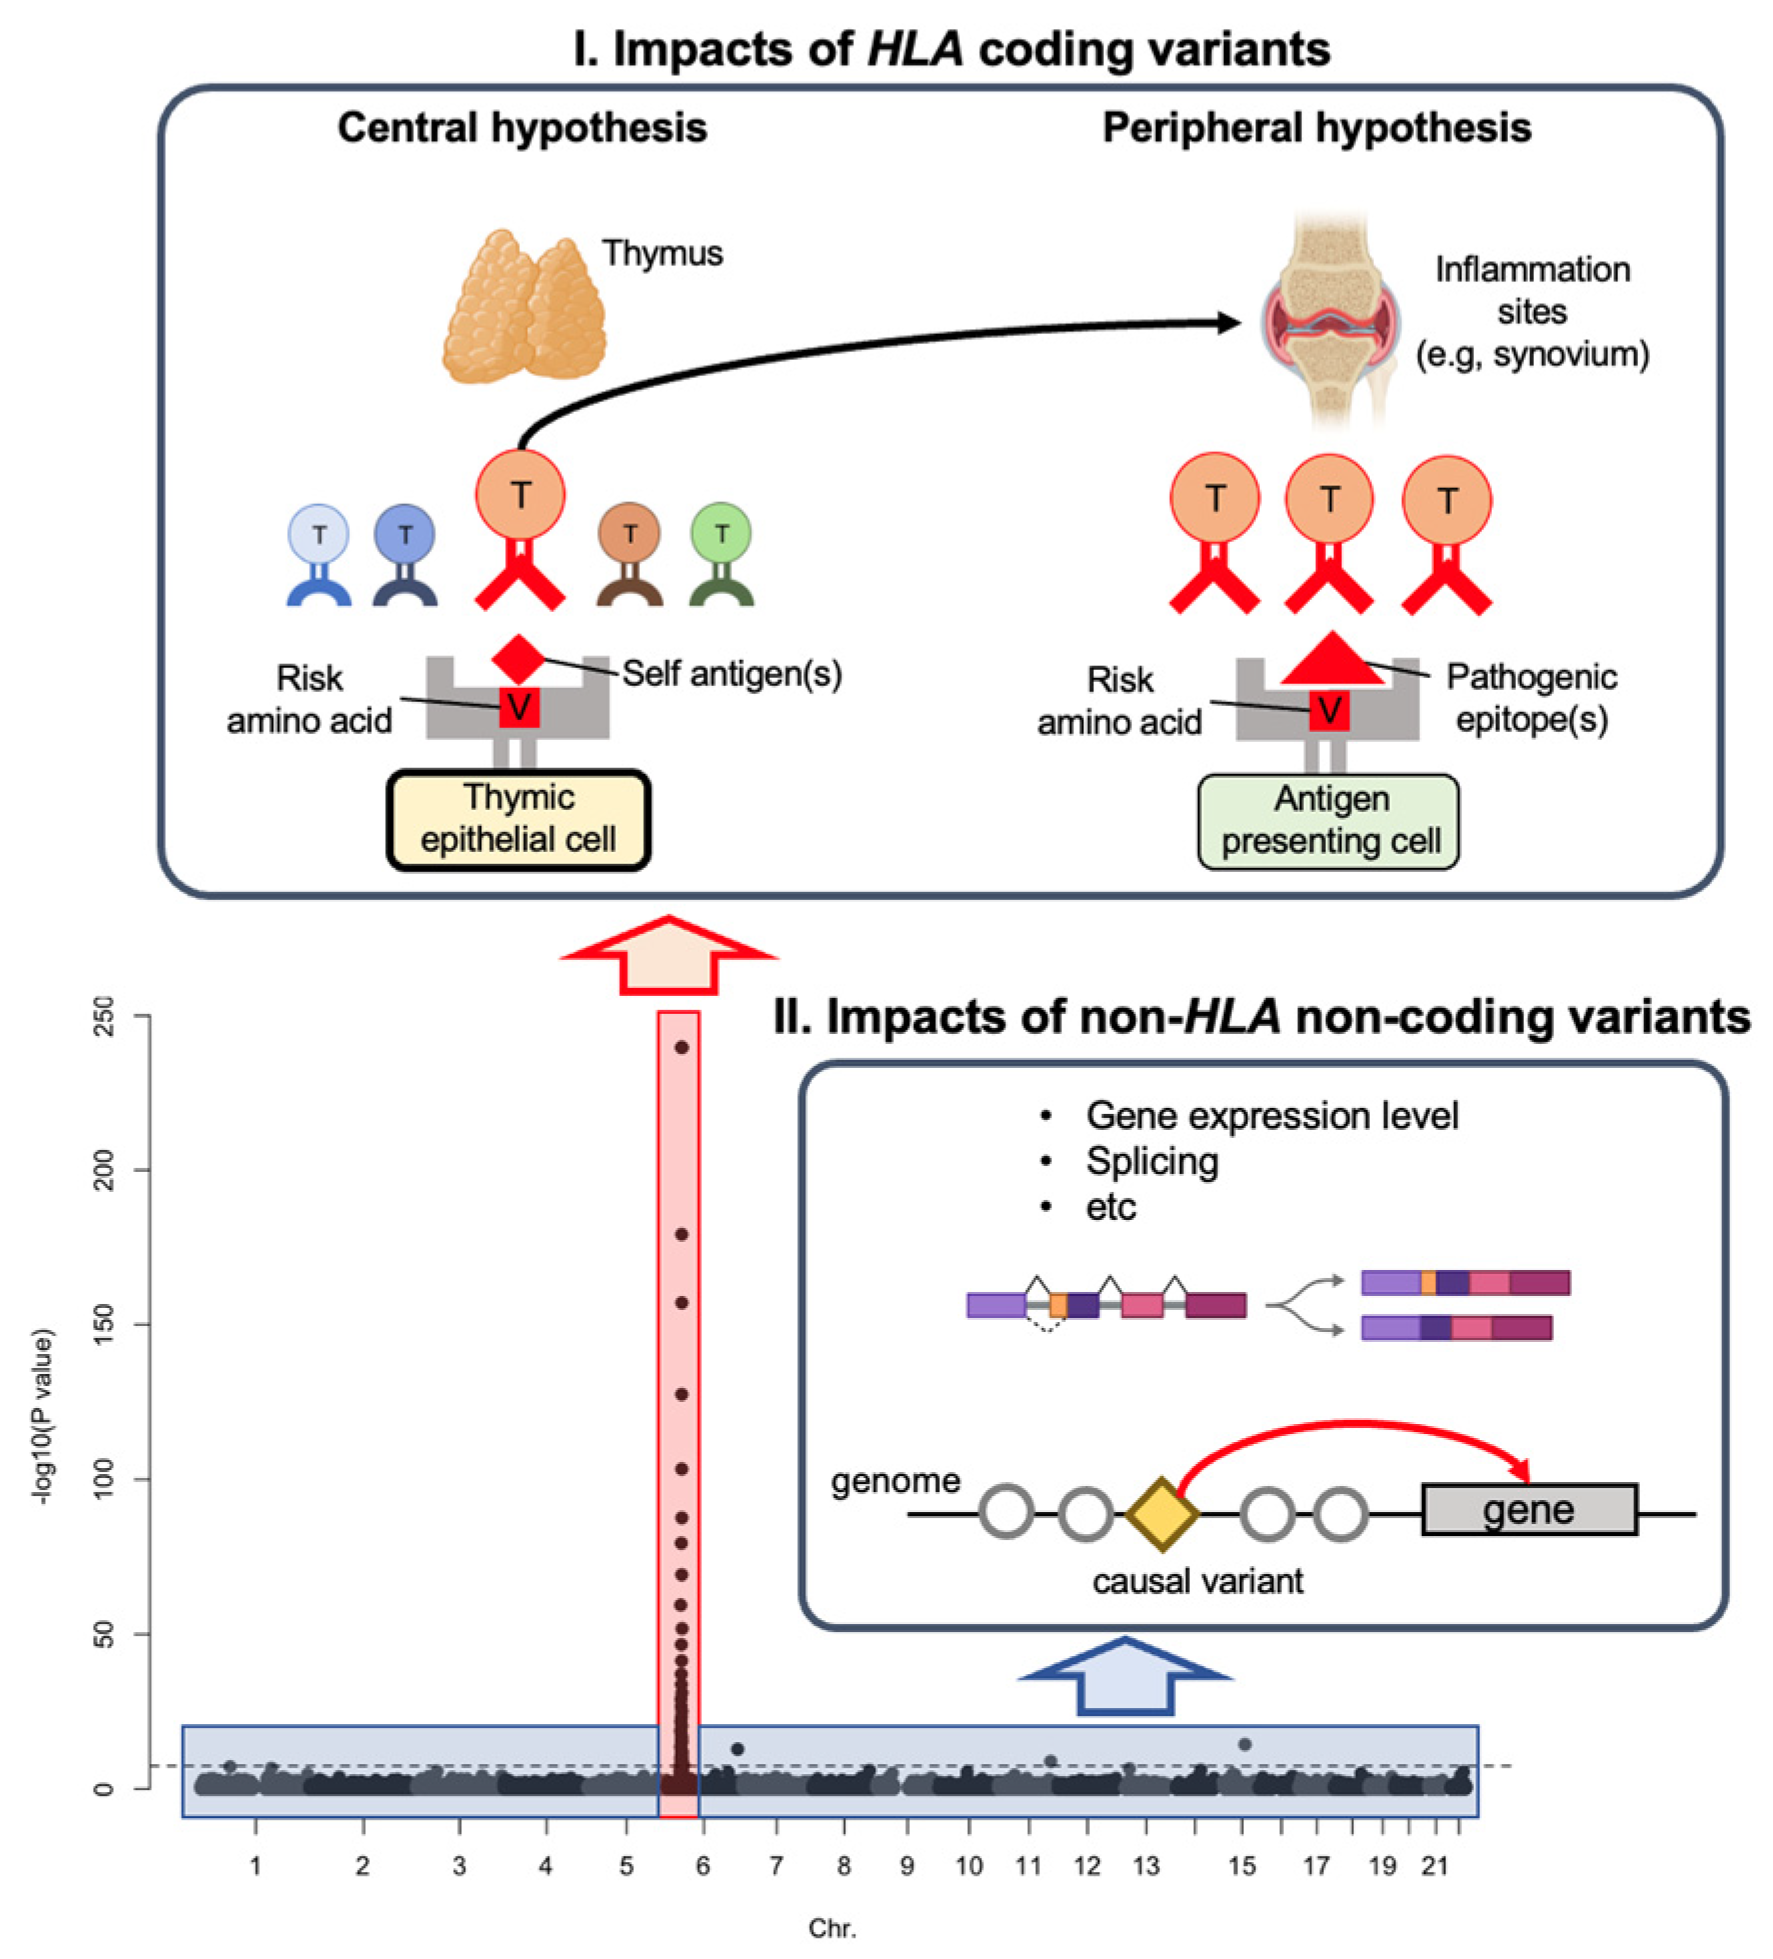
1.1. Genetic Risk by HLA Coding Variants
1.2. Genetic Risk by Non-HLA Non-Coding Variants

| Software | Year | Method | Annotation | Novel Isoform Detection | Features |
|---|---|---|---|---|---|
| LeafCutter [37] | 2018 | Event | Not required | Yes | Focused on the variation in “intron” splicing. Used in many sQTL studies. Computationally efficient and accurate at detecting splicing events. |
| DEXSeq [38] | 2012 | Event | Required | No | Focused on differentially used exons. |
| rMATS [39] | 2014 | Event | Required | Yes | Analyzes replicate RNA-seq data. Accounts for sampling uncertainty and variability. |
| SUPPA2 [40] | 2015 | Event | Required | No | High accuracy at low sequencing depth and short read length. |
| MAJIQ [41] | 2016 | Event | Required | Yes | Designed to detect “complex” splice variations (e.g., alternative splice site and intron retention) |
| Cufflinks [42] | 2012 | Isoform | Not required | Yes | Early-phase software developed in 2010. A transcriptome assembler (it can estimate novel isoform structures). A successor software (stringTie) has already been developed. |
| StringTie2 [43] | 2019 | Isoform | Not required | Yes | Capable of assembling both short and long reads. Higher accuracy for assembling complicated isoforms (those with many exons) than Cufflinks. |
| RSEM [44] | 2011 | Isoform | Required | No | Available for organisms lacking sequenced genomes. Computationally intensive. |
| Salmon [45] | 2017 | Isoform | Required | No | Fast quantification due to alignment-free quantification. Accounts for sample-specific bias. |
| Kallisto [46] | 2016 | Isoform | Required | No | Fast quantification due to alignment-free quantification. Pseudoaligns the reads to the reference avoiding alignment of individual bases. |
2. Discussion
Author Contributions
Funding
Informed Consent Statement
Data Availability Statement
Conflicts of Interest
References
- Ishigaki, K.; Sakaue, S.; Terao, C.; Luo, Y.; Sonehara, K.; Yamaguchi, K.; Amariuta, T.; Too, C.L.; Laufer, V.A.; Scott, I.C.; et al. Multi-Ancestry Genome-Wide Association Analyses Identify Novel Genetic Mechanisms in Rheumatoid Arthritis. Nat. Genet. 2022, 54, 1640–1651. [Google Scholar] [CrossRef]
- Okada, Y.; Wu, D.; Trynka, G.; Raj, T.; Terao, C.; Ikari, K.; Kochi, Y.; Ohmura, K.; Suzuki, A.; Yoshida, S.; et al. Genetics of Rheumatoid Arthritis Contributes to Biology and Drug Discovery. Nature 2014, 506, 376–381. [Google Scholar] [CrossRef] [PubMed]
- Bentham, J.; Morris, D.L.; Graham, D.S.C.; Pinder, C.L.; Tombleson, P.; Behrens, T.W.; Martín, J.; Fairfax, B.P.; Knight, J.C.; Chen, L.; et al. Genetic Association Analyses Implicate Aberrant Regulation of Innate and Adaptive Immunity Genes in the Pathogenesis of Systemic Lupus Erythematosus. Nat. Genet. 2015, 47, 1457–1464. [Google Scholar] [CrossRef] [PubMed]
- Langefeld, C.D.; Ainsworth, H.C.; Cunninghame Graham, D.S.; Kelly, J.A.; Comeau, M.E.; Marion, M.C.; Howard, T.D.; Ramos, P.S.; Croker, J.A.; Morris, D.L.; et al. Transancestral Mapping and Genetic Load in Systemic Lupus Erythematosus. Nat. Commun. 2017, 8, 16021. [Google Scholar] [CrossRef] [PubMed]
- Yin, X.; Kim, K.; Suetsugu, H.; Bang, S.-Y.; Wen, L.; Koido, M.; Ha, E.; Liu, L.; Sakamoto, Y.; Jo, S.; et al. Meta-Analysis of 208370 East Asians Identifies 113 Susceptibility Loci for Systemic Lupus Erythematosus. Ann. Rheum. Dis. 2021, 80, 632–640. [Google Scholar] [CrossRef] [PubMed]
- Okada, Y.; Kim, K.; Han, B.; Pillai, N.E.; Ong, R.T.-H.; Saw, W.-Y.; Luo, M.; Jiang, L.; Yin, J.; Bang, S.-Y.; et al. Risk for ACPA-Positive Rheumatoid Arthritis Is Driven by Shared HLA Amino Acid Polymorphisms in Asian and European Populations. Hum. Mol. Genet. 2014, 23, 6916–6926. [Google Scholar] [CrossRef] [PubMed]
- Han, B.; Diogo, D.; Eyre, S.; Kallberg, H.; Zhernakova, A.; Bowes, J.; Padyukov, L.; Okada, Y.; González-Gay, M.A.; Rantapää-Dahlqvist, S.; et al. Fine Mapping Seronegative and Seropositive Rheumatoid Arthritis to Shared and Distinct HLA Alleles by Adjusting for the Effects of Heterogeneity. Am. J. Hum. Genet. 2014, 94, 522–532. [Google Scholar] [CrossRef]
- Fries, J.F.; Wolfe, F.; Apple, R.; Erlich, H.; Bugawan, T.; Holmes, T.; Bruce, B. HLA-DRB1 Genotype Associations in 793 White Patients from a Rheumatoid Arthritis Inception Cohort: Frequency, Severity, and Treatment Bias. Arthritis Rheum. 2002, 46, 2320–2329. [Google Scholar] [CrossRef]
- de Vries, N.; Tijssen, H.; van Riel, P.L.C.M.; van de Putte, L.B.A. Reshaping the Shared Epitope Hypothesis: HLA-Associated Risk for Rheumatoid Arthritis Is Encoded by Amino Acid Substitutions at Positions 67-74 of the HLA-DRB1 Molecule. Arthritis Rheum. 2002, 46, 921–928. [Google Scholar] [CrossRef]
- Alcina, A.; Abad-Grau, M.D.M.; Fedetz, M.; Izquierdo, G.; Lucas, M.; Fernández, O.; Ndagire, D.; Catalá-Rabasa, A.; Ruiz, A.; Gayán, J.; et al. Multiple Sclerosis Risk Variant HLA-DRB1*1501 Associates with High Expression of DRB1 Gene in Different Human Populations. PLoS ONE 2012, 7, e29819. [Google Scholar] [CrossRef]
- Raychaudhuri, S.; Sandor, C.; Stahl, E.A.; Freudenberg, J.; Lee, H.-S.; Jia, X.; Alfredsson, L.; Padyukov, L.; Klareskog, L.; Worthington, J.; et al. Five Amino Acids in Three HLA Proteins Explain Most of the Association between MHC and Seropositive Rheumatoid Arthritis. Nat. Genet. 2012, 44, 291–296. [Google Scholar] [CrossRef] [PubMed]
- Hu, X.; Deutsch, A.J.; Lenz, T.L.; Onengut-Gumuscu, S.; Han, B.; Chen, W.-M.; Howson, J.M.M.; Todd, J.A.; de Bakker, P.I.W.; Rich, S.S.; et al. Additive and Interaction Effects at Three Amino Acid Positions in HLA-DQ and HLA-DR Molecules Drive Type 1 Diabetes Risk. Nat. Genet. 2015, 47, 898–905. [Google Scholar] [CrossRef] [PubMed]
- Ishigaki, K.; Lagattuta, K.A.; Luo, Y.; James, E.A.; Buckner, J.H.; Raychaudhuri, S. HLA Autoimmune Risk Alleles Restrict the Hypervariable Region of T Cell Receptors. Nat. Genet. 2022, 54, 393–402. [Google Scholar] [CrossRef]
- Acosta-Herrera, M.; Kerick, M.; González-Serna, D.; Myositis Genetics Consortium; Scleroderma Genetics Consortium; Wijmenga, C.; Franke, A.; Gregersen, P.K.; Padyukov, L.; Worthington, J.; et al. Genome-Wide Meta-Analysis Reveals Shared New Loci in Systemic Seropositive Rheumatic Diseases. Ann. Rheum. Dis. 2019, 78, 311–319. [Google Scholar] [CrossRef] [PubMed]
- Walsh, A.M.; Whitaker, J.W.; Huang, C.C.; Cherkas, Y.; Lamberth, S.L.; Brodmerkel, C.; Curran, M.E.; Dobrin, R. Integrative Genomic Deconvolution of Rheumatoid Arthritis GWAS Loci into Gene and Cell Type Associations. Genome Biol. 2016, 17, 79. [Google Scholar] [CrossRef]
- Aggarwal, R.; Liao, K.; Nair, R.; Ringold, S.; Costenbader, K.H. Anti-Citrullinated Peptide Antibody Assays and Their Role in the Diagnosis of Rheumatoid Arthritis. Arthritis Rheum. 2009, 61, 1472–1483. [Google Scholar] [CrossRef]
- Fox, B.J.; Hockley, J.; Rigsby, P.; Dolman, C.; Meroni, P.L.; Rönnelid, J. A WHO Reference Reagent for Lupus (Anti-DsDNA) Antibodies: International Collaborative Study to Evaluate a Candidate Preparation. Ann. Rheum. Dis. 2019, 78, 1677–1680. [Google Scholar] [CrossRef]
- Germain, R.N. T-Cell Development and the CD4-CD8 Lineage Decision. Nat. Rev. Immunol. 2002, 2, 309–322. [Google Scholar] [CrossRef]
- Rossjohn, J.; Gras, S.; Miles, J.J.; Turner, S.J.; Godfrey, D.I.; McCluskey, J. T Cell Antigen Receptor Recognition of Antigen-Presenting Molecules. Annu. Rev. Immunol. 2015, 33, 169–200. [Google Scholar] [CrossRef]
- Scally, S.W.; Petersen, J.; Law, S.C.; Dudek, N.L.; Nel, H.J.; Loh, K.L.; Wijeyewickrema, L.C.; Eckle, S.B.G.; van Heemst, J.; Pike, R.N.; et al. A Molecular Basis for the Association of the HLA-DRB1 Locus, Citrullination, and Rheumatoid Arthritis. J. Exp. Med. 2013, 210, 2569–2582. [Google Scholar] [CrossRef]
- Hill, J.A.; Southwood, S.; Sette, A.; Jevnikar, A.M.; Bell, D.A.; Cairns, E. Cutting Edge: The Conversion of Arginine to Citrulline Allows for a High-Affinity Peptide Interaction with the Rheumatoid Arthritis-Associated HLA-DRB1*0401 MHC Class II Molecule. J. Immunol. 2003, 171, 538–541. [Google Scholar] [CrossRef] [PubMed]
- Kwok, W.W.; Domeier, M.L.; Raymond, F.C.; Byers, P.; Nepom, G.T. Allele-Specific Motifs Characterize HLA-DQ Interactions with a Diabetes-Associated Peptide Derived from Glutamic Acid Decarboxylase. J. Immunol. 1996, 156, 2171–2177. [Google Scholar] [CrossRef]
- Jabri, B.; Sollid, L.M. T Cells in Celiac Disease. J. Immunol. 2017, 198, 3005–3014. [Google Scholar] [CrossRef] [PubMed]
- Emerson, R.O.; DeWitt, W.S.; Vignali, M.; Gravley, J.; Hu, J.K.; Osborne, E.J.; Desmarais, C.; Klinger, M.; Carlson, C.S.; Hansen, J.A.; et al. Immunosequencing Identifies Signatures of Cytomegalovirus Exposure History and HLA-Mediated Effects on the T Cell Repertoire. Nat. Genet. 2017, 49, 659–665. [Google Scholar] [CrossRef] [PubMed]
- Dash, P.; Fiore-Gartland, A.J.; Hertz, T.; Wang, G.C.; Sharma, S.; Souquette, A.; Crawford, J.C.; Clemens, E.B.; Nguyen, T.H.O.; Kedzierska, K.; et al. Quantifiable Predictive Features Define Epitope-Specific T Cell Receptor Repertoires. Nature 2017, 547, 89–93. [Google Scholar] [CrossRef] [PubMed]
- O’Connor, L.J.; Schoech, A.P.; Hormozdiari, F.; Gazal, S.; Patterson, N.; Price, A.L. Extreme Polygenicity of Complex Traits Is Explained by Negative Selection. Am. J. Hum. Genet. 2019, 105, 456–476. [Google Scholar] [CrossRef]
- Ishigaki, K.; Akiyama, M.; Kanai, M.; Takahashi, A.; Kawakami, E.; Sugishita, H.; Sakaue, S.; Matoba, N.; Low, S.-K.; Okada, Y.; et al. Large-Scale Genome-Wide Association Study in a Japanese Population Identifies Novel Susceptibility Loci across Different Diseases. Nat. Genet. 2020, 52, 669–679. [Google Scholar] [CrossRef] [PubMed]
- Trynka, G.; Sandor, C.; Han, B.; Xu, H.; Stranger, B.E.; Liu, X.S.; Raychaudhuri, S. Chromatin Marks Identify Critical Cell Types for Fine Mapping Complex Trait Variants. Nat. Genet. 2013, 45, 124–130. [Google Scholar] [CrossRef] [PubMed]
- De Jager, P.L.; Hacohen, N.; Mathis, D.; Regev, A.; Stranger, B.E.; Benoist, C. ImmVar Project: Insights and Design Considerations for Future Studies of “Healthy” Immune Variation. Semin. Immunol. 2015, 27, 51–57. [Google Scholar] [CrossRef]
- Raj, T.; Rothamel, K.; Mostafavi, S.; Ye, C.; Lee, M.N.; Replogle, J.M.; Feng, T.; Lee, M.; Asinovski, N.; Frohlich, I.; et al. Polarization of the Effects of Autoimmune and Neurodegenerative Risk Alleles in Leukocytes. Science 2014, 344, 519–523. [Google Scholar] [CrossRef] [PubMed]
- Ishigaki, K.; Kochi, Y.; Suzuki, A.; Tsuchida, Y.; Tsuchiya, H.; Sumitomo, S.; Yamaguchi, K.; Nagafuchi, Y.; Nakachi, S.; Kato, R.; et al. Polygenic Burdens on Cell-Specific Pathways Underlie the Risk of Rheumatoid Arthritis. Nat. Genet. 2017, 49, 1120–1125. [Google Scholar] [CrossRef]
- Schmiedel, B.J.; Singh, D.; Madrigal, A.; Valdovino-Gonzalez, A.G.; White, B.M.; Zapardiel-Gonzalo, J.; Ha, B.; Altay, G.; Greenbaum, J.A.; McVicker, G.; et al. Impact of Genetic Polymorphisms on Human Immune Cell Gene Expression. Cell 2018, 175, 1701–1715. [Google Scholar] [CrossRef] [PubMed]
- Ota, M.; Nagafuchi, Y.; Hatano, H.; Ishigaki, K.; Terao, C.; Takeshima, Y.; Yanaoka, H.; Kobayashi, S.; Okubo, M.; Shirai, H.; et al. Dynamic Landscape of Immune Cell-Specific Gene Regulation in Immune-Mediated Diseases. Cell 2021, 184, 3006–3021. [Google Scholar] [CrossRef]
- Perez, R.K.; Gordon, M.G.; Subramaniam, M.; Kim, M.C.; Hartoularos, G.C.; Targ, S.; Sun, Y.; Ogorodnikov, A.; Bueno, R.; Lu, A.; et al. Single-Cell RNA-Seq Reveals Cell Type-Specific Molecular and Genetic Associations to Lupus. Science 2022, 376, eabf1970. [Google Scholar] [CrossRef] [PubMed]
- Nathan, A.; Asgari, S.; Ishigaki, K.; Valencia, C.; Amariuta, T.; Luo, Y.; Beynor, J.I.; Baglaenko, Y.; Suliman, S.; Price, A.L.; et al. Single-Cell EQTL Models Reveal Dynamic T Cell State Dependence of Disease Loci. Nature 2022, 606, 120–128. [Google Scholar] [CrossRef] [PubMed]
- Piovesan, A.; Antonaros, F.; Vitale, L.; Strippoli, P.; Pelleri, M.C.; Caracausi, M. Human Protein-Coding Genes and Gene Feature Statistics in 2019. BMC Res. Notes 2019, 12, 315. [Google Scholar] [CrossRef] [PubMed]
- Li, Y.I.; Knowles, D.A.; Humphrey, J.; Barbeira, A.N.; Dickinson, S.P.; Im, H.K.; Pritchard, J.K. Annotation-Free Quantification of RNA Splicing Using LeafCutter. Nat. Genet. 2018, 50, 151–158. [Google Scholar] [CrossRef] [PubMed]
- Anders, S.; Reyes, A.; Huber, W. Detecting Differential Usage of Exons from RNA-Seq Data. Genome Res. 2012, 22, 2008–2017. [Google Scholar] [CrossRef]
- Shen, S.; Park, J.W.; Lu, Z.-X.; Lin, L.; Henry, M.D.; Wu, Y.N.; Zhou, Q.; Xing, Y. RMATS: Robust and Flexible Detection of Differential Alternative Splicing from Replicate RNA-Seq Data. Proc. Natl. Acad. Sci. USA 2014, 111, E5593-601. [Google Scholar] [CrossRef]
- Trincado, J.L.; Entizne, J.C.; Hysenaj, G.; Singh, B.; Skalic, M.; Elliott, D.J.; Eyras, E. SUPPA2: Fast, Accurate, and Uncertainty-Aware Differential Splicing Analysis across Multiple Conditions. Genome Biol. 2018, 19, 40. [Google Scholar] [CrossRef]
- Vaquero-Garcia, J.; Barrera, A.; Gazzara, M.R.; González-Vallinas, J.; Lahens, N.F.; Hogenesch, J.B.; Lynch, K.W.; Barash, Y. A New View of Transcriptome Complexity and Regulation through the Lens of Local Splicing Variations. Elife 2016, 5, e11752. [Google Scholar] [CrossRef] [PubMed]
- Trapnell, C.; Roberts, A.; Goff, L.; Pertea, G.; Kim, D.; Kelley, D.R.; Pimentel, H.; Salzberg, S.L.; Rinn, J.L.; Pachter, L. Differential Gene and Transcript Expression Analysis of RNA-Seq Experiments with TopHat and Cufflinks. Nat. Protoc. 2012, 7, 562–578. [Google Scholar] [CrossRef] [PubMed]
- Kovaka, S.; Zimin, A.V.; Pertea, G.M.; Razaghi, R.; Salzberg, S.L.; Pertea, M. Transcriptome Assembly from Long-Read RNA-Seq Alignments with StringTie2. Genome Biol. 2019, 20, 278. [Google Scholar] [CrossRef] [PubMed]
- Li, B.; Dewey, C.N. RSEM: Accurate Transcript Quantification from RNA-Seq Data with or without a Reference Genome. BMC Bioinformatics 2011, 12, 323. [Google Scholar] [CrossRef] [PubMed]
- Patro, R.; Duggal, G.; Love, M.I.; Irizarry, R.A.; Kingsford, C. Salmon Provides Fast and Bias-Aware Quantification of Transcript Expression. Nat. Methods 2017, 14, 417–419. [Google Scholar] [CrossRef] [PubMed]
- Bray, N.L.; Pimentel, H.; Melsted, P.; Pachter, L. Near-Optimal Probabilistic RNA-Seq Quantification. Nat. Biotechnol. 2016, 34, 525–527. [Google Scholar] [CrossRef]
- Castaldi, P.J.; Abood, A.; Farber, C.R.; Sheynkman, G.M. Bridging the Splicing Gap in Human Genetics with Long-Read RNA Sequencing: Finding the Protein Isoform Drivers of Disease. Hum. Mol. Genet. 2022, 31, R123–R136. [Google Scholar] [CrossRef]
- Frankish, A.; Diekhans, M.; Jungreis, I.; Lagarde, J.; Loveland, J.E.; Mudge, J.M.; Sisu, C.; Wright, J.C.; Armstrong, J.; Barnes, I.; et al. GENCODE 2021. Nucleic Acids Res. 2021, 49, D916–D923. [Google Scholar] [CrossRef]
- Yamaguchi, K.; Ishigaki, K.; Suzuki, A.; Tsuchida, Y.; Tsuchiya, H.; Sumitomo, S.; Nagafuchi, Y.; Miya, F.; Tsunoda, T.; Shoda, H.; et al. Splicing QTL Analysis Focusing on Coding Sequences Reveals Mechanisms for Disease Susceptibility Loci. Nat. Commun. 2022, 13, 4659. [Google Scholar] [CrossRef]
- Steijger, T.; Abril, J.F.; Engström, P.G.; Kokocinski, F.; RGASP Consortium; Hubbard, T.J.; Guigó, R.; Harrow, J.; Bertone, P. Assessment of Transcript Reconstruction Methods for RNA-Seq. Nat. Methods 2013, 10, 1177–1184. [Google Scholar] [CrossRef]
- Amarasinghe, S.L.; Su, S.; Dong, X.; Zappia, L.; Ritchie, M.E.; Gouil, Q. Opportunities and Challenges in Long-Read Sequencing Data Analysis. Genome Biol. 2020, 21, 30. [Google Scholar] [CrossRef]
- GTEx Consortium the GTEx Consortium Atlas of Genetic Regulatory Effects across Human Tissues. Science 2020, 369, 1318–1330. [CrossRef]
- Chun, S.; Casparino, A.; Patsopoulos, N.A.; Croteau-Chonka, D.C.; Raby, B.A.; De Jager, P.L.; Sunyaev, S.R.; Cotsapas, C. Limited Statistical Evidence for Shared Genetic Effects of EQTLs and Autoimmune-Disease-Associated Loci in Three Major Immune-Cell Types. Nat. Genet. 2017, 49, 600–605. [Google Scholar] [CrossRef] [PubMed]
- Qi, T.; Wu, Y.; Fang, H.; Zhang, F.; Liu, S.; Zeng, J.; Yang, J. Genetic Control of RNA Splicing and Its Distinct Role in Complex Trait Variation. Nat. Genet. 2022, 54, 1355–1363. [Google Scholar] [CrossRef]
- Yao, D.W.; O’Connor, L.J.; Price, A.L.; Gusev, A. Quantifying Genetic Effects on Disease Mediated by Assayed Gene Expression Levels. Nat. Genet. 2020, 52, 626–633. [Google Scholar] [CrossRef] [PubMed]
- Li, Q.; Gloudemans, M.J.; Geisinger, J.M.; Fan, B.; Aguet, F.; Sun, T.; Ramaswami, G.; Li, Y.I.; Ma, J.-B.; Pritchard, J.K.; et al. RNA Editing Underlies Genetic Risk of Common Inflammatory Diseases. Nature 2022, 608, 569–577. [Google Scholar] [CrossRef]
- Zhou, J.; Troyanskaya, O.G. Predicting Effects of Noncoding Variants with Deep Learning-Based Sequence Model. Nat. Methods 2015, 12, 931–934. [Google Scholar] [CrossRef]
- Zhou, J.; Theesfeld, C.L.; Yao, K.; Chen, K.M.; Wong, A.K.; Troyanskaya, O.G. Deep Learning Sequence-Based Ab Initio Prediction of Variant Effects on Expression and Disease Risk. Nat. Genet. 2018, 50, 1171–1179. [Google Scholar] [CrossRef] [PubMed]


Disclaimer/Publisher’s Note: The statements, opinions and data contained in all publications are solely those of the individual author(s) and contributor(s) and not of MDPI and/or the editor(s). MDPI and/or the editor(s) disclaim responsibility for any injury to people or property resulting from any ideas, methods, instructions or products referred to in the content. |
© 2023 by the authors. Licensee MDPI, Basel, Switzerland. This article is an open access article distributed under the terms and conditions of the Creative Commons Attribution (CC BY) license (https://creativecommons.org/licenses/by/4.0/).
Share and Cite
Hatano, H.; Ishigaki, K. Functional Genetics to Understand the Etiology of Autoimmunity. Genes 2023, 14, 572. https://doi.org/10.3390/genes14030572
Hatano H, Ishigaki K. Functional Genetics to Understand the Etiology of Autoimmunity. Genes. 2023; 14(3):572. https://doi.org/10.3390/genes14030572
Chicago/Turabian StyleHatano, Hiroaki, and Kazuyoshi Ishigaki. 2023. "Functional Genetics to Understand the Etiology of Autoimmunity" Genes 14, no. 3: 572. https://doi.org/10.3390/genes14030572
APA StyleHatano, H., & Ishigaki, K. (2023). Functional Genetics to Understand the Etiology of Autoimmunity. Genes, 14(3), 572. https://doi.org/10.3390/genes14030572